Natural Bridge, AL
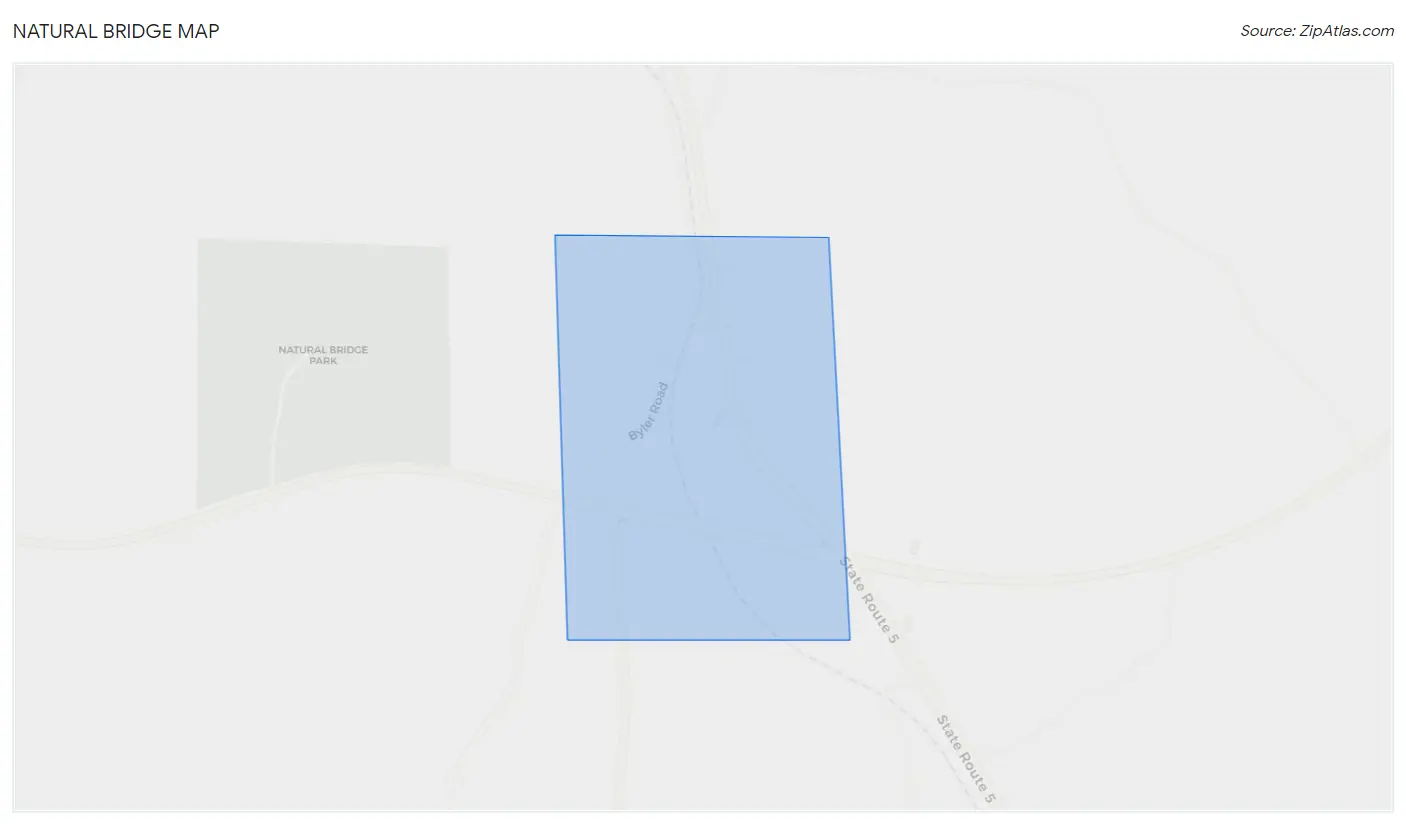
Natural Bridge Map
Natural Bridge Overview
21
TOTAL POPULATION
11
MALE POPULATION
10
FEMALE POPULATION
110.00
MALES / 100 FEMALES
90.91
FEMALES / 100 MALES
55.9
MEDIAN AGE
1.9
AVG FAMILY SIZE
1.9
AVG HOUSEHOLD SIZE
$46,233
PER CAPITA INCOME
$108,750
AVG FAMILY INCOME
$108,750
AVG HOUSEHOLD INCOME
0.22
INEQUALITY / GINI INDEX
15
LABOR FORCE [ PEOPLE ]
71.4%
PERCENT IN LABOR FORCE
Natural Bridge Zip Codes
Race in Natural Bridge
The most populous races in Natural Bridge are White / Caucasian (16 | 76.2%), and Two or more Races (5 | 23.8%).
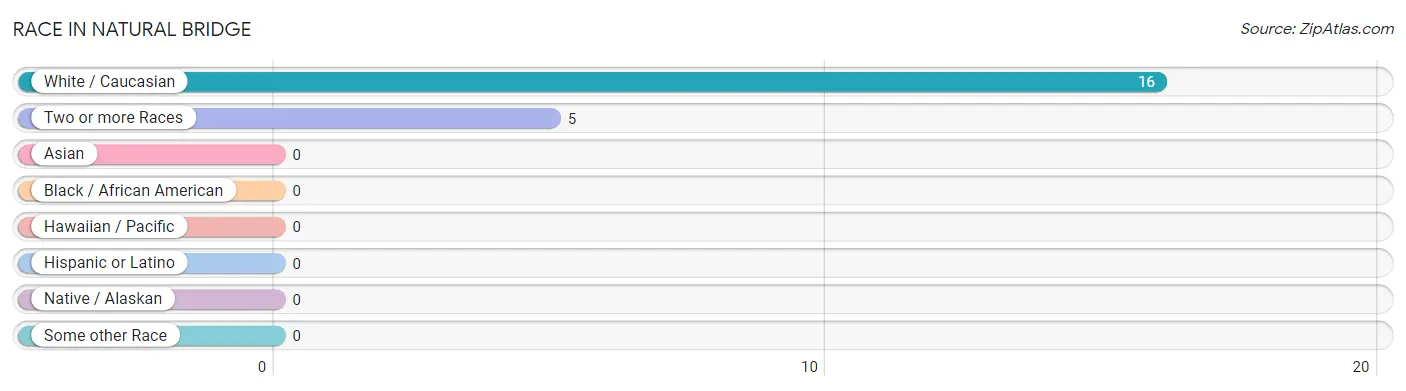
| Race | # Population | % Population |
| Asian | 0 | 0.0% |
| Black / African American | 0 | 0.0% |
| Hawaiian / Pacific | 0 | 0.0% |
| Hispanic or Latino | 0 | 0.0% |
| Native / Alaskan | 0 | 0.0% |
| White / Caucasian | 16 | 76.2% |
| Two or more Races | 5 | 23.8% |
| Some other Race | 0 | 0.0% |
| Total | 21 | 100.0% |
Ancestry in Natural Bridge
The most populous ancestries reported in Natural Bridge are Scotch-Irish (4 | 19.1%), Irish (3 | 14.3%), Celtic (2 | 9.5%), European (2 | 9.5%), and Cherokee (1 | 4.8%), together accounting for 57.1% of all Natural Bridge residents.
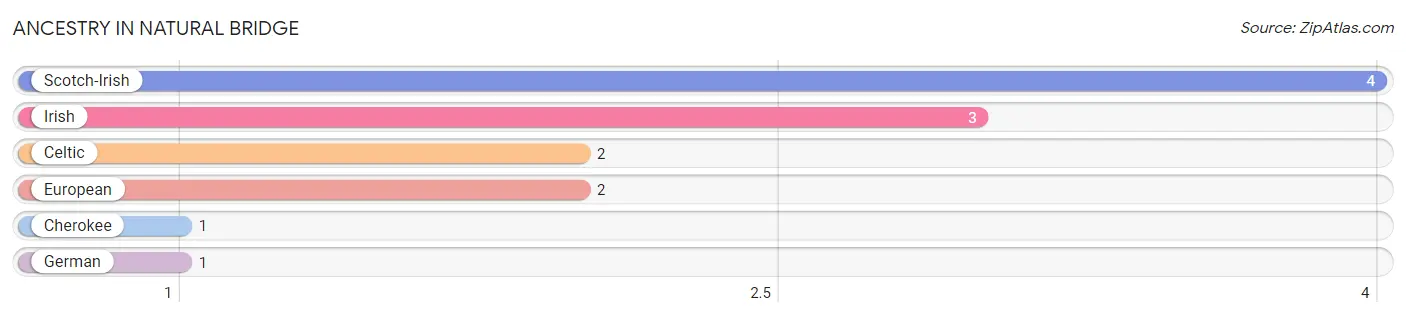
| Ancestry | # Population | % Population |
| Celtic | 2 | 9.5% |
| Cherokee | 1 | 4.8% |
| European | 2 | 9.5% |
| German | 1 | 4.8% |
| Irish | 3 | 14.3% |
| Scotch-Irish | 4 | 19.1% | View All 6 Rows |
Immigrants in Natural Bridge

| Immigration Origin | # Population | % Population | View All 0 Rows |
Sex and Age in Natural Bridge
Sex and Age in Natural Bridge
The most populous age groups in Natural Bridge are 55 to 59 Years (6 | 54.5%) for men and 55 to 59 Years (4 | 40.0%) for women.
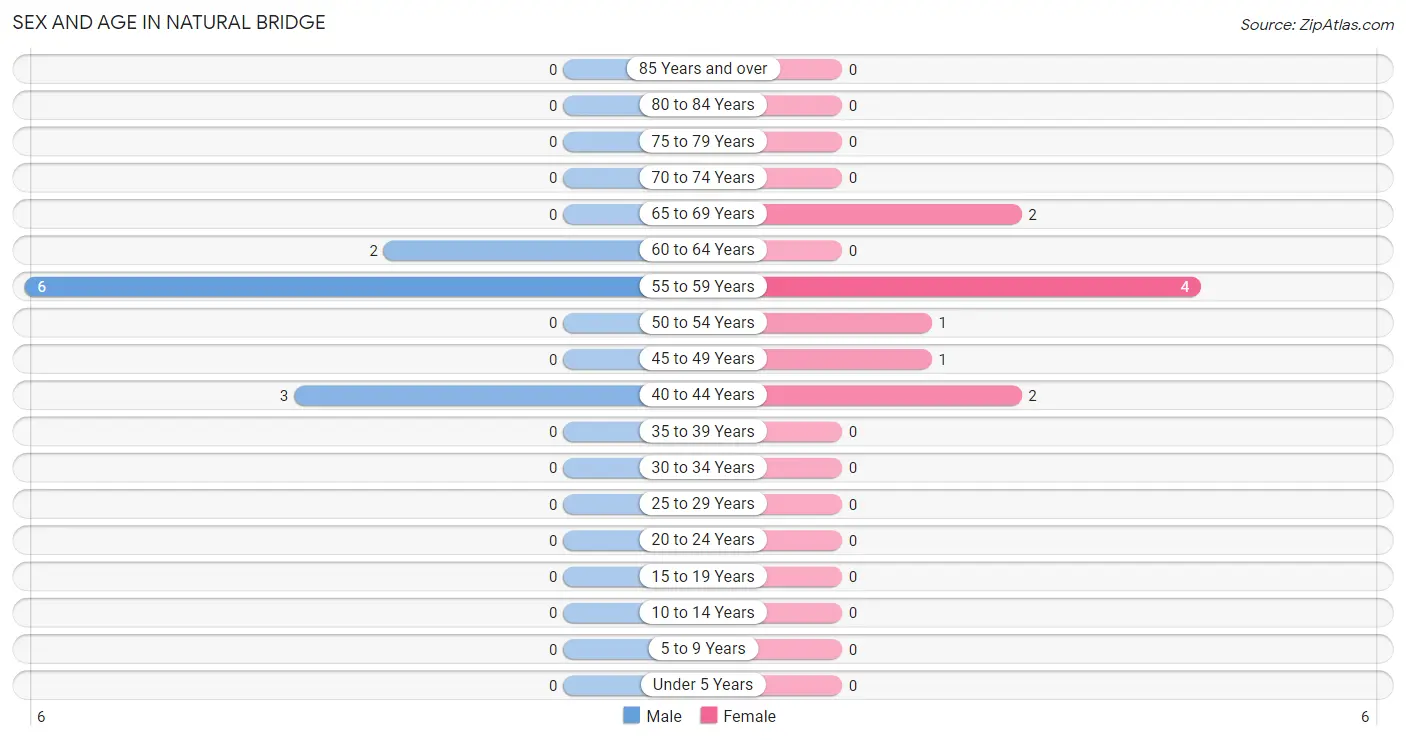
| Age Bracket | Male | Female |
| Under 5 Years | 0 (0.0%) | 0 (0.0%) |
| 5 to 9 Years | 0 (0.0%) | 0 (0.0%) |
| 10 to 14 Years | 0 (0.0%) | 0 (0.0%) |
| 15 to 19 Years | 0 (0.0%) | 0 (0.0%) |
| 20 to 24 Years | 0 (0.0%) | 0 (0.0%) |
| 25 to 29 Years | 0 (0.0%) | 0 (0.0%) |
| 30 to 34 Years | 0 (0.0%) | 0 (0.0%) |
| 35 to 39 Years | 0 (0.0%) | 0 (0.0%) |
| 40 to 44 Years | 3 (27.3%) | 2 (20.0%) |
| 45 to 49 Years | 0 (0.0%) | 1 (10.0%) |
| 50 to 54 Years | 0 (0.0%) | 1 (10.0%) |
| 55 to 59 Years | 6 (54.5%) | 4 (40.0%) |
| 60 to 64 Years | 2 (18.2%) | 0 (0.0%) |
| 65 to 69 Years | 0 (0.0%) | 2 (20.0%) |
| 70 to 74 Years | 0 (0.0%) | 0 (0.0%) |
| 75 to 79 Years | 0 (0.0%) | 0 (0.0%) |
| 80 to 84 Years | 0 (0.0%) | 0 (0.0%) |
| 85 Years and over | 0 (0.0%) | 0 (0.0%) |
| Total | 11 (100.0%) | 10 (100.0%) |
Families and Households in Natural Bridge
Median Family Size in Natural Bridge
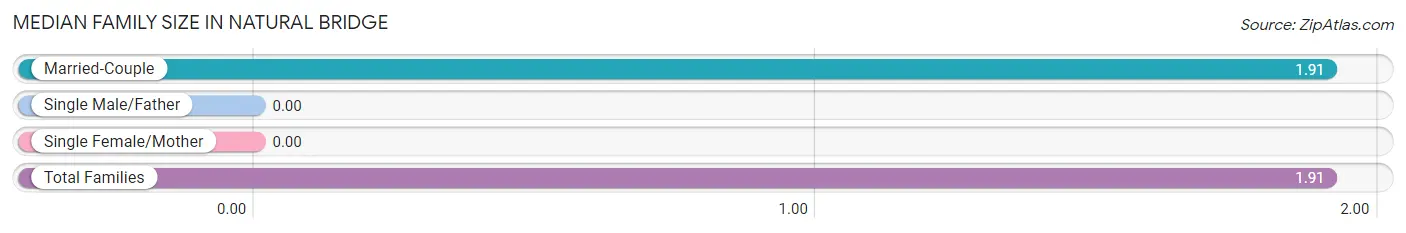
| Family Type | # Families | Family Size |
| Married-Couple | 11 (100.0%) | 1.91 |
| Single Male/Father | 0 (0.0%) | - |
| Single Female/Mother | 0 (0.0%) | - |
| Total Families | 11 (100.0%) | 1.91 |
Median Household Size in Natural Bridge
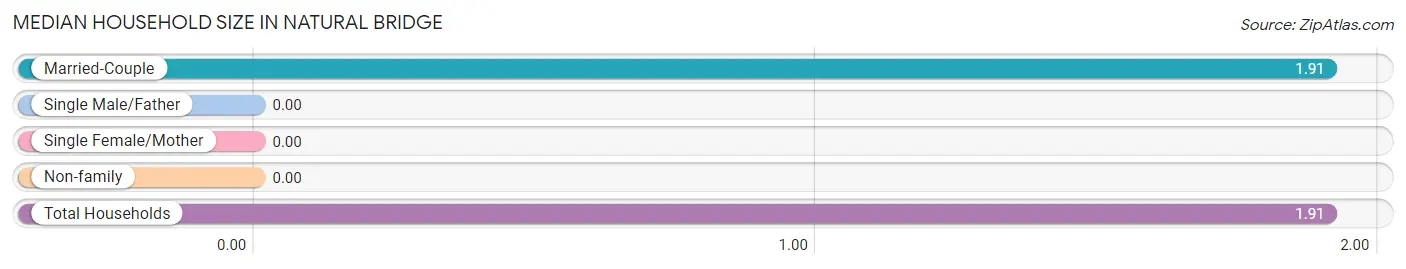
| Household Type | # Households | Household Size |
| Married-Couple | 11 (100.0%) | 1.91 |
| Single Male/Father | 0 (0.0%) | - |
| Single Female/Mother | 0 (0.0%) | - |
| Non-family | 0 (0.0%) | - |
| Total Households | 11 (100.0%) | 1.91 |
Household Size by Marriage Status in Natural Bridge
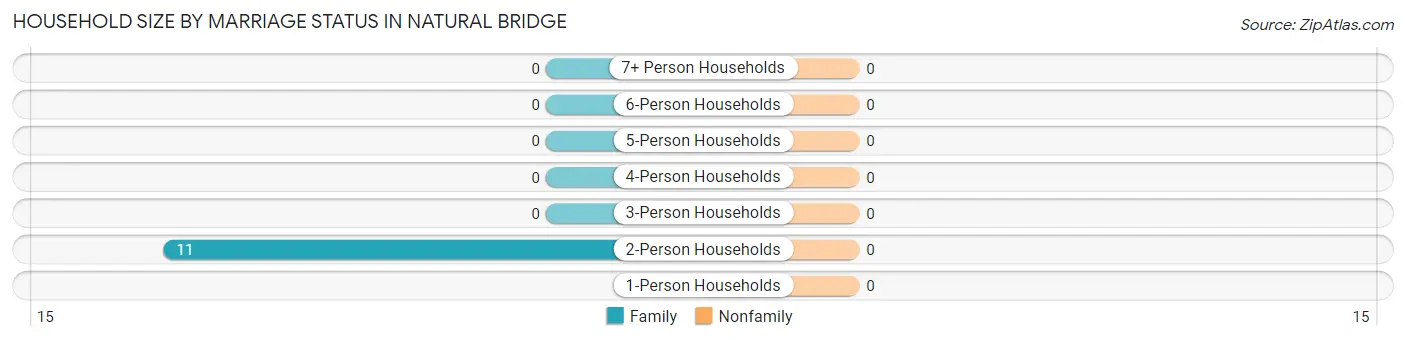
| Household Size | Family Households | Nonfamily Households |
| 1-Person Households | - | 0 (0.0%) |
| 2-Person Households | 11 (100.0%) | 0 (0.0%) |
| 3-Person Households | 0 (0.0%) | 0 (0.0%) |
| 4-Person Households | 0 (0.0%) | 0 (0.0%) |
| 5-Person Households | 0 (0.0%) | 0 (0.0%) |
| 6-Person Households | 0 (0.0%) | 0 (0.0%) |
| 7+ Person Households | 0 (0.0%) | 0 (0.0%) |
| Total | 11 (100.0%) | 0 (0.0%) |
Female Fertility in Natural Bridge
Fertility by Age in Natural Bridge
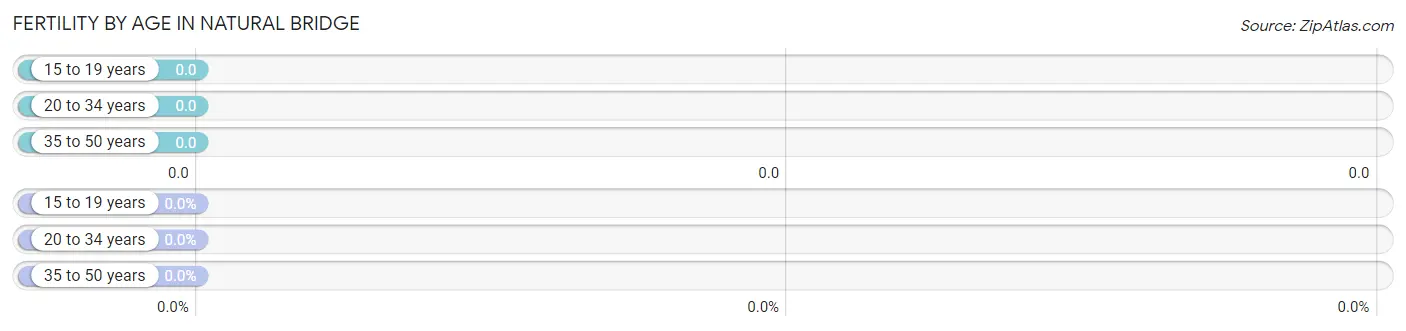
| Age Bracket | Women with Births | Births / 1,000 Women |
| 15 to 19 years | 0 (0.0%) | 0.0 |
| 20 to 34 years | 0 (0.0%) | 0.0 |
| 35 to 50 years | 0 (0.0%) | 0.0 |
| Total | 0 (0.0%) | 0.0 |
Fertility by Age by Marriage Status in Natural Bridge
| Age Bracket | Married | Unmarried |
| 15 to 19 years | 0 (0.0%) | 0 (0.0%) |
| 20 to 34 years | 0 (0.0%) | 0 (0.0%) |
| 35 to 50 years | 0 (0.0%) | 0 (0.0%) |
| Total | 0 (0.0%) | 0 (0.0%) |
Fertility by Education in Natural Bridge
| Educational Attainment | Women with Births | Births / 1,000 Women |
| Less than High School | 0 (0.0%) | 0.0 |
| High School Diploma | 0 (0.0%) | 0.0 |
| College or Associate's Degree | 0 (0.0%) | 0.0 |
| Bachelor's Degree | 0 (0.0%) | 0.0 |
| Graduate Degree | 0 (0.0%) | 0.0 |
| Total | 0 (0.0%) | 0.0 |
Fertility by Education by Marriage Status in Natural Bridge
| Educational Attainment | Married | Unmarried |
| Less than High School | 0 (0.0%) | 0 (0.0%) |
| High School Diploma | 0 (0.0%) | 0 (0.0%) |
| College or Associate's Degree | 0 (0.0%) | 0 (0.0%) |
| Bachelor's Degree | 0 (0.0%) | 0 (0.0%) |
| Graduate Degree | 0 (0.0%) | 0 (0.0%) |
| Total | 0 (0.0%) | 0 (0.0%) |
Income in Natural Bridge
Income Overview in Natural Bridge
Per Capita Income in Natural Bridge is $46,233, while median incomes of families and households are $108,750 and $108,750 respectively.
| Characteristic | Number | Measure |
| Per Capita Income | 21 | $46,233 |
| Median Family Income | 11 | $108,750 |
| Mean Family Income | 11 | $92,264 |
| Median Household Income | 11 | $108,750 |
| Mean Household Income | 11 | $92,264 |
| Income Deficit | 11 | $0 |
| Wage / Income Gap (%) | 21 | 0.00% |
| Wage / Income Gap ($) | 21 | 100.00¢ per $1 |
| Gini / Inequality Index | 21 | 0.22 |
Earnings by Sex in Natural Bridge
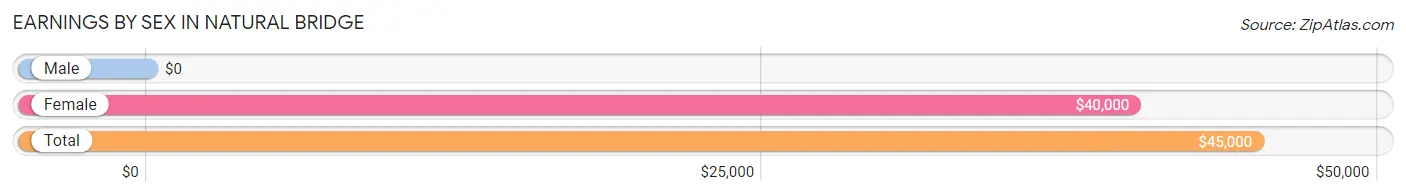
| Sex | Number | Average Earnings |
| Male | 8 (50.0%) | $0 |
| Female | 8 (50.0%) | $40,000 |
| Total | 16 (100.0%) | $45,000 |
Earnings by Sex by Income Bracket in Natural Bridge
The most common earnings brackets in Natural Bridge are $45,000 to $49,999 for men (5 | 62.5%) and $40,000 to $44,999 for women (4 | 50.0%).
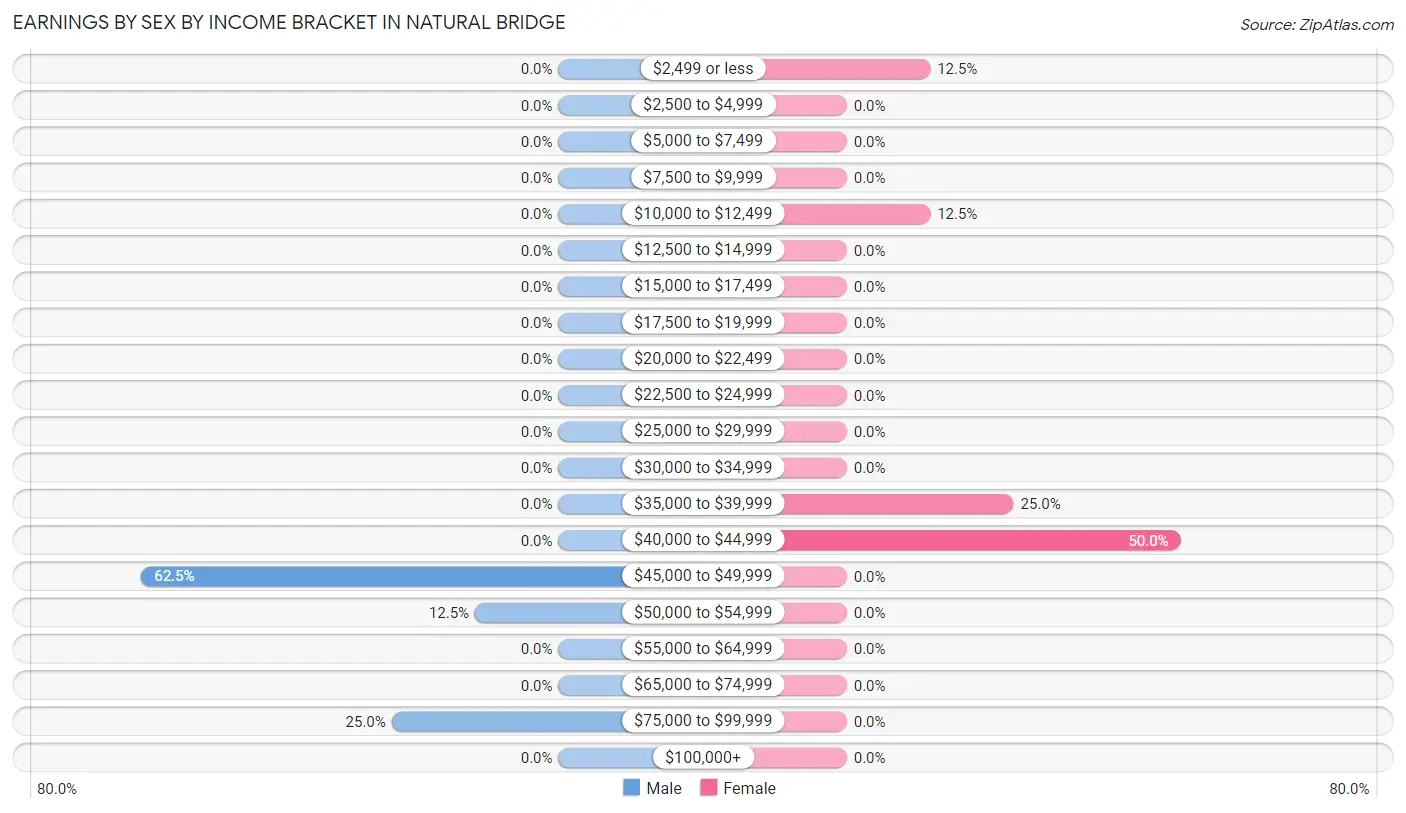
| Income | Male | Female |
| $2,499 or less | 0 (0.0%) | 1 (12.5%) |
| $2,500 to $4,999 | 0 (0.0%) | 0 (0.0%) |
| $5,000 to $7,499 | 0 (0.0%) | 0 (0.0%) |
| $7,500 to $9,999 | 0 (0.0%) | 0 (0.0%) |
| $10,000 to $12,499 | 0 (0.0%) | 1 (12.5%) |
| $12,500 to $14,999 | 0 (0.0%) | 0 (0.0%) |
| $15,000 to $17,499 | 0 (0.0%) | 0 (0.0%) |
| $17,500 to $19,999 | 0 (0.0%) | 0 (0.0%) |
| $20,000 to $22,499 | 0 (0.0%) | 0 (0.0%) |
| $22,500 to $24,999 | 0 (0.0%) | 0 (0.0%) |
| $25,000 to $29,999 | 0 (0.0%) | 0 (0.0%) |
| $30,000 to $34,999 | 0 (0.0%) | 0 (0.0%) |
| $35,000 to $39,999 | 0 (0.0%) | 2 (25.0%) |
| $40,000 to $44,999 | 0 (0.0%) | 4 (50.0%) |
| $45,000 to $49,999 | 5 (62.5%) | 0 (0.0%) |
| $50,000 to $54,999 | 1 (12.5%) | 0 (0.0%) |
| $55,000 to $64,999 | 0 (0.0%) | 0 (0.0%) |
| $65,000 to $74,999 | 0 (0.0%) | 0 (0.0%) |
| $75,000 to $99,999 | 2 (25.0%) | 0 (0.0%) |
| $100,000+ | 0 (0.0%) | 0 (0.0%) |
| Total | 8 (100.0%) | 8 (100.0%) |
Earnings by Sex by Educational Attainment in Natural Bridge
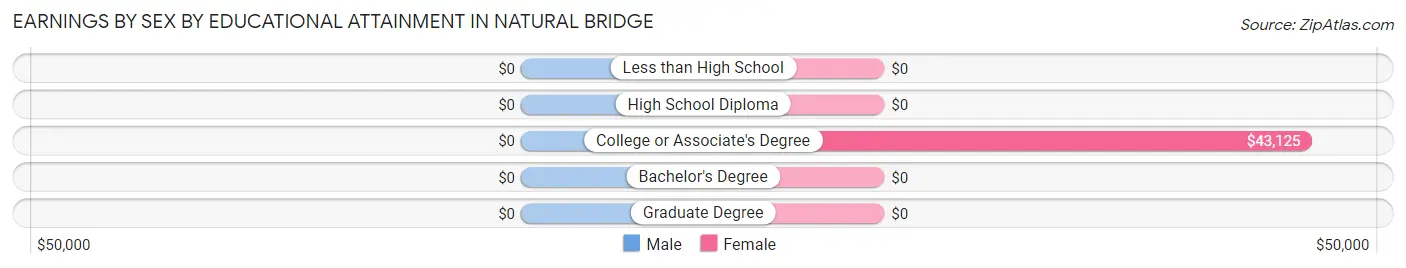
| Educational Attainment | Male Income | Female Income |
| Less than High School | - | - |
| High School Diploma | - | - |
| College or Associate's Degree | - | - |
| Bachelor's Degree | - | - |
| Graduate Degree | - | - |
| Total | - | - |
Family Income in Natural Bridge
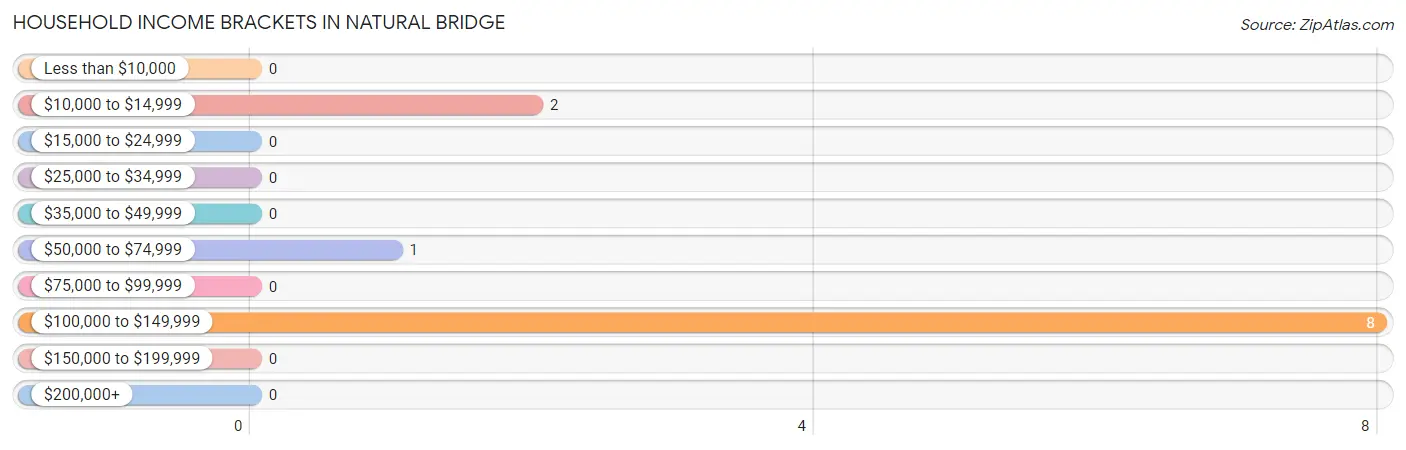
Family Income Brackets in Natural Bridge
According to the Natural Bridge family income data, there are 8 families falling into the $100,000 to $149,999 income range, which is the most common income bracket and makes up 72.7% of all families.
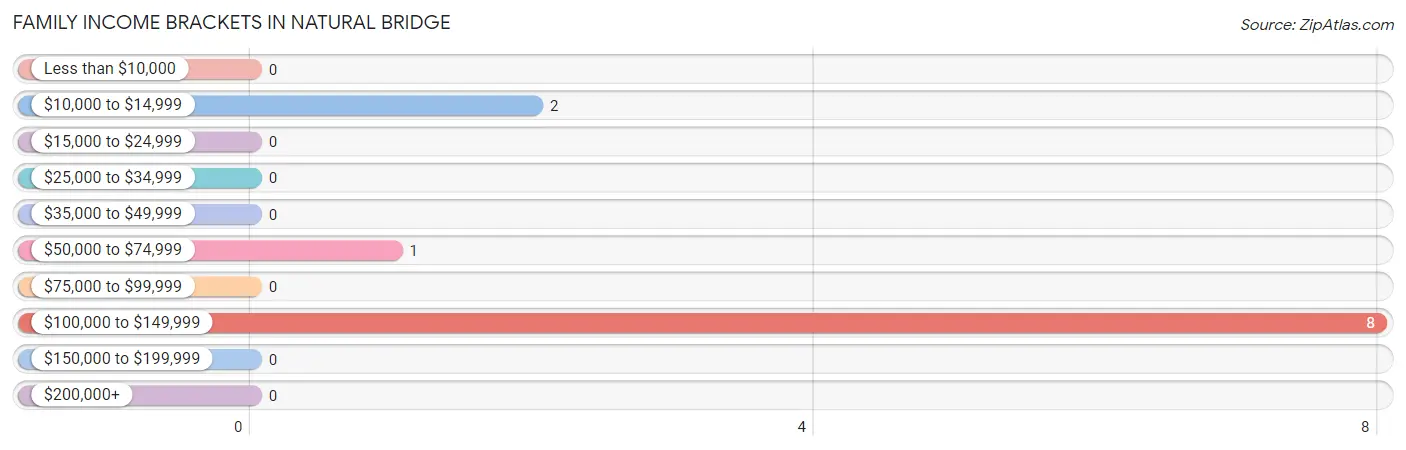
| Income Bracket | # Families | % Families |
| Less than $10,000 | 0 | 0.0% |
| $10,000 to $14,999 | 2 | 18.2% |
| $15,000 to $24,999 | 0 | 0.0% |
| $25,000 to $34,999 | 0 | 0.0% |
| $35,000 to $49,999 | 0 | 0.0% |
| $50,000 to $74,999 | 1 | 9.1% |
| $75,000 to $99,999 | 0 | 0.0% |
| $100,000 to $149,999 | 8 | 72.7% |
| $150,000 to $199,999 | 0 | 0.0% |
| $200,000+ | 0 | 0.0% |
Family Income by Famaliy Size in Natural Bridge
2-person families (11 | 100.0%) account for the highest median family income in Natural Bridge with $108,750 per family, while 2-person families (11 | 100.0%) have the highest median income of $54,375 per family member.
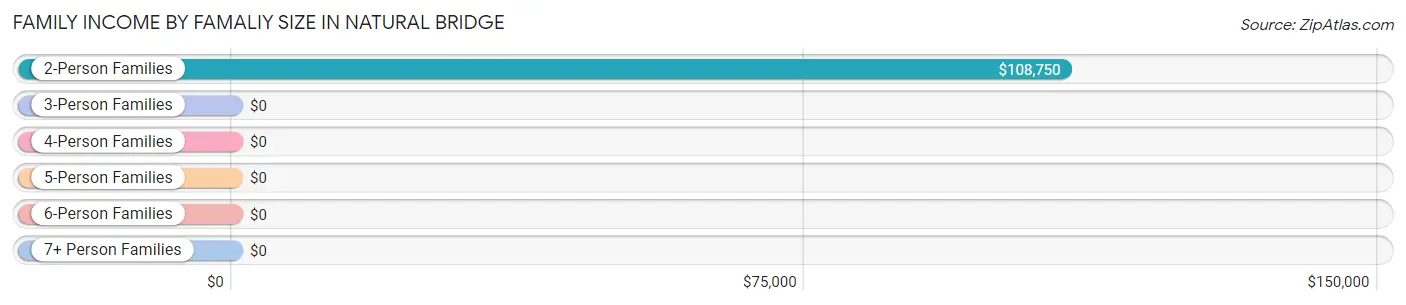
| Income Bracket | # Families | Median Income |
| 2-Person Families | 11 (100.0%) | $108,750 |
| 3-Person Families | 0 (0.0%) | $0 |
| 4-Person Families | 0 (0.0%) | $0 |
| 5-Person Families | 0 (0.0%) | $0 |
| 6-Person Families | 0 (0.0%) | $0 |
| 7+ Person Families | 0 (0.0%) | $0 |
| Total | 11 (100.0%) | $108,750 |
Family Income by Number of Earners in Natural Bridge
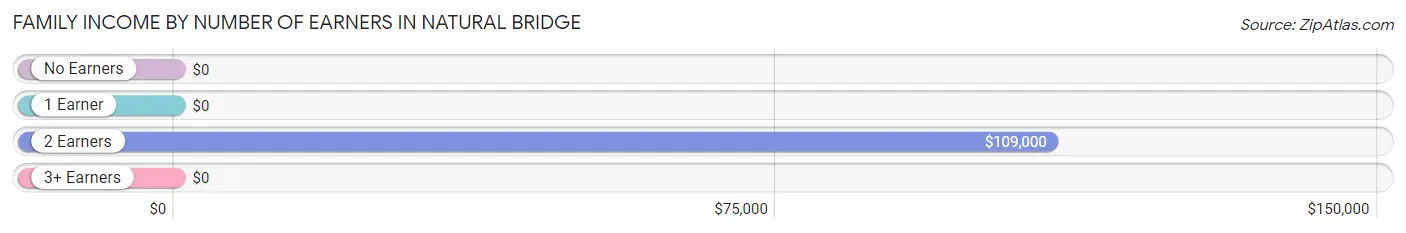
| Number of Earners | # Families | Median Income |
| No Earners | 2 (18.2%) | $0 |
| 1 Earner | 1 (9.1%) | $0 |
| 2 Earners | 8 (72.7%) | $109,000 |
| 3+ Earners | 0 (0.0%) | $0 |
| Total | 11 (100.0%) | $108,750 |
Household Income in Natural Bridge
Household Income Brackets in Natural Bridge
With 8 households falling in the category, the $100,000 to $149,999 income range is the most frequent in Natural Bridge, accounting for 72.7% of all households.
| Income Bracket | # Households | % Households |
| Less than $10,000 | 0 | 0.0% |
| $10,000 to $14,999 | 2 | 18.2% |
| $15,000 to $24,999 | 0 | 0.0% |
| $25,000 to $34,999 | 0 | 0.0% |
| $35,000 to $49,999 | 0 | 0.0% |
| $50,000 to $74,999 | 1 | 9.1% |
| $75,000 to $99,999 | 0 | 0.0% |
| $100,000 to $149,999 | 8 | 72.7% |
| $150,000 to $199,999 | 0 | 0.0% |
| $200,000+ | 0 | 0.0% |
Household Income by Householder Age in Natural Bridge
The median household income in Natural Bridge is $108,750, with the highest median household income of $109,500 found in the 45 to 64 years age bracket for the primary householder. A total of 8 households (72.7%) fall into this category.
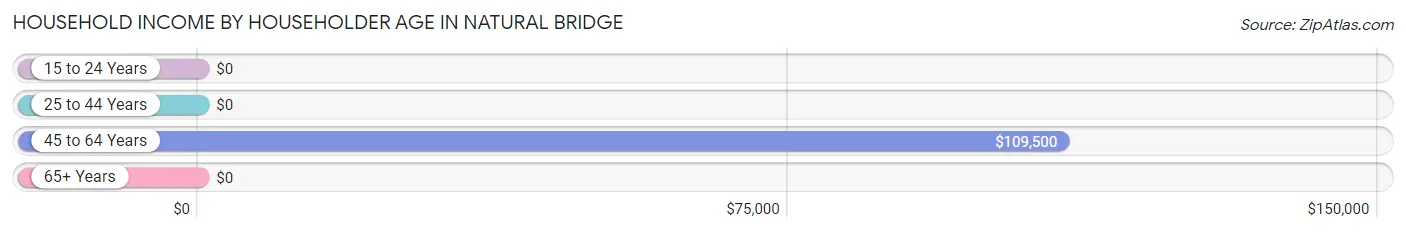
| Income Bracket | # Households | Median Income |
| 15 to 24 Years | 0 (0.0%) | $0 |
| 25 to 44 Years | 3 (27.3%) | $0 |
| 45 to 64 Years | 8 (72.7%) | $109,500 |
| 65+ Years | 0 (0.0%) | $0 |
| Total | 11 (100.0%) | $108,750 |
Poverty in Natural Bridge
Income Below Poverty by Sex and Age in Natural Bridge
With 18.2% poverty level for males and 20.0% for females among the residents of Natural Bridge, 35 to 44 year old males and 35 to 44 year old females are the most vulnerable to poverty, with 2 males (66.7%) and 2 females (100.0%) in their respective age groups living below the poverty level.
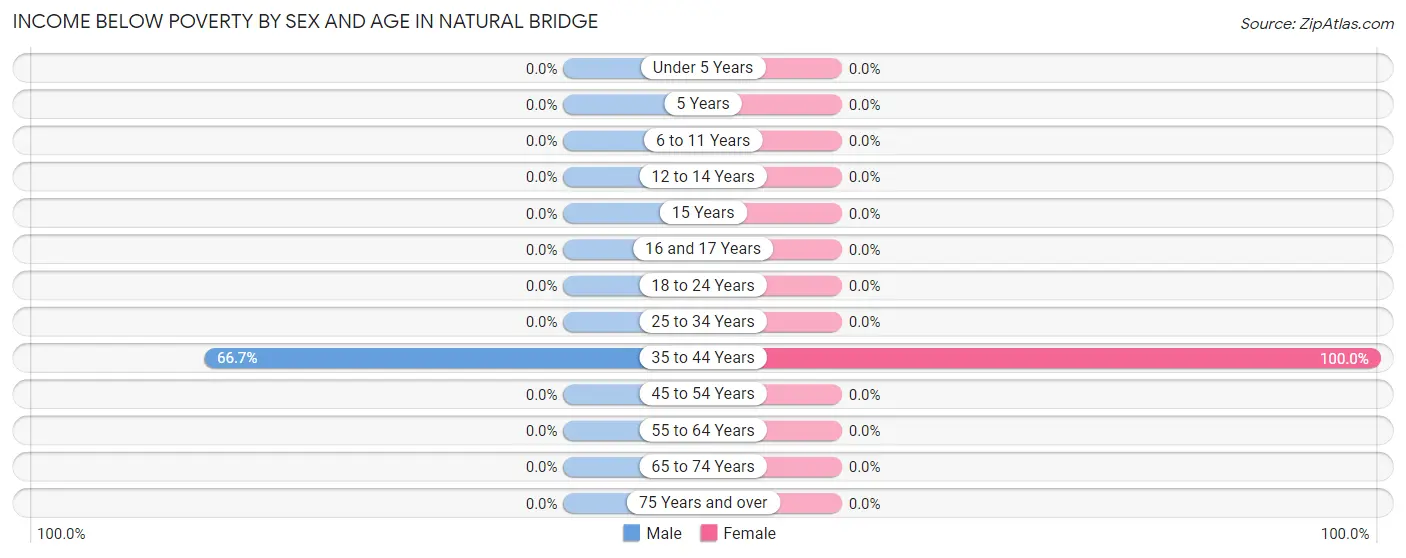
| Age Bracket | Male | Female |
| Under 5 Years | 0 (0.0%) | 0 (0.0%) |
| 5 Years | 0 (0.0%) | 0 (0.0%) |
| 6 to 11 Years | 0 (0.0%) | 0 (0.0%) |
| 12 to 14 Years | 0 (0.0%) | 0 (0.0%) |
| 15 Years | 0 (0.0%) | 0 (0.0%) |
| 16 and 17 Years | 0 (0.0%) | 0 (0.0%) |
| 18 to 24 Years | 0 (0.0%) | 0 (0.0%) |
| 25 to 34 Years | 0 (0.0%) | 0 (0.0%) |
| 35 to 44 Years | 2 (66.7%) | 2 (100.0%) |
| 45 to 54 Years | 0 (0.0%) | 0 (0.0%) |
| 55 to 64 Years | 0 (0.0%) | 0 (0.0%) |
| 65 to 74 Years | 0 (0.0%) | 0 (0.0%) |
| 75 Years and over | 0 (0.0%) | 0 (0.0%) |
| Total | 2 (18.2%) | 2 (20.0%) |
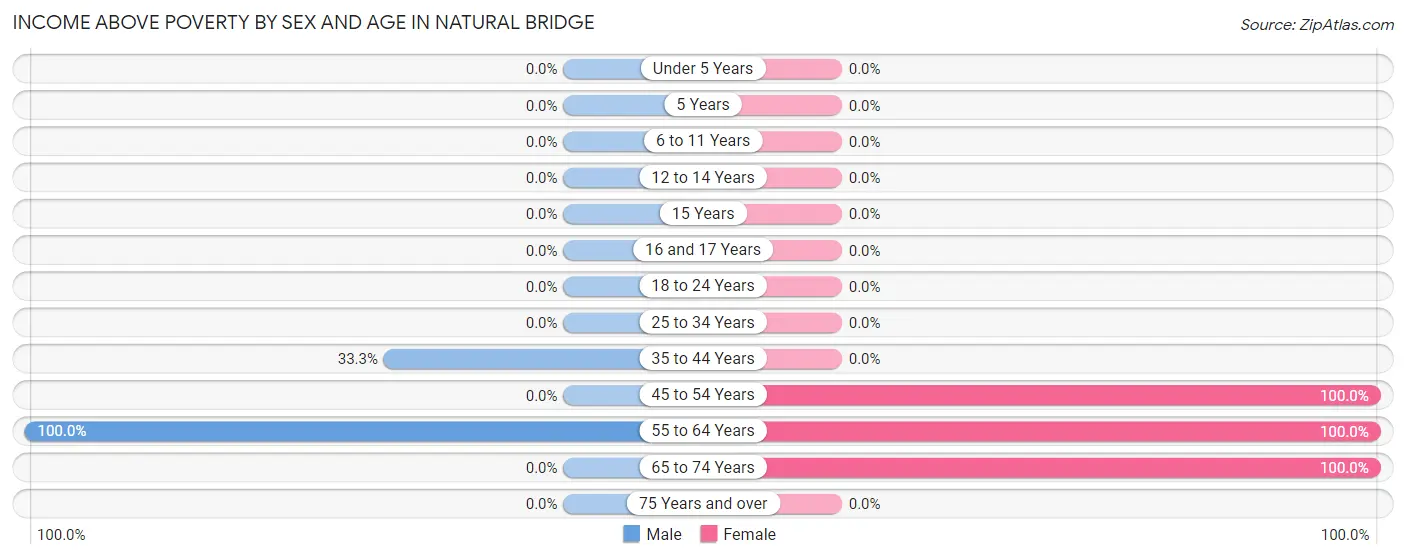
Income Above Poverty by Sex and Age in Natural Bridge
According to the poverty statistics in Natural Bridge, males aged 55 to 64 years and females aged 45 to 54 years are the age groups that are most secure financially, with 100.0% of males and 100.0% of females in these age groups living above the poverty line.
| Age Bracket | Male | Female |
| Under 5 Years | 0 (0.0%) | 0 (0.0%) |
| 5 Years | 0 (0.0%) | 0 (0.0%) |
| 6 to 11 Years | 0 (0.0%) | 0 (0.0%) |
| 12 to 14 Years | 0 (0.0%) | 0 (0.0%) |
| 15 Years | 0 (0.0%) | 0 (0.0%) |
| 16 and 17 Years | 0 (0.0%) | 0 (0.0%) |
| 18 to 24 Years | 0 (0.0%) | 0 (0.0%) |
| 25 to 34 Years | 0 (0.0%) | 0 (0.0%) |
| 35 to 44 Years | 1 (33.3%) | 0 (0.0%) |
| 45 to 54 Years | 0 (0.0%) | 2 (100.0%) |
| 55 to 64 Years | 8 (100.0%) | 4 (100.0%) |
| 65 to 74 Years | 0 (0.0%) | 2 (100.0%) |
| 75 Years and over | 0 (0.0%) | 0 (0.0%) |
| Total | 9 (81.8%) | 8 (80.0%) |
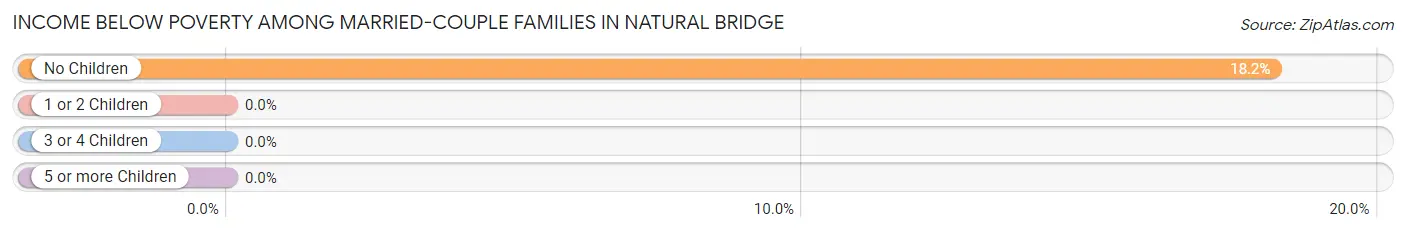
Income Below Poverty Among Married-Couple Families in Natural Bridge
The poverty statistics for married-couple families in Natural Bridge show that 18.2% or 2 of the total 11 families live below the poverty line. Families with no children have the highest poverty rate of 18.2%, comprising of 2 families. On the other hand, families with no children have the lowest poverty rate of 18.2%, which includes 2 families.
| Children | Above Poverty | Below Poverty |
| No Children | 9 (81.8%) | 2 (18.2%) |
| 1 or 2 Children | 0 (0.0%) | 0 (0.0%) |
| 3 or 4 Children | 0 (0.0%) | 0 (0.0%) |
| 5 or more Children | 0 (0.0%) | 0 (0.0%) |
| Total | 9 (81.8%) | 2 (18.2%) |
Income Below Poverty Among Single-Parent Households in Natural Bridge
| Children | Single Father | Single Mother |
| No Children | 0 (0.0%) | 0 (0.0%) |
| 1 or 2 Children | 0 (0.0%) | 0 (0.0%) |
| 3 or 4 Children | 0 (0.0%) | 0 (0.0%) |
| 5 or more Children | 0 (0.0%) | 0 (0.0%) |
| Total | 0 (0.0%) | 0 (0.0%) |
Income Below Poverty Among Married-Couple vs Single-Parent Households in Natural Bridge
| Children | Married-Couple Families | Single-Parent Households |
| No Children | 2 (18.2%) | 0 (0.0%) |
| 1 or 2 Children | 0 (0.0%) | 0 (0.0%) |
| 3 or 4 Children | 0 (0.0%) | 0 (0.0%) |
| 5 or more Children | 0 (0.0%) | 0 (0.0%) |
| Total | 2 (18.2%) | 0 (0.0%) |
Employment Characteristics in Natural Bridge
Employment by Class of Employer in Natural Bridge
Among the 15 employed individuals in Natural Bridge, , and private company employees (15 | 100.0%) make up the most common classes of employment.
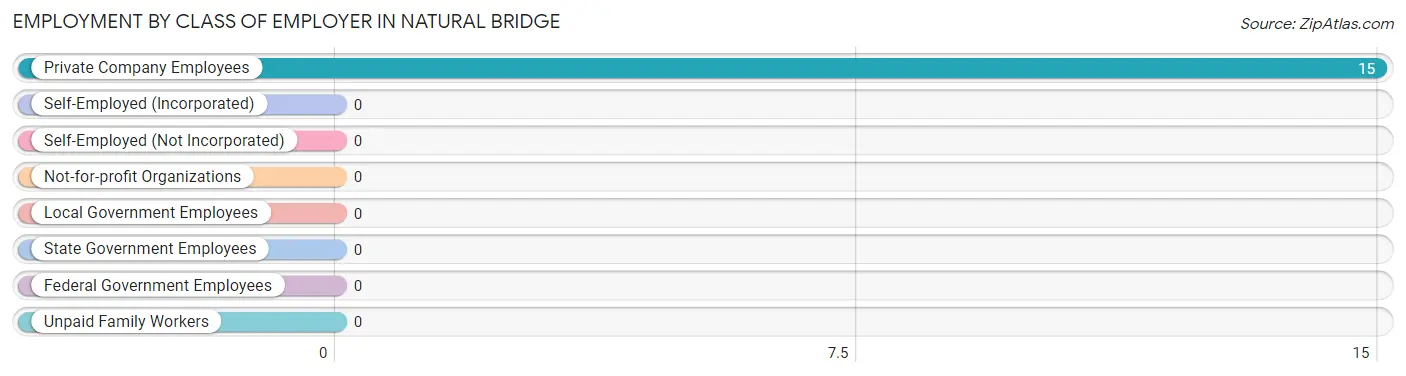
| Employer Class | # Employees | % Employees |
| Private Company Employees | 15 | 100.0% |
| Self-Employed (Incorporated) | 0 | 0.0% |
| Self-Employed (Not Incorporated) | 0 | 0.0% |
| Not-for-profit Organizations | 0 | 0.0% |
| Local Government Employees | 0 | 0.0% |
| State Government Employees | 0 | 0.0% |
| Federal Government Employees | 0 | 0.0% |
| Unpaid Family Workers | 0 | 0.0% |
| Total | 15 | 100.0% |
Employment Status by Age in Natural Bridge
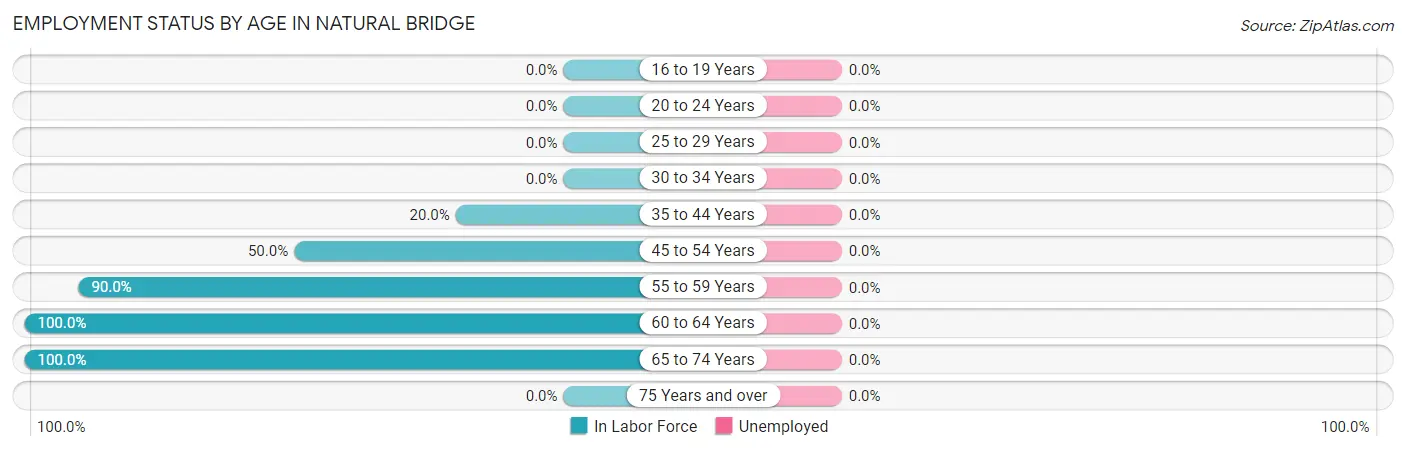
| Age Bracket | In Labor Force | Unemployed |
| 16 to 19 Years | 0 (0.0%) | 0 (0.0%) |
| 20 to 24 Years | 0 (0.0%) | 0 (0.0%) |
| 25 to 29 Years | 0 (0.0%) | 0 (0.0%) |
| 30 to 34 Years | 0 (0.0%) | 0 (0.0%) |
| 35 to 44 Years | 1 (20.0%) | 0 (0.0%) |
| 45 to 54 Years | 1 (50.0%) | 0 (0.0%) |
| 55 to 59 Years | 9 (90.0%) | 0 (0.0%) |
| 60 to 64 Years | 2 (100.0%) | 0 (0.0%) |
| 65 to 74 Years | 2 (100.0%) | 0 (0.0%) |
| 75 Years and over | 0 (0.0%) | 0 (0.0%) |
| Total | 15 (71.4%) | 0 (0.0%) |
Employment Status by Educational Attainment in Natural Bridge
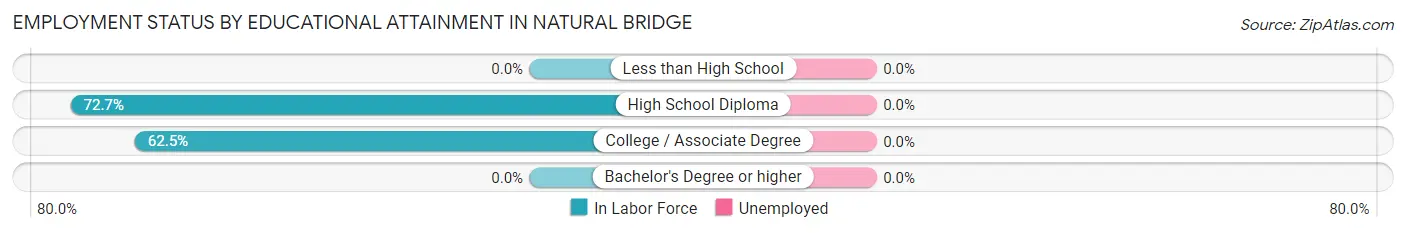
| Educational Attainment | In Labor Force | Unemployed |
| Less than High School | 0 (0.0%) | 0 (0.0%) |
| High School Diploma | 8 (72.7%) | 0 (0.0%) |
| College / Associate Degree | 5 (62.5%) | 0 (0.0%) |
| Bachelor's Degree or higher | 0 (0.0%) | 0 (0.0%) |
| Total | 13 (68.4%) | 0 (0.0%) |
Employment Occupations by Sex in Natural Bridge
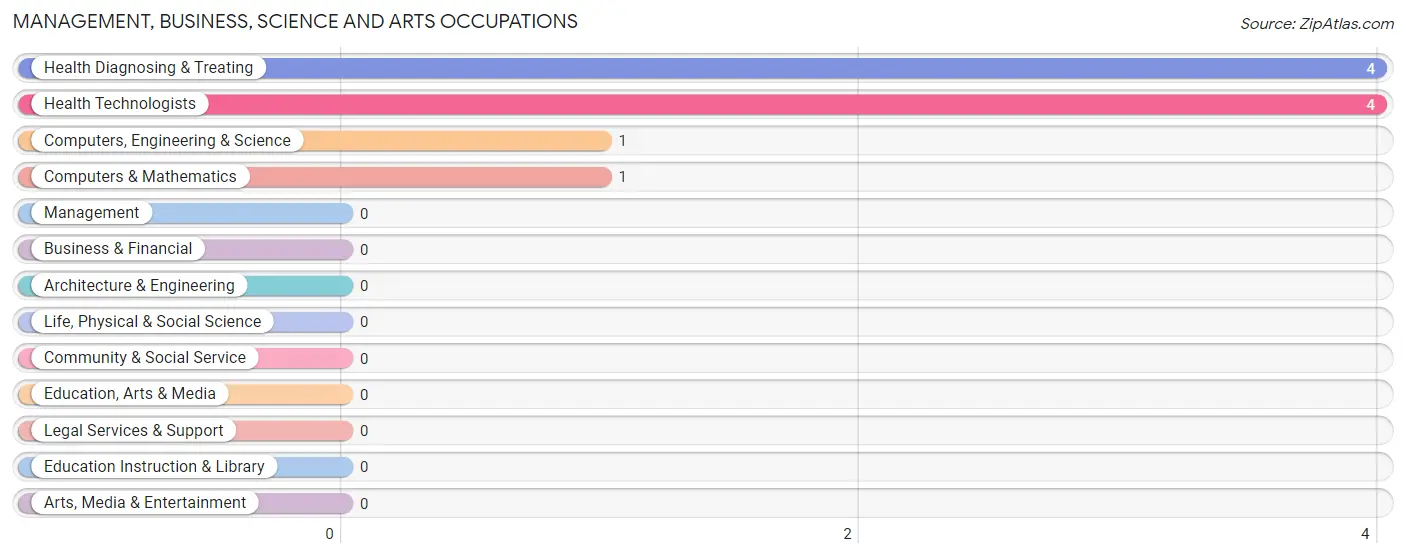
Management, Business, Science and Arts Occupations
The most common Management, Business, Science and Arts occupations in Natural Bridge are Health Diagnosing & Treating (4 | 26.7%), Health Technologists (4 | 26.7%), Computers, Engineering & Science (1 | 6.7%), and Computers & Mathematics (1 | 6.7%).
Management, Business, Science and Arts Occupations by Sex
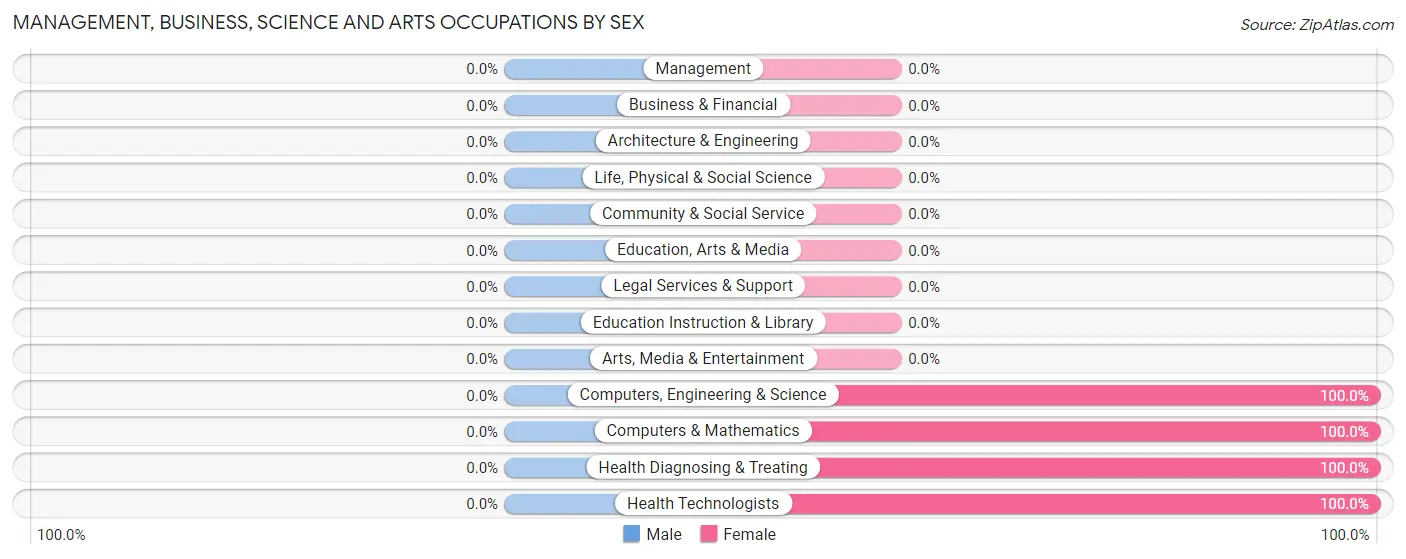
| Occupation | Male | Female |
| Management | 0 (0.0%) | 0 (0.0%) |
| Business & Financial | 0 (0.0%) | 0 (0.0%) |
| Computers, Engineering & Science | 0 (0.0%) | 1 (100.0%) |
| Computers & Mathematics | 0 (0.0%) | 1 (100.0%) |
| Architecture & Engineering | 0 (0.0%) | 0 (0.0%) |
| Life, Physical & Social Science | 0 (0.0%) | 0 (0.0%) |
| Community & Social Service | 0 (0.0%) | 0 (0.0%) |
| Education, Arts & Media | 0 (0.0%) | 0 (0.0%) |
| Legal Services & Support | 0 (0.0%) | 0 (0.0%) |
| Education Instruction & Library | 0 (0.0%) | 0 (0.0%) |
| Arts, Media & Entertainment | 0 (0.0%) | 0 (0.0%) |
| Health Diagnosing & Treating | 0 (0.0%) | 4 (100.0%) |
| Health Technologists | 0 (0.0%) | 4 (100.0%) |
| Total (Category) | 0 (0.0%) | 5 (100.0%) |
| Total (Overall) | 8 (53.3%) | 7 (46.7%) |
Services Occupations
Services Occupations by Sex
| Occupation | Male | Female |
| Healthcare Support | 0 (0.0%) | 0 (0.0%) |
| Security & Protection | 0 (0.0%) | 0 (0.0%) |
| Firefighting & Prevention | 0 (0.0%) | 0 (0.0%) |
| Law Enforcement | 0 (0.0%) | 0 (0.0%) |
| Food Preparation & Serving | 0 (0.0%) | 0 (0.0%) |
| Cleaning & Maintenance | 0 (0.0%) | 0 (0.0%) |
| Personal Care & Service | 0 (0.0%) | 0 (0.0%) |
| Total (Category) | 0 (0.0%) | 0 (0.0%) |
| Total (Overall) | 8 (53.3%) | 7 (46.7%) |
Sales and Office Occupations
The most common Sales and Office occupations in Natural Bridge are , and Office & Administration (2 | 13.3%).

Sales and Office Occupations by Sex

| Occupation | Male | Female |
| Sales & Related | 0 (0.0%) | 0 (0.0%) |
| Office & Administration | 0 (0.0%) | 2 (100.0%) |
| Total (Category) | 0 (0.0%) | 2 (100.0%) |
| Total (Overall) | 8 (53.3%) | 7 (46.7%) |
Natural Resources, Construction and Maintenance Occupations
The most common Natural Resources, Construction and Maintenance occupations in Natural Bridge are , and Installation, Maintenance & Repair (2 | 13.3%).
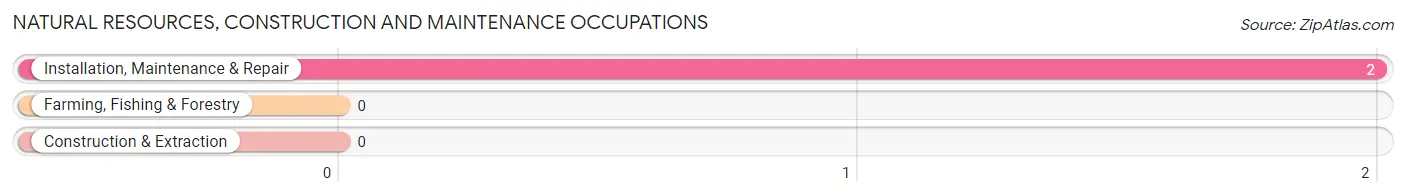
Natural Resources, Construction and Maintenance Occupations by Sex
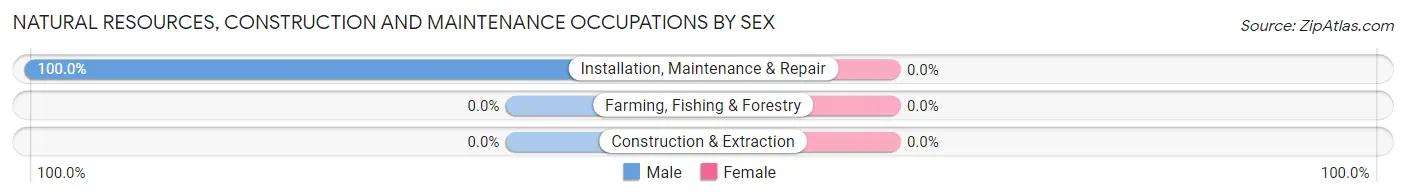
| Occupation | Male | Female |
| Farming, Fishing & Forestry | 0 (0.0%) | 0 (0.0%) |
| Construction & Extraction | 0 (0.0%) | 0 (0.0%) |
| Installation, Maintenance & Repair | 2 (100.0%) | 0 (0.0%) |
| Total (Category) | 2 (100.0%) | 0 (0.0%) |
| Total (Overall) | 8 (53.3%) | 7 (46.7%) |
Production, Transportation and Moving Occupations
The most common Production, Transportation and Moving occupations in Natural Bridge are , and Material Moving (6 | 40.0%).
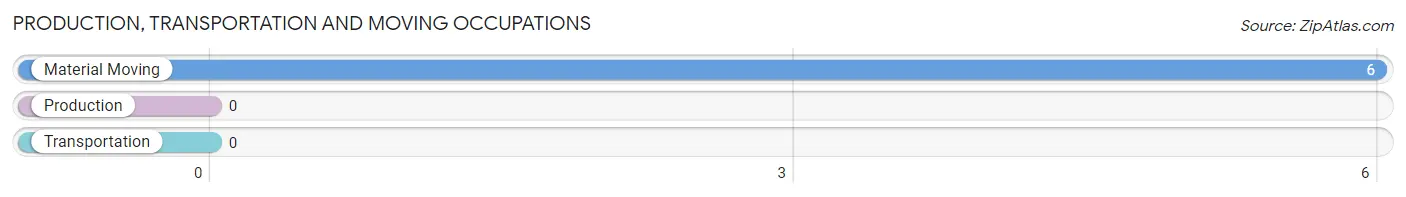
Production, Transportation and Moving Occupations by Sex
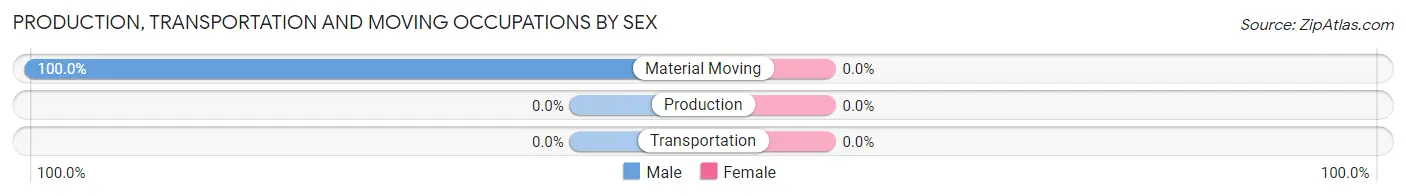
| Occupation | Male | Female |
| Production | 0 (0.0%) | 0 (0.0%) |
| Transportation | 0 (0.0%) | 0 (0.0%) |
| Material Moving | 6 (100.0%) | 0 (0.0%) |
| Total (Category) | 6 (100.0%) | 0 (0.0%) |
| Total (Overall) | 8 (53.3%) | 7 (46.7%) |
Employment Industries by Sex in Natural Bridge
Employment Industries in Natural Bridge
The major employment industries in Natural Bridge include Manufacturing (11 | 73.3%), and Health Care & Social Assistance (4 | 26.7%).
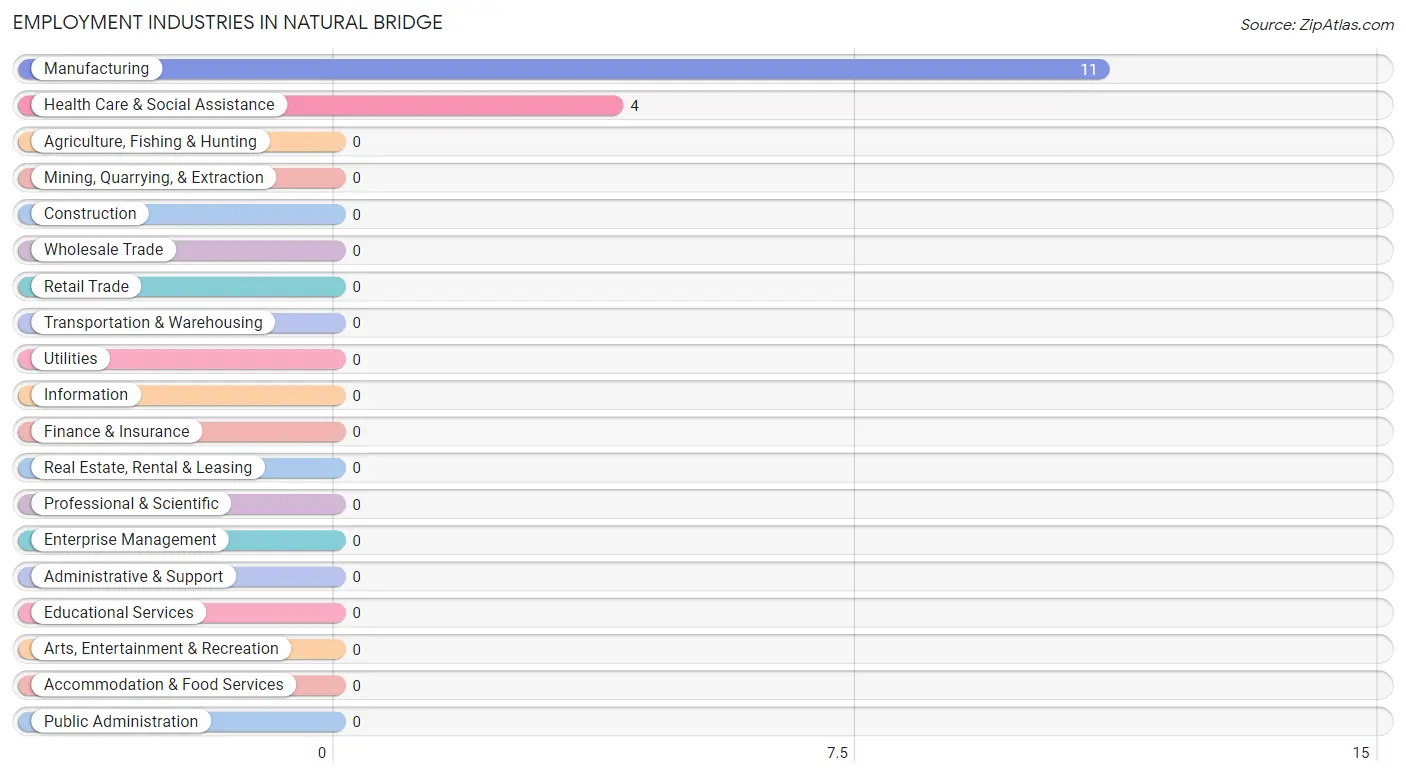
Employment Industries by Sex in Natural Bridge
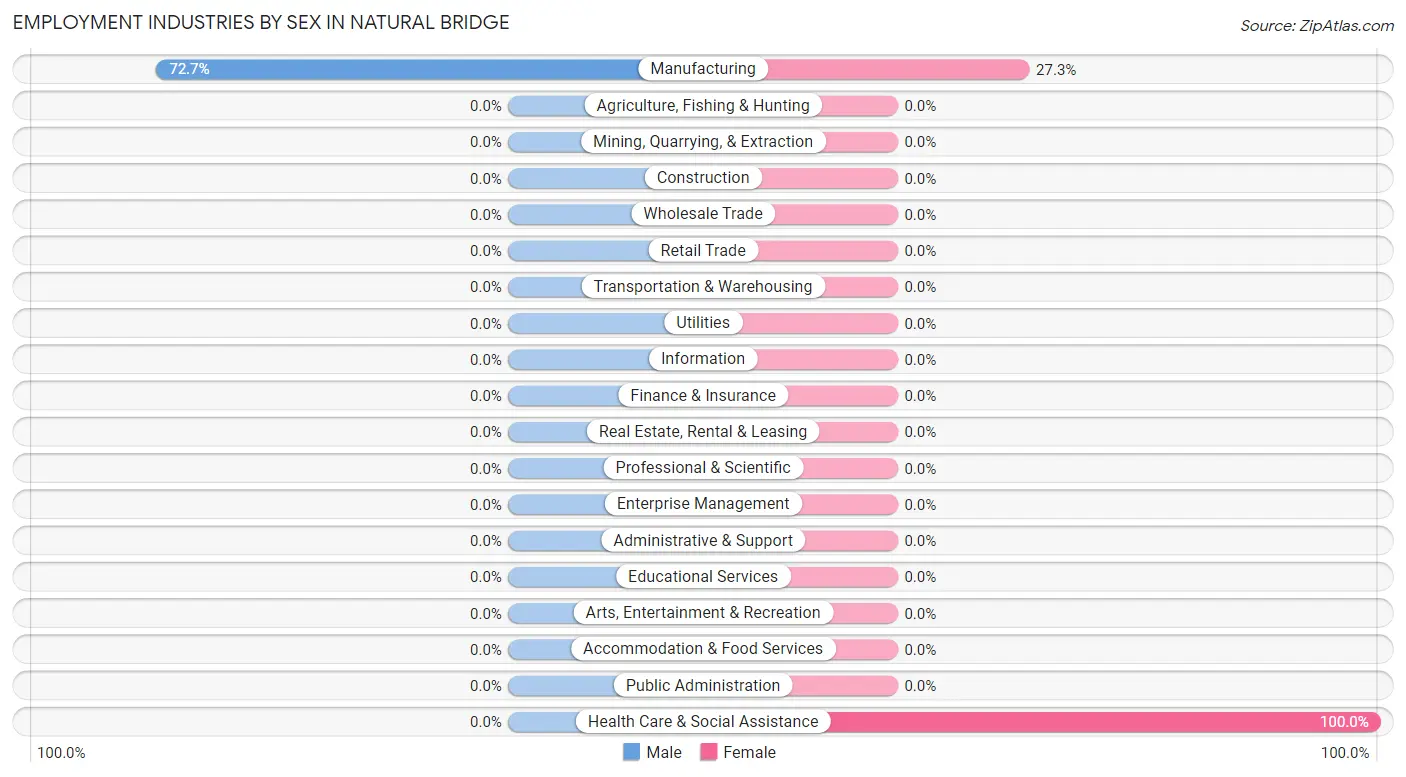
| Industry | Male | Female |
| Agriculture, Fishing & Hunting | 0 (0.0%) | 0 (0.0%) |
| Mining, Quarrying, & Extraction | 0 (0.0%) | 0 (0.0%) |
| Construction | 0 (0.0%) | 0 (0.0%) |
| Manufacturing | 8 (72.7%) | 3 (27.3%) |
| Wholesale Trade | 0 (0.0%) | 0 (0.0%) |
| Retail Trade | 0 (0.0%) | 0 (0.0%) |
| Transportation & Warehousing | 0 (0.0%) | 0 (0.0%) |
| Utilities | 0 (0.0%) | 0 (0.0%) |
| Information | 0 (0.0%) | 0 (0.0%) |
| Finance & Insurance | 0 (0.0%) | 0 (0.0%) |
| Real Estate, Rental & Leasing | 0 (0.0%) | 0 (0.0%) |
| Professional & Scientific | 0 (0.0%) | 0 (0.0%) |
| Enterprise Management | 0 (0.0%) | 0 (0.0%) |
| Administrative & Support | 0 (0.0%) | 0 (0.0%) |
| Educational Services | 0 (0.0%) | 0 (0.0%) |
| Health Care & Social Assistance | 0 (0.0%) | 4 (100.0%) |
| Arts, Entertainment & Recreation | 0 (0.0%) | 0 (0.0%) |
| Accommodation & Food Services | 0 (0.0%) | 0 (0.0%) |
| Public Administration | 0 (0.0%) | 0 (0.0%) |
| Total | 8 (53.3%) | 7 (46.7%) |
Education in Natural Bridge
School Enrollment in Natural Bridge
| School Level | # Students | % Students |
| Nursery / Preschool | 0 | 0.0% |
| Kindergarten | 0 | 0.0% |
| Elementary School | 0 | 0.0% |
| Middle School | 0 | 0.0% |
| High School | 0 | 0.0% |
| College / Undergraduate | 0 | 0.0% |
| Graduate / Professional | 0 | 0.0% |
| Total | 0 | 0.0% |
School Enrollment by Age by Funding Source in Natural Bridge
| Age Bracket | Public School | Private School |
| 3 to 4 Year Olds | 0 (0.0%) | 0 (0.0%) |
| 5 to 9 Year Old | 0 (0.0%) | 0 (0.0%) |
| 10 to 14 Year Olds | 0 (0.0%) | 0 (0.0%) |
| 15 to 17 Year Olds | 0 (0.0%) | 0 (0.0%) |
| 18 to 19 Year Olds | 0 (0.0%) | 0 (0.0%) |
| 20 to 24 Year Olds | 0 (0.0%) | 0 (0.0%) |
| 25 to 34 Year Olds | 0 (0.0%) | 0 (0.0%) |
| 35 Years and over | 0 (0.0%) | 0 (0.0%) |
| Total | 0 (0.0%) | 0 (0.0%) |
Educational Attainment by Field of Study in Natural Bridge
| Field of Study | # Graduates | % Graduates |
| Computers & Mathematics | 0 | 0.0% |
| Bio, Nature & Agricultural | 0 | 0.0% |
| Physical & Health Sciences | 0 | 0.0% |
| Psychology | 0 | 0.0% |
| Social Sciences | 0 | 0.0% |
| Engineering | 0 | 0.0% |
| Multidisciplinary Studies | 0 | 0.0% |
| Science & Technology | 0 | 0.0% |
| Business | 0 | 0.0% |
| Education | 0 | 0.0% |
| Literature & Languages | 0 | 0.0% |
| Liberal Arts & History | 0 | 0.0% |
| Visual & Performing Arts | 0 | 0.0% |
| Communications | 0 | 0.0% |
| Arts & Humanities | 0 | 0.0% |
| Total | 0 | 0.0% |
Transportation & Commute in Natural Bridge
Vehicle Availability by Sex in Natural Bridge
The most prevalent vehicle ownership categories in Natural Bridge are males with 2 vehicles (5, accounting for 62.5%) and females with 2 vehicles (5, making up 71.4%).
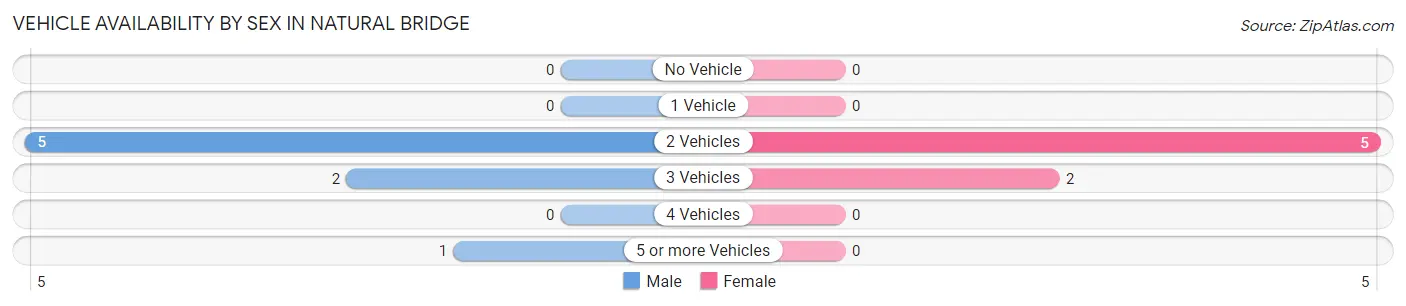
| Vehicles Available | Male | Female |
| No Vehicle | 0 (0.0%) | 0 (0.0%) |
| 1 Vehicle | 0 (0.0%) | 0 (0.0%) |
| 2 Vehicles | 5 (62.5%) | 5 (71.4%) |
| 3 Vehicles | 2 (25.0%) | 2 (28.6%) |
| 4 Vehicles | 0 (0.0%) | 0 (0.0%) |
| 5 or more Vehicles | 1 (12.5%) | 0 (0.0%) |
| Total | 8 (100.0%) | 7 (100.0%) |
Commute Time in Natural Bridge
The most frequently occuring commute durations in Natural Bridge are 40 to 44 minutes (5 commuters, 35.7%), 10 to 14 minutes (4 commuters, 28.6%), and 15 to 19 minutes (2 commuters, 14.3%).
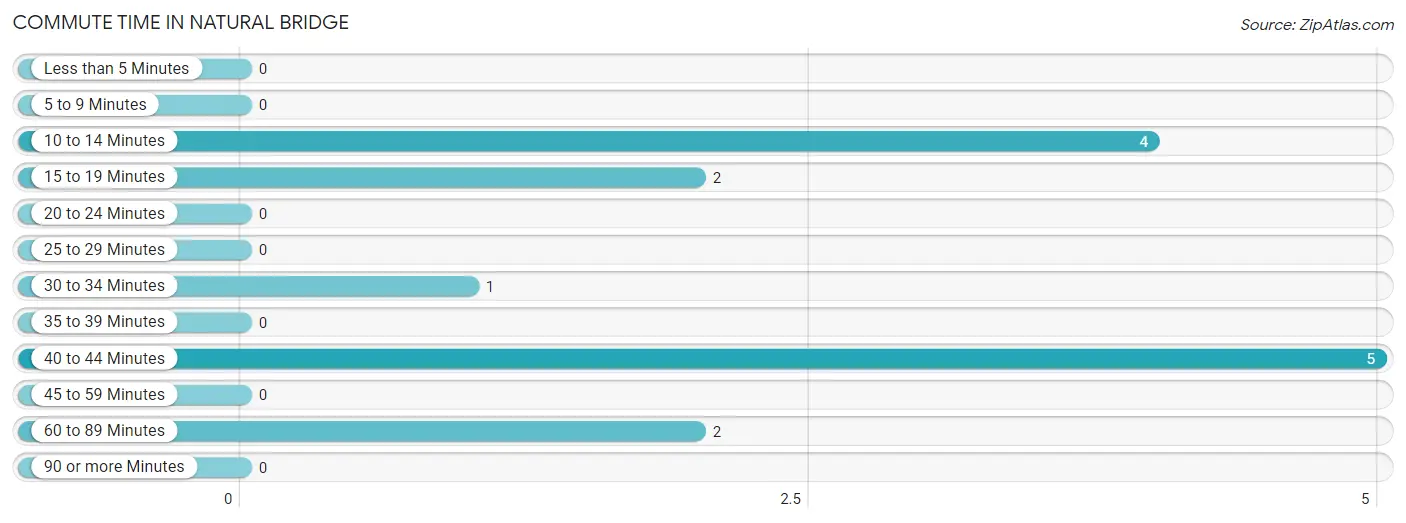
| Commute Time | # Commuters | % Commuters |
| Less than 5 Minutes | 0 | 0.0% |
| 5 to 9 Minutes | 0 | 0.0% |
| 10 to 14 Minutes | 4 | 28.6% |
| 15 to 19 Minutes | 2 | 14.3% |
| 20 to 24 Minutes | 0 | 0.0% |
| 25 to 29 Minutes | 0 | 0.0% |
| 30 to 34 Minutes | 1 | 7.1% |
| 35 to 39 Minutes | 0 | 0.0% |
| 40 to 44 Minutes | 5 | 35.7% |
| 45 to 59 Minutes | 0 | 0.0% |
| 60 to 89 Minutes | 2 | 14.3% |
| 90 or more Minutes | 0 | 0.0% |
Commute Time by Sex in Natural Bridge
The most common commute times in Natural Bridge are 40 to 44 minutes (5 commuters, 62.5%) for males and 10 to 14 minutes (4 commuters, 66.7%) for females.
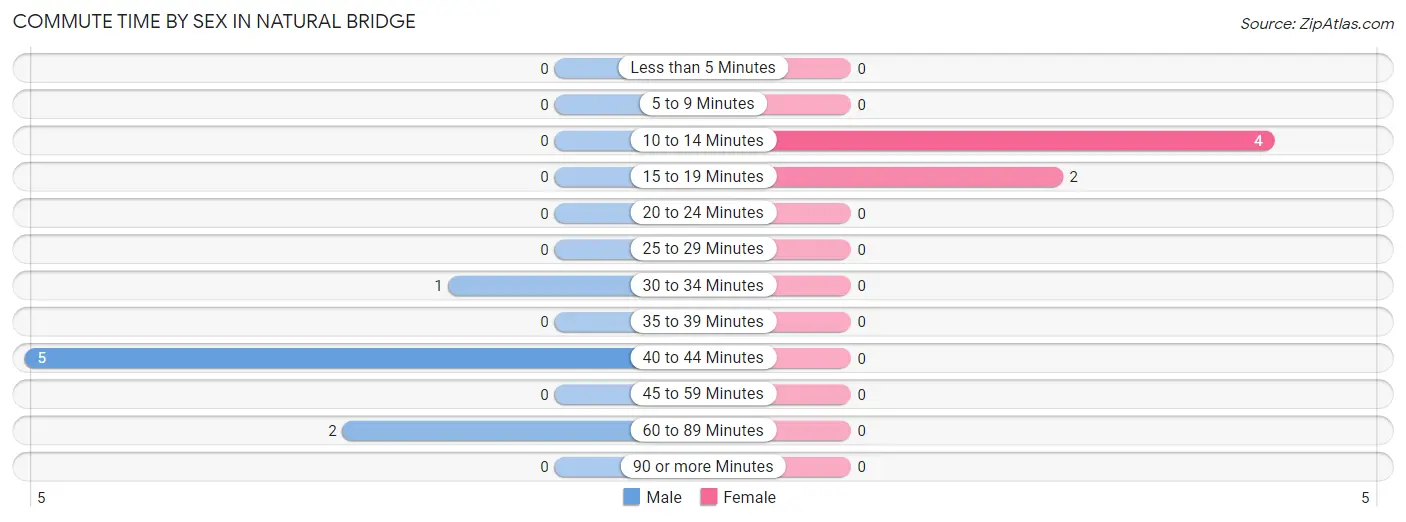
| Commute Time | Male | Female |
| Less than 5 Minutes | 0 (0.0%) | 0 (0.0%) |
| 5 to 9 Minutes | 0 (0.0%) | 0 (0.0%) |
| 10 to 14 Minutes | 0 (0.0%) | 4 (66.7%) |
| 15 to 19 Minutes | 0 (0.0%) | 2 (33.3%) |
| 20 to 24 Minutes | 0 (0.0%) | 0 (0.0%) |
| 25 to 29 Minutes | 0 (0.0%) | 0 (0.0%) |
| 30 to 34 Minutes | 1 (12.5%) | 0 (0.0%) |
| 35 to 39 Minutes | 0 (0.0%) | 0 (0.0%) |
| 40 to 44 Minutes | 5 (62.5%) | 0 (0.0%) |
| 45 to 59 Minutes | 0 (0.0%) | 0 (0.0%) |
| 60 to 89 Minutes | 2 (25.0%) | 0 (0.0%) |
| 90 or more Minutes | 0 (0.0%) | 0 (0.0%) |
Time of Departure to Work by Sex in Natural Bridge
The most frequent times of departure to work in Natural Bridge are 5:00 AM to 5:29 AM (5, 62.5%) for males and 7:30 AM to 7:59 AM (4, 66.7%) for females.
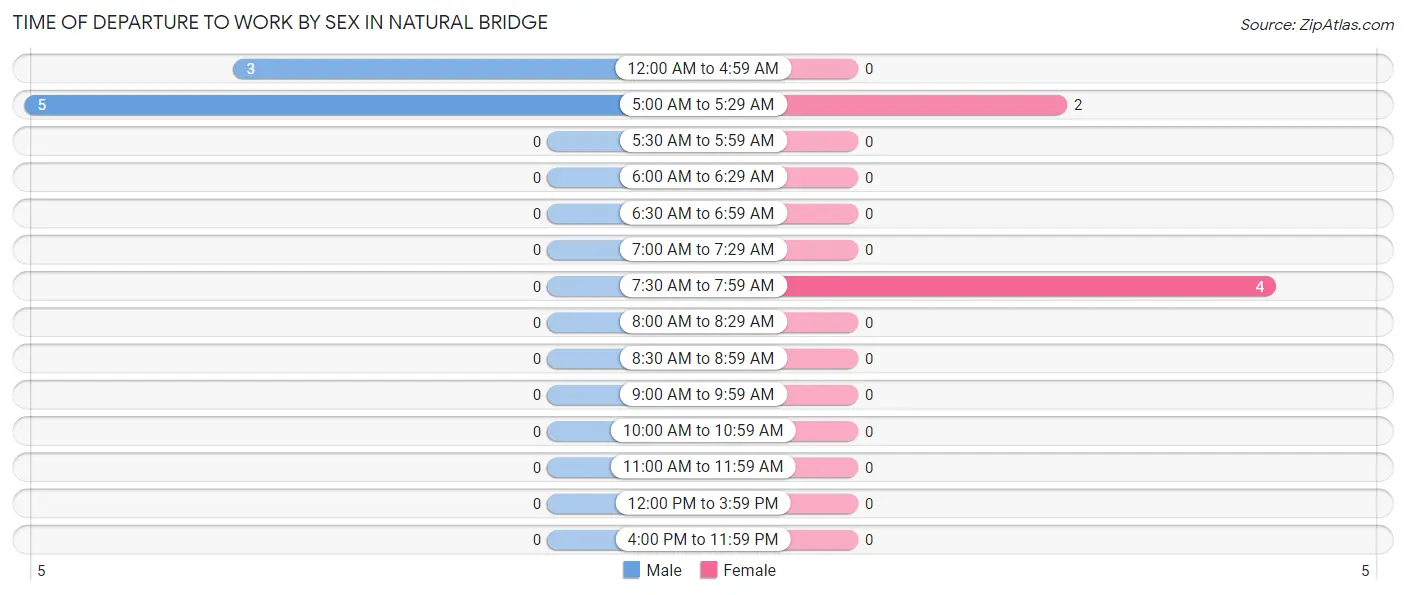
| Time of Departure | Male | Female |
| 12:00 AM to 4:59 AM | 3 (37.5%) | 0 (0.0%) |
| 5:00 AM to 5:29 AM | 5 (62.5%) | 2 (33.3%) |
| 5:30 AM to 5:59 AM | 0 (0.0%) | 0 (0.0%) |
| 6:00 AM to 6:29 AM | 0 (0.0%) | 0 (0.0%) |
| 6:30 AM to 6:59 AM | 0 (0.0%) | 0 (0.0%) |
| 7:00 AM to 7:29 AM | 0 (0.0%) | 0 (0.0%) |
| 7:30 AM to 7:59 AM | 0 (0.0%) | 4 (66.7%) |
| 8:00 AM to 8:29 AM | 0 (0.0%) | 0 (0.0%) |
| 8:30 AM to 8:59 AM | 0 (0.0%) | 0 (0.0%) |
| 9:00 AM to 9:59 AM | 0 (0.0%) | 0 (0.0%) |
| 10:00 AM to 10:59 AM | 0 (0.0%) | 0 (0.0%) |
| 11:00 AM to 11:59 AM | 0 (0.0%) | 0 (0.0%) |
| 12:00 PM to 3:59 PM | 0 (0.0%) | 0 (0.0%) |
| 4:00 PM to 11:59 PM | 0 (0.0%) | 0 (0.0%) |
| Total | 8 (100.0%) | 6 (100.0%) |
Housing Occupancy in Natural Bridge
Occupancy by Ownership in Natural Bridge
Of the total 11 dwellings in Natural Bridge, owner-occupied units account for 11 (100.0%), while renter-occupied units make up 0 (0.0%).
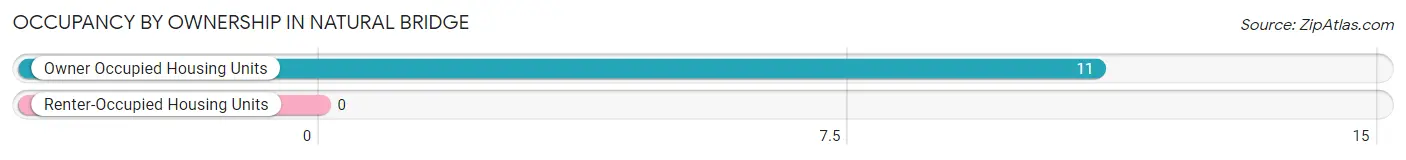
| Occupancy | # Housing Units | % Housing Units |
| Owner Occupied Housing Units | 11 | 100.0% |
| Renter-Occupied Housing Units | 0 | 0.0% |
| Total Occupied Housing Units | 11 | 100.0% |
Occupancy by Household Size in Natural Bridge
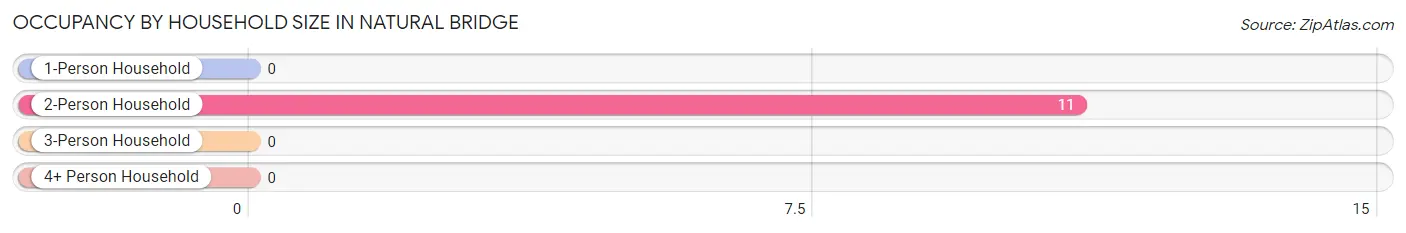
| Household Size | # Housing Units | % Housing Units |
| 1-Person Household | 0 | 0.0% |
| 2-Person Household | 11 | 100.0% |
| 3-Person Household | 0 | 0.0% |
| 4+ Person Household | 0 | 0.0% |
| Total Housing Units | 11 | 100.0% |
Occupancy by Ownership by Household Size in Natural Bridge
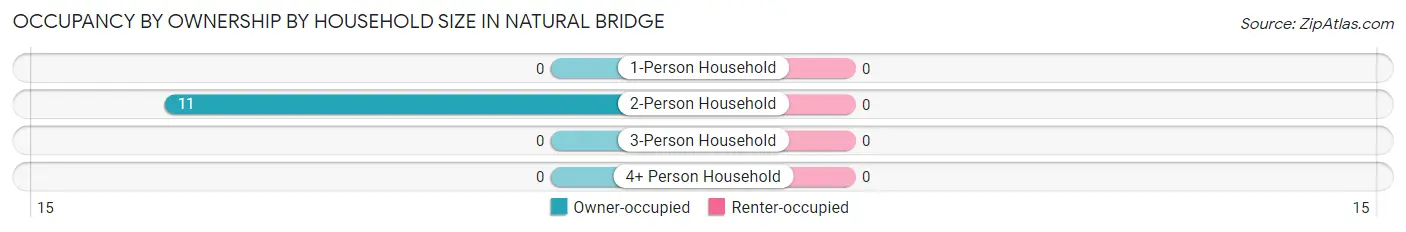
| Household Size | Owner-occupied | Renter-occupied |
| 1-Person Household | 0 (0.0%) | 0 (0.0%) |
| 2-Person Household | 11 (100.0%) | 0 (0.0%) |
| 3-Person Household | 0 (0.0%) | 0 (0.0%) |
| 4+ Person Household | 0 (0.0%) | 0 (0.0%) |
| Total Housing Units | 11 (100.0%) | 0 (0.0%) |
Occupancy by Educational Attainment in Natural Bridge
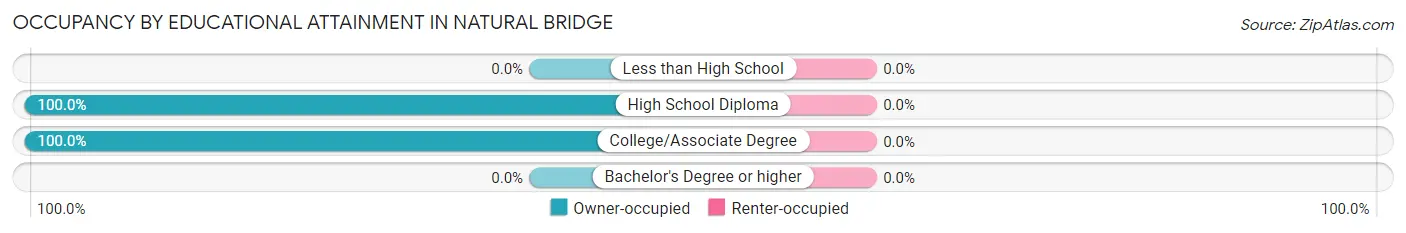
| Household Size | Owner-occupied | Renter-occupied |
| Less than High School | 0 (0.0%) | 0 (0.0%) |
| High School Diploma | 9 (100.0%) | 0 (0.0%) |
| College/Associate Degree | 2 (100.0%) | 0 (0.0%) |
| Bachelor's Degree or higher | 0 (0.0%) | 0 (0.0%) |
Occupancy by Age of Householder in Natural Bridge
| Age Bracket | # Households | % Households |
| Under 35 Years | 0 | 0.0% |
| 35 to 44 Years | 3 | 27.3% |
| 45 to 54 Years | 0 | 0.0% |
| 55 to 64 Years | 8 | 72.7% |
| 65 to 74 Years | 0 | 0.0% |
| 75 to 84 Years | 0 | 0.0% |
| 85 Years and Over | 0 | 0.0% |
| Total | 11 | 100.0% |
Housing Finances in Natural Bridge
Median Income by Occupancy in Natural Bridge
| Occupancy Type | # Households | Median Income |
| Owner-Occupied | 11 (100.0%) | $108,750 |
| Renter-Occupied | 0 (0.0%) | $0 |
| Average | 11 (100.0%) | $108,750 |
Occupancy by Householder Income Bracket in Natural Bridge
| Income Bracket | Owner-occupied | Renter-occupied |
| Less than $5,000 | 0 (0.0%) | 0 (0.0%) |
| $5,000 to $9,999 | 0 (0.0%) | 0 (0.0%) |
| $10,000 to $14,999 | 2 (18.2%) | 0 (0.0%) |
| $15,000 to $19,999 | 0 (0.0%) | 0 (0.0%) |
| $20,000 to $24,999 | 0 (0.0%) | 0 (0.0%) |
| $25,000 to $34,999 | 0 (0.0%) | 0 (0.0%) |
| $35,000 to $49,999 | 0 (0.0%) | 0 (0.0%) |
| $50,000 to $74,999 | 1 (9.1%) | 0 (0.0%) |
| $75,000 to $99,999 | 0 (0.0%) | 0 (0.0%) |
| $100,000 to $149,999 | 8 (72.7%) | 0 (0.0%) |
| $150,000 or more | 0 (0.0%) | 0 (0.0%) |
| Total | 11 (100.0%) | 0 (0.0%) |
Monthly Housing Cost Tiers in Natural Bridge
| Monthly Cost | Owner-occupied | Renter-occupied |
| Less than $300 | 3 (27.3%) | 0 (0.0%) |
| $300 to $499 | 2 (18.2%) | 0 (0.0%) |
| $500 to $799 | 0 (0.0%) | 0 (0.0%) |
| $800 to $999 | 0 (0.0%) | 0 (0.0%) |
| $1,000 to $1,499 | 0 (0.0%) | 0 (0.0%) |
| $1,500 to $1,999 | 5 (45.5%) | 0 (0.0%) |
| $2,000 to $2,499 | 1 (9.1%) | 0 (0.0%) |
| $2,500 to $2,999 | 0 (0.0%) | 0 (0.0%) |
| $3,000 or more | 0 (0.0%) | 0 (0.0%) |
| Total | 11 (100.0%) | 0 (0.0%) |
Physical Housing Characteristics in Natural Bridge
Housing Structures in Natural Bridge
| Structure Type | # Housing Units | % Housing Units |
| Single Unit, Detached | 11 | 100.0% |
| Single Unit, Attached | 0 | 0.0% |
| 2 Unit Apartments | 0 | 0.0% |
| 3 or 4 Unit Apartments | 0 | 0.0% |
| 5 to 9 Unit Apartments | 0 | 0.0% |
| 10 or more Apartments | 0 | 0.0% |
| Mobile Home / Other | 0 | 0.0% |
| Total | 11 | 100.0% |
Housing Structures by Occupancy in Natural Bridge
| Structure Type | Owner-occupied | Renter-occupied |
| Single Unit, Detached | 11 (100.0%) | 0 (0.0%) |
| Single Unit, Attached | 0 (0.0%) | 0 (0.0%) |
| 2 Unit Apartments | 0 (0.0%) | 0 (0.0%) |
| 3 or 4 Unit Apartments | 0 (0.0%) | 0 (0.0%) |
| 5 to 9 Unit Apartments | 0 (0.0%) | 0 (0.0%) |
| 10 or more Apartments | 0 (0.0%) | 0 (0.0%) |
| Mobile Home / Other | 0 (0.0%) | 0 (0.0%) |
| Total | 11 (100.0%) | 0 (0.0%) |
Housing Structures by Number of Rooms in Natural Bridge
| Number of Rooms | Owner-occupied | Renter-occupied |
| 1 Room | 0 (0.0%) | 0 (0.0%) |
| 2 or 3 Rooms | 0 (0.0%) | 0 (0.0%) |
| 4 or 5 Rooms | 5 (45.5%) | 0 (0.0%) |
| 6 or 7 Rooms | 0 (0.0%) | 0 (0.0%) |
| 8 or more Rooms | 6 (54.5%) | 0 (0.0%) |
| Total | 11 (100.0%) | 0 (0.0%) |
Housing Structure by Heating Type in Natural Bridge
| Heating Type | Owner-occupied | Renter-occupied |
| Utility Gas | 0 (0.0%) | 0 (0.0%) |
| Bottled, Tank, or LP Gas | 2 (18.2%) | 0 (0.0%) |
| Electricity | 9 (81.8%) | 0 (0.0%) |
| Fuel Oil or Kerosene | 0 (0.0%) | 0 (0.0%) |
| Coal or Coke | 0 (0.0%) | 0 (0.0%) |
| All other Fuels | 0 (0.0%) | 0 (0.0%) |
| No Fuel Used | 0 (0.0%) | 0 (0.0%) |
| Total | 11 (100.0%) | 0 (0.0%) |
Household Vehicle Usage in Natural Bridge
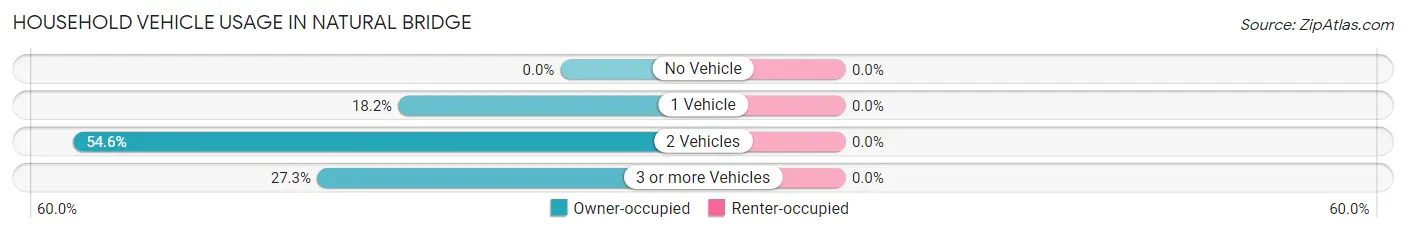
| Vehicles per Household | Owner-occupied | Renter-occupied |
| No Vehicle | 0 (0.0%) | 0 (0.0%) |
| 1 Vehicle | 2 (18.2%) | 0 (0.0%) |
| 2 Vehicles | 6 (54.5%) | 0 (0.0%) |
| 3 or more Vehicles | 3 (27.3%) | 0 (0.0%) |
| Total | 11 (100.0%) | 0 (0.0%) |
Real Estate & Mortgages in Natural Bridge
Real Estate and Mortgage Overview in Natural Bridge
| Characteristic | Without Mortgage | With Mortgage |
| Housing Units | 5 | 6 |
| Median Property Value | - | - |
| Median Household Income | $113,750 | $0 |
| Monthly Housing Costs | $242 | $0 |
| Real Estate Taxes | $263 | $0 |
Property Value by Mortgage Status in Natural Bridge
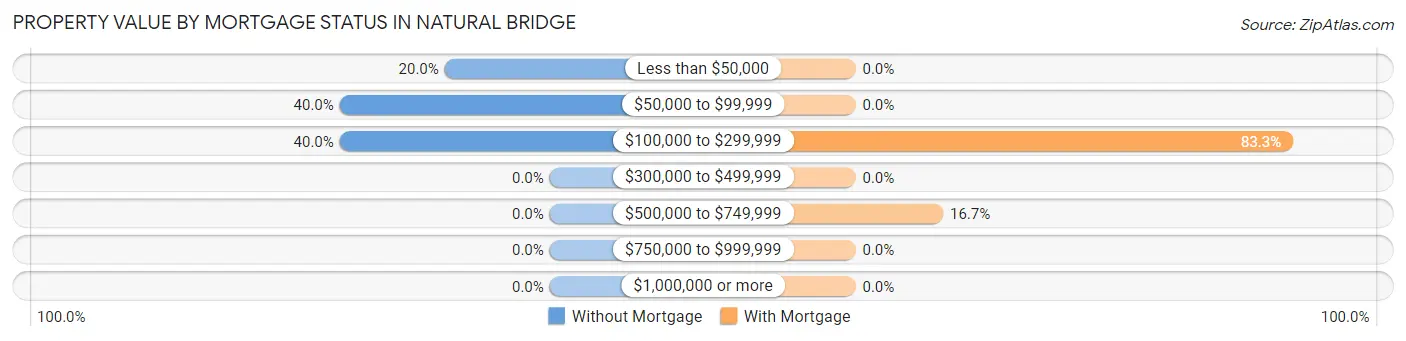
| Property Value | Without Mortgage | With Mortgage |
| Less than $50,000 | 1 (20.0%) | 0 (0.0%) |
| $50,000 to $99,999 | 2 (40.0%) | 0 (0.0%) |
| $100,000 to $299,999 | 2 (40.0%) | 5 (83.3%) |
| $300,000 to $499,999 | 0 (0.0%) | 0 (0.0%) |
| $500,000 to $749,999 | 0 (0.0%) | 1 (16.7%) |
| $750,000 to $999,999 | 0 (0.0%) | 0 (0.0%) |
| $1,000,000 or more | 0 (0.0%) | 0 (0.0%) |
| Total | 5 (100.0%) | 6 (100.0%) |
Household Income by Mortgage Status in Natural Bridge
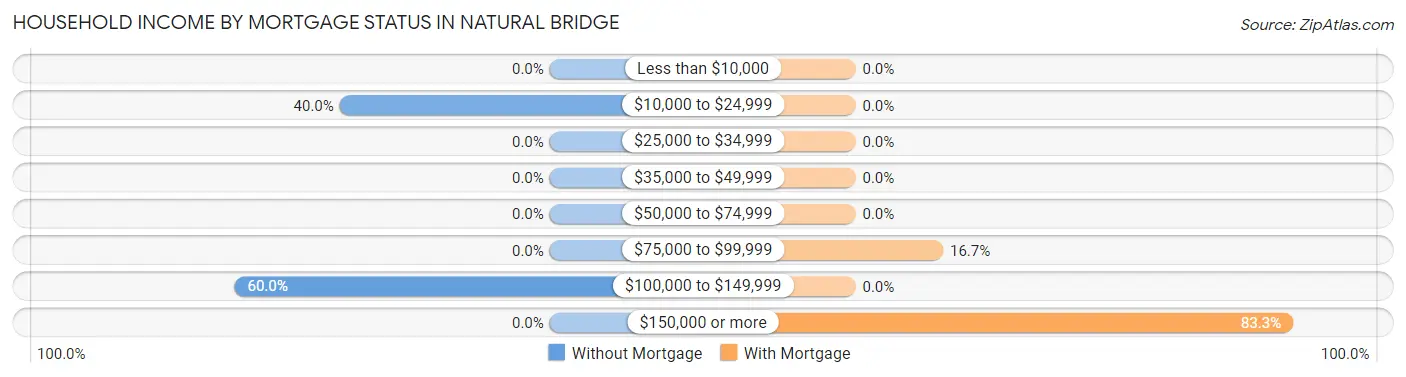
| Household Income | Without Mortgage | With Mortgage |
| Less than $10,000 | 0 (0.0%) | 0 (0.0%) |
| $10,000 to $24,999 | 2 (40.0%) | 0 (0.0%) |
| $25,000 to $34,999 | 0 (0.0%) | 0 (0.0%) |
| $35,000 to $49,999 | 0 (0.0%) | 0 (0.0%) |
| $50,000 to $74,999 | 0 (0.0%) | 0 (0.0%) |
| $75,000 to $99,999 | 0 (0.0%) | 1 (16.7%) |
| $100,000 to $149,999 | 3 (60.0%) | 0 (0.0%) |
| $150,000 or more | 0 (0.0%) | 5 (83.3%) |
| Total | 5 (100.0%) | 6 (100.0%) |
Property Value to Household Income Ratio in Natural Bridge
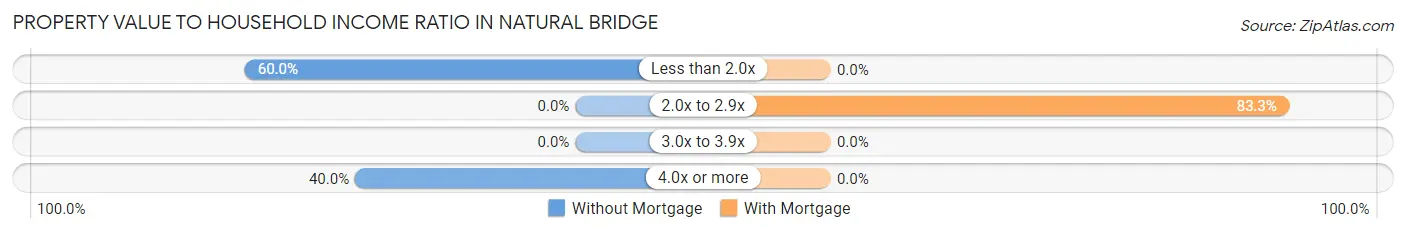
| Value-to-Income Ratio | Without Mortgage | With Mortgage |
| Less than 2.0x | 3 (60.0%) | 0 (0.0%) |
| 2.0x to 2.9x | 0 (0.0%) | 5 (83.3%) |
| 3.0x to 3.9x | 0 (0.0%) | 0 (0.0%) |
| 4.0x or more | 2 (40.0%) | 0 (0.0%) |
| Total | 5 (100.0%) | 6 (100.0%) |
Real Estate Taxes by Mortgage Status in Natural Bridge
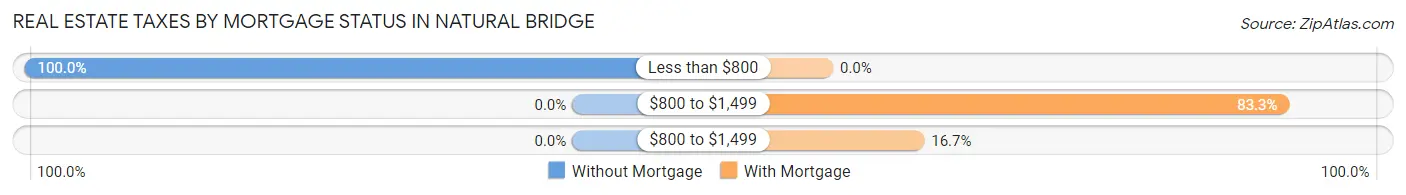
| Property Taxes | Without Mortgage | With Mortgage |
| Less than $800 | 5 (100.0%) | 0 (0.0%) |
| $800 to $1,499 | 0 (0.0%) | 5 (83.3%) |
| $800 to $1,499 | 0 (0.0%) | 1 (16.7%) |
| Total | 5 (100.0%) | 6 (100.0%) |
Health & Disability in Natural Bridge
Health Insurance Coverage by Age in Natural Bridge
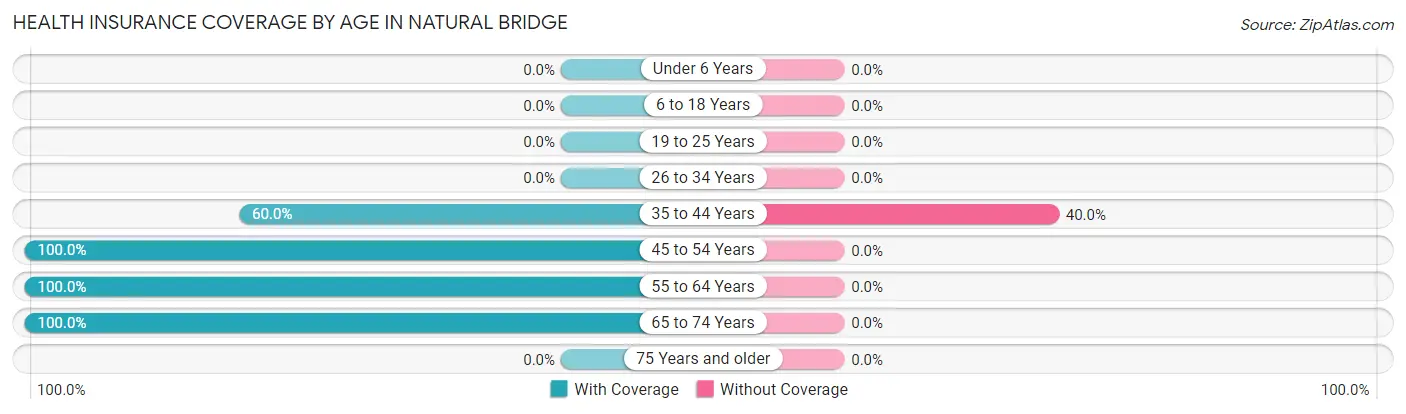
| Age Bracket | With Coverage | Without Coverage |
| Under 6 Years | 0 (0.0%) | 0 (0.0%) |
| 6 to 18 Years | 0 (0.0%) | 0 (0.0%) |
| 19 to 25 Years | 0 (0.0%) | 0 (0.0%) |
| 26 to 34 Years | 0 (0.0%) | 0 (0.0%) |
| 35 to 44 Years | 3 (60.0%) | 2 (40.0%) |
| 45 to 54 Years | 2 (100.0%) | 0 (0.0%) |
| 55 to 64 Years | 12 (100.0%) | 0 (0.0%) |
| 65 to 74 Years | 2 (100.0%) | 0 (0.0%) |
| 75 Years and older | 0 (0.0%) | 0 (0.0%) |
| Total | 19 (90.5%) | 2 (9.5%) |
Health Insurance Coverage by Citizenship Status in Natural Bridge

| Citizenship Status | With Coverage | Without Coverage |
| Native Born | 0 (0.0%) | 0 (0.0%) |
| Foreign Born, Citizen | 0 (0.0%) | 0 (0.0%) |
| Foreign Born, not a Citizen | 0 (0.0%) | 0 (0.0%) |
Health Insurance Coverage by Household Income in Natural Bridge
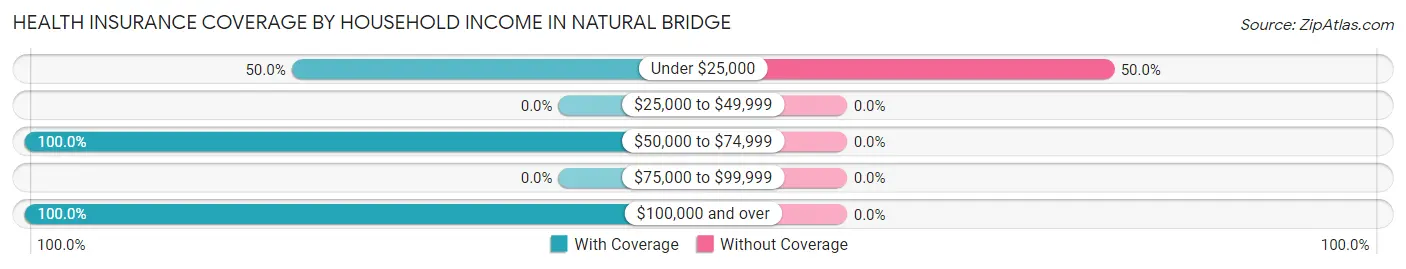
| Household Income | With Coverage | Without Coverage |
| Under $25,000 | 2 (50.0%) | 2 (50.0%) |
| $25,000 to $49,999 | 0 (0.0%) | 0 (0.0%) |
| $50,000 to $74,999 | 2 (100.0%) | 0 (0.0%) |
| $75,000 to $99,999 | 0 (0.0%) | 0 (0.0%) |
| $100,000 and over | 15 (100.0%) | 0 (0.0%) |
Public vs Private Health Insurance Coverage by Age in Natural Bridge
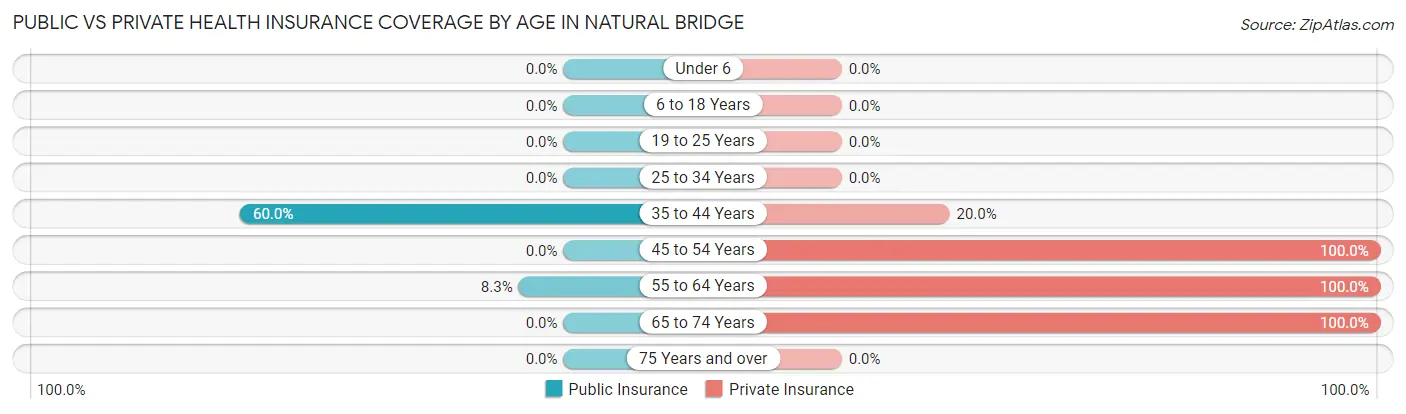
| Age Bracket | Public Insurance | Private Insurance |
| Under 6 | 0 (0.0%) | 0 (0.0%) |
| 6 to 18 Years | 0 (0.0%) | 0 (0.0%) |
| 19 to 25 Years | 0 (0.0%) | 0 (0.0%) |
| 25 to 34 Years | 0 (0.0%) | 0 (0.0%) |
| 35 to 44 Years | 3 (60.0%) | 1 (20.0%) |
| 45 to 54 Years | 0 (0.0%) | 2 (100.0%) |
| 55 to 64 Years | 1 (8.3%) | 12 (100.0%) |
| 65 to 74 Years | 0 (0.0%) | 2 (100.0%) |
| 75 Years and over | 0 (0.0%) | 0 (0.0%) |
| Total | 4 (19.1%) | 17 (80.9%) |
Disability Status by Sex by Age in Natural Bridge
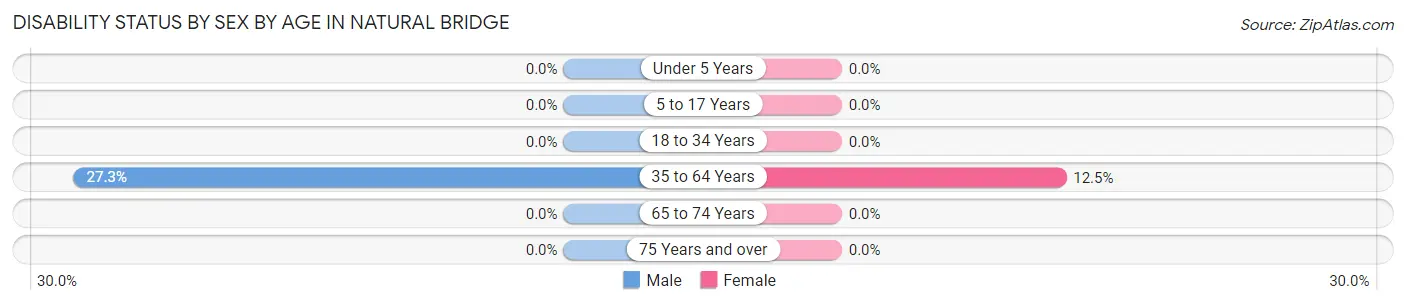
| Age Bracket | Male | Female |
| Under 5 Years | 0 (0.0%) | 0 (0.0%) |
| 5 to 17 Years | 0 (0.0%) | 0 (0.0%) |
| 18 to 34 Years | 0 (0.0%) | 0 (0.0%) |
| 35 to 64 Years | 3 (27.3%) | 1 (12.5%) |
| 65 to 74 Years | 0 (0.0%) | 0 (0.0%) |
| 75 Years and over | 0 (0.0%) | 0 (0.0%) |
Disability Class by Sex by Age in Natural Bridge
Disability Class: Hearing Difficulty
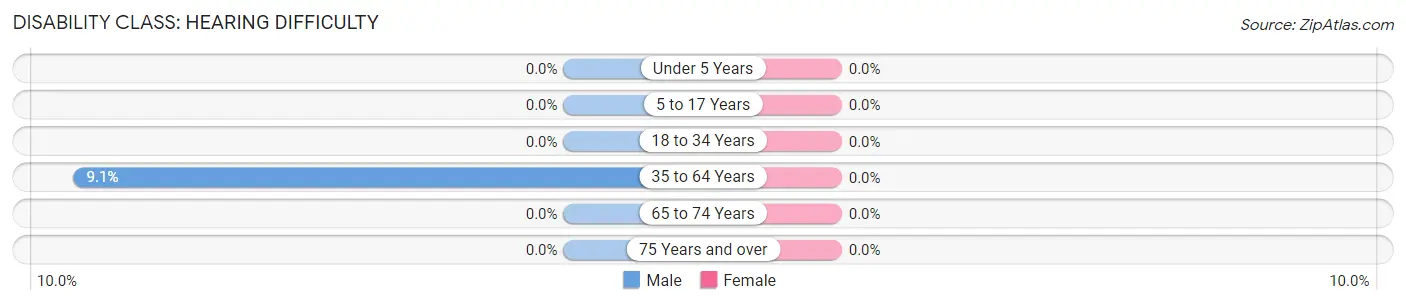
| Age Bracket | Male | Female |
| Under 5 Years | 0 (0.0%) | 0 (0.0%) |
| 5 to 17 Years | 0 (0.0%) | 0 (0.0%) |
| 18 to 34 Years | 0 (0.0%) | 0 (0.0%) |
| 35 to 64 Years | 1 (9.1%) | 0 (0.0%) |
| 65 to 74 Years | 0 (0.0%) | 0 (0.0%) |
| 75 Years and over | 0 (0.0%) | 0 (0.0%) |
Disability Class: Vision Difficulty
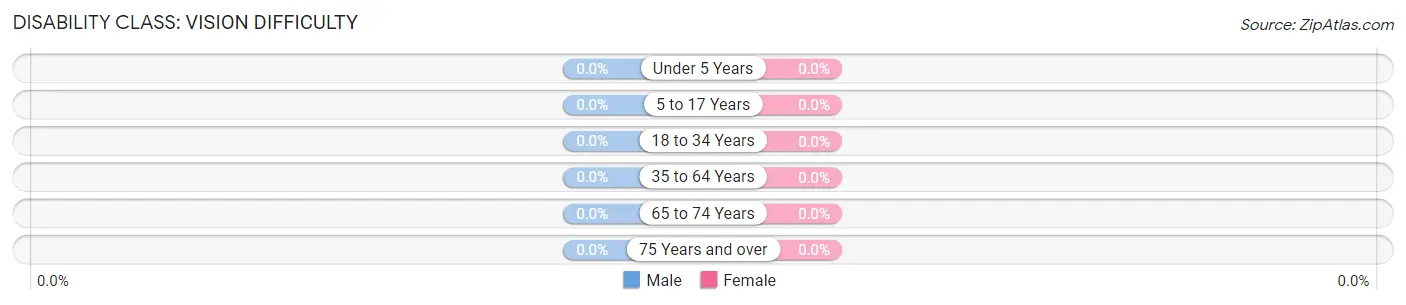
| Age Bracket | Male | Female |
| Under 5 Years | 0 (0.0%) | 0 (0.0%) |
| 5 to 17 Years | 0 (0.0%) | 0 (0.0%) |
| 18 to 34 Years | 0 (0.0%) | 0 (0.0%) |
| 35 to 64 Years | 0 (0.0%) | 0 (0.0%) |
| 65 to 74 Years | 0 (0.0%) | 0 (0.0%) |
| 75 Years and over | 0 (0.0%) | 0 (0.0%) |
Disability Class: Cognitive Difficulty
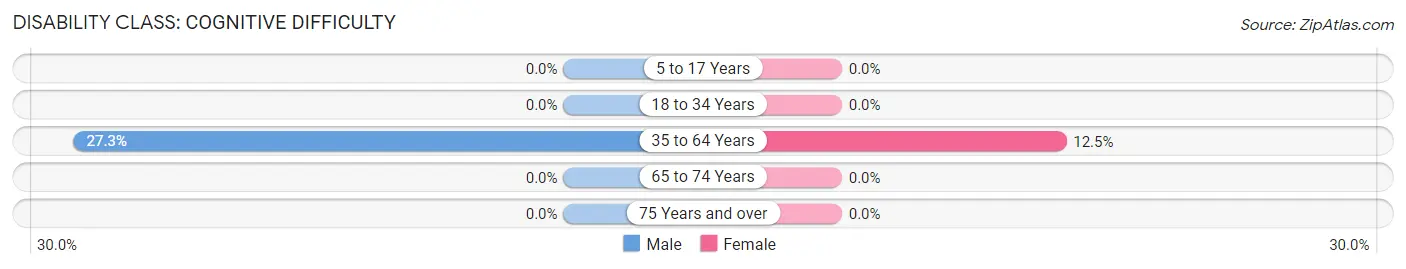
| Age Bracket | Male | Female |
| 5 to 17 Years | 0 (0.0%) | 0 (0.0%) |
| 18 to 34 Years | 0 (0.0%) | 0 (0.0%) |
| 35 to 64 Years | 3 (27.3%) | 1 (12.5%) |
| 65 to 74 Years | 0 (0.0%) | 0 (0.0%) |
| 75 Years and over | 0 (0.0%) | 0 (0.0%) |
Disability Class: Ambulatory Difficulty
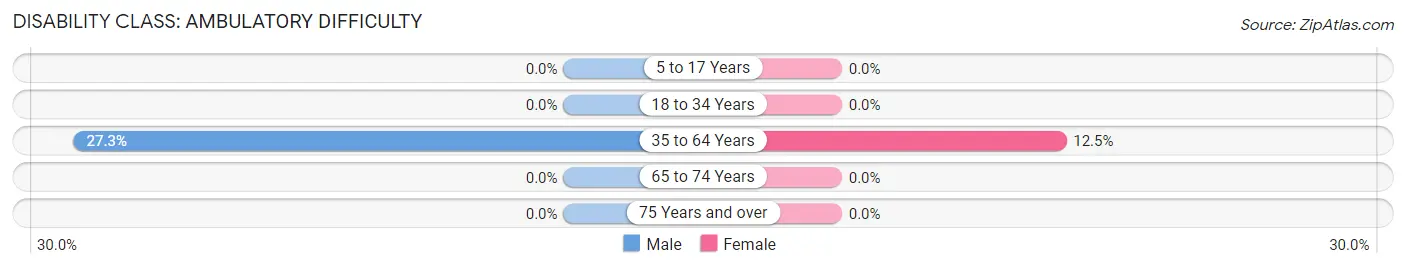
| Age Bracket | Male | Female |
| 5 to 17 Years | 0 (0.0%) | 0 (0.0%) |
| 18 to 34 Years | 0 (0.0%) | 0 (0.0%) |
| 35 to 64 Years | 3 (27.3%) | 1 (12.5%) |
| 65 to 74 Years | 0 (0.0%) | 0 (0.0%) |
| 75 Years and over | 0 (0.0%) | 0 (0.0%) |
Disability Class: Self-Care Difficulty
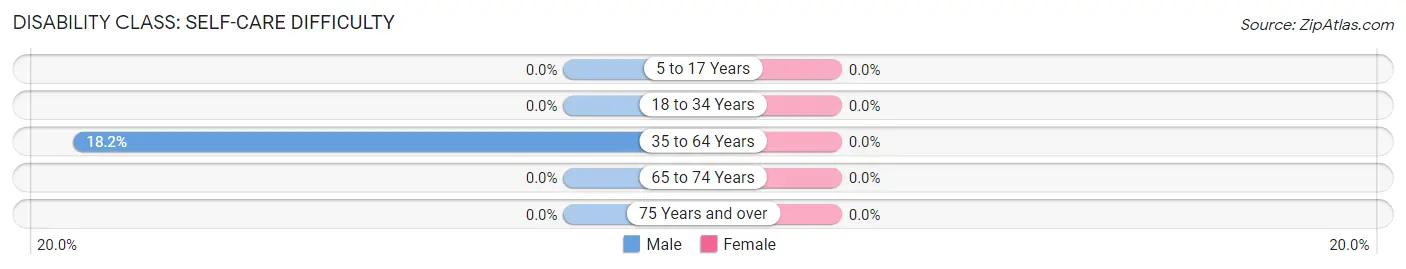
| Age Bracket | Male | Female |
| 5 to 17 Years | 0 (0.0%) | 0 (0.0%) |
| 18 to 34 Years | 0 (0.0%) | 0 (0.0%) |
| 35 to 64 Years | 2 (18.2%) | 0 (0.0%) |
| 65 to 74 Years | 0 (0.0%) | 0 (0.0%) |
| 75 Years and over | 0 (0.0%) | 0 (0.0%) |
Technology Access in Natural Bridge
Computing Device Access in Natural Bridge
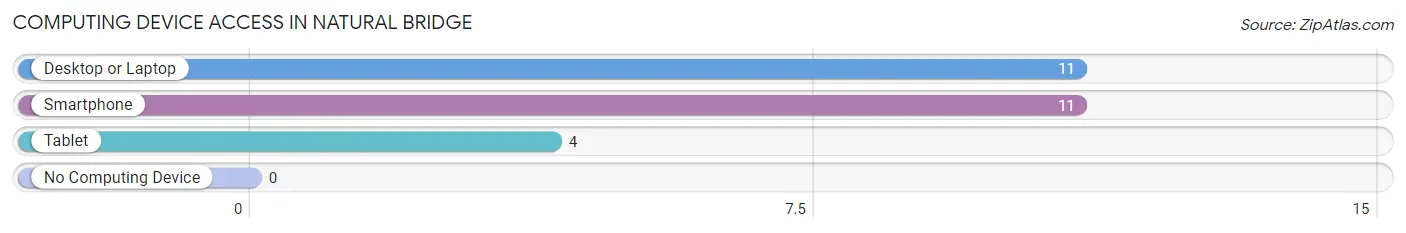
| Device Type | # Households | % Households |
| Desktop or Laptop | 11 | 100.0% |
| Smartphone | 11 | 100.0% |
| Tablet | 4 | 36.4% |
| No Computing Device | 0 | 0.0% |
| Total | 11 | 100.0% |
Internet Access in Natural Bridge
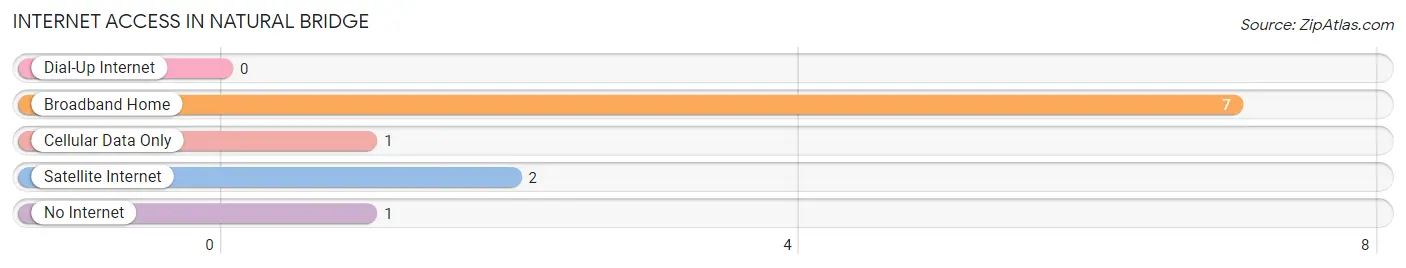
| Internet Type | # Households | % Households |
| Dial-Up Internet | 0 | 0.0% |
| Broadband Home | 7 | 63.6% |
| Cellular Data Only | 1 | 9.1% |
| Satellite Internet | 2 | 18.2% |
| No Internet | 1 | 9.1% |
| Total | 11 | 100.0% |
Natural Bridge Summary
Introduction
Natural Bridge is a small unincorporated community located in Winston County, Alabama. It is situated in the foothills of the Appalachian Mountains and is home to a population of approximately 500 people. The town is known for its natural bridge, which is a limestone arch spanning a creek. The bridge is a popular tourist attraction and is listed on the National Register of Historic Places.
History
The area around Natural Bridge has been inhabited for thousands of years. The first recorded settlers in the area were the Cherokee, who lived in the area until the early 1800s. The first European settlers arrived in the area in the early 1800s and began to establish farms and homesteads. The town of Natural Bridge was established in 1820 and was named after the natural bridge that spans the creek.
The town grew slowly over the years and by the late 1800s, it had become a popular tourist destination. The natural bridge was a popular attraction and the town was known for its mineral springs. The town also had a hotel, a general store, and a post office.
In the early 1900s, the town began to decline as the railroad bypassed the town and the mineral springs dried up. The town was nearly abandoned by the mid-1900s, but it has since seen a resurgence in popularity due to its natural beauty and its proximity to Birmingham.
Geography
Natural Bridge is located in the foothills of the Appalachian Mountains in Winston County, Alabama. The town is situated at the confluence of two creeks, the Sipsey and the Little Warrior. The town is surrounded by rolling hills and is home to a variety of wildlife, including deer, turkey, and black bear. The town is also home to the Natural Bridge, which is a limestone arch spanning the creek.
The town has a humid subtropical climate, with hot summers and mild winters. The average annual temperature is around 68°F and the average annual precipitation is around 50 inches.
Economy
The economy of Natural Bridge is largely based on tourism. The town is home to the Natural Bridge, which is a popular tourist attraction. The town also has a variety of restaurants, shops, and other businesses that cater to tourists. The town also has a few small manufacturing businesses.
Demographics
As of the 2010 census, the population of Natural Bridge was 498. The racial makeup of the town was 97.2% White, 0.6% African American, 0.2% Native American, 0.2% Asian, 0.2% from other races, and 1.8% from two or more races. The median household income was $30,000 and the median family income was $35,000. The per capita income was $14,000.
Conclusion
Natural Bridge is a small unincorporated community located in Winston County, Alabama. It is situated in the foothills of the Appalachian Mountains and is home to a population of approximately 500 people. The town is known for its natural bridge, which is a limestone arch spanning a creek. The bridge is a popular tourist attraction and is listed on the National Register of Historic Places. The economy of Natural Bridge is largely based on tourism and the town has a variety of restaurants, shops, and other businesses that cater to tourists. The town also has a few small manufacturing businesses. The population of Natural Bridge is predominantly white and the median household income is around $30,000.
Common Questions
What is the Total Population of Natural Bridge?
Total Population of Natural Bridge is 21.
What is the Total Male Population of Natural Bridge?
Total Male Population of Natural Bridge is 11.
What is the Total Female Population of Natural Bridge?
Total Female Population of Natural Bridge is 10.
What is the Ratio of Males per 100 Females in Natural Bridge?
There are 110.00 Males per 100 Females in Natural Bridge.
What is the Ratio of Females per 100 Males in Natural Bridge?
There are 90.91 Females per 100 Males in Natural Bridge.
What is the Median Population Age in Natural Bridge?
Median Population Age in Natural Bridge is 55.9 Years.
What is the Average Family Size in Natural Bridge
Average Family Size in Natural Bridge is 1.9 People.
What is the Average Household Size in Natural Bridge
Average Household Size in Natural Bridge is 1.9 People.
What is Per Capita Income in Natural Bridge?
Per Capita income in Natural Bridge is $46,233.
What is the Median Family Income in Natural Bridge?
Median Family Income in Natural Bridge is $108,750.
What is the Median Household income in Natural Bridge?
Median Household Income in Natural Bridge is $108,750.
What is Inequality or Gini Index in Natural Bridge?
Inequality or Gini Index in Natural Bridge is 0.22.
How Large is the Labor Force in Natural Bridge?
There are 15 People in the Labor Forcein in Natural Bridge.
What is the Percentage of People in the Labor Force in Natural Bridge?
71.4% of People are in the Labor Force in Natural Bridge.