Magnolia Springs, AL
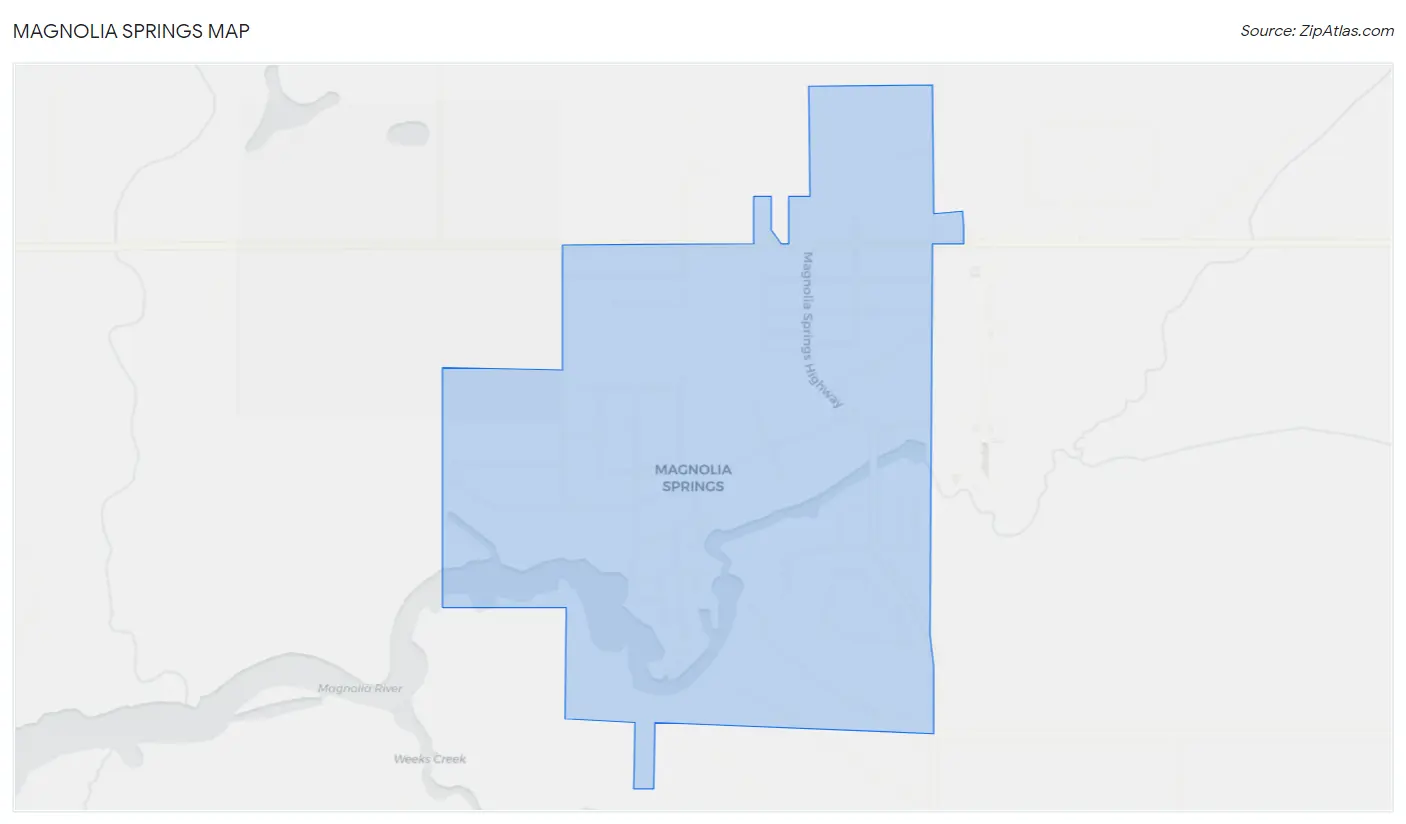
Magnolia Springs Map
Magnolia Springs Overview
1,325
TOTAL POPULATION
598
MALE POPULATION
727
FEMALE POPULATION
82.26
MALES / 100 FEMALES
121.57
FEMALES / 100 MALES
48.6
MEDIAN AGE
3.4
AVG FAMILY SIZE
2.8
AVG HOUSEHOLD SIZE
$43,796
PER CAPITA INCOME
$102,366
AVG FAMILY INCOME
$88,583
AVG HOUSEHOLD INCOME
30.2%
WAGE / INCOME GAP [ % ]
69.8¢/ $1
WAGE / INCOME GAP [ $ ]
$23,884
FAMILY INCOME DEFICIT
0.47
INEQUALITY / GINI INDEX
620
LABOR FORCE [ PEOPLE ]
56.8%
PERCENT IN LABOR FORCE
2.3%
UNEMPLOYMENT RATE
Magnolia Springs Zip Codes
Magnolia Springs Area Codes
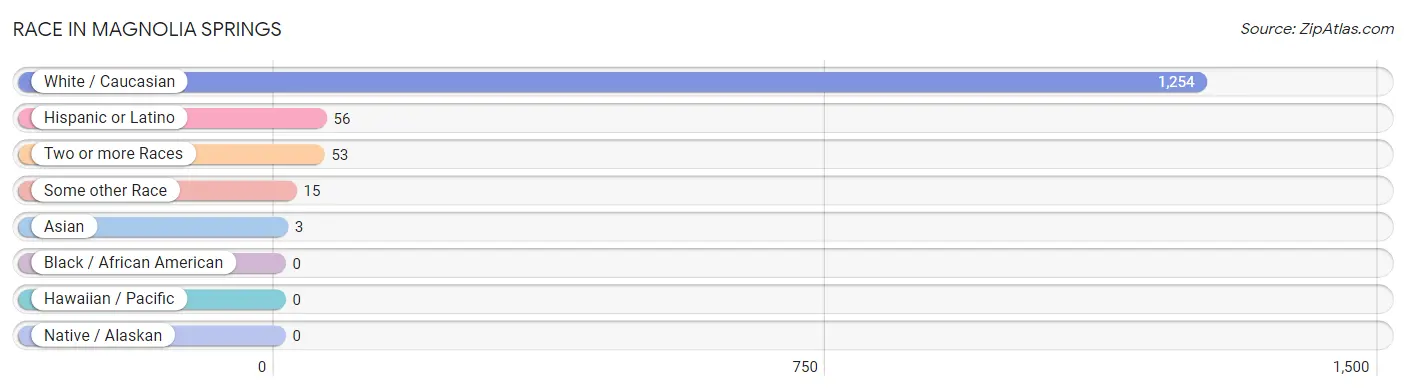
Race in Magnolia Springs
The most populous races in Magnolia Springs are White / Caucasian (1,254 | 94.6%), Hispanic or Latino (56 | 4.2%), and Two or more Races (53 | 4.0%).
| Race | # Population | % Population |
| Asian | 3 | 0.2% |
| Black / African American | 0 | 0.0% |
| Hawaiian / Pacific | 0 | 0.0% |
| Hispanic or Latino | 56 | 4.2% |
| Native / Alaskan | 0 | 0.0% |
| White / Caucasian | 1,254 | 94.6% |
| Two or more Races | 53 | 4.0% |
| Some other Race | 15 | 1.1% |
| Total | 1,325 | 100.0% |
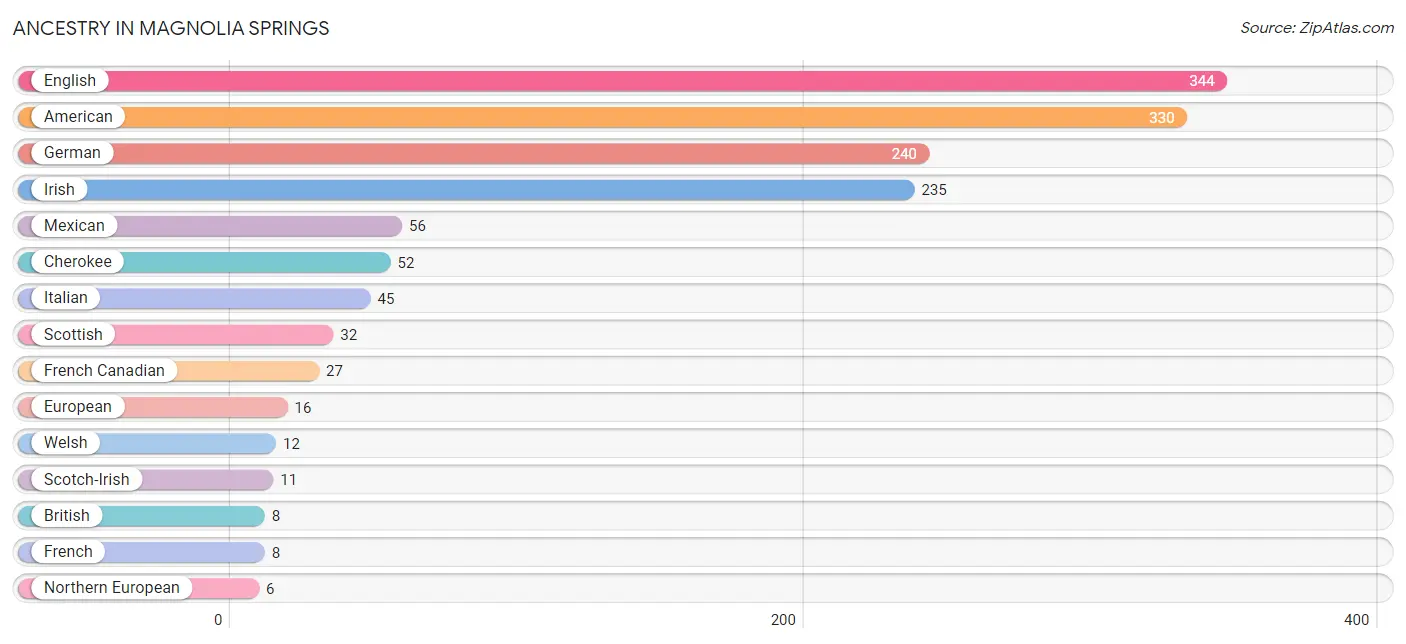
Ancestry in Magnolia Springs
The most populous ancestries reported in Magnolia Springs are English (344 | 26.0%), American (330 | 24.9%), German (240 | 18.1%), Irish (235 | 17.7%), and Mexican (56 | 4.2%), together accounting for 90.9% of all Magnolia Springs residents.
| Ancestry | # Population | % Population |
| American | 330 | 24.9% |
| Arab | 3 | 0.2% |
| Austrian | 4 | 0.3% |
| Belgian | 3 | 0.2% |
| Bhutanese | 2 | 0.2% |
| British | 8 | 0.6% |
| Burmese | 1 | 0.1% |
| Cherokee | 52 | 3.9% |
| Danish | 4 | 0.3% |
| Dutch | 3 | 0.2% |
| English | 344 | 26.0% |
| European | 16 | 1.2% |
| French | 8 | 0.6% |
| French Canadian | 27 | 2.0% |
| German | 240 | 18.1% |
| Irish | 235 | 17.7% |
| Italian | 45 | 3.4% |
| Mexican | 56 | 4.2% |
| New Zealander | 4 | 0.3% |
| Northern European | 6 | 0.4% |
| Norwegian | 3 | 0.2% |
| Polish | 3 | 0.2% |
| Scandinavian | 3 | 0.2% |
| Scotch-Irish | 11 | 0.8% |
| Scottish | 32 | 2.4% |
| Swedish | 3 | 0.2% |
| Swiss | 4 | 0.3% |
| Syrian | 3 | 0.2% |
| Welsh | 12 | 0.9% | View All 29 Rows |
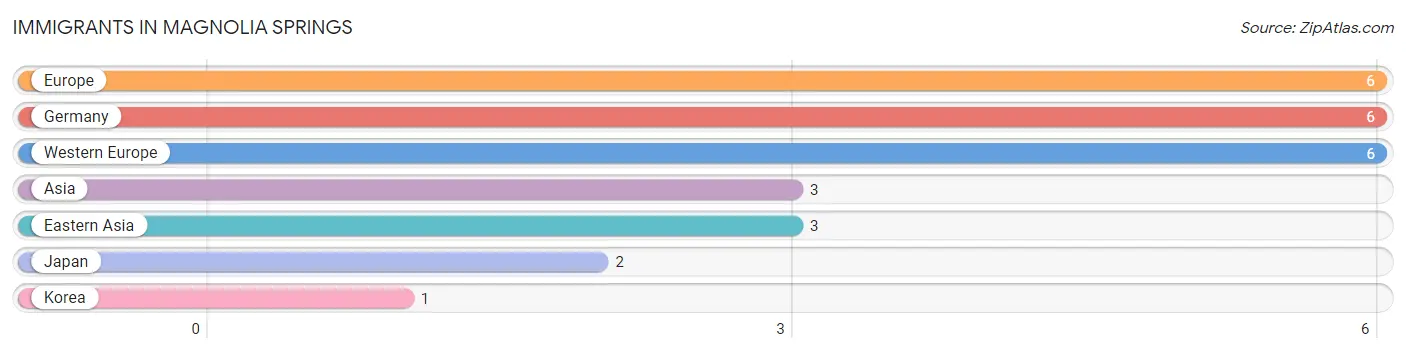
Immigrants in Magnolia Springs
The most numerous immigrant groups reported in Magnolia Springs came from Europe (6 | 0.4%), Germany (6 | 0.4%), Western Europe (6 | 0.4%), Asia (3 | 0.2%), and Eastern Asia (3 | 0.2%), together accounting for 1.8% of all Magnolia Springs residents.
| Immigration Origin | # Population | % Population |
| Asia | 3 | 0.2% |
| Eastern Asia | 3 | 0.2% |
| Europe | 6 | 0.4% |
| Germany | 6 | 0.4% |
| Japan | 2 | 0.2% |
| Korea | 1 | 0.1% |
| Western Europe | 6 | 0.4% | View All 7 Rows |
Sex and Age in Magnolia Springs
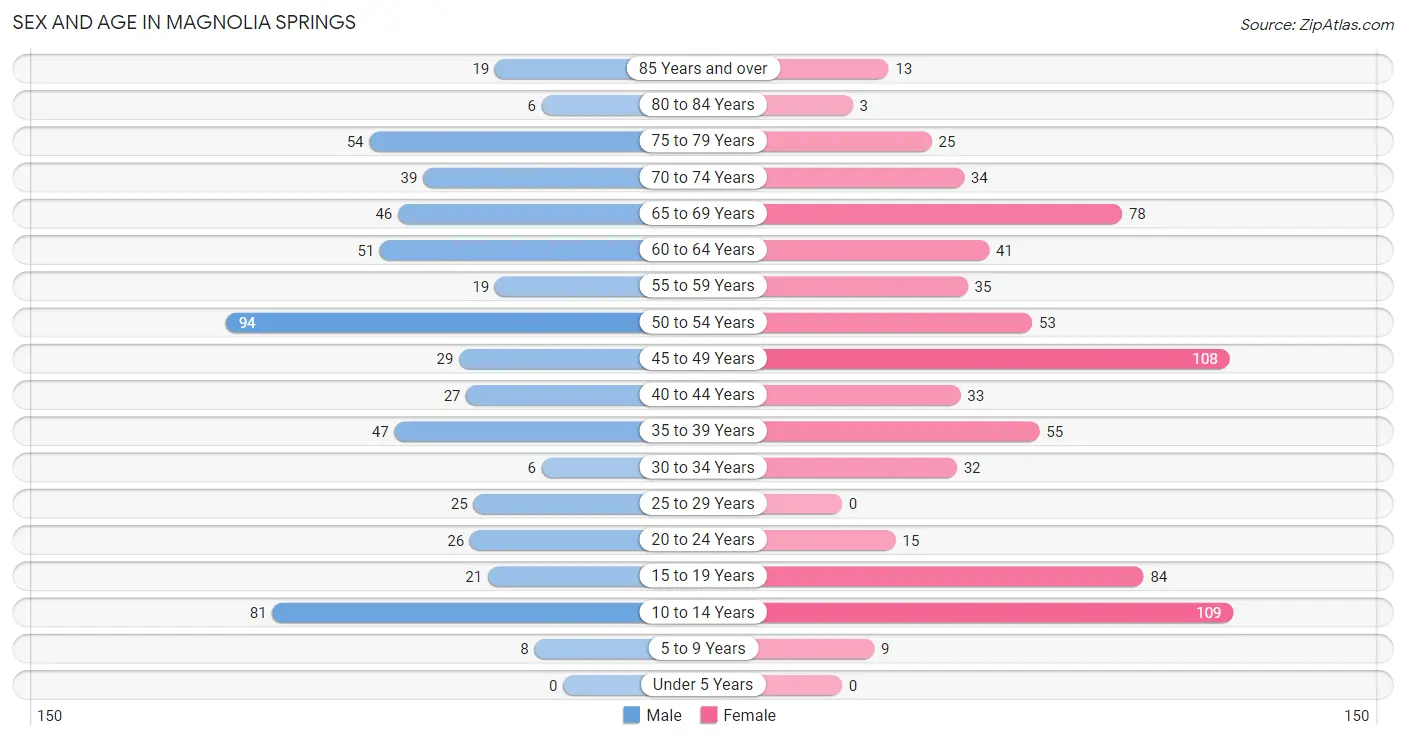
Sex and Age in Magnolia Springs
The most populous age groups in Magnolia Springs are 50 to 54 Years (94 | 15.7%) for men and 10 to 14 Years (109 | 15.0%) for women.
| Age Bracket | Male | Female |
| Under 5 Years | 0 (0.0%) | 0 (0.0%) |
| 5 to 9 Years | 8 (1.3%) | 9 (1.2%) |
| 10 to 14 Years | 81 (13.6%) | 109 (15.0%) |
| 15 to 19 Years | 21 (3.5%) | 84 (11.6%) |
| 20 to 24 Years | 26 (4.3%) | 15 (2.1%) |
| 25 to 29 Years | 25 (4.2%) | 0 (0.0%) |
| 30 to 34 Years | 6 (1.0%) | 32 (4.4%) |
| 35 to 39 Years | 47 (7.9%) | 55 (7.6%) |
| 40 to 44 Years | 27 (4.5%) | 33 (4.5%) |
| 45 to 49 Years | 29 (4.9%) | 108 (14.9%) |
| 50 to 54 Years | 94 (15.7%) | 53 (7.3%) |
| 55 to 59 Years | 19 (3.2%) | 35 (4.8%) |
| 60 to 64 Years | 51 (8.5%) | 41 (5.6%) |
| 65 to 69 Years | 46 (7.7%) | 78 (10.7%) |
| 70 to 74 Years | 39 (6.5%) | 34 (4.7%) |
| 75 to 79 Years | 54 (9.0%) | 25 (3.4%) |
| 80 to 84 Years | 6 (1.0%) | 3 (0.4%) |
| 85 Years and over | 19 (3.2%) | 13 (1.8%) |
| Total | 598 (100.0%) | 727 (100.0%) |
Families and Households in Magnolia Springs
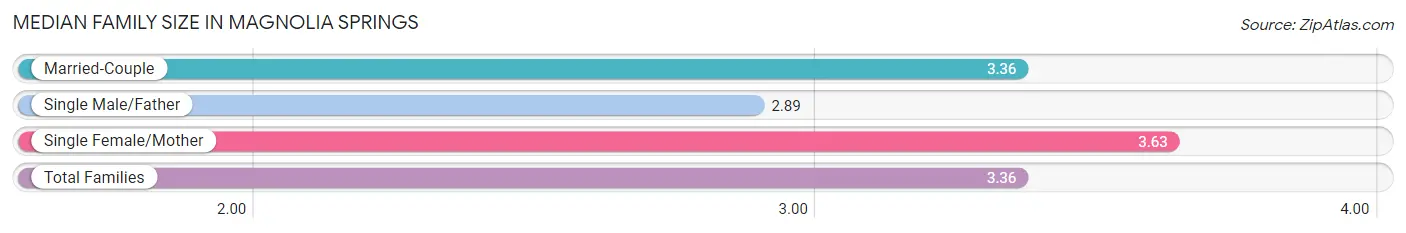
Median Family Size in Magnolia Springs
The median family size in Magnolia Springs is 3.36 persons per family, with single female/mother families (19 | 5.4%) accounting for the largest median family size of 3.63 persons per family. On the other hand, single male/father families (9 | 2.6%) represent the smallest median family size with 2.89 persons per family.
| Family Type | # Families | Family Size |
| Married-Couple | 323 (92.0%) | 3.36 |
| Single Male/Father | 9 (2.6%) | 2.89 |
| Single Female/Mother | 19 (5.4%) | 3.63 |
| Total Families | 351 (100.0%) | 3.36 |
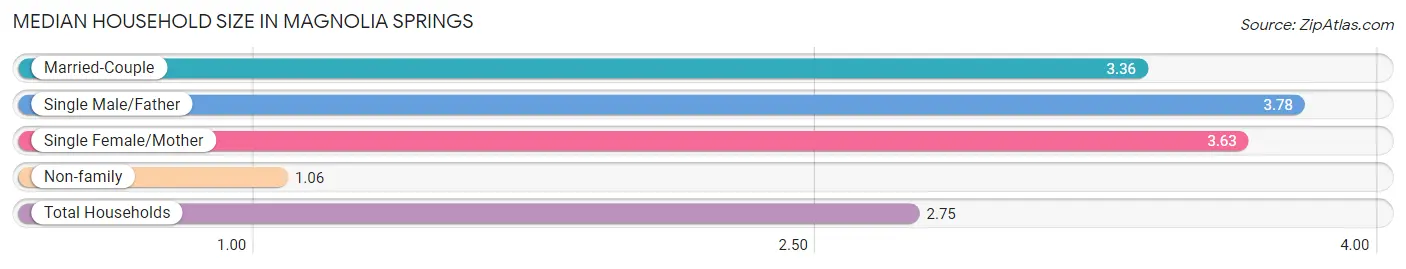
Median Household Size in Magnolia Springs
The median household size in Magnolia Springs is 2.75 persons per household, with single male/father households (9 | 1.9%) accounting for the largest median household size of 3.78 persons per household. non-family households (130 | 27.0%) represent the smallest median household size with 1.06 persons per household.
| Household Type | # Households | Household Size |
| Married-Couple | 323 (67.1%) | 3.36 |
| Single Male/Father | 9 (1.9%) | 3.78 |
| Single Female/Mother | 19 (4.0%) | 3.63 |
| Non-family | 130 (27.0%) | 1.06 |
| Total Households | 481 (100.0%) | 2.75 |
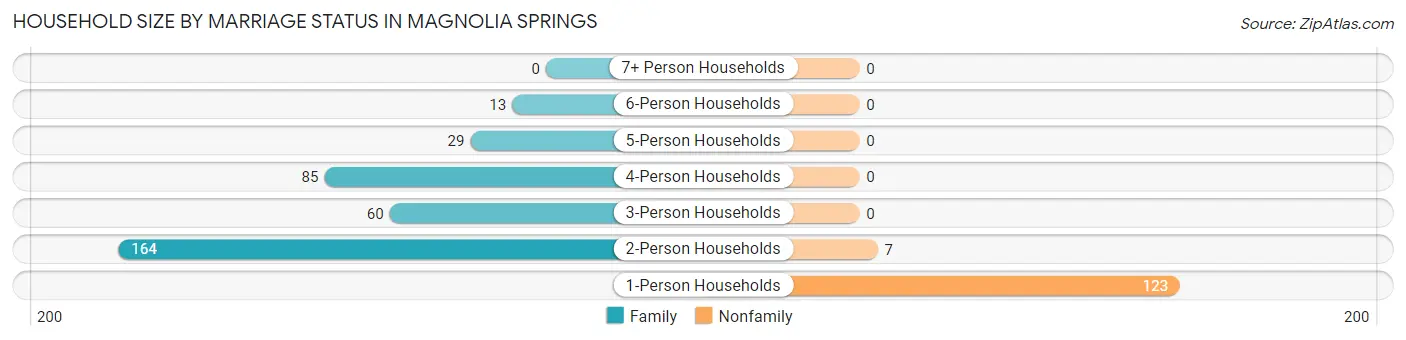
Household Size by Marriage Status in Magnolia Springs
Out of a total of 481 households in Magnolia Springs, 351 (73.0%) are family households, while 130 (27.0%) are nonfamily households. The most numerous type of family households are 2-person households, comprising 164, and the most common type of nonfamily households are 1-person households, comprising 123.
| Household Size | Family Households | Nonfamily Households |
| 1-Person Households | - | 123 (25.6%) |
| 2-Person Households | 164 (34.1%) | 7 (1.5%) |
| 3-Person Households | 60 (12.5%) | 0 (0.0%) |
| 4-Person Households | 85 (17.7%) | 0 (0.0%) |
| 5-Person Households | 29 (6.0%) | 0 (0.0%) |
| 6-Person Households | 13 (2.7%) | 0 (0.0%) |
| 7+ Person Households | 0 (0.0%) | 0 (0.0%) |
| Total | 351 (73.0%) | 130 (27.0%) |
Female Fertility in Magnolia Springs
Fertility by Age in Magnolia Springs
| Age Bracket | Women with Births | Births / 1,000 Women |
| 15 to 19 years | 0 (0.0%) | 0.0 |
| 20 to 34 years | 0 (0.0%) | 0.0 |
| 35 to 50 years | 0 (0.0%) | 0.0 |
| Total | 0 (0.0%) | 0.0 |
Fertility by Age by Marriage Status in Magnolia Springs

| Age Bracket | Married | Unmarried |
| 15 to 19 years | 0 (0.0%) | 0 (0.0%) |
| 20 to 34 years | 0 (0.0%) | 0 (0.0%) |
| 35 to 50 years | 0 (0.0%) | 0 (0.0%) |
| Total | 0 (0.0%) | 0 (0.0%) |
Fertility by Education in Magnolia Springs
| Educational Attainment | Women with Births | Births / 1,000 Women |
| Less than High School | 0 (0.0%) | 0.0 |
| High School Diploma | 0 (0.0%) | 0.0 |
| College or Associate's Degree | 0 (0.0%) | 0.0 |
| Bachelor's Degree | 0 (0.0%) | 0.0 |
| Graduate Degree | 0 (0.0%) | 0.0 |
| Total | 0 (0.0%) | 0.0 |
Fertility by Education by Marriage Status in Magnolia Springs
| Educational Attainment | Married | Unmarried |
| Less than High School | 0 (0.0%) | 0 (0.0%) |
| High School Diploma | 0 (0.0%) | 0 (0.0%) |
| College or Associate's Degree | 0 (0.0%) | 0 (0.0%) |
| Bachelor's Degree | 0 (0.0%) | 0 (0.0%) |
| Graduate Degree | 0 (0.0%) | 0 (0.0%) |
| Total | 0 (0.0%) | 0 (0.0%) |
Income in Magnolia Springs
Income Overview in Magnolia Springs
Per Capita Income in Magnolia Springs is $43,796, while median incomes of families and households are $102,366 and $88,583 respectively.
| Characteristic | Number | Measure |
| Per Capita Income | 1,325 | $43,796 |
| Median Family Income | 351 | $102,366 |
| Mean Family Income | 351 | $131,111 |
| Median Household Income | 481 | $88,583 |
| Mean Household Income | 481 | $111,233 |
| Income Deficit | 351 | $23,884 |
| Wage / Income Gap (%) | 1,325 | 30.19% |
| Wage / Income Gap ($) | 1,325 | 69.81¢ per $1 |
| Gini / Inequality Index | 1,325 | 0.47 |
Earnings by Sex in Magnolia Springs
Average Earnings in Magnolia Springs are $47,813, $57,500 for men and $40,139 for women, a difference of 30.2%.
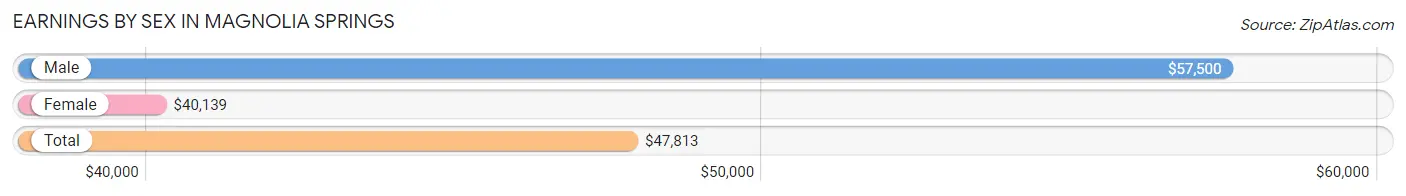
| Sex | Number | Average Earnings |
| Male | 284 (45.7%) | $57,500 |
| Female | 337 (54.3%) | $40,139 |
| Total | 621 (100.0%) | $47,813 |
Earnings by Sex by Income Bracket in Magnolia Springs
The most common earnings brackets in Magnolia Springs are $100,000+ for men (85 | 29.9%) and $100,000+ for women (70 | 20.8%).
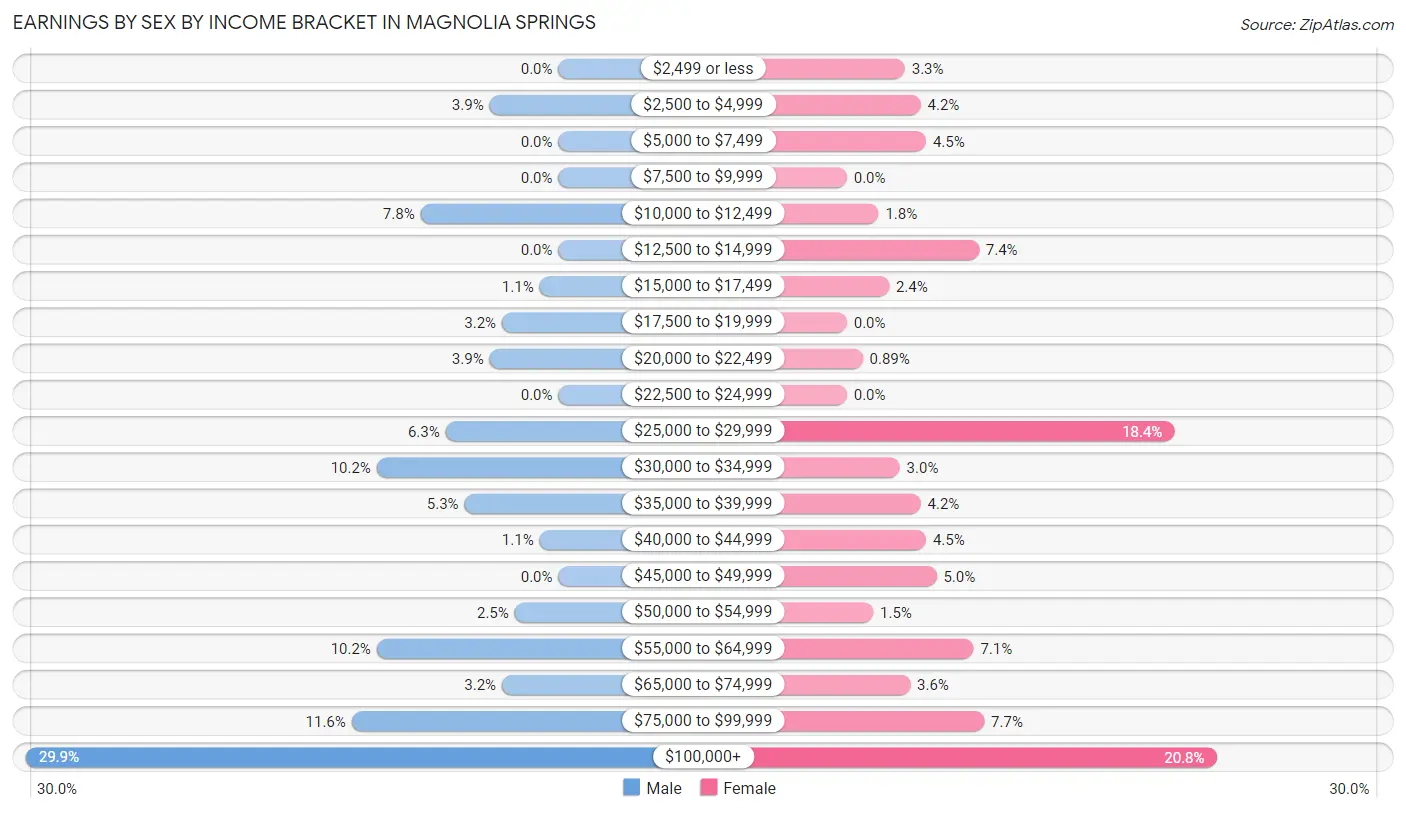
| Income | Male | Female |
| $2,499 or less | 0 (0.0%) | 11 (3.3%) |
| $2,500 to $4,999 | 11 (3.9%) | 14 (4.2%) |
| $5,000 to $7,499 | 0 (0.0%) | 15 (4.4%) |
| $7,500 to $9,999 | 0 (0.0%) | 0 (0.0%) |
| $10,000 to $12,499 | 22 (7.7%) | 6 (1.8%) |
| $12,500 to $14,999 | 0 (0.0%) | 25 (7.4%) |
| $15,000 to $17,499 | 3 (1.1%) | 8 (2.4%) |
| $17,500 to $19,999 | 9 (3.2%) | 0 (0.0%) |
| $20,000 to $22,499 | 11 (3.9%) | 3 (0.9%) |
| $22,500 to $24,999 | 0 (0.0%) | 0 (0.0%) |
| $25,000 to $29,999 | 18 (6.3%) | 62 (18.4%) |
| $30,000 to $34,999 | 29 (10.2%) | 10 (3.0%) |
| $35,000 to $39,999 | 15 (5.3%) | 14 (4.2%) |
| $40,000 to $44,999 | 3 (1.1%) | 15 (4.4%) |
| $45,000 to $49,999 | 0 (0.0%) | 17 (5.0%) |
| $50,000 to $54,999 | 7 (2.5%) | 5 (1.5%) |
| $55,000 to $64,999 | 29 (10.2%) | 24 (7.1%) |
| $65,000 to $74,999 | 9 (3.2%) | 12 (3.6%) |
| $75,000 to $99,999 | 33 (11.6%) | 26 (7.7%) |
| $100,000+ | 85 (29.9%) | 70 (20.8%) |
| Total | 284 (100.0%) | 337 (100.0%) |
Earnings by Sex by Educational Attainment in Magnolia Springs
Average earnings in Magnolia Springs are $65,000 for men and $47,604 for women, a difference of 26.8%. Men with an educational attainment of graduate degree enjoy the highest average annual earnings of $148,375, while those with college or associate's degree education earn the least with $85,391. Women with an educational attainment of graduate degree earn the most with the average annual earnings of $131,058, while those with college or associate's degree education have the smallest earnings of $27,759.
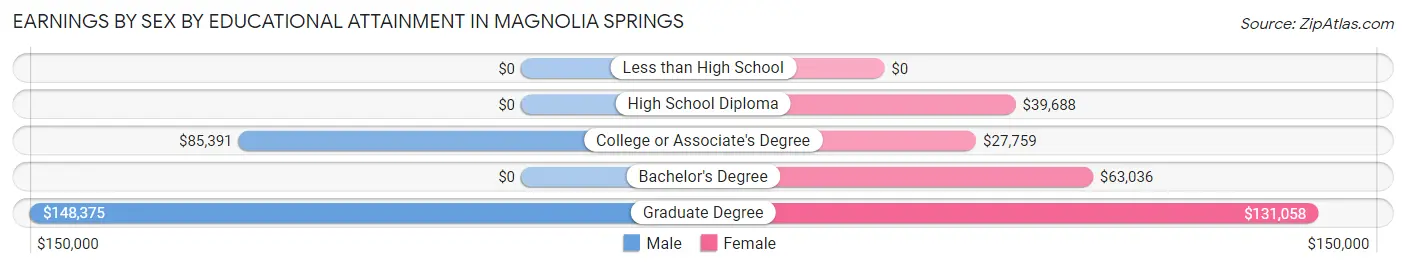
| Educational Attainment | Male Income | Female Income |
| Less than High School | - | - |
| High School Diploma | - | - |
| College or Associate's Degree | $85,391 | $27,759 |
| Bachelor's Degree | - | - |
| Graduate Degree | $148,375 | $131,058 |
| Total | $65,000 | $47,604 |
Family Income in Magnolia Springs
Family Income Brackets in Magnolia Springs
According to the Magnolia Springs family income data, there are 88 families falling into the $100,000 to $149,999 income range, which is the most common income bracket and makes up 25.1% of all families.
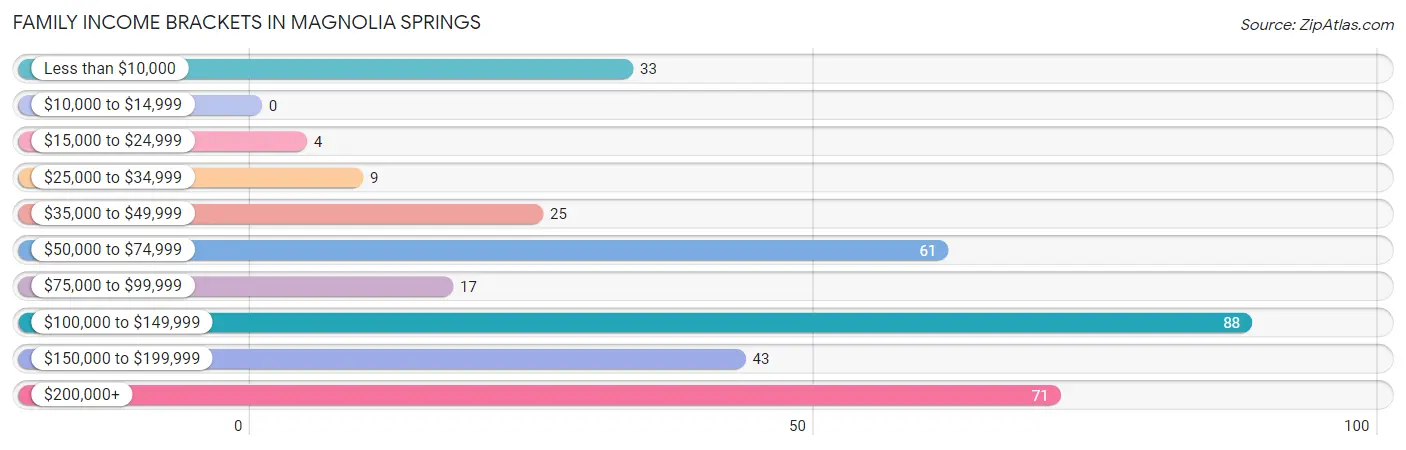
| Income Bracket | # Families | % Families |
| Less than $10,000 | 33 | 9.4% |
| $10,000 to $14,999 | 0 | 0.0% |
| $15,000 to $24,999 | 4 | 1.1% |
| $25,000 to $34,999 | 9 | 2.6% |
| $35,000 to $49,999 | 25 | 7.1% |
| $50,000 to $74,999 | 61 | 17.4% |
| $75,000 to $99,999 | 17 | 4.8% |
| $100,000 to $149,999 | 88 | 25.1% |
| $150,000 to $199,999 | 43 | 12.3% |
| $200,000+ | 71 | 20.2% |
Family Income by Famaliy Size in Magnolia Springs
5-person families (29 | 8.3%) account for the highest median family income in Magnolia Springs with $161,042 per family, while 2-person families (164 | 46.7%) have the highest median income of $50,278 per family member.
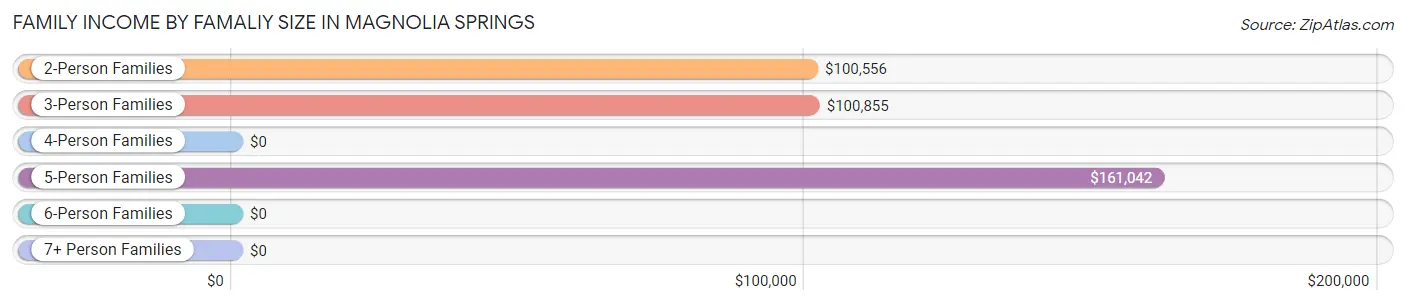
| Income Bracket | # Families | Median Income |
| 2-Person Families | 164 (46.7%) | $100,556 |
| 3-Person Families | 69 (19.7%) | $100,855 |
| 4-Person Families | 76 (21.6%) | $0 |
| 5-Person Families | 29 (8.3%) | $161,042 |
| 6-Person Families | 13 (3.7%) | $0 |
| 7+ Person Families | 0 (0.0%) | $0 |
| Total | 351 (100.0%) | $102,366 |
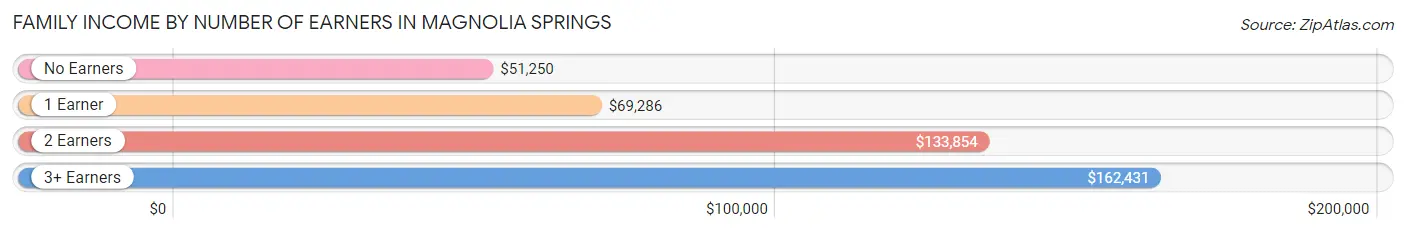
Family Income by Number of Earners in Magnolia Springs
The median family income in Magnolia Springs is $102,366, with families comprising 3+ earners (47) having the highest median family income of $162,431, while families with no earners (101) have the lowest median family income of $51,250, accounting for 13.4% and 28.8% of families, respectively.
| Number of Earners | # Families | Median Income |
| No Earners | 101 (28.8%) | $51,250 |
| 1 Earner | 88 (25.1%) | $69,286 |
| 2 Earners | 115 (32.8%) | $133,854 |
| 3+ Earners | 47 (13.4%) | $162,431 |
| Total | 351 (100.0%) | $102,366 |
Household Income in Magnolia Springs
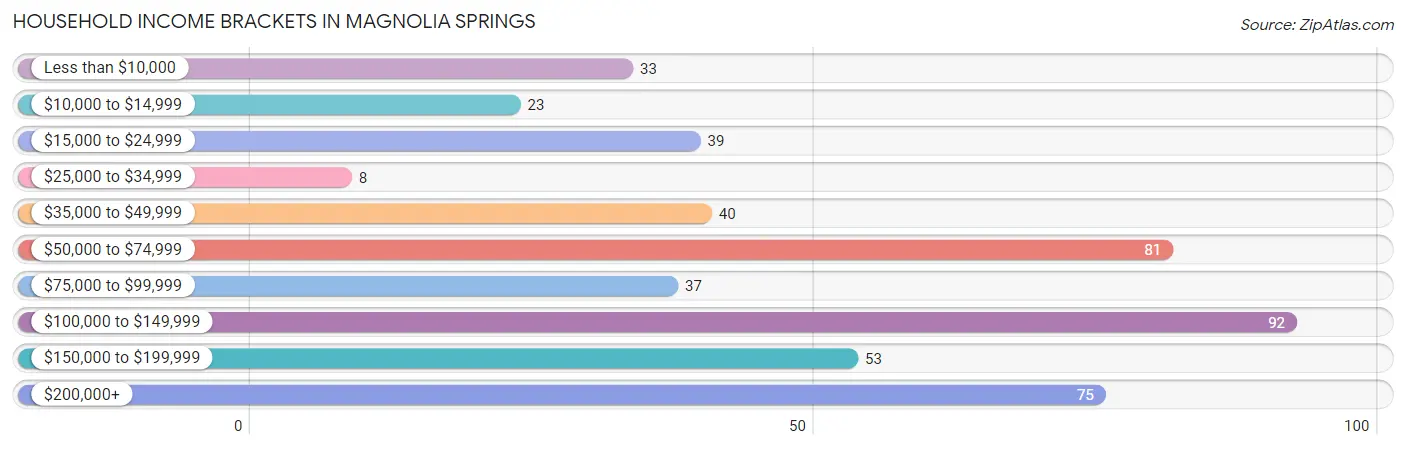
Household Income Brackets in Magnolia Springs
With 92 households falling in the category, the $100,000 to $149,999 income range is the most frequent in Magnolia Springs, accounting for 19.1% of all households. In contrast, only 8 households (1.7%) fall into the $25,000 to $34,999 income bracket, making it the least populous group.
| Income Bracket | # Households | % Households |
| Less than $10,000 | 33 | 6.9% |
| $10,000 to $14,999 | 23 | 4.8% |
| $15,000 to $24,999 | 39 | 8.1% |
| $25,000 to $34,999 | 8 | 1.7% |
| $35,000 to $49,999 | 40 | 8.3% |
| $50,000 to $74,999 | 81 | 16.8% |
| $75,000 to $99,999 | 37 | 7.7% |
| $100,000 to $149,999 | 92 | 19.1% |
| $150,000 to $199,999 | 53 | 11.0% |
| $200,000+ | 75 | 15.6% |
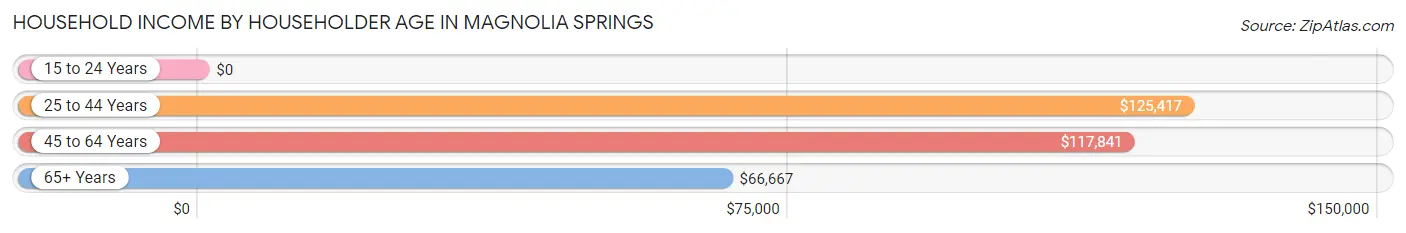
Household Income by Householder Age in Magnolia Springs
The median household income in Magnolia Springs is $88,583, with the highest median household income of $125,417 found in the 25 to 44 years age bracket for the primary householder. A total of 70 households (14.5%) fall into this category. Meanwhile, the 15 to 24 years age bracket for the primary householder has the lowest median household income of $0, with 4 households (0.8%) in this group.
| Income Bracket | # Households | Median Income |
| 15 to 24 Years | 4 (0.8%) | $0 |
| 25 to 44 Years | 70 (14.5%) | $125,417 |
| 45 to 64 Years | 203 (42.2%) | $117,841 |
| 65+ Years | 204 (42.4%) | $66,667 |
| Total | 481 (100.0%) | $88,583 |
Poverty in Magnolia Springs
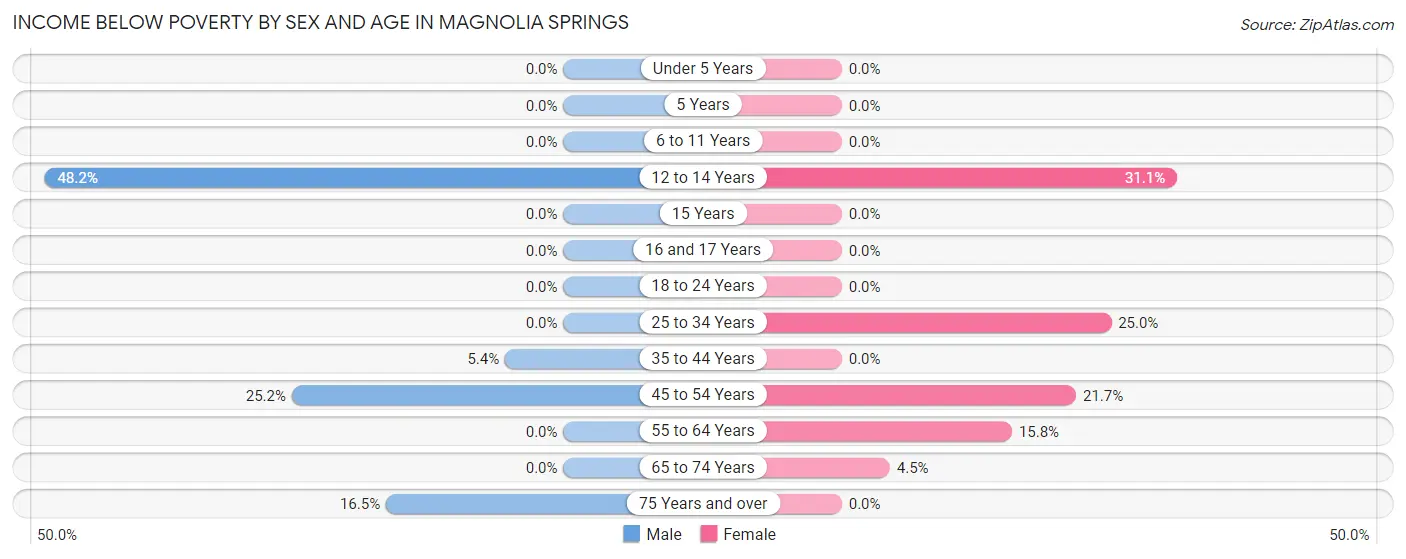
Income Below Poverty by Sex and Age in Magnolia Springs
With 12.4% poverty level for males and 12.1% for females among the residents of Magnolia Springs, 12 to 14 year old males and 12 to 14 year old females are the most vulnerable to poverty, with 26 males (48.1%) and 28 females (31.1%) in their respective age groups living below the poverty level.
| Age Bracket | Male | Female |
| Under 5 Years | 0 (0.0%) | 0 (0.0%) |
| 5 Years | 0 (0.0%) | 0 (0.0%) |
| 6 to 11 Years | 0 (0.0%) | 0 (0.0%) |
| 12 to 14 Years | 26 (48.1%) | 28 (31.1%) |
| 15 Years | 0 (0.0%) | 0 (0.0%) |
| 16 and 17 Years | 0 (0.0%) | 0 (0.0%) |
| 18 to 24 Years | 0 (0.0%) | 0 (0.0%) |
| 25 to 34 Years | 0 (0.0%) | 8 (25.0%) |
| 35 to 44 Years | 4 (5.4%) | 0 (0.0%) |
| 45 to 54 Years | 31 (25.2%) | 35 (21.7%) |
| 55 to 64 Years | 0 (0.0%) | 12 (15.8%) |
| 65 to 74 Years | 0 (0.0%) | 5 (4.5%) |
| 75 Years and over | 13 (16.5%) | 0 (0.0%) |
| Total | 74 (12.4%) | 88 (12.1%) |
Income Above Poverty by Sex and Age in Magnolia Springs
According to the poverty statistics in Magnolia Springs, males aged 5 years and females aged 6 to 11 years are the age groups that are most secure financially, with 100.0% of males and 100.0% of females in these age groups living above the poverty line.
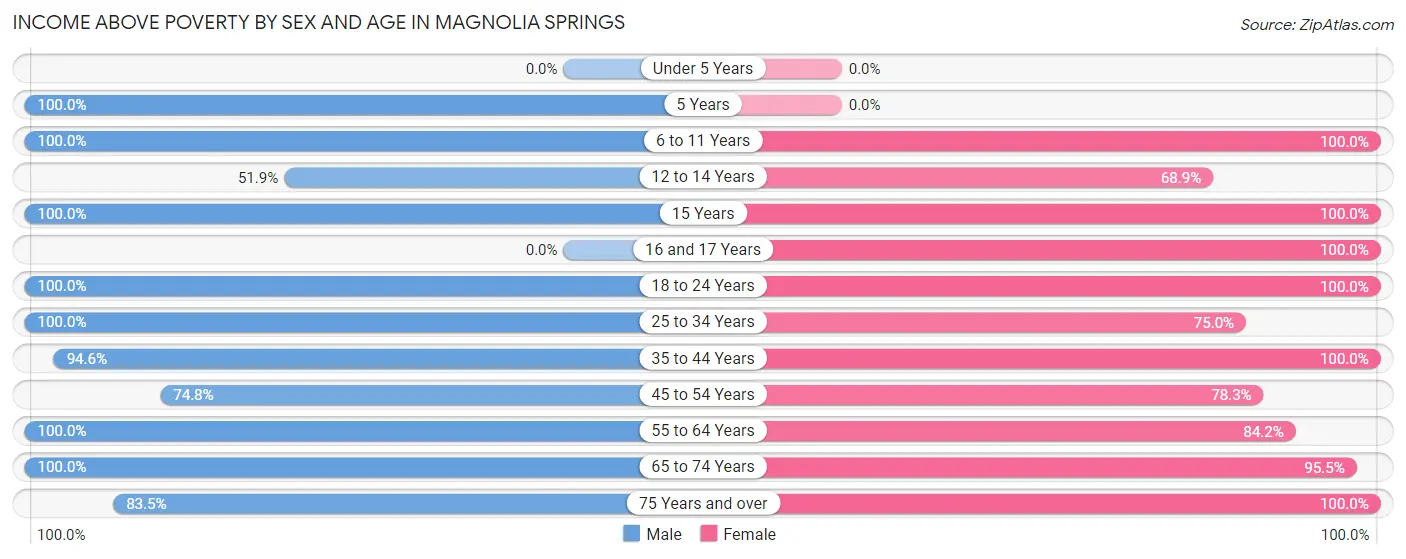
| Age Bracket | Male | Female |
| Under 5 Years | 0 (0.0%) | 0 (0.0%) |
| 5 Years | 8 (100.0%) | 0 (0.0%) |
| 6 to 11 Years | 27 (100.0%) | 28 (100.0%) |
| 12 to 14 Years | 28 (51.8%) | 62 (68.9%) |
| 15 Years | 17 (100.0%) | 10 (100.0%) |
| 16 and 17 Years | 0 (0.0%) | 41 (100.0%) |
| 18 to 24 Years | 30 (100.0%) | 48 (100.0%) |
| 25 to 34 Years | 31 (100.0%) | 24 (75.0%) |
| 35 to 44 Years | 70 (94.6%) | 88 (100.0%) |
| 45 to 54 Years | 92 (74.8%) | 126 (78.3%) |
| 55 to 64 Years | 70 (100.0%) | 64 (84.2%) |
| 65 to 74 Years | 85 (100.0%) | 107 (95.5%) |
| 75 Years and over | 66 (83.5%) | 41 (100.0%) |
| Total | 524 (87.6%) | 639 (87.9%) |
Income Below Poverty Among Married-Couple Families in Magnolia Springs
The poverty statistics for married-couple families in Magnolia Springs show that 11.5% or 37 of the total 323 families live below the poverty line. Families with 1 or 2 children have the highest poverty rate of 41.3%, comprising of 31 families. On the other hand, families with 3 or 4 children have the lowest poverty rate of 0.0%, which includes 0 families.
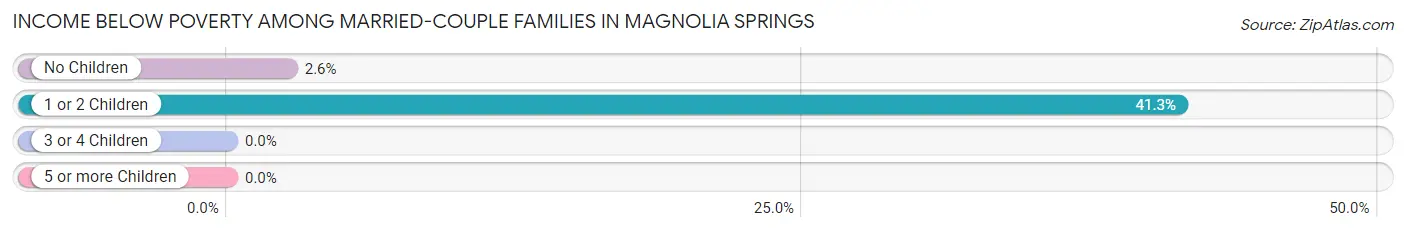
| Children | Above Poverty | Below Poverty |
| No Children | 225 (97.4%) | 6 (2.6%) |
| 1 or 2 Children | 44 (58.7%) | 31 (41.3%) |
| 3 or 4 Children | 17 (100.0%) | 0 (0.0%) |
| 5 or more Children | 0 (0.0%) | 0 (0.0%) |
| Total | 286 (88.5%) | 37 (11.5%) |
Income Below Poverty Among Single-Parent Households in Magnolia Springs
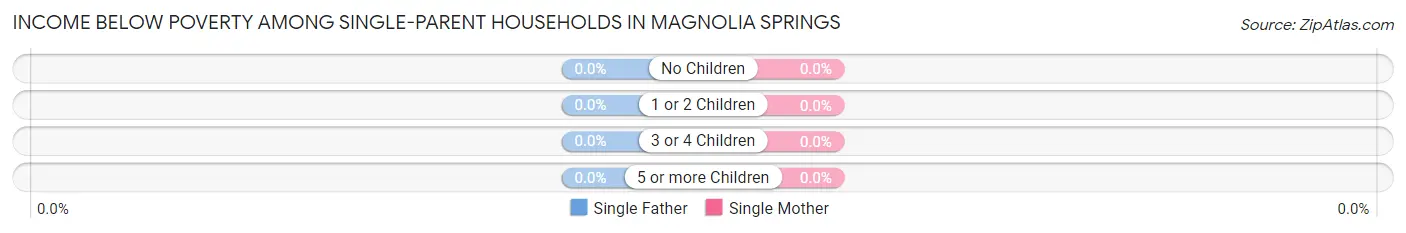
| Children | Single Father | Single Mother |
| No Children | 0 (0.0%) | 0 (0.0%) |
| 1 or 2 Children | 0 (0.0%) | 0 (0.0%) |
| 3 or 4 Children | 0 (0.0%) | 0 (0.0%) |
| 5 or more Children | 0 (0.0%) | 0 (0.0%) |
| Total | 0 (0.0%) | 0 (0.0%) |
Income Below Poverty Among Married-Couple vs Single-Parent Households in Magnolia Springs
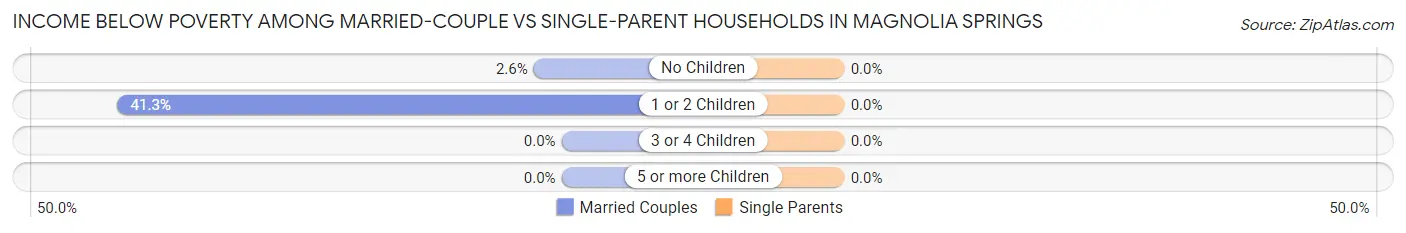
| Children | Married-Couple Families | Single-Parent Households |
| No Children | 6 (2.6%) | 0 (0.0%) |
| 1 or 2 Children | 31 (41.3%) | 0 (0.0%) |
| 3 or 4 Children | 0 (0.0%) | 0 (0.0%) |
| 5 or more Children | 0 (0.0%) | 0 (0.0%) |
| Total | 37 (11.5%) | 0 (0.0%) |
Employment Characteristics in Magnolia Springs
Employment by Class of Employer in Magnolia Springs
Among the 592 employed individuals in Magnolia Springs, private company employees (401 | 67.7%), self-employed (incorporated) (47 | 7.9%), and not-for-profit organizations (47 | 7.9%) make up the most common classes of employment.
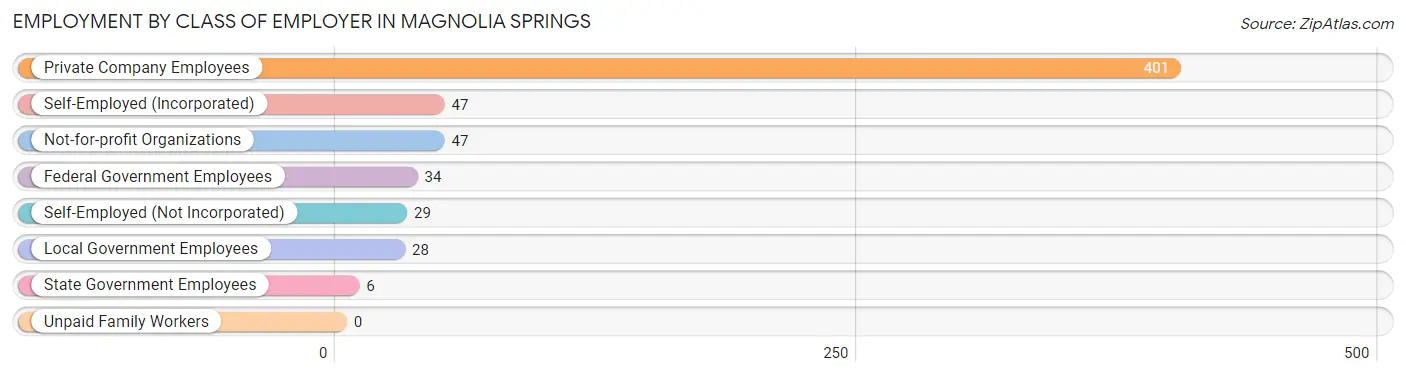
| Employer Class | # Employees | % Employees |
| Private Company Employees | 401 | 67.7% |
| Self-Employed (Incorporated) | 47 | 7.9% |
| Self-Employed (Not Incorporated) | 29 | 4.9% |
| Not-for-profit Organizations | 47 | 7.9% |
| Local Government Employees | 28 | 4.7% |
| State Government Employees | 6 | 1.0% |
| Federal Government Employees | 34 | 5.7% |
| Unpaid Family Workers | 0 | 0.0% |
| Total | 592 | 100.0% |
Employment Status by Age in Magnolia Springs
According to the labor force statistics for Magnolia Springs, out of the total population over 16 years of age (1,091), 56.8% or 620 individuals are in the labor force, with 2.3% or 14 of them unemployed. The age group with the highest labor force participation rate is 20 to 24 years, with 100.0% or 41 individuals in the labor force. Within the labor force, the 60 to 64 years age range has the highest percentage of unemployed individuals, with 16.7% or 12 of them being unemployed.
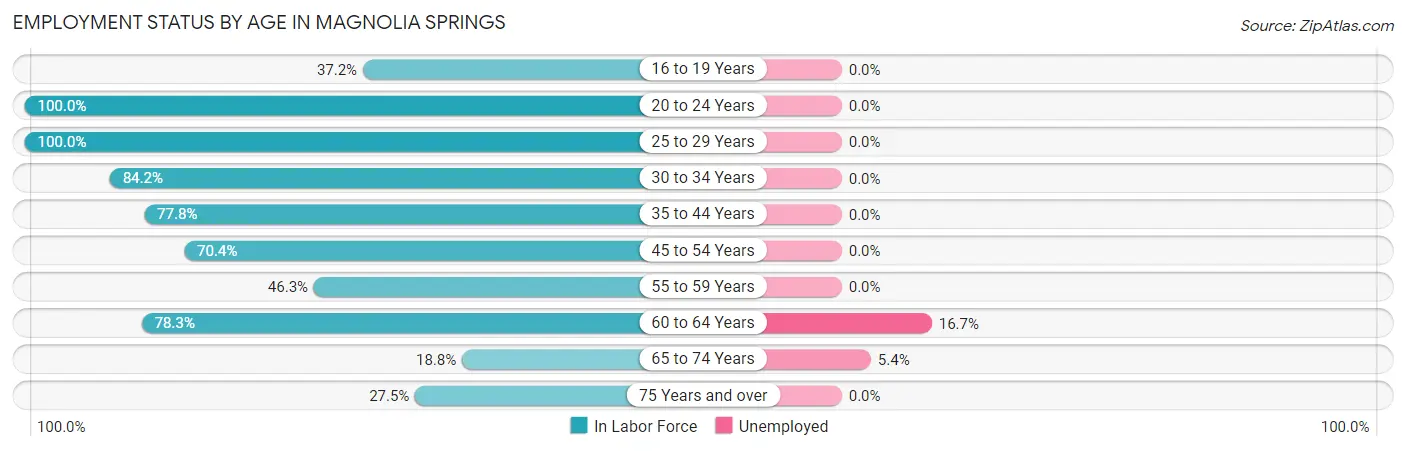
| Age Bracket | In Labor Force | Unemployed |
| 16 to 19 Years | 29 (37.2%) | 0 (0.0%) |
| 20 to 24 Years | 41 (100.0%) | 0 (0.0%) |
| 25 to 29 Years | 25 (100.0%) | 0 (0.0%) |
| 30 to 34 Years | 32 (84.2%) | 0 (0.0%) |
| 35 to 44 Years | 126 (77.8%) | 0 (0.0%) |
| 45 to 54 Years | 200 (70.4%) | 0 (0.0%) |
| 55 to 59 Years | 25 (46.3%) | 0 (0.0%) |
| 60 to 64 Years | 72 (78.3%) | 12 (16.7%) |
| 65 to 74 Years | 37 (18.8%) | 2 (5.4%) |
| 75 Years and over | 33 (27.5%) | 0 (0.0%) |
| Total | 620 (56.8%) | 14 (2.3%) |
Employment Status by Educational Attainment in Magnolia Springs
According to labor force statistics for Magnolia Springs, 73.3% of individuals (480) out of the total population between 25 and 64 years of age (655) are in the labor force, with 2.5% or 12 of them being unemployed. The group with the highest labor force participation rate are those with the educational attainment of college / associate degree, with 80.6% or 199 individuals in the labor force. Within the labor force, individuals with college / associate degree education have the highest percentage of unemployment, with 6.0% or 12 of them being unemployed.
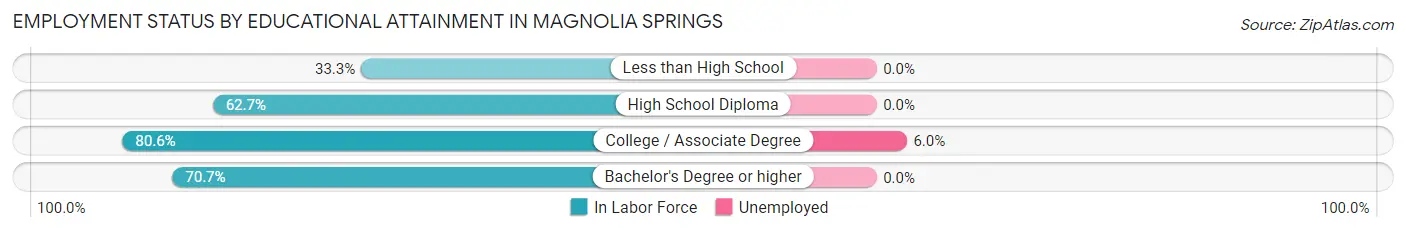
| Educational Attainment | In Labor Force | Unemployed |
| Less than High School | 2 (33.3%) | 0 (0.0%) |
| High School Diploma | 42 (62.7%) | 0 (0.0%) |
| College / Associate Degree | 199 (80.6%) | 15 (6.0%) |
| Bachelor's Degree or higher | 237 (70.7%) | 0 (0.0%) |
| Total | 480 (73.3%) | 16 (2.5%) |
Employment Occupations by Sex in Magnolia Springs
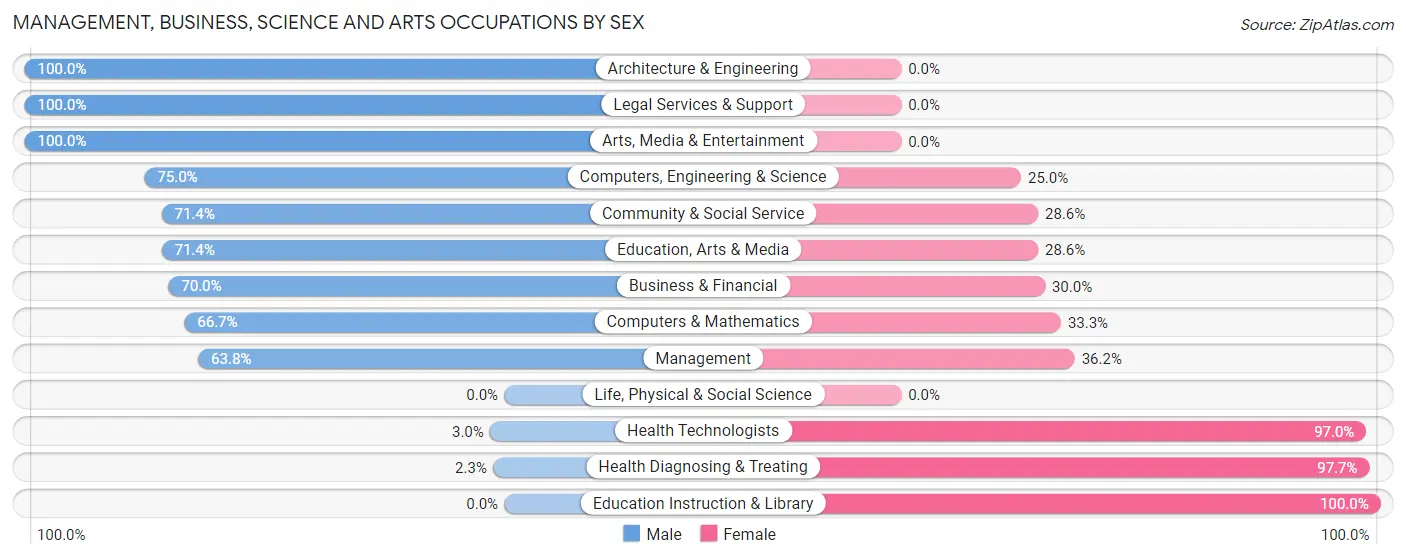
Management, Business, Science and Arts Occupations
The most common Management, Business, Science and Arts occupations in Magnolia Springs are Health Diagnosing & Treating (128 | 21.1%), Management (116 | 19.1%), Health Technologists (100 | 16.5%), Community & Social Service (21 | 3.5%), and Computers, Engineering & Science (12 | 2.0%).
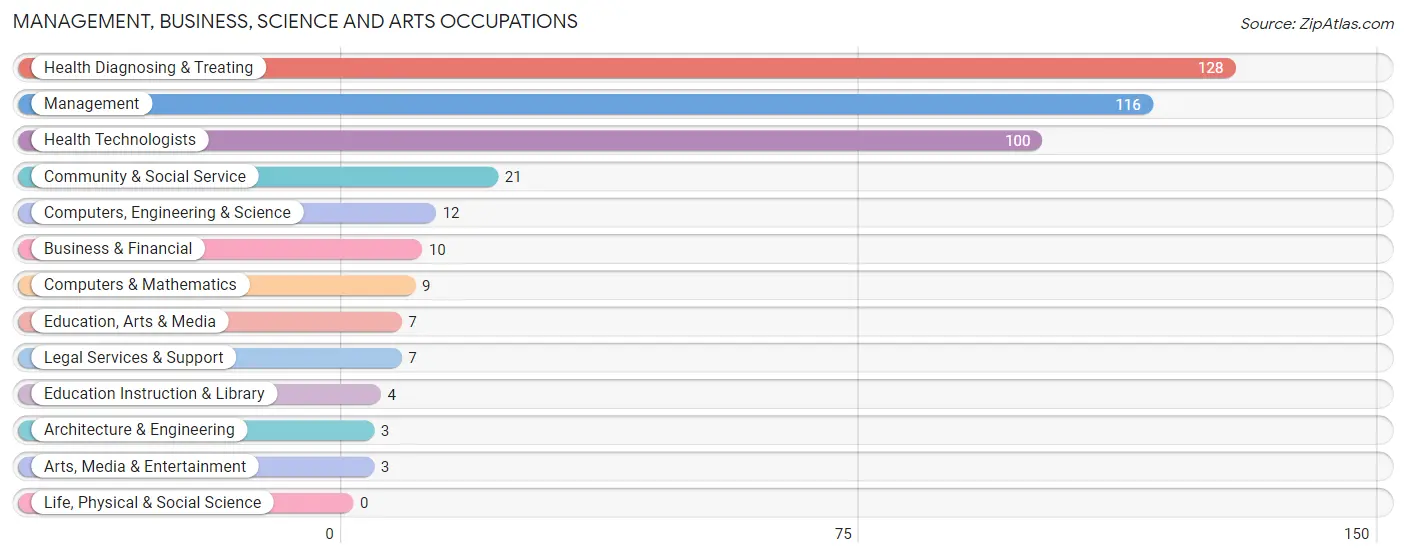
Management, Business, Science and Arts Occupations by Sex
Within the Management, Business, Science and Arts occupations in Magnolia Springs, the most male-oriented occupations are Architecture & Engineering (100.0%), Legal Services & Support (100.0%), and Arts, Media & Entertainment (100.0%), while the most female-oriented occupations are Education Instruction & Library (100.0%), Health Diagnosing & Treating (97.7%), and Health Technologists (97.0%).
| Occupation | Male | Female |
| Management | 74 (63.8%) | 42 (36.2%) |
| Business & Financial | 7 (70.0%) | 3 (30.0%) |
| Computers, Engineering & Science | 9 (75.0%) | 3 (25.0%) |
| Computers & Mathematics | 6 (66.7%) | 3 (33.3%) |
| Architecture & Engineering | 3 (100.0%) | 0 (0.0%) |
| Life, Physical & Social Science | 0 (0.0%) | 0 (0.0%) |
| Community & Social Service | 15 (71.4%) | 6 (28.6%) |
| Education, Arts & Media | 5 (71.4%) | 2 (28.6%) |
| Legal Services & Support | 7 (100.0%) | 0 (0.0%) |
| Education Instruction & Library | 0 (0.0%) | 4 (100.0%) |
| Arts, Media & Entertainment | 3 (100.0%) | 0 (0.0%) |
| Health Diagnosing & Treating | 3 (2.3%) | 125 (97.7%) |
| Health Technologists | 3 (3.0%) | 97 (97.0%) |
| Total (Category) | 108 (37.6%) | 179 (62.4%) |
| Total (Overall) | 282 (46.5%) | 324 (53.5%) |
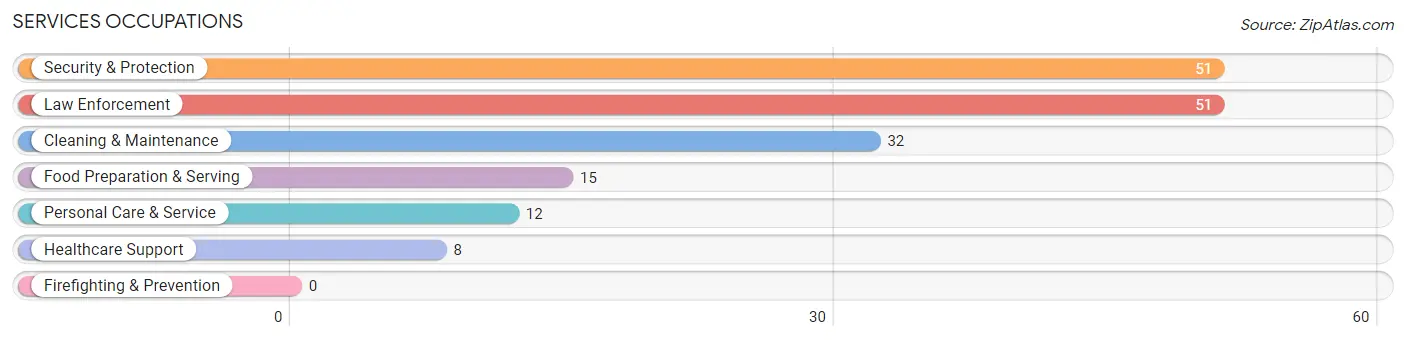
Services Occupations
The most common Services occupations in Magnolia Springs are Security & Protection (51 | 8.4%), Law Enforcement (51 | 8.4%), Cleaning & Maintenance (32 | 5.3%), Food Preparation & Serving (15 | 2.5%), and Personal Care & Service (12 | 2.0%).
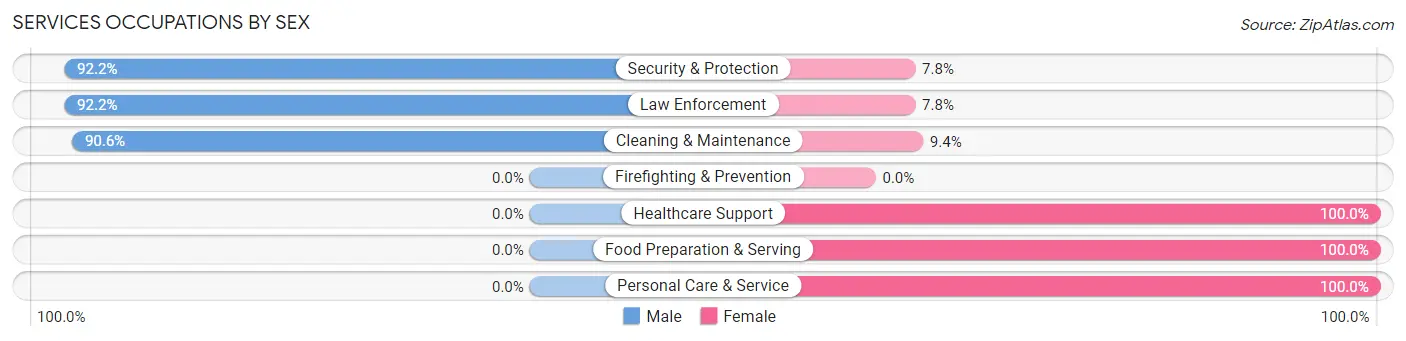
Services Occupations by Sex
Within the Services occupations in Magnolia Springs, the most male-oriented occupations are Security & Protection (92.2%), Law Enforcement (92.2%), and Cleaning & Maintenance (90.6%), while the most female-oriented occupations are Healthcare Support (100.0%), Food Preparation & Serving (100.0%), and Personal Care & Service (100.0%).
| Occupation | Male | Female |
| Healthcare Support | 0 (0.0%) | 8 (100.0%) |
| Security & Protection | 47 (92.2%) | 4 (7.8%) |
| Firefighting & Prevention | 0 (0.0%) | 0 (0.0%) |
| Law Enforcement | 47 (92.2%) | 4 (7.8%) |
| Food Preparation & Serving | 0 (0.0%) | 15 (100.0%) |
| Cleaning & Maintenance | 29 (90.6%) | 3 (9.4%) |
| Personal Care & Service | 0 (0.0%) | 12 (100.0%) |
| Total (Category) | 76 (64.4%) | 42 (35.6%) |
| Total (Overall) | 282 (46.5%) | 324 (53.5%) |
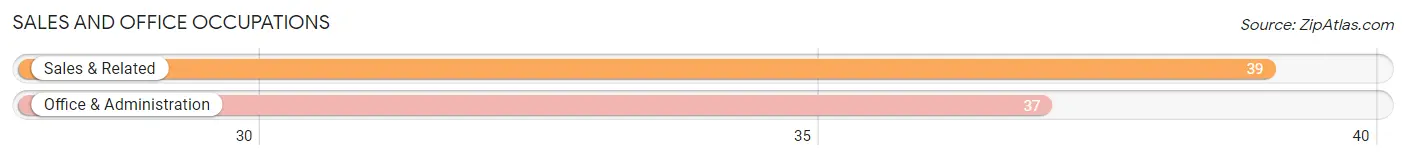
Sales and Office Occupations
The most common Sales and Office occupations in Magnolia Springs are Sales & Related (39 | 6.4%), and Office & Administration (37 | 6.1%).
Sales and Office Occupations by Sex
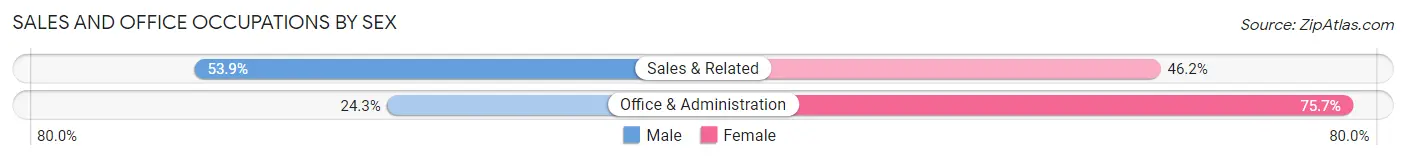
| Occupation | Male | Female |
| Sales & Related | 21 (53.8%) | 18 (46.2%) |
| Office & Administration | 9 (24.3%) | 28 (75.7%) |
| Total (Category) | 30 (39.5%) | 46 (60.5%) |
| Total (Overall) | 282 (46.5%) | 324 (53.5%) |
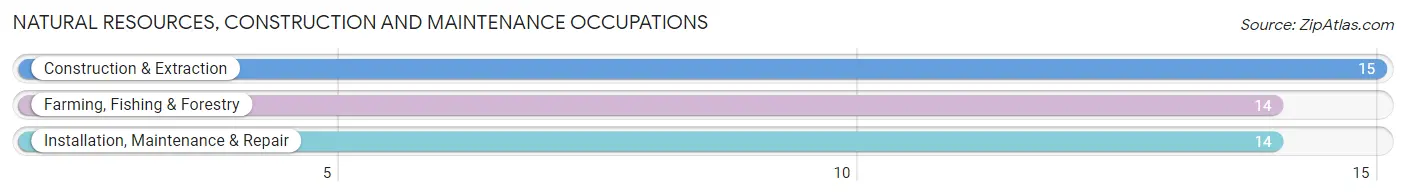
Natural Resources, Construction and Maintenance Occupations
The most common Natural Resources, Construction and Maintenance occupations in Magnolia Springs are Construction & Extraction (15 | 2.5%), Farming, Fishing & Forestry (14 | 2.3%), and Installation, Maintenance & Repair (14 | 2.3%).
Natural Resources, Construction and Maintenance Occupations by Sex
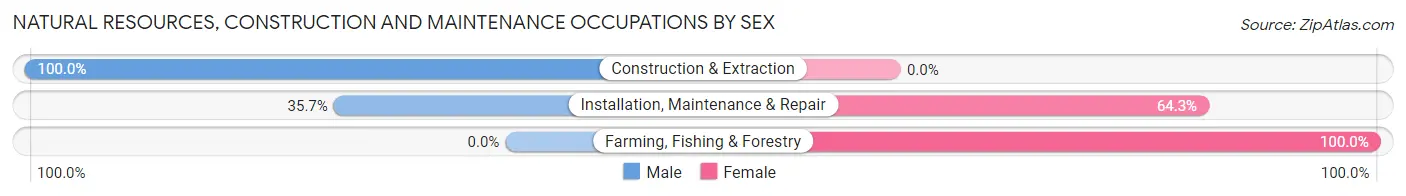
| Occupation | Male | Female |
| Farming, Fishing & Forestry | 0 (0.0%) | 14 (100.0%) |
| Construction & Extraction | 15 (100.0%) | 0 (0.0%) |
| Installation, Maintenance & Repair | 5 (35.7%) | 9 (64.3%) |
| Total (Category) | 20 (46.5%) | 23 (53.5%) |
| Total (Overall) | 282 (46.5%) | 324 (53.5%) |
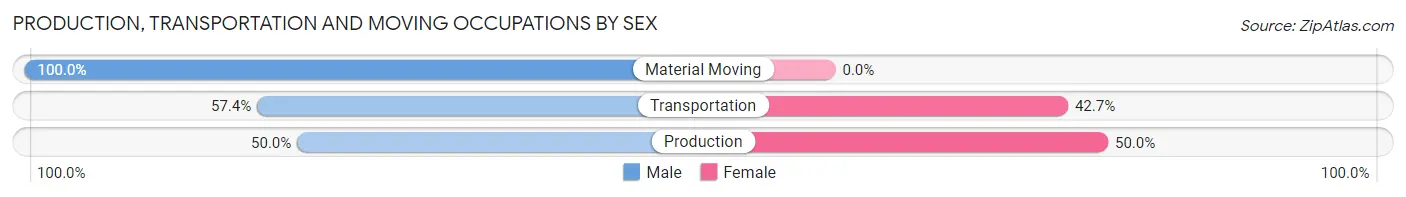
Production, Transportation and Moving Occupations
The most common Production, Transportation and Moving occupations in Magnolia Springs are Transportation (68 | 11.2%), Production (10 | 1.7%), and Material Moving (4 | 0.7%).
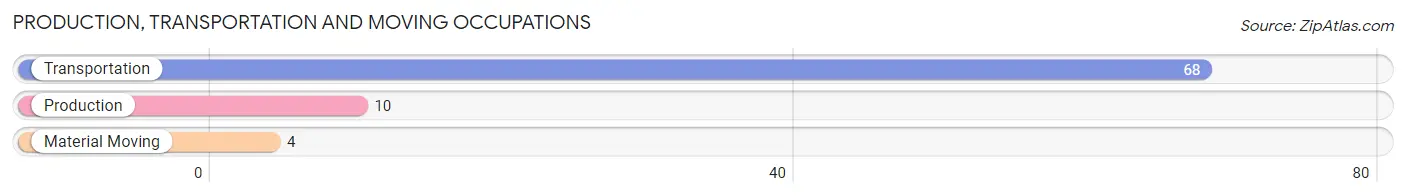
Production, Transportation and Moving Occupations by Sex
| Occupation | Male | Female |
| Production | 5 (50.0%) | 5 (50.0%) |
| Transportation | 39 (57.4%) | 29 (42.6%) |
| Material Moving | 4 (100.0%) | 0 (0.0%) |
| Total (Category) | 48 (58.5%) | 34 (41.5%) |
| Total (Overall) | 282 (46.5%) | 324 (53.5%) |
Employment Industries by Sex in Magnolia Springs
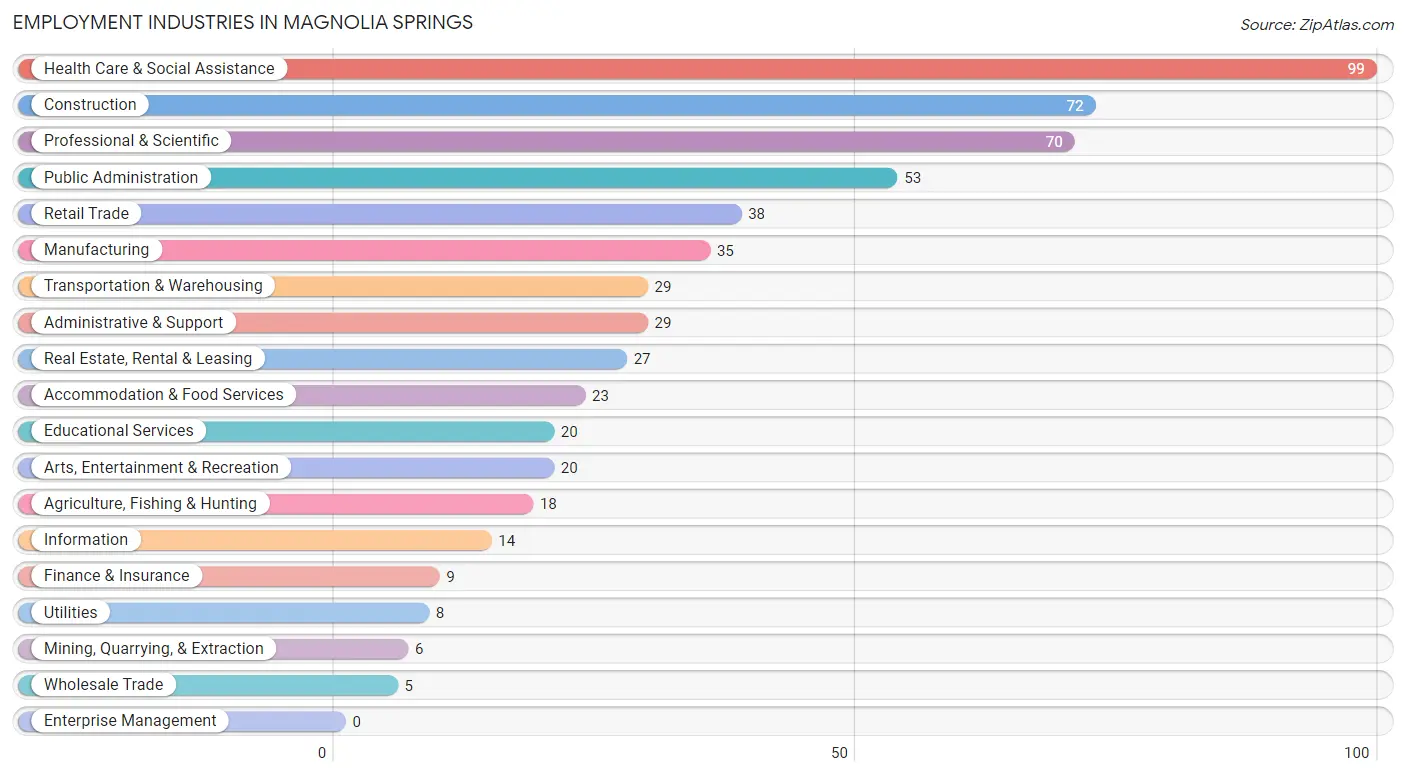
Employment Industries in Magnolia Springs
The major employment industries in Magnolia Springs include Health Care & Social Assistance (99 | 16.3%), Construction (72 | 11.9%), Professional & Scientific (70 | 11.6%), Public Administration (53 | 8.7%), and Retail Trade (38 | 6.3%).
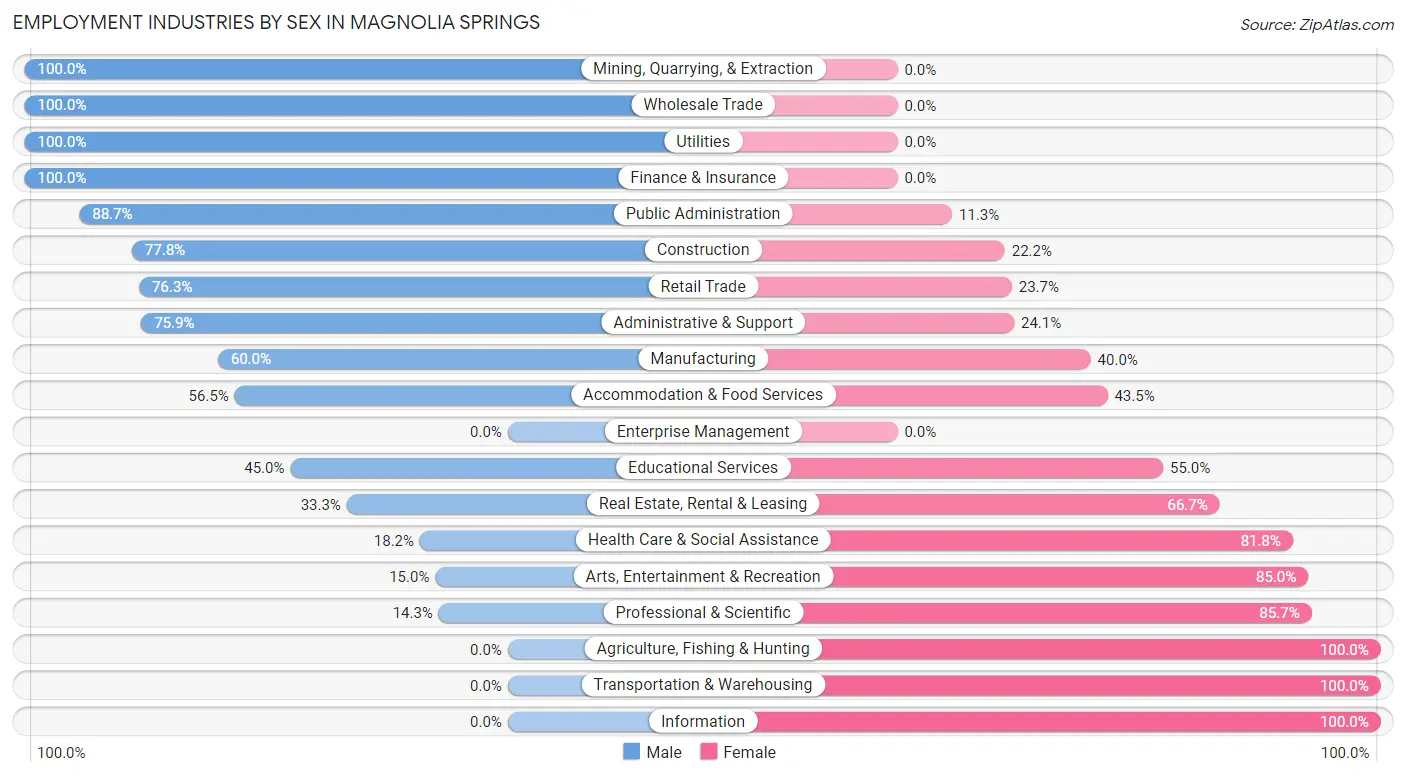
Employment Industries by Sex in Magnolia Springs
The Magnolia Springs industries that see more men than women are Mining, Quarrying, & Extraction (100.0%), Wholesale Trade (100.0%), and Utilities (100.0%), whereas the industries that tend to have a higher number of women are Agriculture, Fishing & Hunting (100.0%), Transportation & Warehousing (100.0%), and Information (100.0%).
| Industry | Male | Female |
| Agriculture, Fishing & Hunting | 0 (0.0%) | 18 (100.0%) |
| Mining, Quarrying, & Extraction | 6 (100.0%) | 0 (0.0%) |
| Construction | 56 (77.8%) | 16 (22.2%) |
| Manufacturing | 21 (60.0%) | 14 (40.0%) |
| Wholesale Trade | 5 (100.0%) | 0 (0.0%) |
| Retail Trade | 29 (76.3%) | 9 (23.7%) |
| Transportation & Warehousing | 0 (0.0%) | 29 (100.0%) |
| Utilities | 8 (100.0%) | 0 (0.0%) |
| Information | 0 (0.0%) | 14 (100.0%) |
| Finance & Insurance | 9 (100.0%) | 0 (0.0%) |
| Real Estate, Rental & Leasing | 9 (33.3%) | 18 (66.7%) |
| Professional & Scientific | 10 (14.3%) | 60 (85.7%) |
| Enterprise Management | 0 (0.0%) | 0 (0.0%) |
| Administrative & Support | 22 (75.9%) | 7 (24.1%) |
| Educational Services | 9 (45.0%) | 11 (55.0%) |
| Health Care & Social Assistance | 18 (18.2%) | 81 (81.8%) |
| Arts, Entertainment & Recreation | 3 (15.0%) | 17 (85.0%) |
| Accommodation & Food Services | 13 (56.5%) | 10 (43.5%) |
| Public Administration | 47 (88.7%) | 6 (11.3%) |
| Total | 282 (46.5%) | 324 (53.5%) |
Education in Magnolia Springs
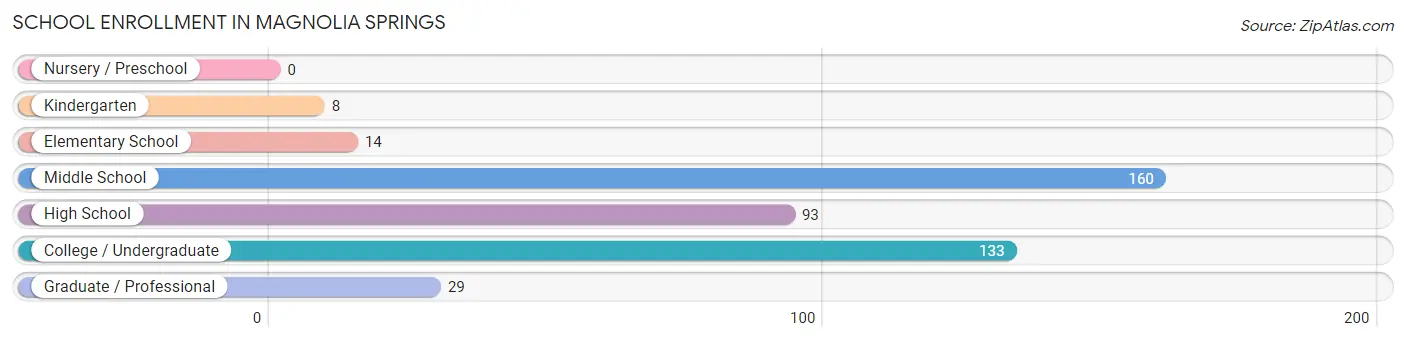
School Enrollment in Magnolia Springs
The most common levels of schooling among the 437 students in Magnolia Springs are middle school (160 | 36.6%), college / undergraduate (133 | 30.4%), and high school (93 | 21.3%).
| School Level | # Students | % Students |
| Nursery / Preschool | 0 | 0.0% |
| Kindergarten | 8 | 1.8% |
| Elementary School | 14 | 3.2% |
| Middle School | 160 | 36.6% |
| High School | 93 | 21.3% |
| College / Undergraduate | 133 | 30.4% |
| Graduate / Professional | 29 | 6.6% |
| Total | 437 | 100.0% |
School Enrollment by Age by Funding Source in Magnolia Springs
Out of a total of 437 students who are enrolled in schools in Magnolia Springs, 110 (25.2%) attend a private institution, while the remaining 327 (74.8%) are enrolled in public schools. The age group of 25 to 34 year olds has the highest likelihood of being enrolled in private schools, with 8 (57.1% in the age bracket) enrolled. Conversely, the age group of 5 to 9 year old has the lowest likelihood of being enrolled in a private school, with 17 (100.0% in the age bracket) attending a public institution.
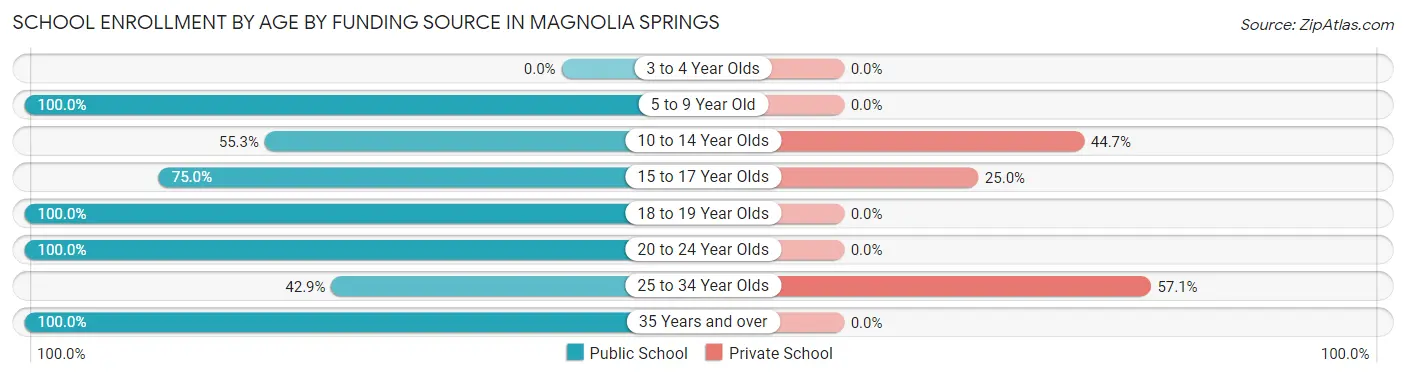
| Age Bracket | Public School | Private School |
| 3 to 4 Year Olds | 0 (0.0%) | 0 (0.0%) |
| 5 to 9 Year Old | 17 (100.0%) | 0 (0.0%) |
| 10 to 14 Year Olds | 105 (55.3%) | 85 (44.7%) |
| 15 to 17 Year Olds | 51 (75.0%) | 17 (25.0%) |
| 18 to 19 Year Olds | 19 (100.0%) | 0 (0.0%) |
| 20 to 24 Year Olds | 11 (100.0%) | 0 (0.0%) |
| 25 to 34 Year Olds | 6 (42.9%) | 8 (57.1%) |
| 35 Years and over | 118 (100.0%) | 0 (0.0%) |
| Total | 327 (74.8%) | 110 (25.2%) |
Educational Attainment by Field of Study in Magnolia Springs
Science & technology (125 | 22.1%), business (113 | 19.9%), bio, nature & agricultural (65 | 11.5%), engineering (54 | 9.5%), and education (47 | 8.3%) are the most common fields of study among 567 individuals in Magnolia Springs who have obtained a bachelor's degree or higher.
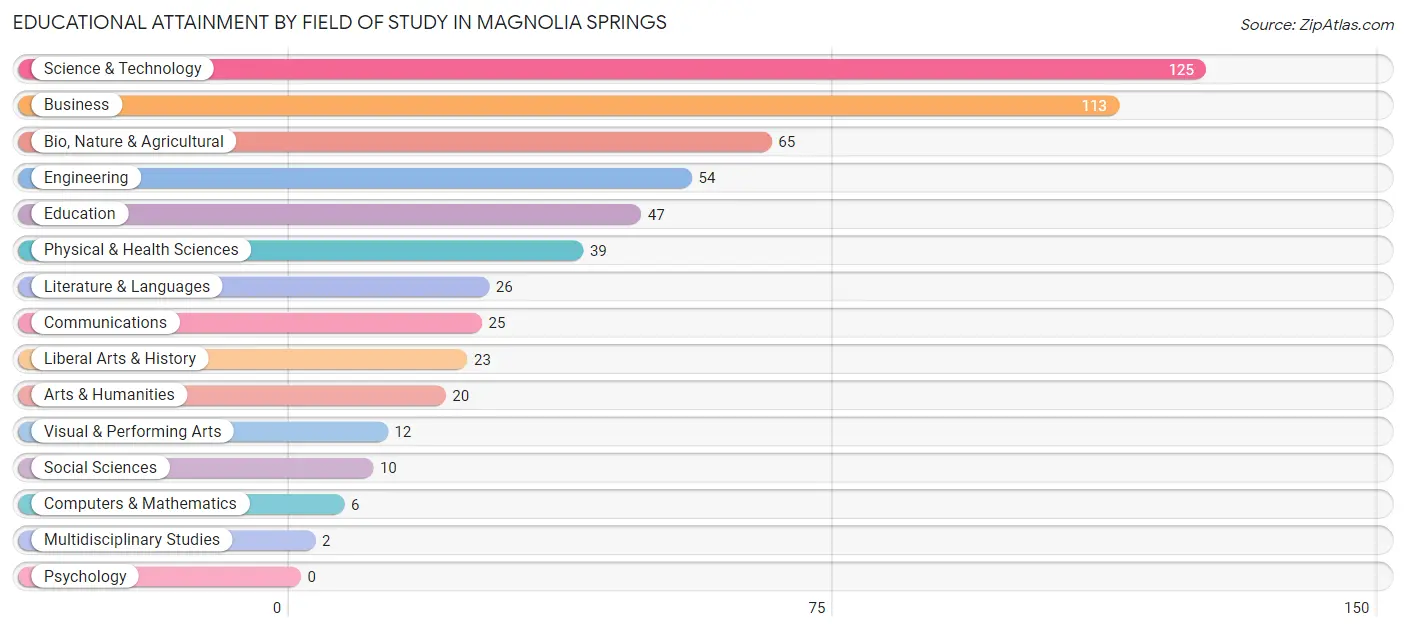
| Field of Study | # Graduates | % Graduates |
| Computers & Mathematics | 6 | 1.1% |
| Bio, Nature & Agricultural | 65 | 11.5% |
| Physical & Health Sciences | 39 | 6.9% |
| Psychology | 0 | 0.0% |
| Social Sciences | 10 | 1.8% |
| Engineering | 54 | 9.5% |
| Multidisciplinary Studies | 2 | 0.4% |
| Science & Technology | 125 | 22.1% |
| Business | 113 | 19.9% |
| Education | 47 | 8.3% |
| Literature & Languages | 26 | 4.6% |
| Liberal Arts & History | 23 | 4.1% |
| Visual & Performing Arts | 12 | 2.1% |
| Communications | 25 | 4.4% |
| Arts & Humanities | 20 | 3.5% |
| Total | 567 | 100.0% |
Transportation & Commute in Magnolia Springs
Vehicle Availability by Sex in Magnolia Springs
The most prevalent vehicle ownership categories in Magnolia Springs are males with 3 vehicles (114, accounting for 40.4%) and females with 3 vehicles (88, making up 36.8%).
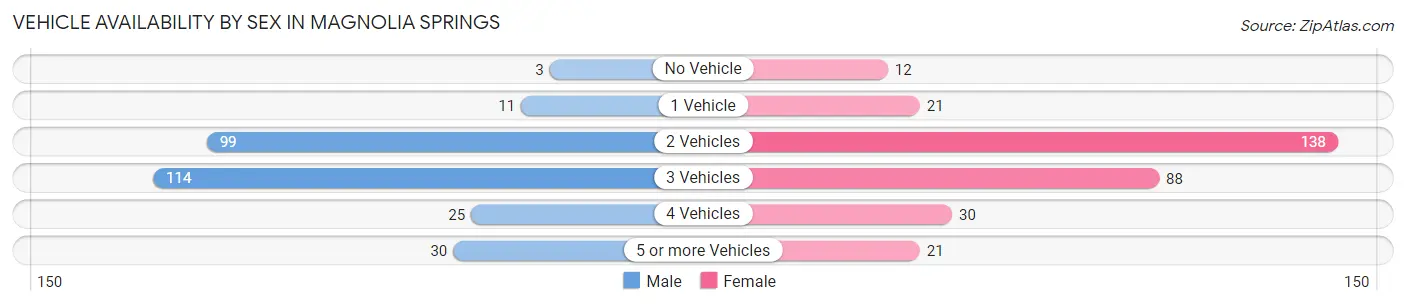
| Vehicles Available | Male | Female |
| No Vehicle | 3 (1.1%) | 12 (3.9%) |
| 1 Vehicle | 11 (3.9%) | 21 (6.8%) |
| 2 Vehicles | 99 (35.1%) | 138 (44.5%) |
| 3 Vehicles | 114 (40.4%) | 88 (28.4%) |
| 4 Vehicles | 25 (8.9%) | 30 (9.7%) |
| 5 or more Vehicles | 30 (10.6%) | 21 (6.8%) |
| Total | 282 (100.0%) | 310 (100.0%) |
Commute Time in Magnolia Springs
The most frequently occuring commute durations in Magnolia Springs are 30 to 34 minutes (82 commuters, 16.7%), 90 or more minutes (76 commuters, 15.4%), and 15 to 19 minutes (71 commuters, 14.4%).
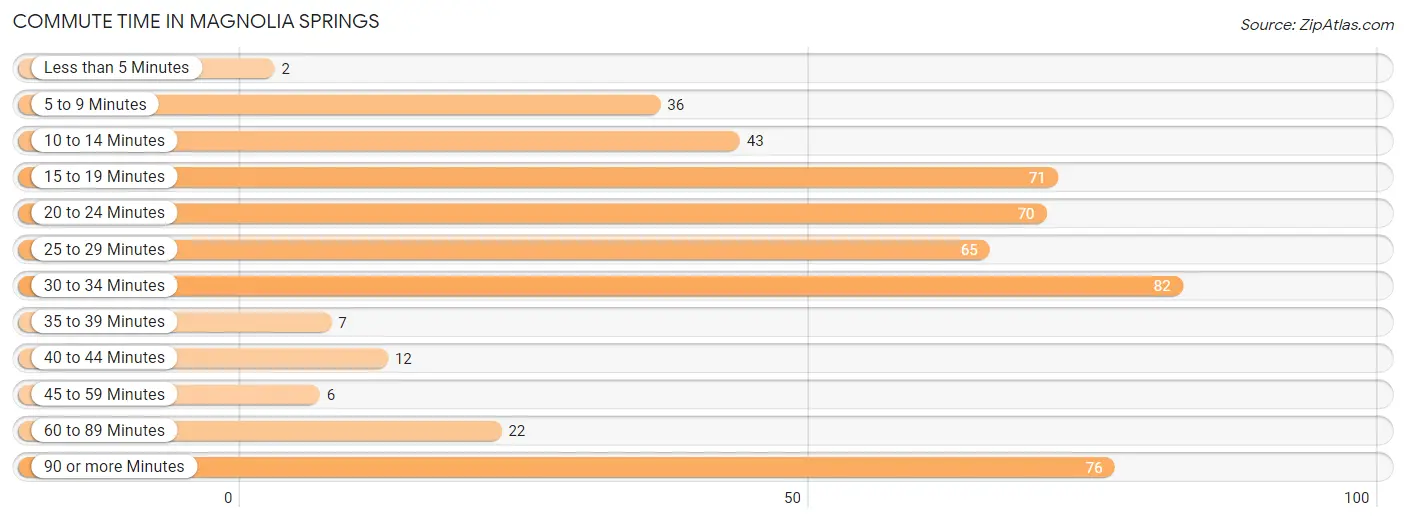
| Commute Time | # Commuters | % Commuters |
| Less than 5 Minutes | 2 | 0.4% |
| 5 to 9 Minutes | 36 | 7.3% |
| 10 to 14 Minutes | 43 | 8.7% |
| 15 to 19 Minutes | 71 | 14.4% |
| 20 to 24 Minutes | 70 | 14.2% |
| 25 to 29 Minutes | 65 | 13.2% |
| 30 to 34 Minutes | 82 | 16.7% |
| 35 to 39 Minutes | 7 | 1.4% |
| 40 to 44 Minutes | 12 | 2.4% |
| 45 to 59 Minutes | 6 | 1.2% |
| 60 to 89 Minutes | 22 | 4.5% |
| 90 or more Minutes | 76 | 15.4% |
Commute Time by Sex in Magnolia Springs
The most common commute times in Magnolia Springs are 30 to 34 minutes (49 commuters, 20.3%) for males and 20 to 24 minutes (47 commuters, 18.7%) for females.
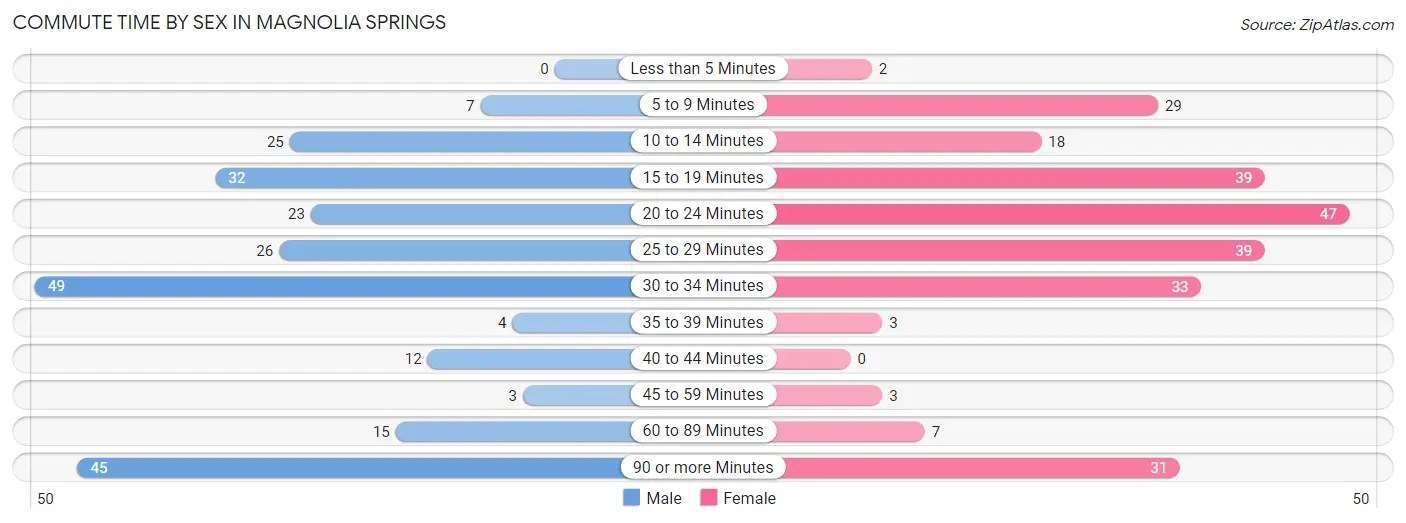
| Commute Time | Male | Female |
| Less than 5 Minutes | 0 (0.0%) | 2 (0.8%) |
| 5 to 9 Minutes | 7 (2.9%) | 29 (11.6%) |
| 10 to 14 Minutes | 25 (10.4%) | 18 (7.2%) |
| 15 to 19 Minutes | 32 (13.3%) | 39 (15.5%) |
| 20 to 24 Minutes | 23 (9.5%) | 47 (18.7%) |
| 25 to 29 Minutes | 26 (10.8%) | 39 (15.5%) |
| 30 to 34 Minutes | 49 (20.3%) | 33 (13.2%) |
| 35 to 39 Minutes | 4 (1.7%) | 3 (1.2%) |
| 40 to 44 Minutes | 12 (5.0%) | 0 (0.0%) |
| 45 to 59 Minutes | 3 (1.2%) | 3 (1.2%) |
| 60 to 89 Minutes | 15 (6.2%) | 7 (2.8%) |
| 90 or more Minutes | 45 (18.7%) | 31 (12.3%) |
Time of Departure to Work by Sex in Magnolia Springs
The most frequent times of departure to work in Magnolia Springs are 7:30 AM to 7:59 AM (64, 26.6%) for males and 8:00 AM to 8:29 AM (43, 17.1%) for females.
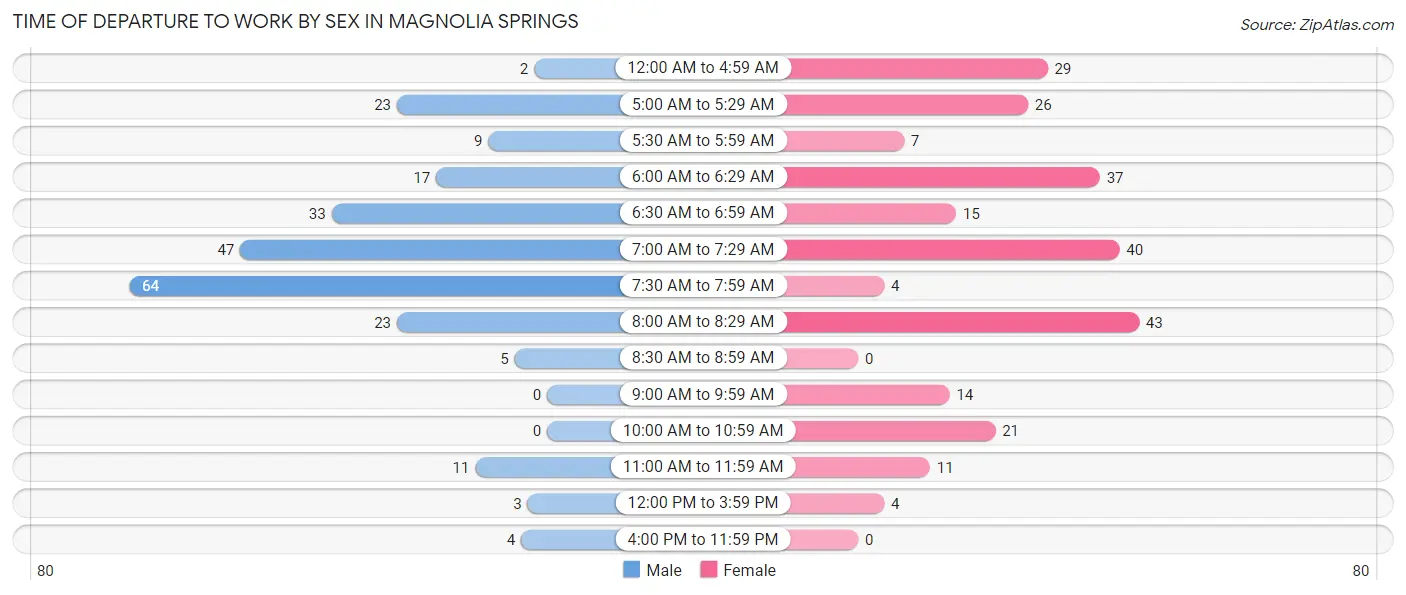
| Time of Departure | Male | Female |
| 12:00 AM to 4:59 AM | 2 (0.8%) | 29 (11.6%) |
| 5:00 AM to 5:29 AM | 23 (9.5%) | 26 (10.4%) |
| 5:30 AM to 5:59 AM | 9 (3.7%) | 7 (2.8%) |
| 6:00 AM to 6:29 AM | 17 (7.0%) | 37 (14.7%) |
| 6:30 AM to 6:59 AM | 33 (13.7%) | 15 (6.0%) |
| 7:00 AM to 7:29 AM | 47 (19.5%) | 40 (15.9%) |
| 7:30 AM to 7:59 AM | 64 (26.6%) | 4 (1.6%) |
| 8:00 AM to 8:29 AM | 23 (9.5%) | 43 (17.1%) |
| 8:30 AM to 8:59 AM | 5 (2.1%) | 0 (0.0%) |
| 9:00 AM to 9:59 AM | 0 (0.0%) | 14 (5.6%) |
| 10:00 AM to 10:59 AM | 0 (0.0%) | 21 (8.4%) |
| 11:00 AM to 11:59 AM | 11 (4.6%) | 11 (4.4%) |
| 12:00 PM to 3:59 PM | 3 (1.2%) | 4 (1.6%) |
| 4:00 PM to 11:59 PM | 4 (1.7%) | 0 (0.0%) |
| Total | 241 (100.0%) | 251 (100.0%) |
Housing Occupancy in Magnolia Springs
Occupancy by Ownership in Magnolia Springs
Of the total 481 dwellings in Magnolia Springs, owner-occupied units account for 423 (87.9%), while renter-occupied units make up 58 (12.1%).
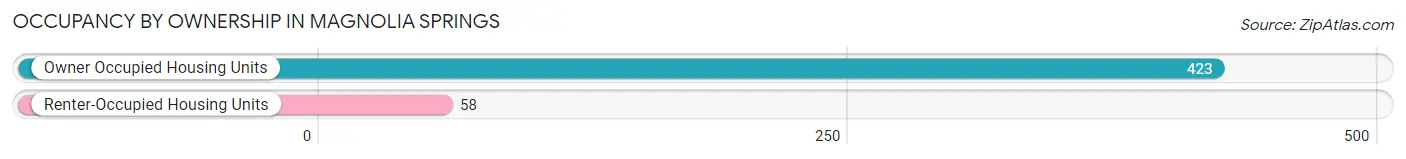
| Occupancy | # Housing Units | % Housing Units |
| Owner Occupied Housing Units | 423 | 87.9% |
| Renter-Occupied Housing Units | 58 | 12.1% |
| Total Occupied Housing Units | 481 | 100.0% |
Occupancy by Household Size in Magnolia Springs
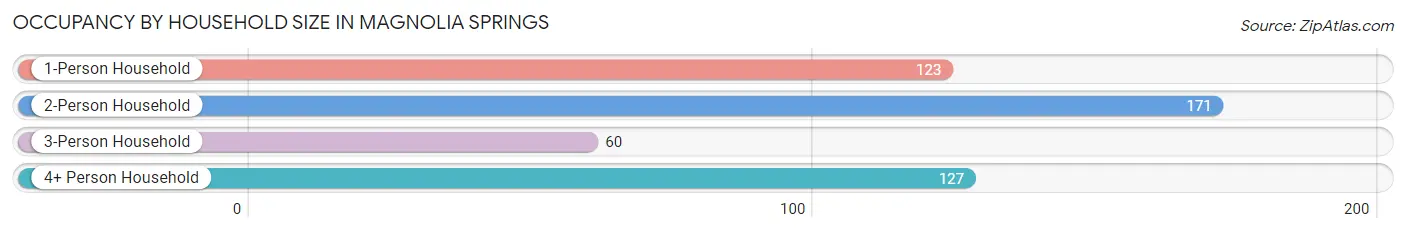
| Household Size | # Housing Units | % Housing Units |
| 1-Person Household | 123 | 25.6% |
| 2-Person Household | 171 | 35.5% |
| 3-Person Household | 60 | 12.5% |
| 4+ Person Household | 127 | 26.4% |
| Total Housing Units | 481 | 100.0% |
Occupancy by Ownership by Household Size in Magnolia Springs
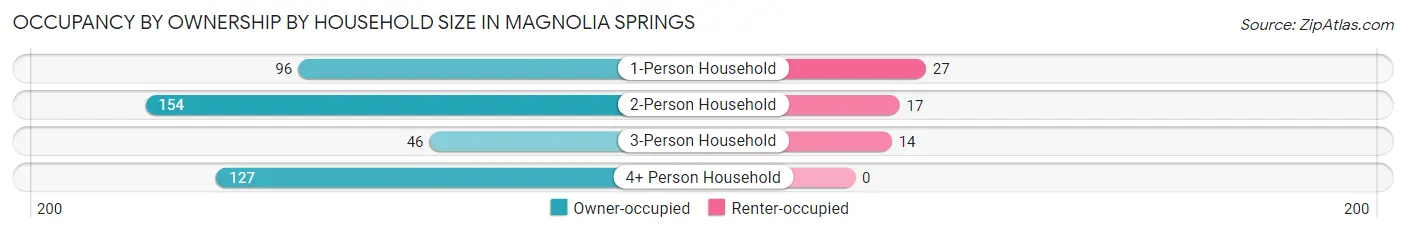
| Household Size | Owner-occupied | Renter-occupied |
| 1-Person Household | 96 (78.0%) | 27 (22.0%) |
| 2-Person Household | 154 (90.1%) | 17 (9.9%) |
| 3-Person Household | 46 (76.7%) | 14 (23.3%) |
| 4+ Person Household | 127 (100.0%) | 0 (0.0%) |
| Total Housing Units | 423 (87.9%) | 58 (12.1%) |
Occupancy by Educational Attainment in Magnolia Springs
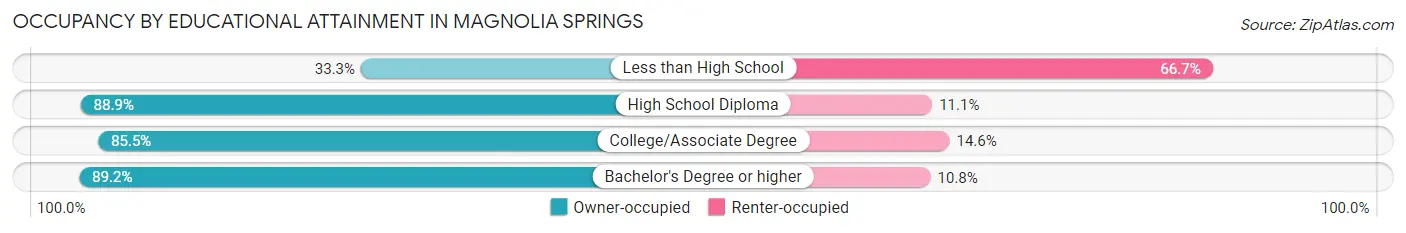
| Household Size | Owner-occupied | Renter-occupied |
| Less than High School | 1 (33.3%) | 2 (66.7%) |
| High School Diploma | 72 (88.9%) | 9 (11.1%) |
| College/Associate Degree | 94 (85.5%) | 16 (14.5%) |
| Bachelor's Degree or higher | 256 (89.2%) | 31 (10.8%) |
Occupancy by Age of Householder in Magnolia Springs
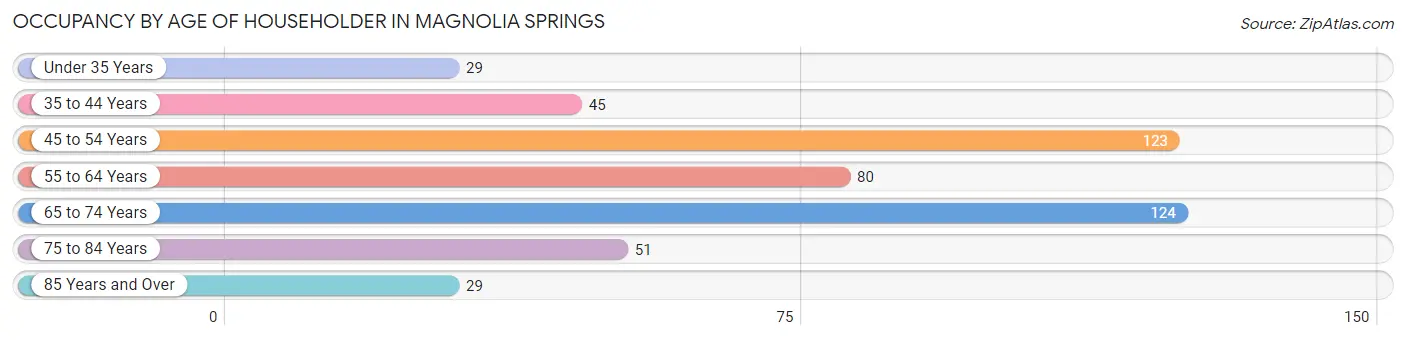
| Age Bracket | # Households | % Households |
| Under 35 Years | 29 | 6.0% |
| 35 to 44 Years | 45 | 9.4% |
| 45 to 54 Years | 123 | 25.6% |
| 55 to 64 Years | 80 | 16.6% |
| 65 to 74 Years | 124 | 25.8% |
| 75 to 84 Years | 51 | 10.6% |
| 85 Years and Over | 29 | 6.0% |
| Total | 481 | 100.0% |
Housing Finances in Magnolia Springs
Median Income by Occupancy in Magnolia Springs
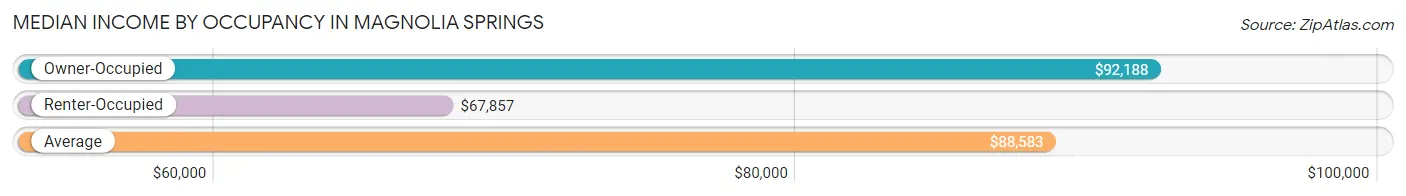
| Occupancy Type | # Households | Median Income |
| Owner-Occupied | 423 (87.9%) | $92,188 |
| Renter-Occupied | 58 (12.1%) | $67,857 |
| Average | 481 (100.0%) | $88,583 |
Occupancy by Householder Income Bracket in Magnolia Springs
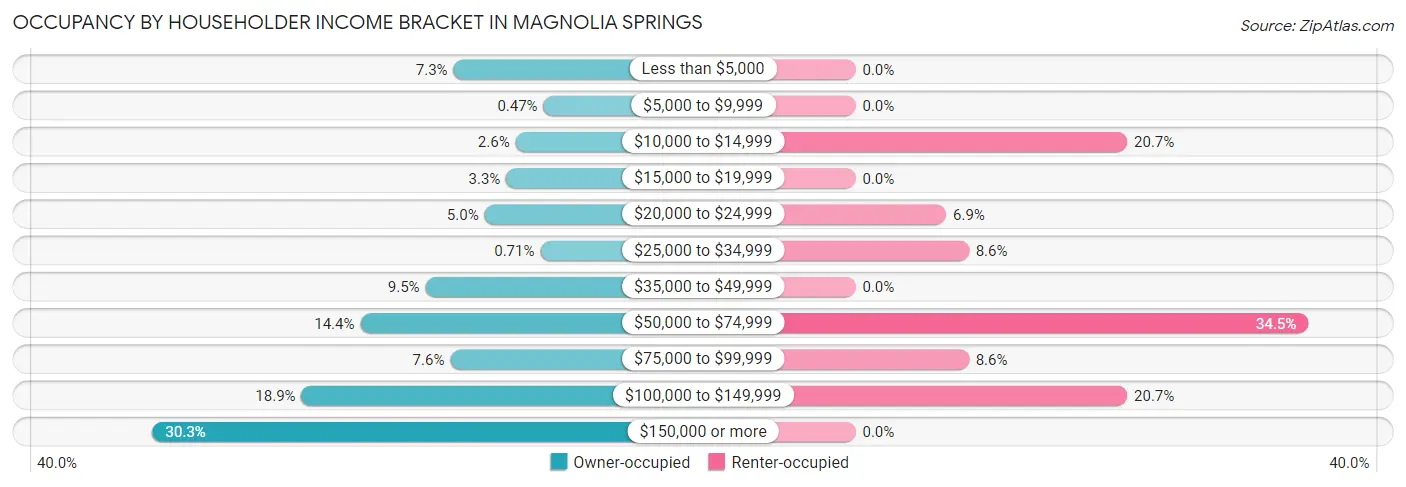
| Income Bracket | Owner-occupied | Renter-occupied |
| Less than $5,000 | 31 (7.3%) | 0 (0.0%) |
| $5,000 to $9,999 | 2 (0.5%) | 0 (0.0%) |
| $10,000 to $14,999 | 11 (2.6%) | 12 (20.7%) |
| $15,000 to $19,999 | 14 (3.3%) | 0 (0.0%) |
| $20,000 to $24,999 | 21 (5.0%) | 4 (6.9%) |
| $25,000 to $34,999 | 3 (0.7%) | 5 (8.6%) |
| $35,000 to $49,999 | 40 (9.5%) | 0 (0.0%) |
| $50,000 to $74,999 | 61 (14.4%) | 20 (34.5%) |
| $75,000 to $99,999 | 32 (7.6%) | 5 (8.6%) |
| $100,000 to $149,999 | 80 (18.9%) | 12 (20.7%) |
| $150,000 or more | 128 (30.3%) | 0 (0.0%) |
| Total | 423 (100.0%) | 58 (100.0%) |
Monthly Housing Cost Tiers in Magnolia Springs
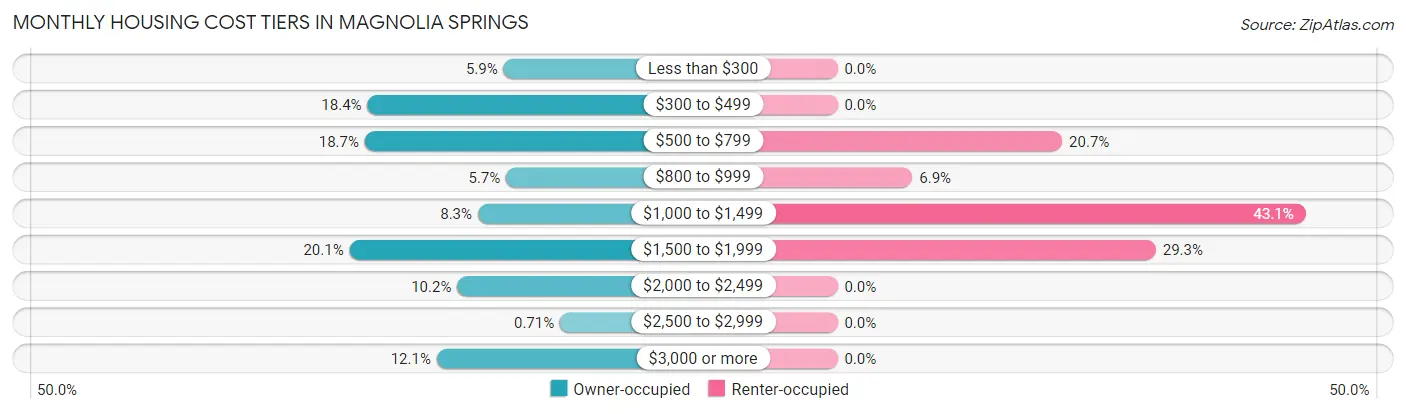
| Monthly Cost | Owner-occupied | Renter-occupied |
| Less than $300 | 25 (5.9%) | 0 (0.0%) |
| $300 to $499 | 78 (18.4%) | 0 (0.0%) |
| $500 to $799 | 79 (18.7%) | 12 (20.7%) |
| $800 to $999 | 24 (5.7%) | 4 (6.9%) |
| $1,000 to $1,499 | 35 (8.3%) | 25 (43.1%) |
| $1,500 to $1,999 | 85 (20.1%) | 17 (29.3%) |
| $2,000 to $2,499 | 43 (10.2%) | 0 (0.0%) |
| $2,500 to $2,999 | 3 (0.7%) | 0 (0.0%) |
| $3,000 or more | 51 (12.1%) | 0 (0.0%) |
| Total | 423 (100.0%) | 58 (100.0%) |
Physical Housing Characteristics in Magnolia Springs
Housing Structures in Magnolia Springs
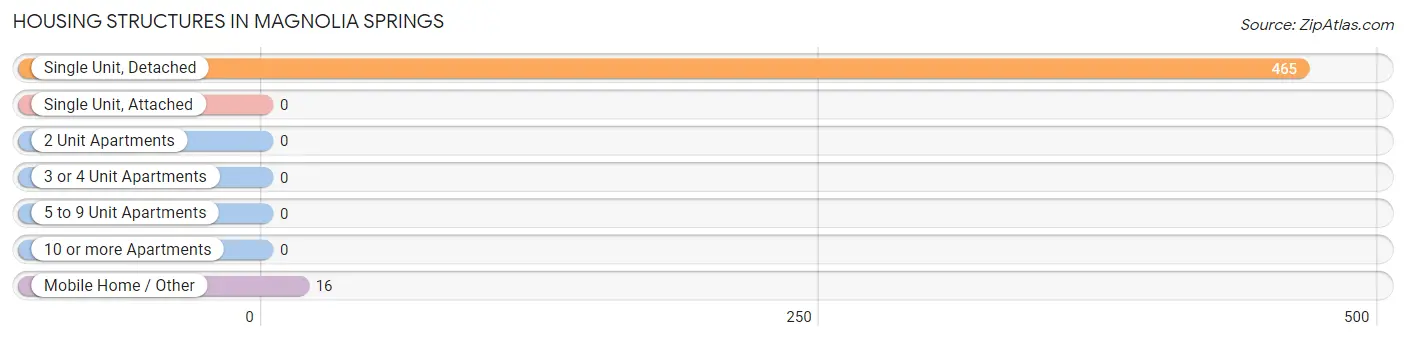
| Structure Type | # Housing Units | % Housing Units |
| Single Unit, Detached | 465 | 96.7% |
| Single Unit, Attached | 0 | 0.0% |
| 2 Unit Apartments | 0 | 0.0% |
| 3 or 4 Unit Apartments | 0 | 0.0% |
| 5 to 9 Unit Apartments | 0 | 0.0% |
| 10 or more Apartments | 0 | 0.0% |
| Mobile Home / Other | 16 | 3.3% |
| Total | 481 | 100.0% |
Housing Structures by Occupancy in Magnolia Springs
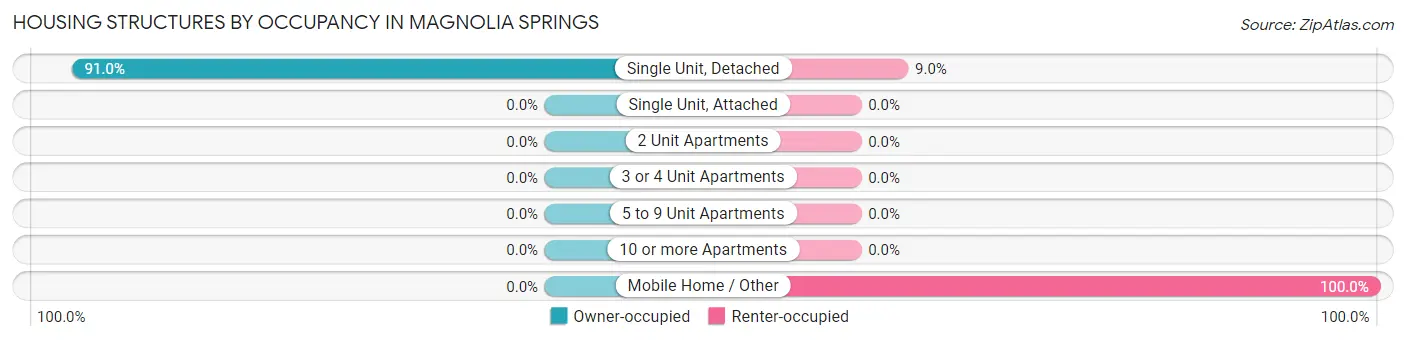
| Structure Type | Owner-occupied | Renter-occupied |
| Single Unit, Detached | 423 (91.0%) | 42 (9.0%) |
| Single Unit, Attached | 0 (0.0%) | 0 (0.0%) |
| 2 Unit Apartments | 0 (0.0%) | 0 (0.0%) |
| 3 or 4 Unit Apartments | 0 (0.0%) | 0 (0.0%) |
| 5 to 9 Unit Apartments | 0 (0.0%) | 0 (0.0%) |
| 10 or more Apartments | 0 (0.0%) | 0 (0.0%) |
| Mobile Home / Other | 0 (0.0%) | 16 (100.0%) |
| Total | 423 (87.9%) | 58 (12.1%) |
Housing Structures by Number of Rooms in Magnolia Springs
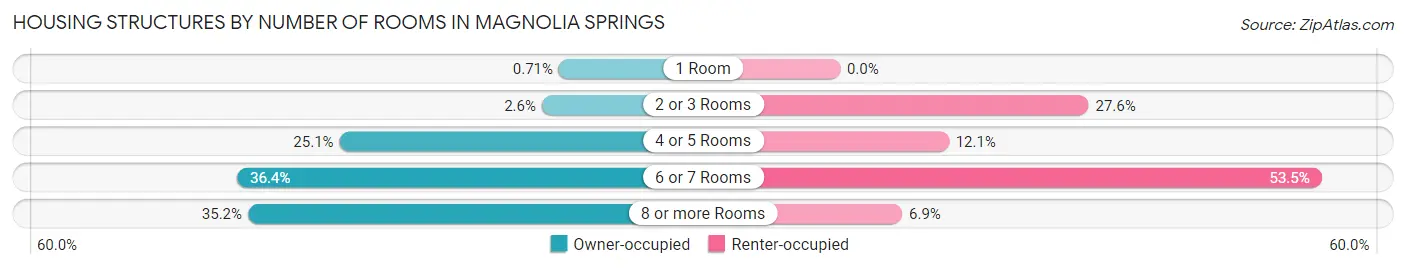
| Number of Rooms | Owner-occupied | Renter-occupied |
| 1 Room | 3 (0.7%) | 0 (0.0%) |
| 2 or 3 Rooms | 11 (2.6%) | 16 (27.6%) |
| 4 or 5 Rooms | 106 (25.1%) | 7 (12.1%) |
| 6 or 7 Rooms | 154 (36.4%) | 31 (53.4%) |
| 8 or more Rooms | 149 (35.2%) | 4 (6.9%) |
| Total | 423 (100.0%) | 58 (100.0%) |
Housing Structure by Heating Type in Magnolia Springs
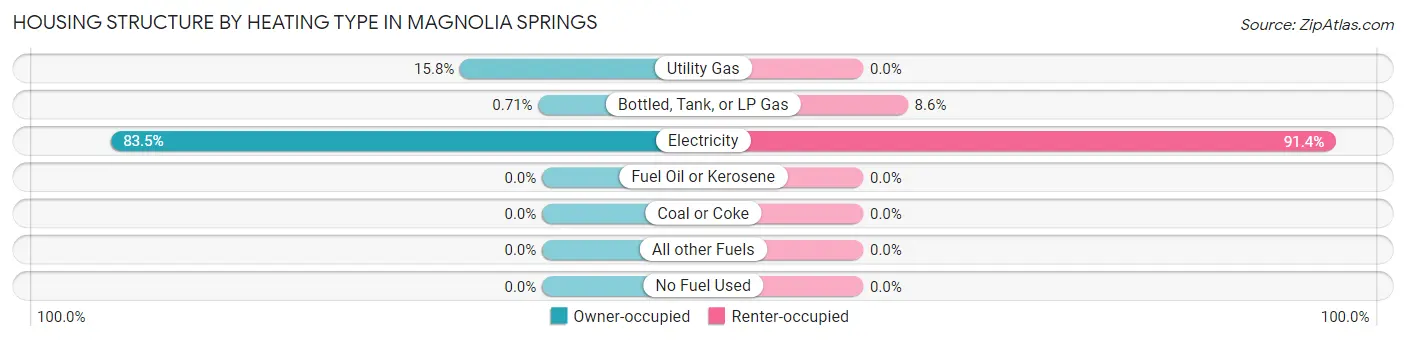
| Heating Type | Owner-occupied | Renter-occupied |
| Utility Gas | 67 (15.8%) | 0 (0.0%) |
| Bottled, Tank, or LP Gas | 3 (0.7%) | 5 (8.6%) |
| Electricity | 353 (83.5%) | 53 (91.4%) |
| Fuel Oil or Kerosene | 0 (0.0%) | 0 (0.0%) |
| Coal or Coke | 0 (0.0%) | 0 (0.0%) |
| All other Fuels | 0 (0.0%) | 0 (0.0%) |
| No Fuel Used | 0 (0.0%) | 0 (0.0%) |
| Total | 423 (100.0%) | 58 (100.0%) |
Household Vehicle Usage in Magnolia Springs
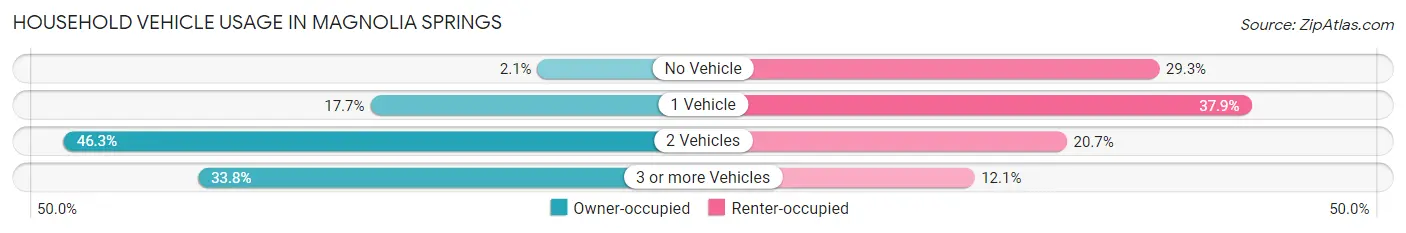
| Vehicles per Household | Owner-occupied | Renter-occupied |
| No Vehicle | 9 (2.1%) | 17 (29.3%) |
| 1 Vehicle | 75 (17.7%) | 22 (37.9%) |
| 2 Vehicles | 196 (46.3%) | 12 (20.7%) |
| 3 or more Vehicles | 143 (33.8%) | 7 (12.1%) |
| Total | 423 (100.0%) | 58 (100.0%) |
Real Estate & Mortgages in Magnolia Springs
Real Estate and Mortgage Overview in Magnolia Springs
| Characteristic | Without Mortgage | With Mortgage |
| Housing Units | 203 | 220 |
| Median Property Value | $290,900 | $422,000 |
| Median Household Income | $71,250 | $98 |
| Monthly Housing Costs | $497 | $51 |
| Real Estate Taxes | $961 | $13 |
Property Value by Mortgage Status in Magnolia Springs
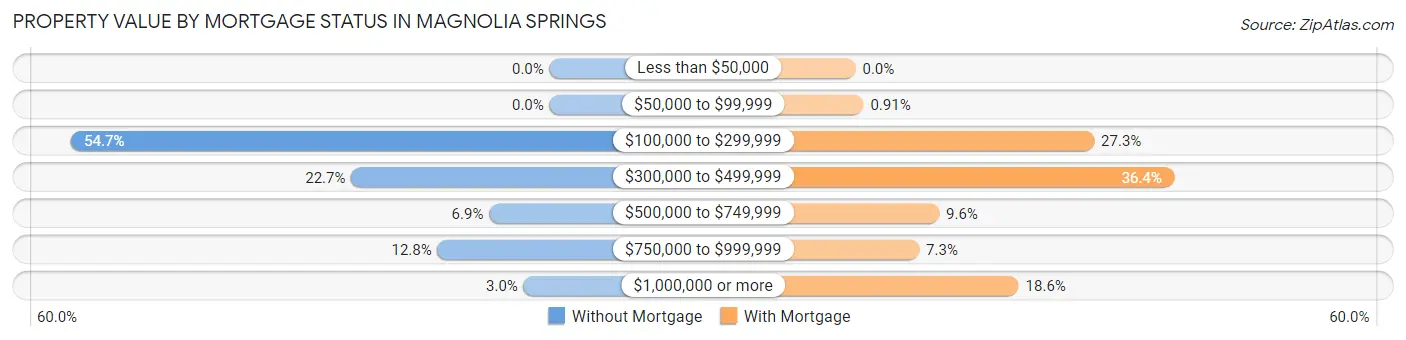
| Property Value | Without Mortgage | With Mortgage |
| Less than $50,000 | 0 (0.0%) | 0 (0.0%) |
| $50,000 to $99,999 | 0 (0.0%) | 2 (0.9%) |
| $100,000 to $299,999 | 111 (54.7%) | 60 (27.3%) |
| $300,000 to $499,999 | 46 (22.7%) | 80 (36.4%) |
| $500,000 to $749,999 | 14 (6.9%) | 21 (9.6%) |
| $750,000 to $999,999 | 26 (12.8%) | 16 (7.3%) |
| $1,000,000 or more | 6 (3.0%) | 41 (18.6%) |
| Total | 203 (100.0%) | 220 (100.0%) |
Household Income by Mortgage Status in Magnolia Springs
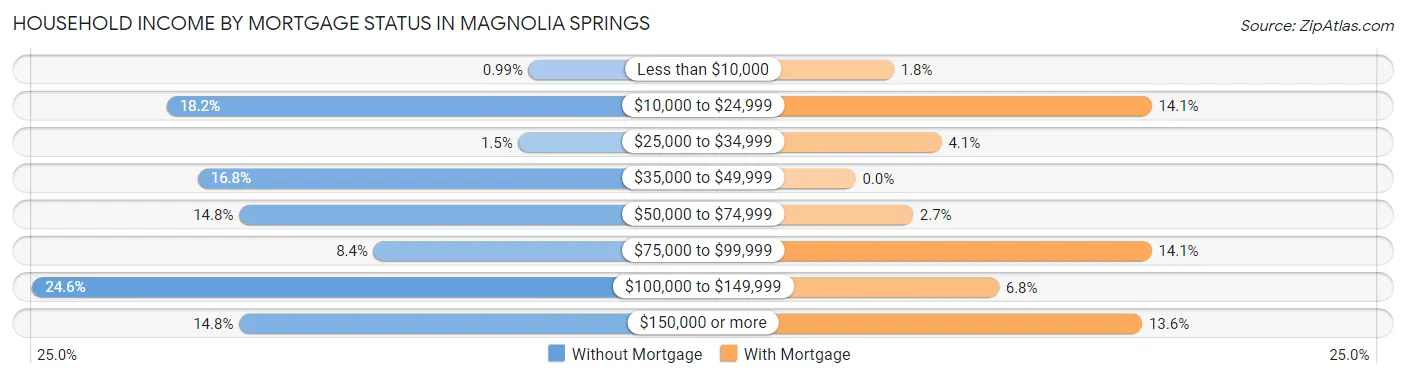
| Household Income | Without Mortgage | With Mortgage |
| Less than $10,000 | 2 (1.0%) | 4 (1.8%) |
| $10,000 to $24,999 | 37 (18.2%) | 31 (14.1%) |
| $25,000 to $34,999 | 3 (1.5%) | 9 (4.1%) |
| $35,000 to $49,999 | 34 (16.8%) | 0 (0.0%) |
| $50,000 to $74,999 | 30 (14.8%) | 6 (2.7%) |
| $75,000 to $99,999 | 17 (8.4%) | 31 (14.1%) |
| $100,000 to $149,999 | 50 (24.6%) | 15 (6.8%) |
| $150,000 or more | 30 (14.8%) | 30 (13.6%) |
| Total | 203 (100.0%) | 220 (100.0%) |
Property Value to Household Income Ratio in Magnolia Springs
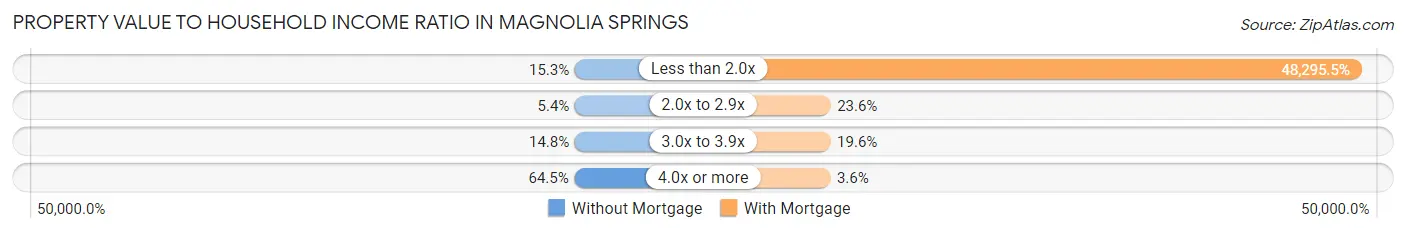
| Value-to-Income Ratio | Without Mortgage | With Mortgage |
| Less than 2.0x | 31 (15.3%) | 106,250 (48,295.4%) |
| 2.0x to 2.9x | 11 (5.4%) | 52 (23.6%) |
| 3.0x to 3.9x | 30 (14.8%) | 43 (19.6%) |
| 4.0x or more | 131 (64.5%) | 8 (3.6%) |
| Total | 203 (100.0%) | 220 (100.0%) |
Real Estate Taxes by Mortgage Status in Magnolia Springs
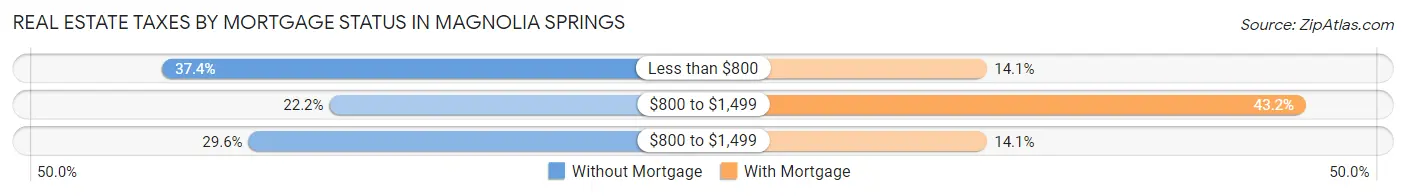
| Property Taxes | Without Mortgage | With Mortgage |
| Less than $800 | 76 (37.4%) | 31 (14.1%) |
| $800 to $1,499 | 45 (22.2%) | 95 (43.2%) |
| $800 to $1,499 | 60 (29.6%) | 31 (14.1%) |
| Total | 203 (100.0%) | 220 (100.0%) |
Health & Disability in Magnolia Springs
Health Insurance Coverage by Age in Magnolia Springs
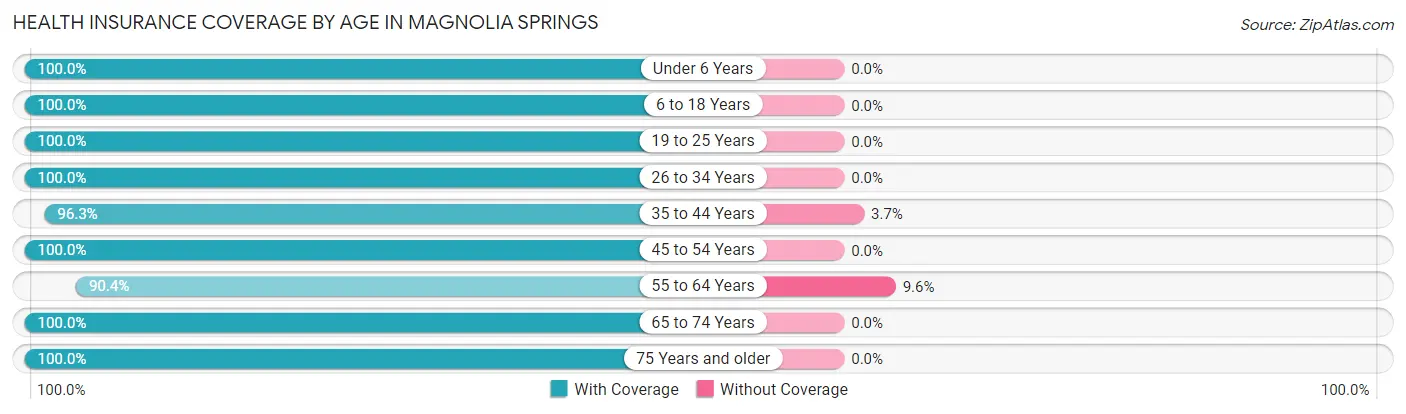
| Age Bracket | With Coverage | Without Coverage |
| Under 6 Years | 8 (100.0%) | 0 (0.0%) |
| 6 to 18 Years | 267 (100.0%) | 0 (0.0%) |
| 19 to 25 Years | 78 (100.0%) | 0 (0.0%) |
| 26 to 34 Years | 63 (100.0%) | 0 (0.0%) |
| 35 to 44 Years | 156 (96.3%) | 6 (3.7%) |
| 45 to 54 Years | 284 (100.0%) | 0 (0.0%) |
| 55 to 64 Years | 132 (90.4%) | 14 (9.6%) |
| 65 to 74 Years | 197 (100.0%) | 0 (0.0%) |
| 75 Years and older | 120 (100.0%) | 0 (0.0%) |
| Total | 1,305 (98.5%) | 20 (1.5%) |
Health Insurance Coverage by Citizenship Status in Magnolia Springs
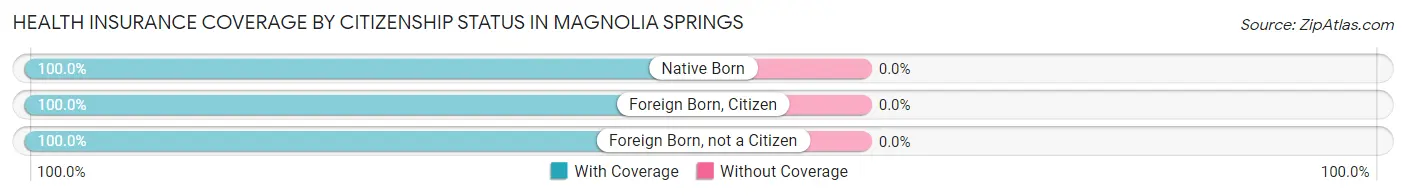
| Citizenship Status | With Coverage | Without Coverage |
| Native Born | 8 (100.0%) | 0 (0.0%) |
| Foreign Born, Citizen | 267 (100.0%) | 0 (0.0%) |
| Foreign Born, not a Citizen | 78 (100.0%) | 0 (0.0%) |
Health Insurance Coverage by Household Income in Magnolia Springs
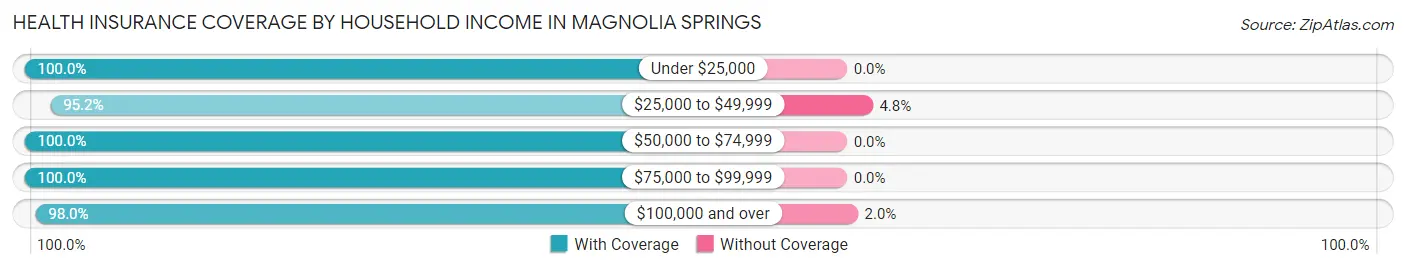
| Household Income | With Coverage | Without Coverage |
| Under $25,000 | 187 (100.0%) | 0 (0.0%) |
| $25,000 to $49,999 | 99 (95.2%) | 5 (4.8%) |
| $50,000 to $74,999 | 233 (100.0%) | 0 (0.0%) |
| $75,000 to $99,999 | 58 (100.0%) | 0 (0.0%) |
| $100,000 and over | 728 (98.0%) | 15 (2.0%) |
Public vs Private Health Insurance Coverage by Age in Magnolia Springs
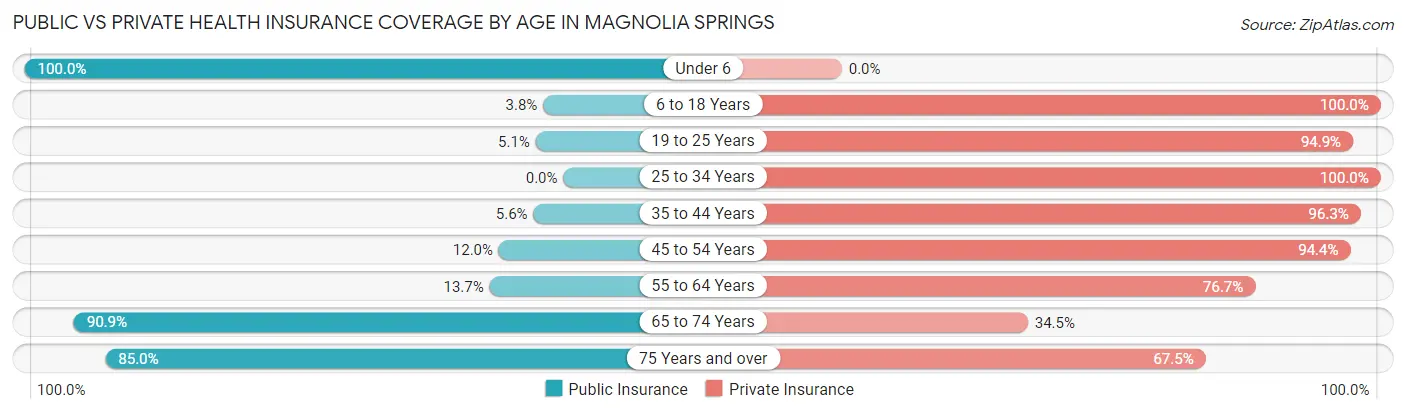
| Age Bracket | Public Insurance | Private Insurance |
| Under 6 | 8 (100.0%) | 0 (0.0%) |
| 6 to 18 Years | 10 (3.7%) | 267 (100.0%) |
| 19 to 25 Years | 4 (5.1%) | 74 (94.9%) |
| 25 to 34 Years | 0 (0.0%) | 63 (100.0%) |
| 35 to 44 Years | 9 (5.6%) | 156 (96.3%) |
| 45 to 54 Years | 34 (12.0%) | 268 (94.4%) |
| 55 to 64 Years | 20 (13.7%) | 112 (76.7%) |
| 65 to 74 Years | 179 (90.9%) | 68 (34.5%) |
| 75 Years and over | 102 (85.0%) | 81 (67.5%) |
| Total | 366 (27.6%) | 1,089 (82.2%) |
Disability Status by Sex by Age in Magnolia Springs
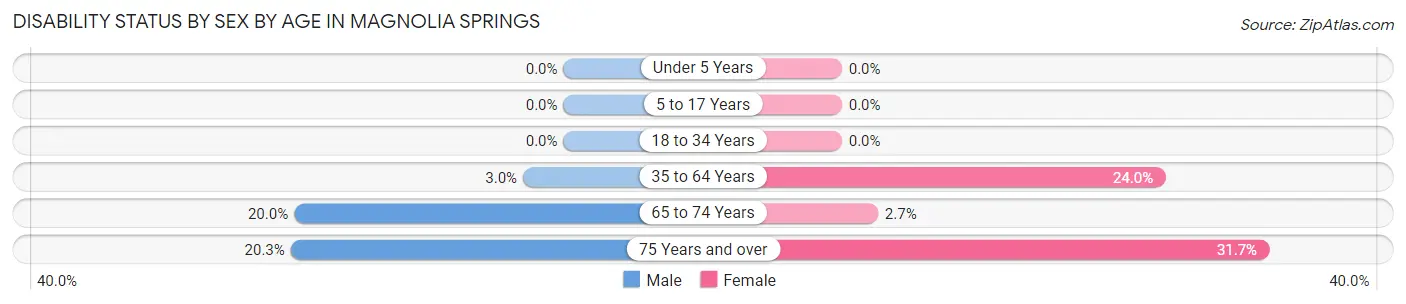
| Age Bracket | Male | Female |
| Under 5 Years | 0 (0.0%) | 0 (0.0%) |
| 5 to 17 Years | 0 (0.0%) | 0 (0.0%) |
| 18 to 34 Years | 0 (0.0%) | 0 (0.0%) |
| 35 to 64 Years | 8 (3.0%) | 78 (24.0%) |
| 65 to 74 Years | 17 (20.0%) | 3 (2.7%) |
| 75 Years and over | 16 (20.3%) | 13 (31.7%) |
Disability Class by Sex by Age in Magnolia Springs
Disability Class: Hearing Difficulty
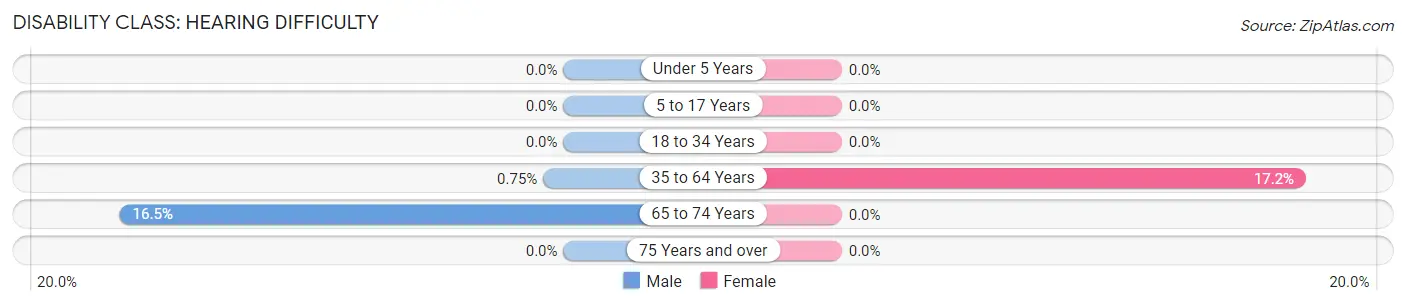
| Age Bracket | Male | Female |
| Under 5 Years | 0 (0.0%) | 0 (0.0%) |
| 5 to 17 Years | 0 (0.0%) | 0 (0.0%) |
| 18 to 34 Years | 0 (0.0%) | 0 (0.0%) |
| 35 to 64 Years | 2 (0.7%) | 56 (17.2%) |
| 65 to 74 Years | 14 (16.5%) | 0 (0.0%) |
| 75 Years and over | 0 (0.0%) | 0 (0.0%) |
Disability Class: Vision Difficulty
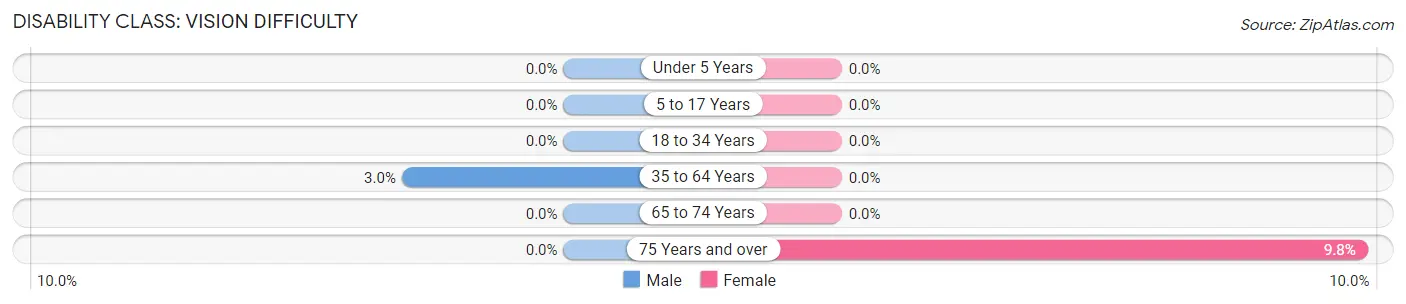
| Age Bracket | Male | Female |
| Under 5 Years | 0 (0.0%) | 0 (0.0%) |
| 5 to 17 Years | 0 (0.0%) | 0 (0.0%) |
| 18 to 34 Years | 0 (0.0%) | 0 (0.0%) |
| 35 to 64 Years | 8 (3.0%) | 0 (0.0%) |
| 65 to 74 Years | 0 (0.0%) | 0 (0.0%) |
| 75 Years and over | 0 (0.0%) | 4 (9.8%) |
Disability Class: Cognitive Difficulty
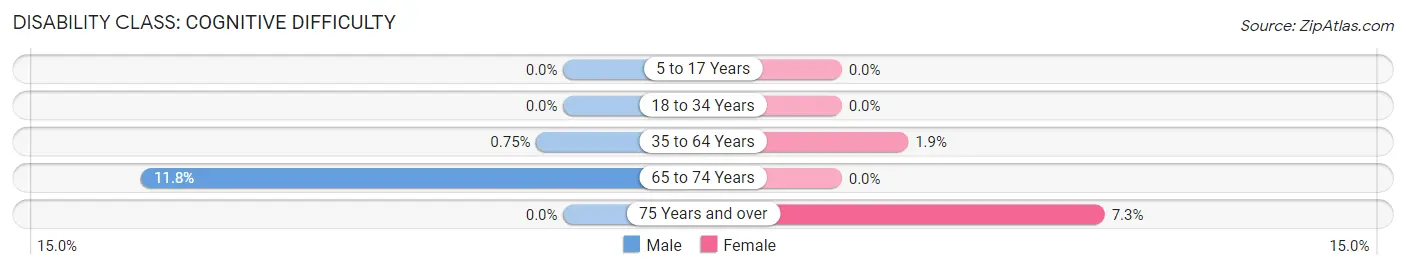
| Age Bracket | Male | Female |
| 5 to 17 Years | 0 (0.0%) | 0 (0.0%) |
| 18 to 34 Years | 0 (0.0%) | 0 (0.0%) |
| 35 to 64 Years | 2 (0.7%) | 6 (1.8%) |
| 65 to 74 Years | 10 (11.8%) | 0 (0.0%) |
| 75 Years and over | 0 (0.0%) | 3 (7.3%) |
Disability Class: Ambulatory Difficulty
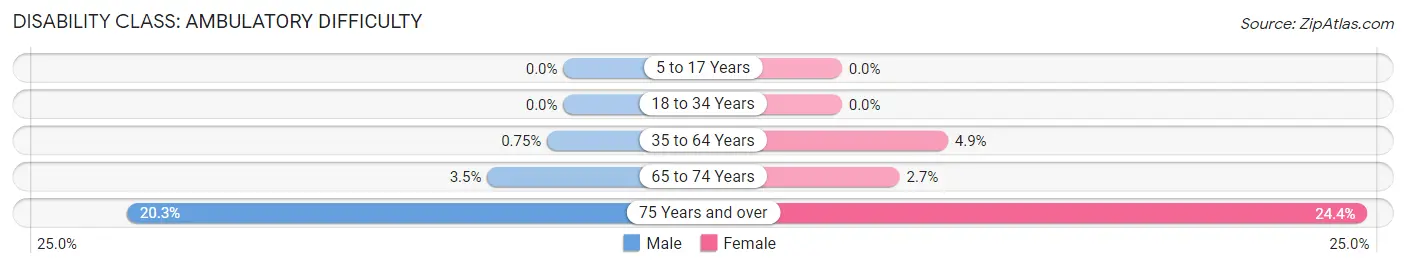
| Age Bracket | Male | Female |
| 5 to 17 Years | 0 (0.0%) | 0 (0.0%) |
| 18 to 34 Years | 0 (0.0%) | 0 (0.0%) |
| 35 to 64 Years | 2 (0.7%) | 16 (4.9%) |
| 65 to 74 Years | 3 (3.5%) | 3 (2.7%) |
| 75 Years and over | 16 (20.3%) | 10 (24.4%) |
Disability Class: Self-Care Difficulty
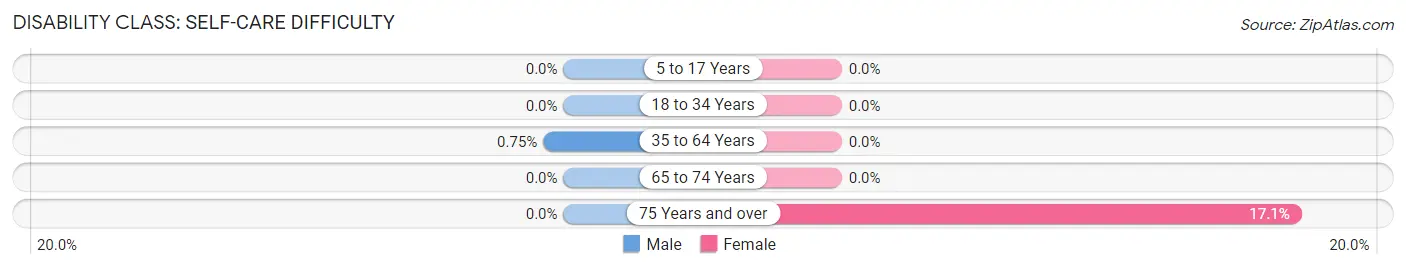
| Age Bracket | Male | Female |
| 5 to 17 Years | 0 (0.0%) | 0 (0.0%) |
| 18 to 34 Years | 0 (0.0%) | 0 (0.0%) |
| 35 to 64 Years | 2 (0.7%) | 0 (0.0%) |
| 65 to 74 Years | 0 (0.0%) | 0 (0.0%) |
| 75 Years and over | 0 (0.0%) | 7 (17.1%) |
Technology Access in Magnolia Springs
Computing Device Access in Magnolia Springs
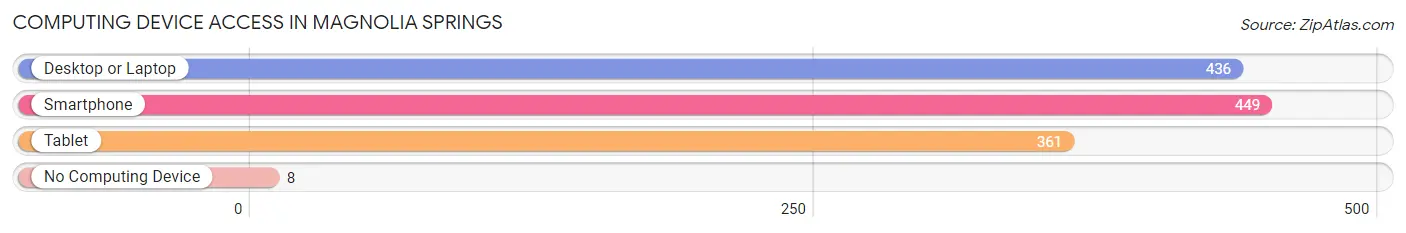
| Device Type | # Households | % Households |
| Desktop or Laptop | 436 | 90.6% |
| Smartphone | 449 | 93.3% |
| Tablet | 361 | 75.0% |
| No Computing Device | 8 | 1.7% |
| Total | 481 | 100.0% |
Internet Access in Magnolia Springs
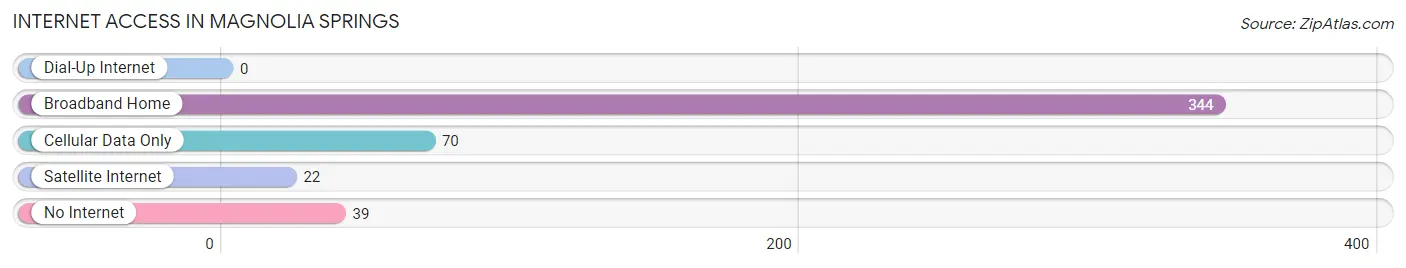
| Internet Type | # Households | % Households |
| Dial-Up Internet | 0 | 0.0% |
| Broadband Home | 344 | 71.5% |
| Cellular Data Only | 70 | 14.5% |
| Satellite Internet | 22 | 4.6% |
| No Internet | 39 | 8.1% |
| Total | 481 | 100.0% |
Magnolia Springs Summary
Magnolia Springs is a small town located in Baldwin County, Alabama. It is situated on the banks of the Magnolia River, which flows through the town and is a popular spot for fishing and boating. The town was founded in 1836 and has a population of approximately 1,000 people.
Geography
Magnolia Springs is located in the southern part of Baldwin County, Alabama. It is situated on the banks of the Magnolia River, which flows through the town and is a popular spot for fishing and boating. The town is surrounded by lush forests and is home to a variety of wildlife, including deer, wild turkeys, and bald eagles. The town is also home to several parks, including Magnolia Springs State Park, which offers camping, hiking, and fishing opportunities.
Economy
The economy of Magnolia Springs is largely based on tourism. The town is home to several bed and breakfasts, as well as a variety of restaurants and shops. The town is also home to a number of art galleries and antique stores. The town is also home to a number of small businesses, including a local newspaper, a hardware store, and a grocery store.
Demographics
As of the 2010 census, the population of Magnolia Springs was 1,000 people. The racial makeup of the town was 97.2% White, 0.7% African American, 0.3% Native American, 0.2% Asian, 0.1% Pacific Islander, 0.2% from other races, and 1.3% from two or more races. The median household income was $37,500 and the median family income was $45,000.
History
Magnolia Springs was founded in 1836 by settlers from Georgia and South Carolina. The town was named after the Magnolia River, which flows through the town. The town was originally a farming community, but it soon became a popular tourist destination due to its natural beauty and proximity to the Gulf of Mexico. The town was also home to a number of resorts, which attracted visitors from all over the country.
In the late 19th century, the town was home to a number of sawmills and lumber companies. The town was also home to a number of churches, including the Magnolia Springs Baptist Church, which was founded in 1845.
In the early 20th century, the town was home to a number of resorts, including the Magnolia Springs Hotel, which was built in 1910. The hotel was a popular destination for visitors from all over the country. The town was also home to a number of other businesses, including a newspaper, a hardware store, and a grocery store.
Today, Magnolia Springs is a popular tourist destination due to its natural beauty and proximity to the Gulf of Mexico. The town is home to a number of bed and breakfasts, as well as a variety of restaurants and shops. The town is also home to a number of art galleries and antique stores. The town is also home to a number of small businesses, including a local newspaper, a hardware store, and a grocery store.
Common Questions
What is the Total Population of Magnolia Springs?
Total Population of Magnolia Springs is 1,325.
What is the Total Male Population of Magnolia Springs?
Total Male Population of Magnolia Springs is 598.
What is the Total Female Population of Magnolia Springs?
Total Female Population of Magnolia Springs is 727.
What is the Ratio of Males per 100 Females in Magnolia Springs?
There are 82.26 Males per 100 Females in Magnolia Springs.
What is the Ratio of Females per 100 Males in Magnolia Springs?
There are 121.57 Females per 100 Males in Magnolia Springs.
What is the Median Population Age in Magnolia Springs?
Median Population Age in Magnolia Springs is 48.6 Years.
What is the Average Family Size in Magnolia Springs
Average Family Size in Magnolia Springs is 3.4 People.
What is the Average Household Size in Magnolia Springs
Average Household Size in Magnolia Springs is 2.8 People.
What is Per Capita Income in Magnolia Springs?
Per Capita income in Magnolia Springs is $43,796.
What is the Median Family Income in Magnolia Springs?
Median Family Income in Magnolia Springs is $102,366.
What is the Median Household income in Magnolia Springs?
Median Household Income in Magnolia Springs is $88,583.
What is Income or Wage Gap in Magnolia Springs?
Income or Wage Gap in Magnolia Springs is 30.2%.
Women in Magnolia Springs earn 69.8 cents for every dollar earned by a man.
What is Family Income Deficit in Magnolia Springs?
Family Income Deficit in Magnolia Springs is $23,884.
Families that are below poverty line in Magnolia Springs earn $23,884 less on average than the poverty threshold level.
What is Inequality or Gini Index in Magnolia Springs?
Inequality or Gini Index in Magnolia Springs is 0.47.
How Large is the Labor Force in Magnolia Springs?
There are 620 People in the Labor Forcein in Magnolia Springs.
What is the Percentage of People in the Labor Force in Magnolia Springs?
56.8% of People are in the Labor Force in Magnolia Springs.
What is the Unemployment Rate in Magnolia Springs?
Unemployment Rate in Magnolia Springs is 2.3%.