Leroy, AL
Leroy Map
Leroy Overview
1,061
TOTAL POPULATION
530
MALE POPULATION
531
FEMALE POPULATION
99.81
MALES / 100 FEMALES
100.19
FEMALES / 100 MALES
37.5
MEDIAN AGE
3.7
AVG FAMILY SIZE
3.0
AVG HOUSEHOLD SIZE
$34,031
PER CAPITA INCOME
$114,464
AVG FAMILY INCOME
$102,500
AVG HOUSEHOLD INCOME
0.35
INEQUALITY / GINI INDEX
420
LABOR FORCE [ PEOPLE ]
53.3%
PERCENT IN LABOR FORCE
8.1%
UNEMPLOYMENT RATE
Leroy Zip Codes
Leroy Area Codes
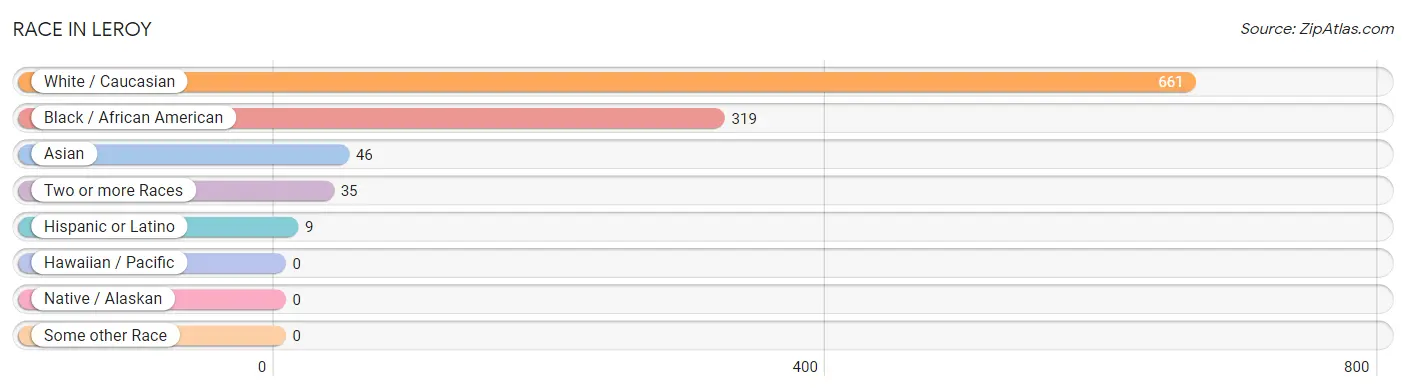
Race in Leroy
The most populous races in Leroy are White / Caucasian (661 | 62.3%), Black / African American (319 | 30.1%), and Asian (46 | 4.3%).
| Race | # Population | % Population |
| Asian | 46 | 4.3% |
| Black / African American | 319 | 30.1% |
| Hawaiian / Pacific | 0 | 0.0% |
| Hispanic or Latino | 9 | 0.9% |
| Native / Alaskan | 0 | 0.0% |
| White / Caucasian | 661 | 62.3% |
| Two or more Races | 35 | 3.3% |
| Some other Race | 0 | 0.0% |
| Total | 1,061 | 100.0% |
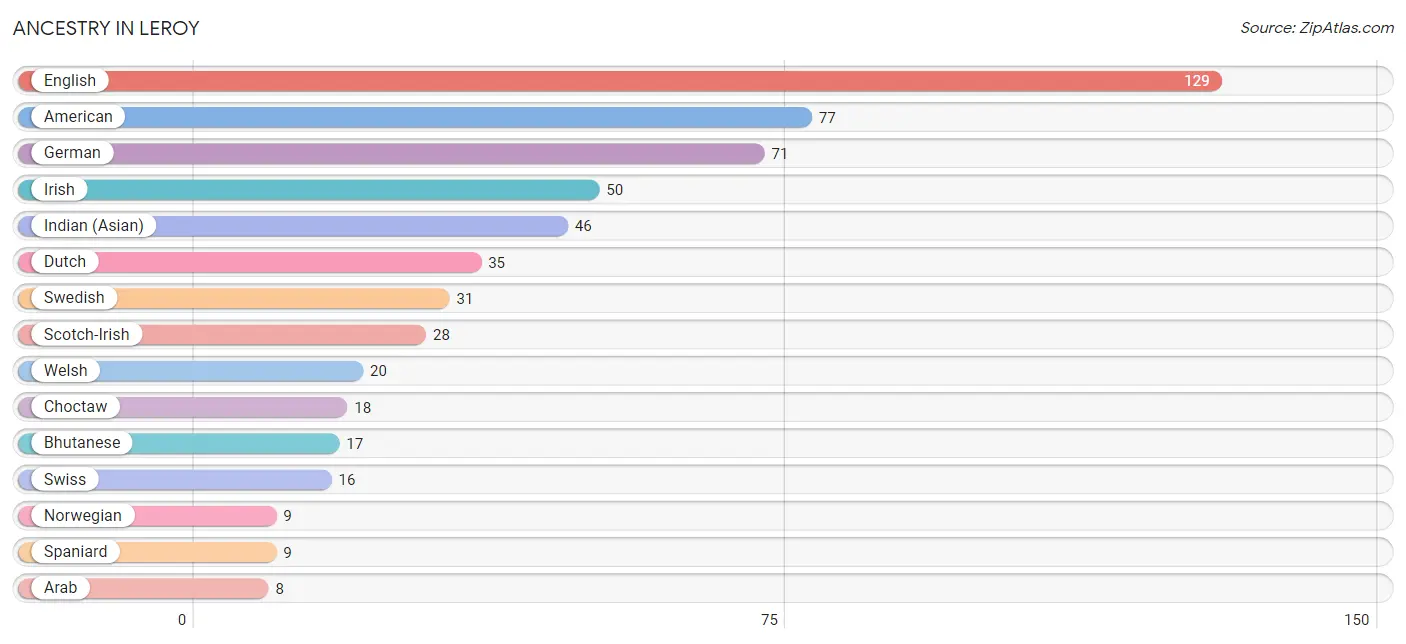
Ancestry in Leroy
The most populous ancestries reported in Leroy are English (129 | 12.2%), American (77 | 7.3%), German (71 | 6.7%), Irish (50 | 4.7%), and Indian (Asian) (46 | 4.3%), together accounting for 35.2% of all Leroy residents.
| Ancestry | # Population | % Population |
| American | 77 | 7.3% |
| Arab | 8 | 0.7% |
| Bhutanese | 17 | 1.6% |
| Choctaw | 18 | 1.7% |
| Dutch | 35 | 3.3% |
| English | 129 | 12.2% |
| German | 71 | 6.7% |
| Indian (Asian) | 46 | 4.3% |
| Irish | 50 | 4.7% |
| Lebanese | 8 | 0.7% |
| Norwegian | 9 | 0.9% |
| Scotch-Irish | 28 | 2.6% |
| Spaniard | 9 | 0.9% |
| Swedish | 31 | 2.9% |
| Swiss | 16 | 1.5% |
| Welsh | 20 | 1.9% | View All 16 Rows |
Immigrants in Leroy

| Immigration Origin | # Population | % Population | View All 0 Rows |
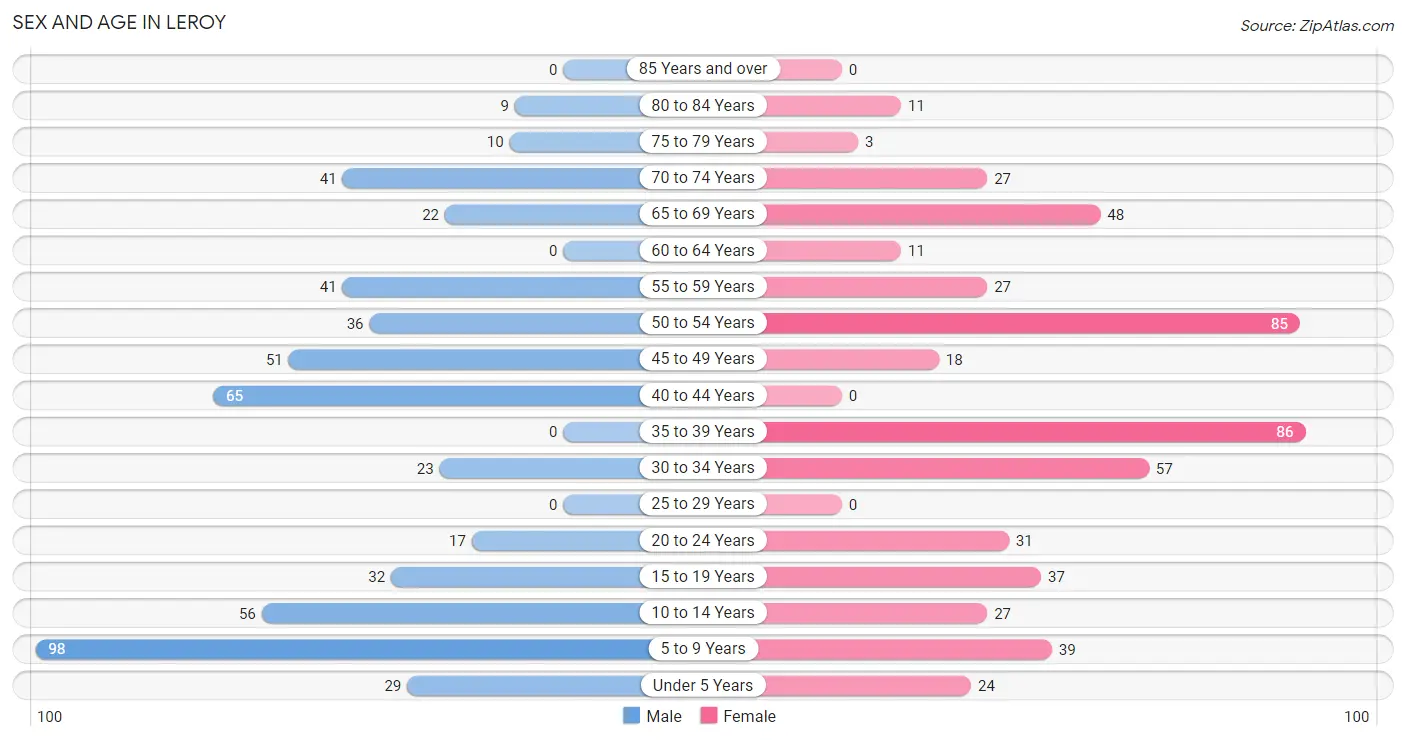
Sex and Age in Leroy
Sex and Age in Leroy
The most populous age groups in Leroy are 5 to 9 Years (98 | 18.5%) for men and 35 to 39 Years (86 | 16.2%) for women.
| Age Bracket | Male | Female |
| Under 5 Years | 29 (5.5%) | 24 (4.5%) |
| 5 to 9 Years | 98 (18.5%) | 39 (7.3%) |
| 10 to 14 Years | 56 (10.6%) | 27 (5.1%) |
| 15 to 19 Years | 32 (6.0%) | 37 (7.0%) |
| 20 to 24 Years | 17 (3.2%) | 31 (5.8%) |
| 25 to 29 Years | 0 (0.0%) | 0 (0.0%) |
| 30 to 34 Years | 23 (4.3%) | 57 (10.7%) |
| 35 to 39 Years | 0 (0.0%) | 86 (16.2%) |
| 40 to 44 Years | 65 (12.3%) | 0 (0.0%) |
| 45 to 49 Years | 51 (9.6%) | 18 (3.4%) |
| 50 to 54 Years | 36 (6.8%) | 85 (16.0%) |
| 55 to 59 Years | 41 (7.7%) | 27 (5.1%) |
| 60 to 64 Years | 0 (0.0%) | 11 (2.1%) |
| 65 to 69 Years | 22 (4.2%) | 48 (9.0%) |
| 70 to 74 Years | 41 (7.7%) | 27 (5.1%) |
| 75 to 79 Years | 10 (1.9%) | 3 (0.6%) |
| 80 to 84 Years | 9 (1.7%) | 11 (2.1%) |
| 85 Years and over | 0 (0.0%) | 0 (0.0%) |
| Total | 530 (100.0%) | 531 (100.0%) |
Families and Households in Leroy
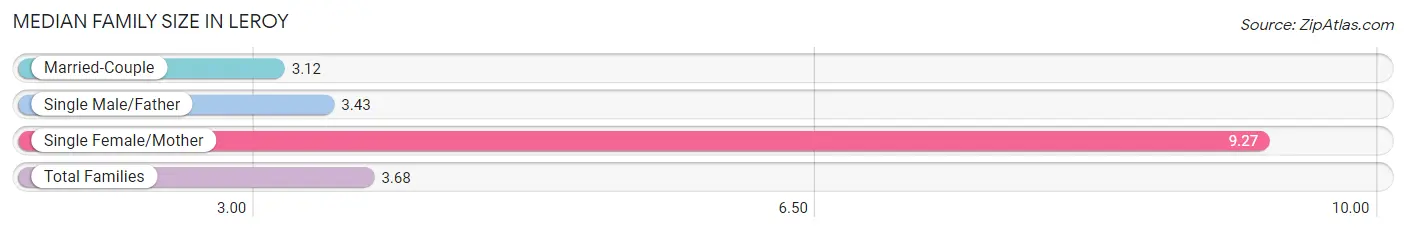
Median Family Size in Leroy
The median family size in Leroy is 3.68 persons per family, with single female/mother families (22 | 8.9%) accounting for the largest median family size of 9.27 persons per family. On the other hand, married-couple families (219 | 88.3%) represent the smallest median family size with 3.12 persons per family.
| Family Type | # Families | Family Size |
| Married-Couple | 219 (88.3%) | 3.12 |
| Single Male/Father | 7 (2.8%) | 3.43 |
| Single Female/Mother | 22 (8.9%) | 9.27 |
| Total Families | 248 (100.0%) | 3.68 |
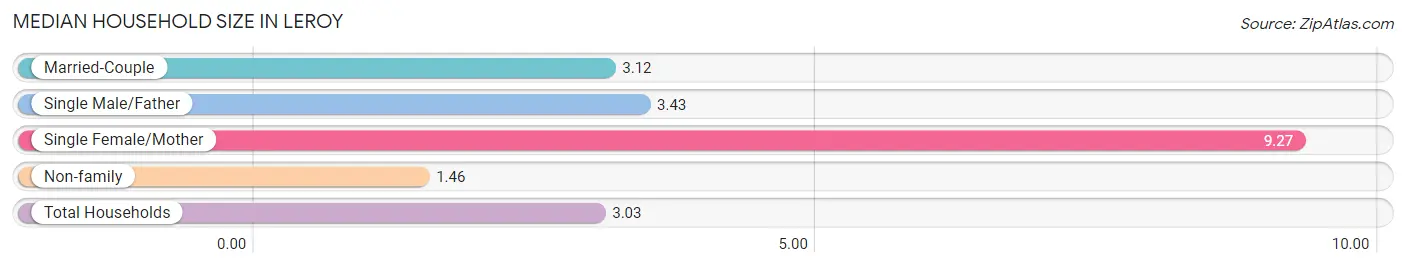
Median Household Size in Leroy
The median household size in Leroy is 3.03 persons per household, with single female/mother households (22 | 6.3%) accounting for the largest median household size of 9.27 persons per household. non-family households (102 | 29.1%) represent the smallest median household size with 1.46 persons per household.
| Household Type | # Households | Household Size |
| Married-Couple | 219 (62.6%) | 3.12 |
| Single Male/Father | 7 (2.0%) | 3.43 |
| Single Female/Mother | 22 (6.3%) | 9.27 |
| Non-family | 102 (29.1%) | 1.46 |
| Total Households | 350 (100.0%) | 3.03 |
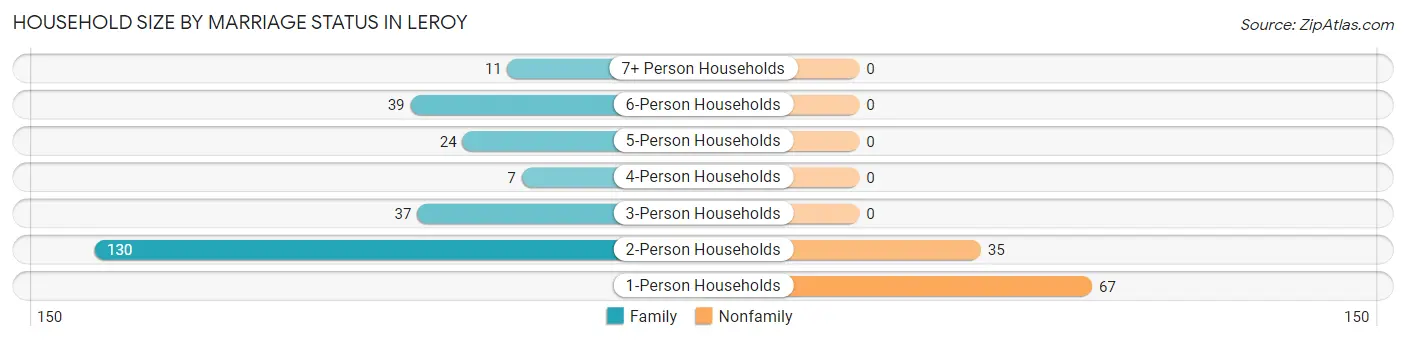
Household Size by Marriage Status in Leroy
Out of a total of 350 households in Leroy, 248 (70.9%) are family households, while 102 (29.1%) are nonfamily households. The most numerous type of family households are 2-person households, comprising 130, and the most common type of nonfamily households are 1-person households, comprising 67.
| Household Size | Family Households | Nonfamily Households |
| 1-Person Households | - | 67 (19.1%) |
| 2-Person Households | 130 (37.1%) | 35 (10.0%) |
| 3-Person Households | 37 (10.6%) | 0 (0.0%) |
| 4-Person Households | 7 (2.0%) | 0 (0.0%) |
| 5-Person Households | 24 (6.9%) | 0 (0.0%) |
| 6-Person Households | 39 (11.1%) | 0 (0.0%) |
| 7+ Person Households | 11 (3.1%) | 0 (0.0%) |
| Total | 248 (70.9%) | 102 (29.1%) |
Female Fertility in Leroy
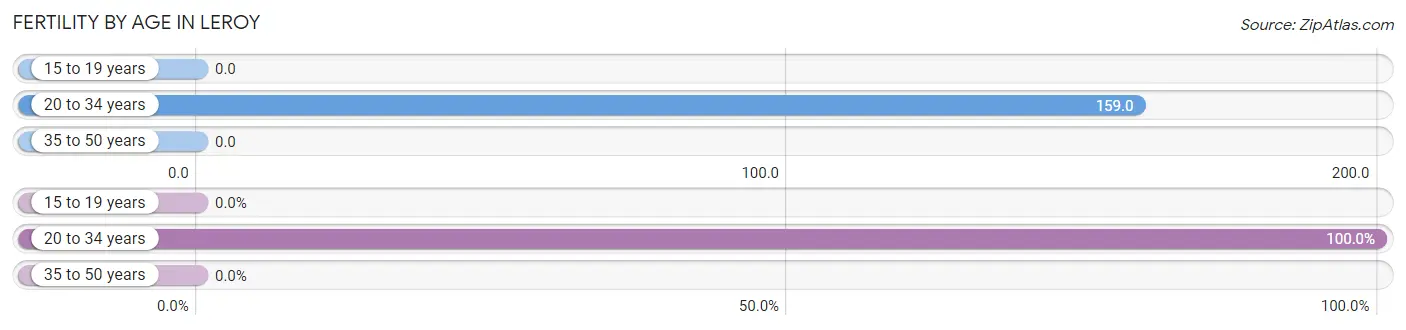
Fertility by Age in Leroy
Average fertility rate in Leroy is 61.0 births per 1,000 women. Women in the age bracket of 20 to 34 years have the highest fertility rate with 159.0 births per 1,000 women. Women in the age bracket of 20 to 34 years acount for 100.0% of all women with births.
| Age Bracket | Women with Births | Births / 1,000 Women |
| 15 to 19 years | 0 (0.0%) | 0.0 |
| 20 to 34 years | 14 (100.0%) | 159.0 |
| 35 to 50 years | 0 (0.0%) | 0.0 |
| Total | 14 (100.0%) | 61.0 |
Fertility by Age by Marriage Status in Leroy
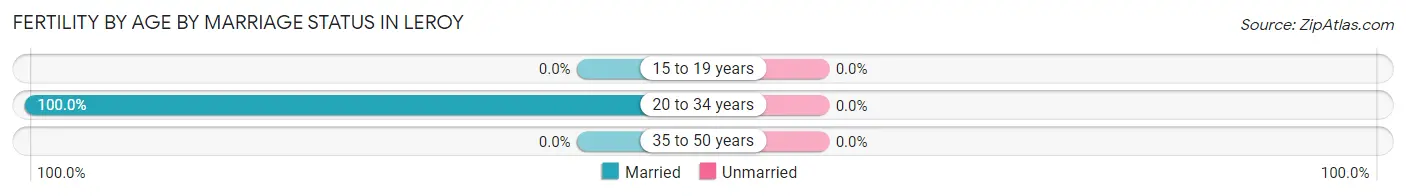
| Age Bracket | Married | Unmarried |
| 15 to 19 years | 0 (0.0%) | 0 (0.0%) |
| 20 to 34 years | 14 (100.0%) | 0 (0.0%) |
| 35 to 50 years | 0 (0.0%) | 0 (0.0%) |
| Total | 14 (100.0%) | 0 (0.0%) |
Fertility by Education in Leroy
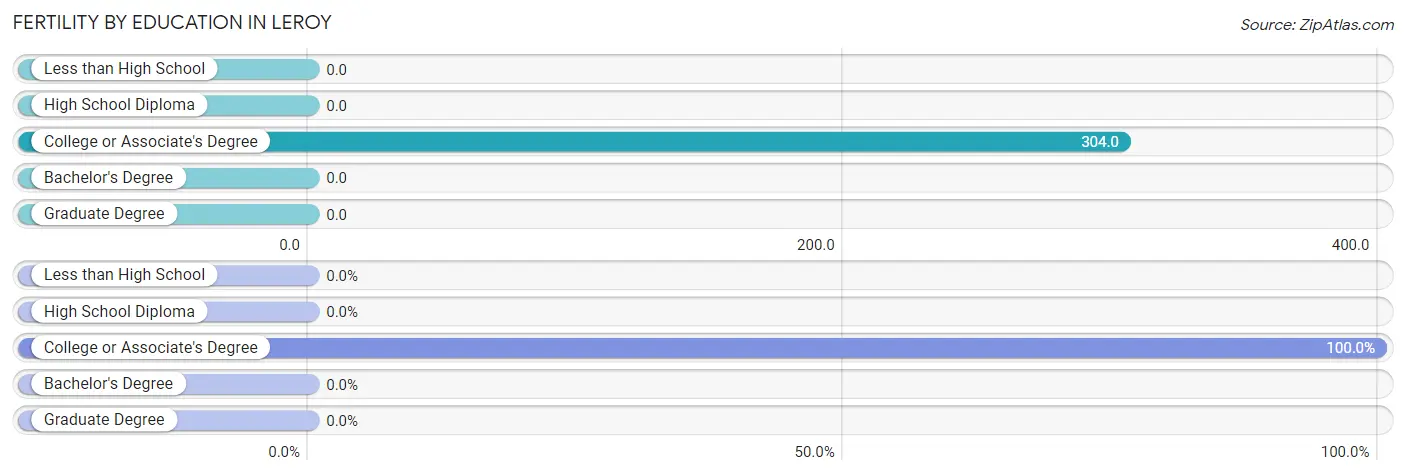
| Educational Attainment | Women with Births | Births / 1,000 Women |
| Less than High School | 0 (0.0%) | 0.0 |
| High School Diploma | 0 (0.0%) | 0.0 |
| College or Associate's Degree | 14 (100.0%) | 304.0 |
| Bachelor's Degree | 0 (0.0%) | 0.0 |
| Graduate Degree | 0 (0.0%) | 0.0 |
| Total | 14 (100.0%) | 61.0 |
Fertility by Education by Marriage Status in Leroy
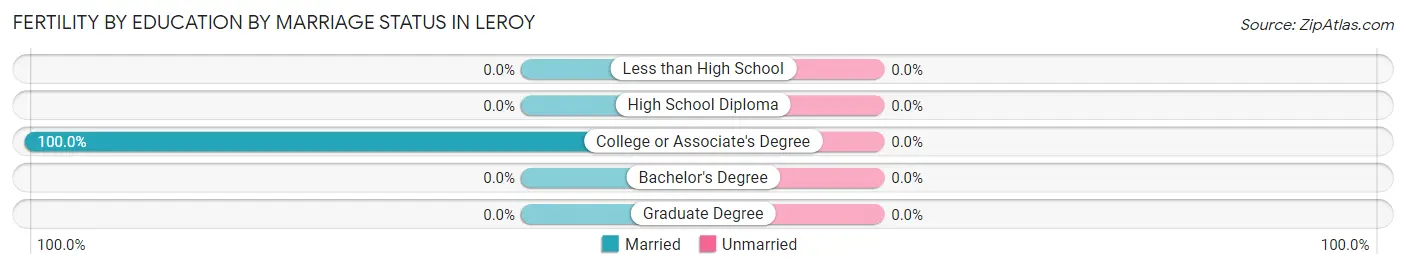
| Educational Attainment | Married | Unmarried |
| Less than High School | 0 (0.0%) | 0 (0.0%) |
| High School Diploma | 0 (0.0%) | 0 (0.0%) |
| College or Associate's Degree | 14 (100.0%) | 0 (0.0%) |
| Bachelor's Degree | 0 (0.0%) | 0 (0.0%) |
| Graduate Degree | 0 (0.0%) | 0 (0.0%) |
| Total | 14 (100.0%) | 0 (0.0%) |
Income in Leroy
Income Overview in Leroy
Per Capita Income in Leroy is $34,031, while median incomes of families and households are $114,464 and $102,500 respectively.
| Characteristic | Number | Measure |
| Per Capita Income | 1,061 | $34,031 |
| Median Family Income | 248 | $114,464 |
| Mean Family Income | 248 | $111,155 |
| Median Household Income | 350 | $102,500 |
| Mean Household Income | 350 | $96,480 |
| Income Deficit | 248 | $0 |
| Wage / Income Gap (%) | 1,061 | 0.00% |
| Wage / Income Gap ($) | 1,061 | 100.00¢ per $1 |
| Gini / Inequality Index | 1,061 | 0.35 |
Earnings by Sex in Leroy
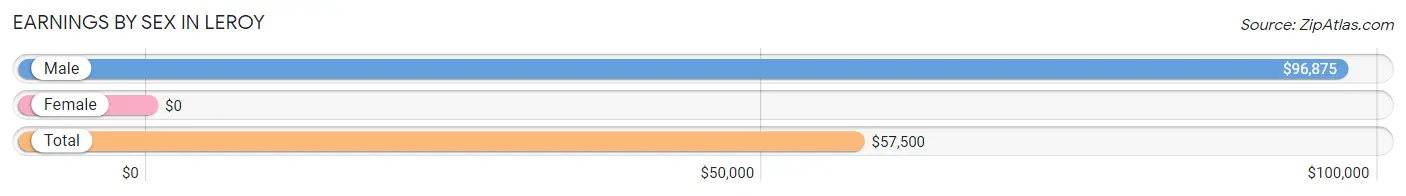
| Sex | Number | Average Earnings |
| Male | 224 (51.1%) | $96,875 |
| Female | 214 (48.9%) | $0 |
| Total | 438 (100.0%) | $57,500 |
Earnings by Sex by Income Bracket in Leroy
The most common earnings brackets in Leroy are $100,000+ for men (110 | 49.1%) and $55,000 to $64,999 for women (81 | 37.9%).
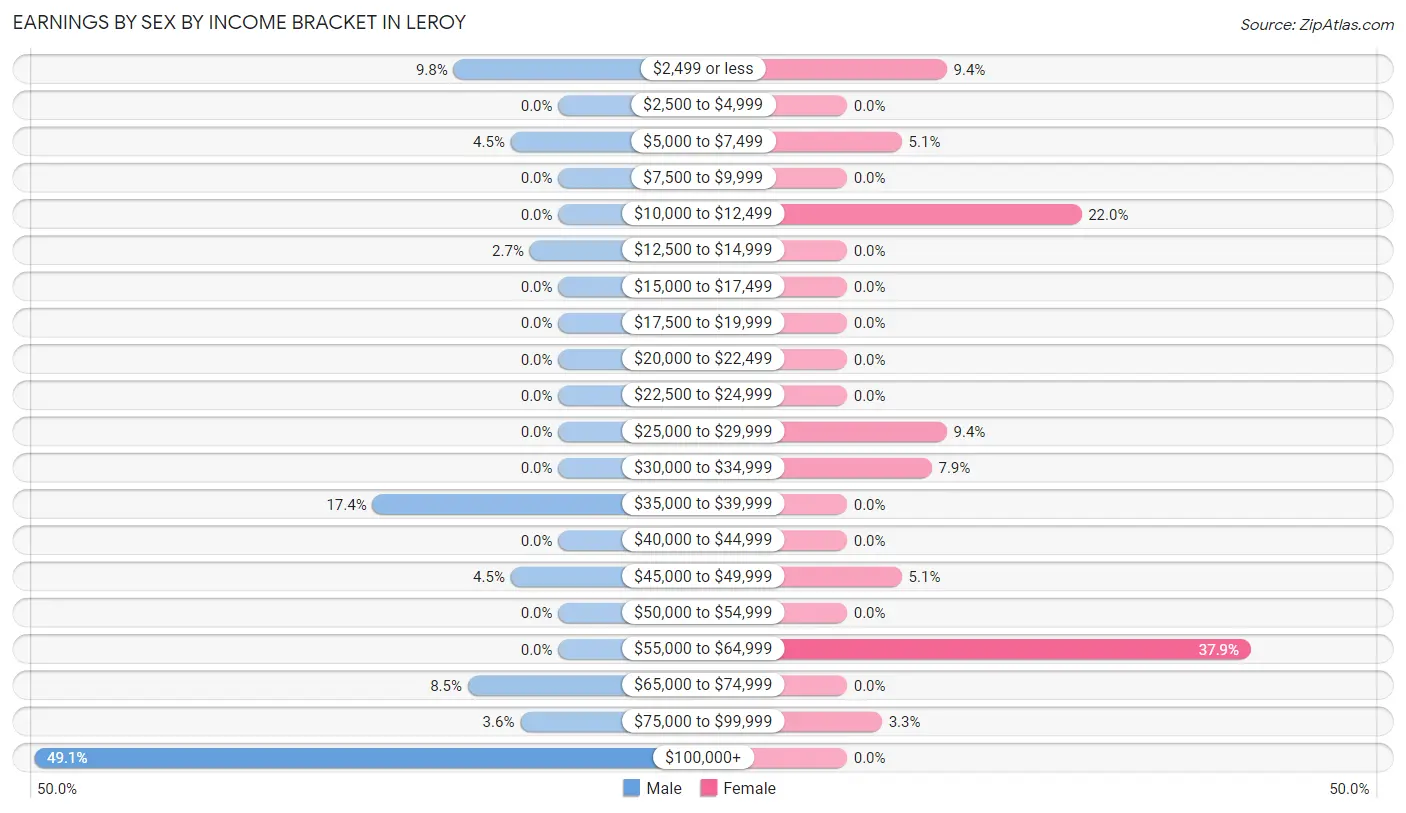
| Income | Male | Female |
| $2,499 or less | 22 (9.8%) | 20 (9.3%) |
| $2,500 to $4,999 | 0 (0.0%) | 0 (0.0%) |
| $5,000 to $7,499 | 10 (4.5%) | 11 (5.1%) |
| $7,500 to $9,999 | 0 (0.0%) | 0 (0.0%) |
| $10,000 to $12,499 | 0 (0.0%) | 47 (22.0%) |
| $12,500 to $14,999 | 6 (2.7%) | 0 (0.0%) |
| $15,000 to $17,499 | 0 (0.0%) | 0 (0.0%) |
| $17,500 to $19,999 | 0 (0.0%) | 0 (0.0%) |
| $20,000 to $22,499 | 0 (0.0%) | 0 (0.0%) |
| $22,500 to $24,999 | 0 (0.0%) | 0 (0.0%) |
| $25,000 to $29,999 | 0 (0.0%) | 20 (9.3%) |
| $30,000 to $34,999 | 0 (0.0%) | 17 (7.9%) |
| $35,000 to $39,999 | 39 (17.4%) | 0 (0.0%) |
| $40,000 to $44,999 | 0 (0.0%) | 0 (0.0%) |
| $45,000 to $49,999 | 10 (4.5%) | 11 (5.1%) |
| $50,000 to $54,999 | 0 (0.0%) | 0 (0.0%) |
| $55,000 to $64,999 | 0 (0.0%) | 81 (37.9%) |
| $65,000 to $74,999 | 19 (8.5%) | 0 (0.0%) |
| $75,000 to $99,999 | 8 (3.6%) | 7 (3.3%) |
| $100,000+ | 110 (49.1%) | 0 (0.0%) |
| Total | 224 (100.0%) | 214 (100.0%) |
Earnings by Sex by Educational Attainment in Leroy
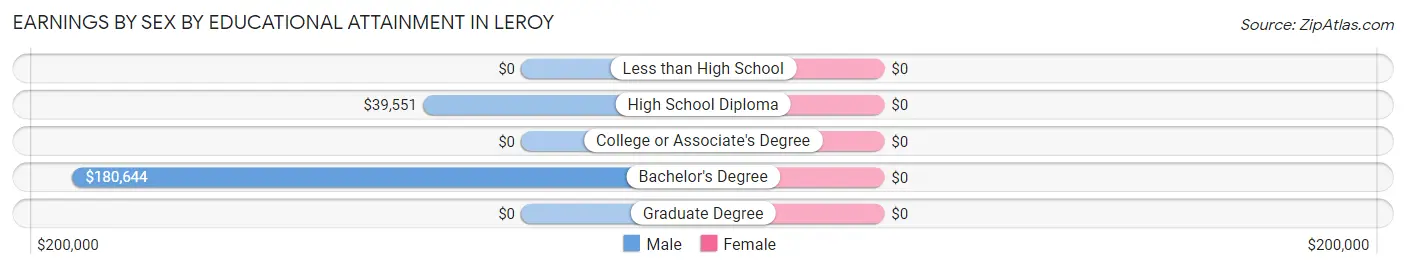
| Educational Attainment | Male Income | Female Income |
| Less than High School | - | - |
| High School Diploma | $39,551 | $0 |
| College or Associate's Degree | - | - |
| Bachelor's Degree | $180,644 | $0 |
| Graduate Degree | - | - |
| Total | $106,065 | $0 |
Family Income in Leroy
Family Income Brackets in Leroy
According to the Leroy family income data, there are 84 families falling into the $100,000 to $149,999 income range, which is the most common income bracket and makes up 33.9% of all families.
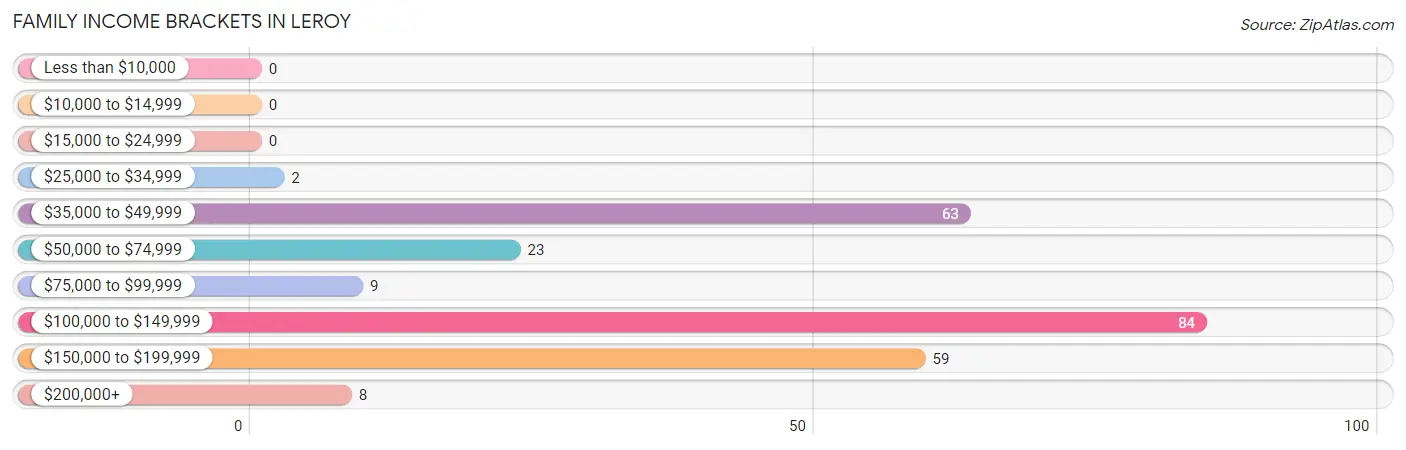
| Income Bracket | # Families | % Families |
| Less than $10,000 | 0 | 0.0% |
| $10,000 to $14,999 | 0 | 0.0% |
| $15,000 to $24,999 | 0 | 0.0% |
| $25,000 to $34,999 | 2 | 0.8% |
| $35,000 to $49,999 | 63 | 25.4% |
| $50,000 to $74,999 | 23 | 9.3% |
| $75,000 to $99,999 | 9 | 3.6% |
| $100,000 to $149,999 | 84 | 33.9% |
| $150,000 to $199,999 | 59 | 23.8% |
| $200,000+ | 8 | 3.2% |
Family Income by Famaliy Size in Leroy
3-person families (37 | 14.9%) account for the highest median family income in Leroy with $158,859 per family, while 2-person families (130 | 52.4%) have the highest median income of $62,868 per family member.
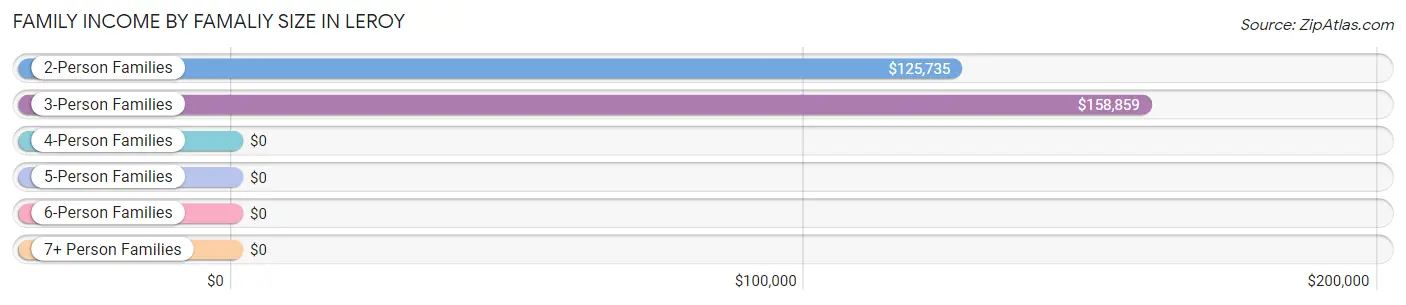
| Income Bracket | # Families | Median Income |
| 2-Person Families | 130 (52.4%) | $125,735 |
| 3-Person Families | 37 (14.9%) | $158,859 |
| 4-Person Families | 7 (2.8%) | $0 |
| 5-Person Families | 24 (9.7%) | $0 |
| 6-Person Families | 39 (15.7%) | $0 |
| 7+ Person Families | 11 (4.4%) | $0 |
| Total | 248 (100.0%) | $114,464 |
Family Income by Number of Earners in Leroy
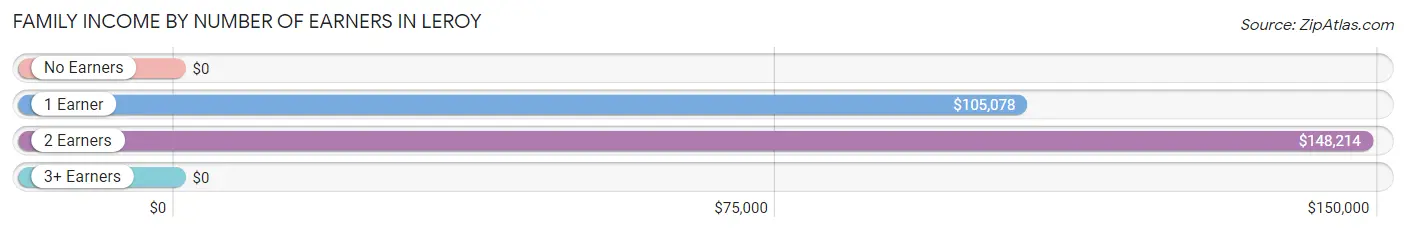
| Number of Earners | # Families | Median Income |
| No Earners | 26 (10.5%) | $0 |
| 1 Earner | 137 (55.2%) | $105,078 |
| 2 Earners | 72 (29.0%) | $148,214 |
| 3+ Earners | 13 (5.2%) | $0 |
| Total | 248 (100.0%) | $114,464 |
Household Income in Leroy
Household Income Brackets in Leroy
With 84 households falling in the category, the $100,000 to $149,999 income range is the most frequent in Leroy, accounting for 24.0% of all households.
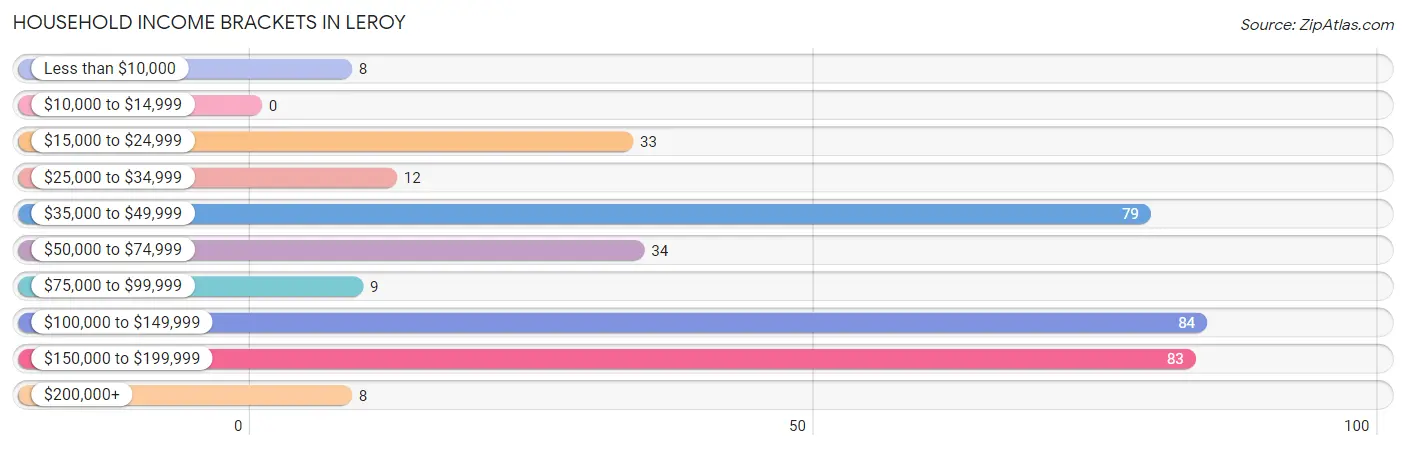
| Income Bracket | # Households | % Households |
| Less than $10,000 | 8 | 2.3% |
| $10,000 to $14,999 | 0 | 0.0% |
| $15,000 to $24,999 | 33 | 9.4% |
| $25,000 to $34,999 | 12 | 3.4% |
| $35,000 to $49,999 | 79 | 22.6% |
| $50,000 to $74,999 | 34 | 9.7% |
| $75,000 to $99,999 | 9 | 2.6% |
| $100,000 to $149,999 | 84 | 24.0% |
| $150,000 to $199,999 | 83 | 23.7% |
| $200,000+ | 8 | 2.3% |
Household Income by Householder Age in Leroy
| Income Bracket | # Households | Median Income |
| 15 to 24 Years | 23 (6.6%) | $0 |
| 25 to 44 Years | 86 (24.6%) | $0 |
| 45 to 64 Years | 133 (38.0%) | $0 |
| 65+ Years | 108 (30.9%) | $0 |
| Total | 350 (100.0%) | $102,500 |
Poverty in Leroy
Income Below Poverty by Sex and Age in Leroy
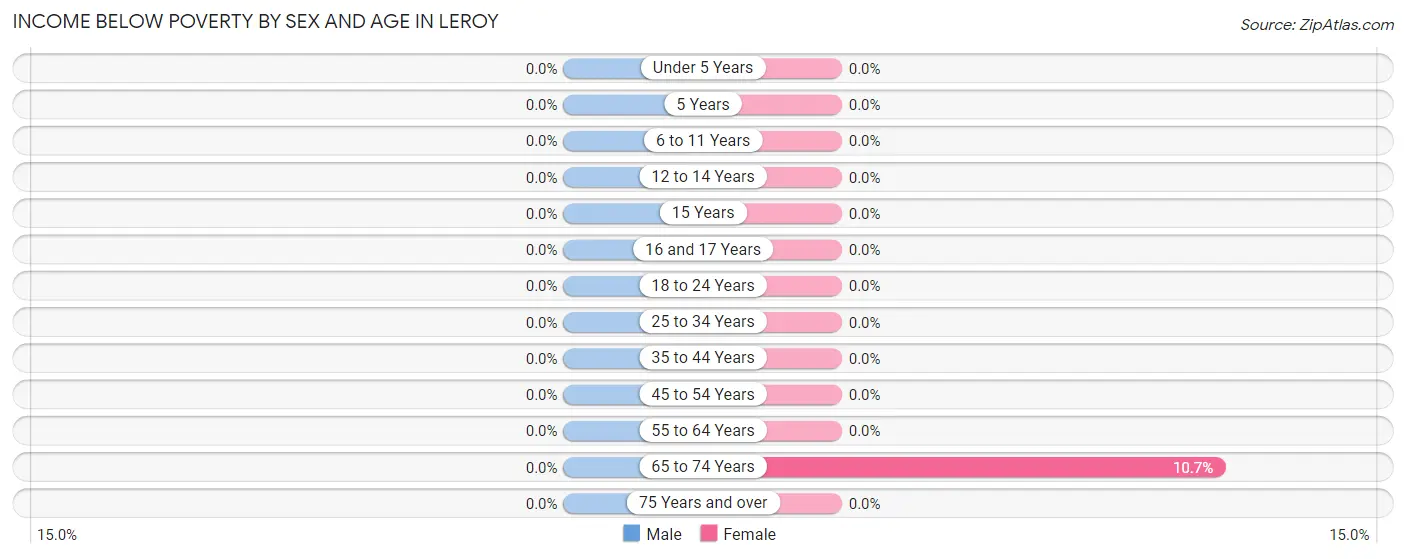
| Age Bracket | Male | Female |
| Under 5 Years | 0 (0.0%) | 0 (0.0%) |
| 5 Years | 0 (0.0%) | 0 (0.0%) |
| 6 to 11 Years | 0 (0.0%) | 0 (0.0%) |
| 12 to 14 Years | 0 (0.0%) | 0 (0.0%) |
| 15 Years | 0 (0.0%) | 0 (0.0%) |
| 16 and 17 Years | 0 (0.0%) | 0 (0.0%) |
| 18 to 24 Years | 0 (0.0%) | 0 (0.0%) |
| 25 to 34 Years | 0 (0.0%) | 0 (0.0%) |
| 35 to 44 Years | 0 (0.0%) | 0 (0.0%) |
| 45 to 54 Years | 0 (0.0%) | 0 (0.0%) |
| 55 to 64 Years | 0 (0.0%) | 0 (0.0%) |
| 65 to 74 Years | 0 (0.0%) | 8 (10.7%) |
| 75 Years and over | 0 (0.0%) | 0 (0.0%) |
| Total | 0 (0.0%) | 8 (1.5%) |
Income Above Poverty by Sex and Age in Leroy
According to the poverty statistics in Leroy, males aged under 5 years and females aged under 5 years are the age groups that are most secure financially, with 100.0% of males and 100.0% of females in these age groups living above the poverty line.
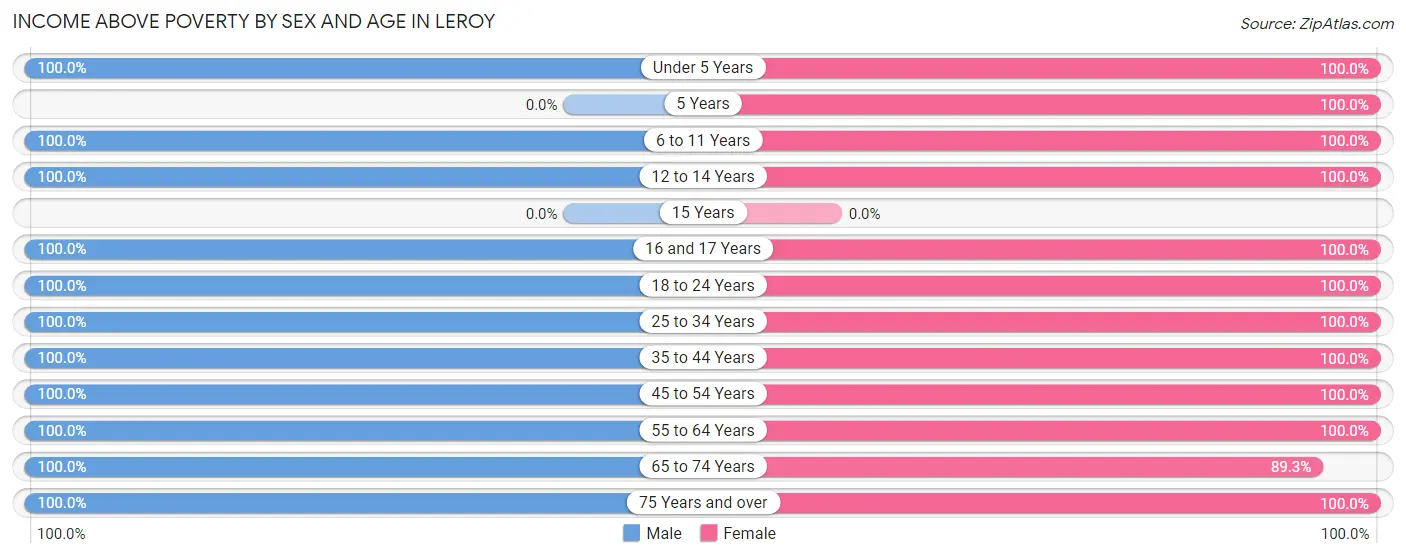
| Age Bracket | Male | Female |
| Under 5 Years | 29 (100.0%) | 24 (100.0%) |
| 5 Years | 0 (0.0%) | 25 (100.0%) |
| 6 to 11 Years | 98 (100.0%) | 14 (100.0%) |
| 12 to 14 Years | 56 (100.0%) | 27 (100.0%) |
| 15 Years | 0 (0.0%) | 0 (0.0%) |
| 16 and 17 Years | 22 (100.0%) | 27 (100.0%) |
| 18 to 24 Years | 27 (100.0%) | 41 (100.0%) |
| 25 to 34 Years | 23 (100.0%) | 57 (100.0%) |
| 35 to 44 Years | 65 (100.0%) | 86 (100.0%) |
| 45 to 54 Years | 87 (100.0%) | 103 (100.0%) |
| 55 to 64 Years | 41 (100.0%) | 38 (100.0%) |
| 65 to 74 Years | 63 (100.0%) | 67 (89.3%) |
| 75 Years and over | 19 (100.0%) | 14 (100.0%) |
| Total | 530 (100.0%) | 523 (98.5%) |
Income Below Poverty Among Married-Couple Families in Leroy
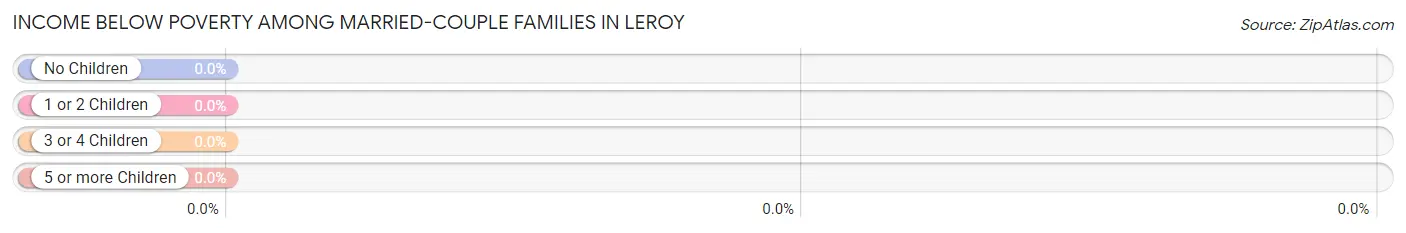
| Children | Above Poverty | Below Poverty |
| No Children | 123 (100.0%) | 0 (0.0%) |
| 1 or 2 Children | 57 (100.0%) | 0 (0.0%) |
| 3 or 4 Children | 39 (100.0%) | 0 (0.0%) |
| 5 or more Children | 0 (0.0%) | 0 (0.0%) |
| Total | 219 (100.0%) | 0 (0.0%) |
Income Below Poverty Among Single-Parent Households in Leroy
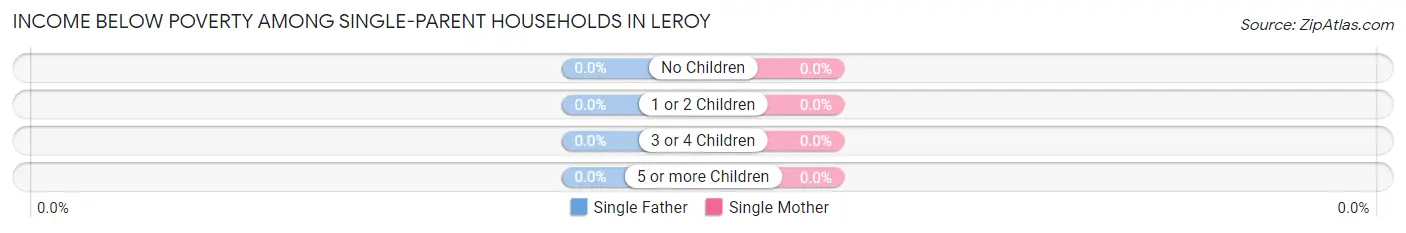
| Children | Single Father | Single Mother |
| No Children | 0 (0.0%) | 0 (0.0%) |
| 1 or 2 Children | 0 (0.0%) | 0 (0.0%) |
| 3 or 4 Children | 0 (0.0%) | 0 (0.0%) |
| 5 or more Children | 0 (0.0%) | 0 (0.0%) |
| Total | 0 (0.0%) | 0 (0.0%) |
Income Below Poverty Among Married-Couple vs Single-Parent Households in Leroy
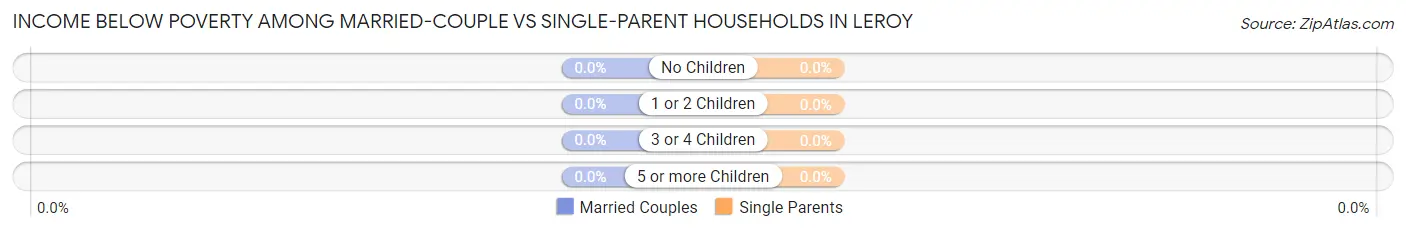
| Children | Married-Couple Families | Single-Parent Households |
| No Children | 0 (0.0%) | 0 (0.0%) |
| 1 or 2 Children | 0 (0.0%) | 0 (0.0%) |
| 3 or 4 Children | 0 (0.0%) | 0 (0.0%) |
| 5 or more Children | 0 (0.0%) | 0 (0.0%) |
| Total | 0 (0.0%) | 0 (0.0%) |
Employment Characteristics in Leroy
Employment by Class of Employer in Leroy
Among the 379 employed individuals in Leroy, private company employees (190 | 50.1%), local government employees (69 | 18.2%), and federal government employees (51 | 13.5%) make up the most common classes of employment.
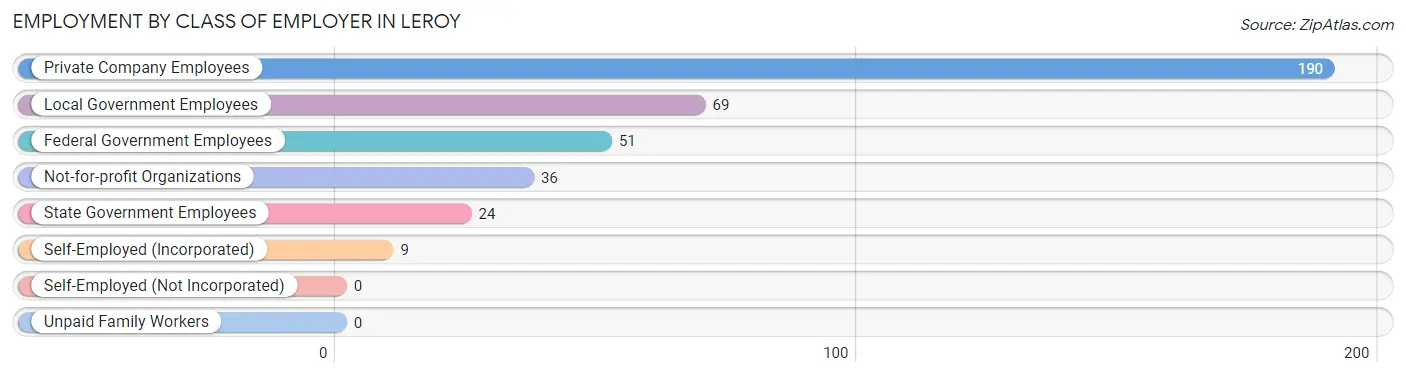
| Employer Class | # Employees | % Employees |
| Private Company Employees | 190 | 50.1% |
| Self-Employed (Incorporated) | 9 | 2.4% |
| Self-Employed (Not Incorporated) | 0 | 0.0% |
| Not-for-profit Organizations | 36 | 9.5% |
| Local Government Employees | 69 | 18.2% |
| State Government Employees | 24 | 6.3% |
| Federal Government Employees | 51 | 13.5% |
| Unpaid Family Workers | 0 | 0.0% |
| Total | 379 | 100.0% |
Employment Status by Age in Leroy
According to the labor force statistics for Leroy, out of the total population over 16 years of age (788), 53.3% or 420 individuals are in the labor force, with 8.1% or 34 of them unemployed. The age group with the highest labor force participation rate is 20 to 24 years, with 100.0% or 48 individuals in the labor force. Within the labor force, the 35 to 44 years age range has the highest percentage of unemployed individuals, with 21.1% or 26 of them being unemployed.
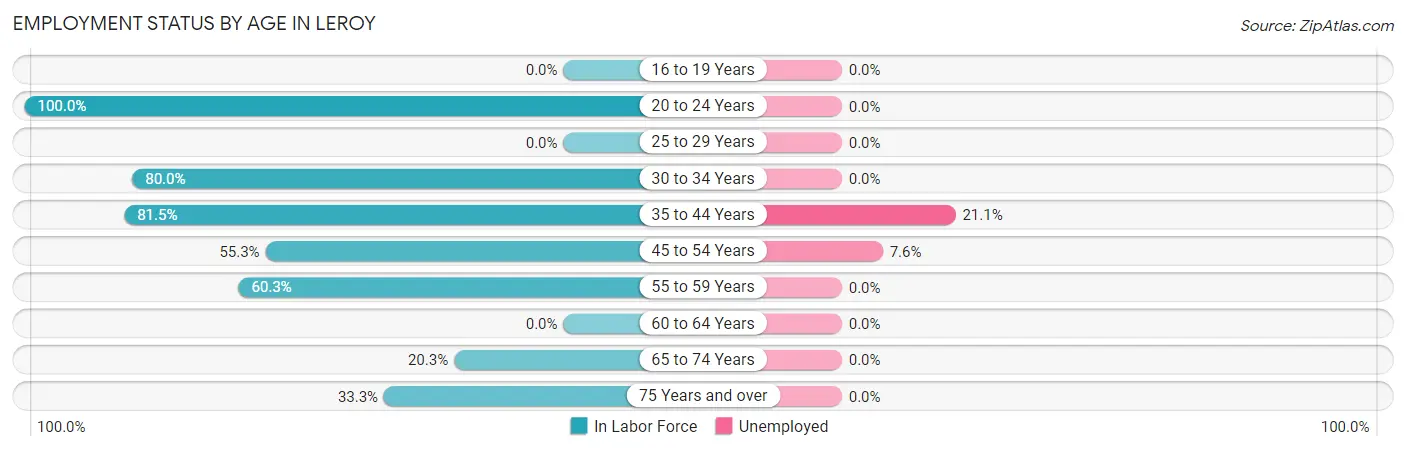
| Age Bracket | In Labor Force | Unemployed |
| 16 to 19 Years | 0 (0.0%) | 0 (0.0%) |
| 20 to 24 Years | 48 (100.0%) | 0 (0.0%) |
| 25 to 29 Years | 0 (0.0%) | 0 (0.0%) |
| 30 to 34 Years | 64 (80.0%) | 0 (0.0%) |
| 35 to 44 Years | 123 (81.5%) | 26 (21.1%) |
| 45 to 54 Years | 105 (55.3%) | 8 (7.6%) |
| 55 to 59 Years | 41 (60.3%) | 0 (0.0%) |
| 60 to 64 Years | 0 (0.0%) | 0 (0.0%) |
| 65 to 74 Years | 28 (20.3%) | 0 (0.0%) |
| 75 Years and over | 11 (33.3%) | 0 (0.0%) |
| Total | 420 (53.3%) | 34 (8.1%) |
Employment Status by Educational Attainment in Leroy
According to labor force statistics for Leroy, 66.6% of individuals (333) out of the total population between 25 and 64 years of age (500) are in the labor force, with 10.2% or 34 of them being unemployed. The group with the highest labor force participation rate are those with the educational attainment of less than high school, with 100.0% or 8 individuals in the labor force. Within the labor force, individuals with less than high school education have the highest percentage of unemployment, with 100.0% or 8 of them being unemployed.
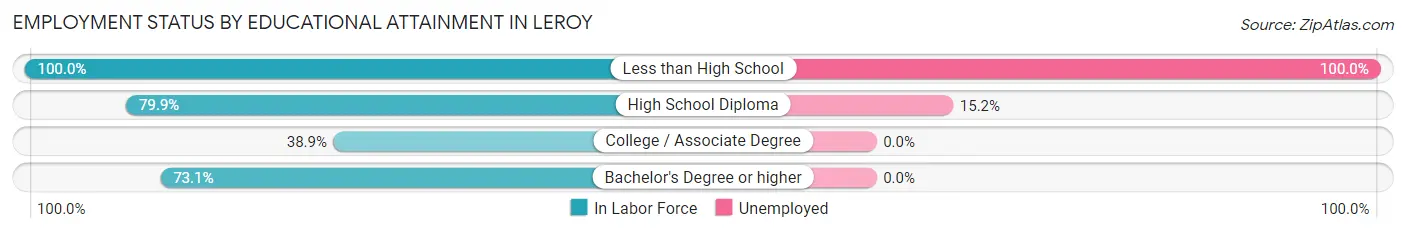
| Educational Attainment | In Labor Force | Unemployed |
| Less than High School | 8 (100.0%) | 8 (100.0%) |
| High School Diploma | 171 (79.9%) | 33 (15.2%) |
| College / Associate Degree | 56 (38.9%) | 0 (0.0%) |
| Bachelor's Degree or higher | 98 (73.1%) | 0 (0.0%) |
| Total | 333 (66.6%) | 51 (10.2%) |
Employment Occupations by Sex in Leroy
Management, Business, Science and Arts Occupations
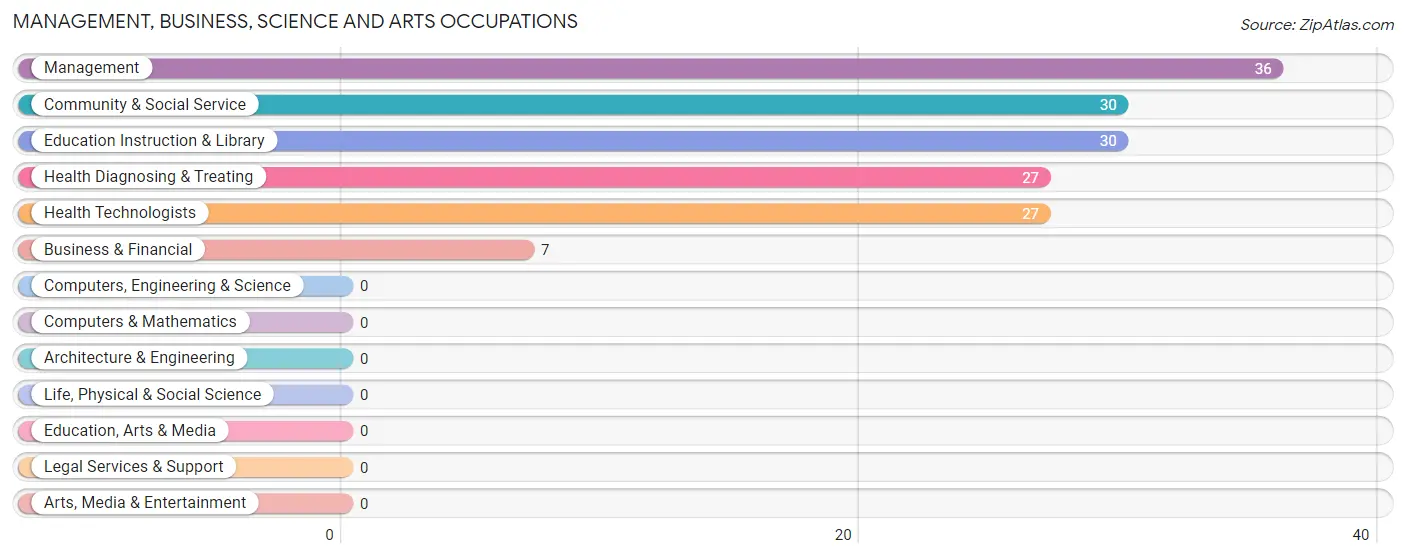
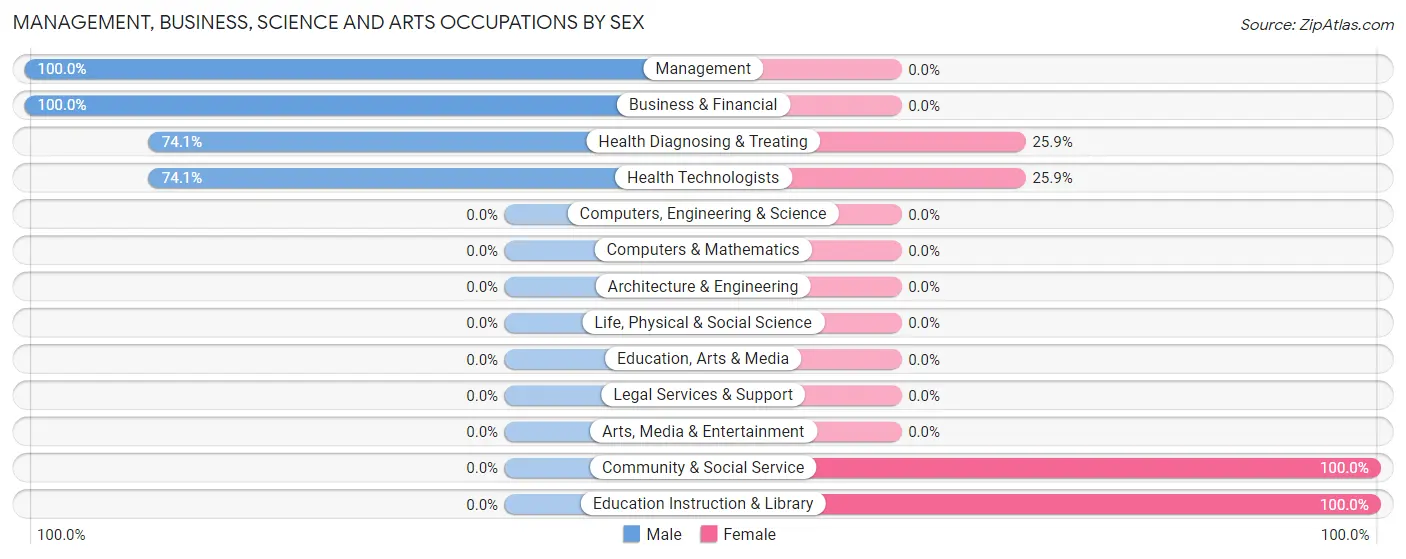
The most common Management, Business, Science and Arts occupations in Leroy are Management (36 | 9.3%), Community & Social Service (30 | 7.8%), Education Instruction & Library (30 | 7.8%), Health Diagnosing & Treating (27 | 7.0%), and Health Technologists (27 | 7.0%).
Management, Business, Science and Arts Occupations by Sex
Within the Management, Business, Science and Arts occupations in Leroy, the most male-oriented occupations are Management (100.0%), Business & Financial (100.0%), and Health Diagnosing & Treating (74.1%), while the most female-oriented occupations are Community & Social Service (100.0%), Education Instruction & Library (100.0%), and Health Diagnosing & Treating (25.9%).
| Occupation | Male | Female |
| Management | 36 (100.0%) | 0 (0.0%) |
| Business & Financial | 7 (100.0%) | 0 (0.0%) |
| Computers, Engineering & Science | 0 (0.0%) | 0 (0.0%) |
| Computers & Mathematics | 0 (0.0%) | 0 (0.0%) |
| Architecture & Engineering | 0 (0.0%) | 0 (0.0%) |
| Life, Physical & Social Science | 0 (0.0%) | 0 (0.0%) |
| Community & Social Service | 0 (0.0%) | 30 (100.0%) |
| Education, Arts & Media | 0 (0.0%) | 0 (0.0%) |
| Legal Services & Support | 0 (0.0%) | 0 (0.0%) |
| Education Instruction & Library | 0 (0.0%) | 30 (100.0%) |
| Arts, Media & Entertainment | 0 (0.0%) | 0 (0.0%) |
| Health Diagnosing & Treating | 20 (74.1%) | 7 (25.9%) |
| Health Technologists | 20 (74.1%) | 7 (25.9%) |
| Total (Category) | 63 (63.0%) | 37 (37.0%) |
| Total (Overall) | 192 (49.7%) | 194 (50.3%) |
Services Occupations
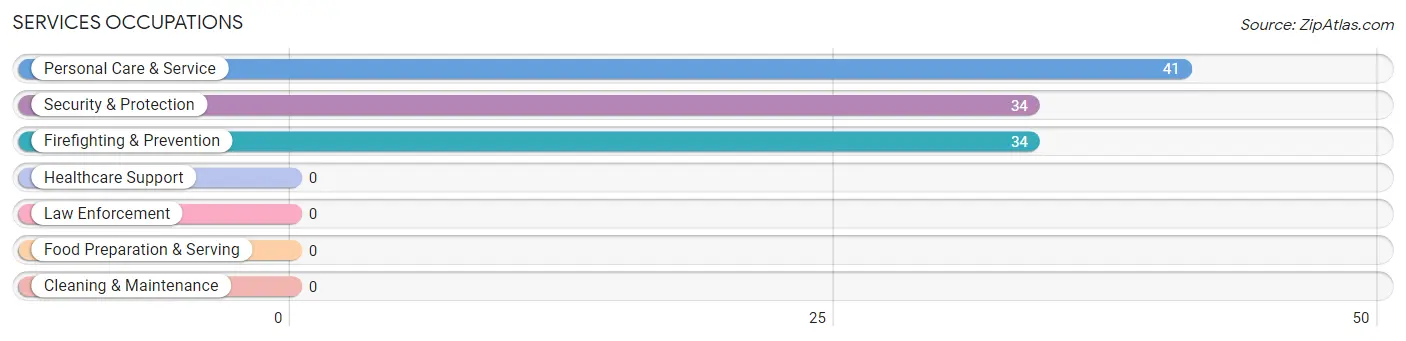
The most common Services occupations in Leroy are Personal Care & Service (41 | 10.6%), Security & Protection (34 | 8.8%), and Firefighting & Prevention (34 | 8.8%).
Services Occupations by Sex
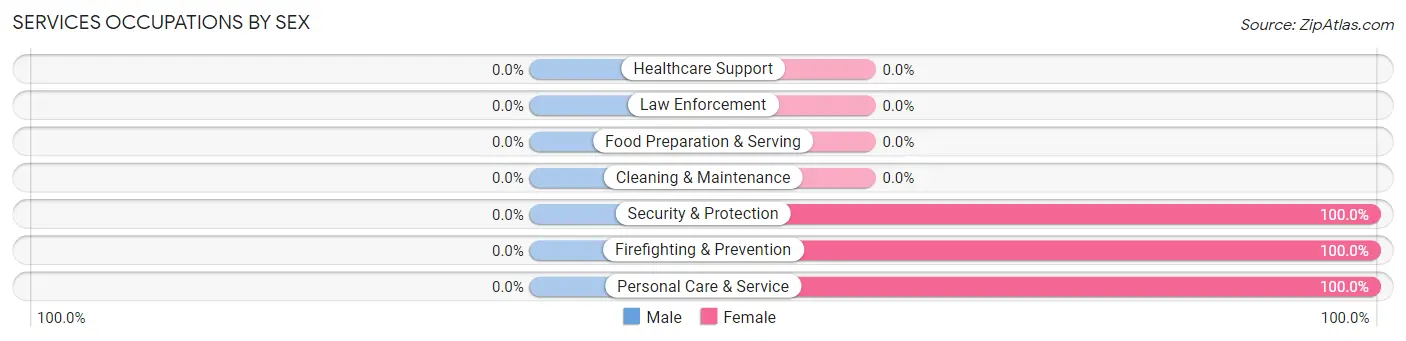
| Occupation | Male | Female |
| Healthcare Support | 0 (0.0%) | 0 (0.0%) |
| Security & Protection | 0 (0.0%) | 34 (100.0%) |
| Firefighting & Prevention | 0 (0.0%) | 34 (100.0%) |
| Law Enforcement | 0 (0.0%) | 0 (0.0%) |
| Food Preparation & Serving | 0 (0.0%) | 0 (0.0%) |
| Cleaning & Maintenance | 0 (0.0%) | 0 (0.0%) |
| Personal Care & Service | 0 (0.0%) | 41 (100.0%) |
| Total (Category) | 0 (0.0%) | 75 (100.0%) |
| Total (Overall) | 192 (49.7%) | 194 (50.3%) |
Sales and Office Occupations
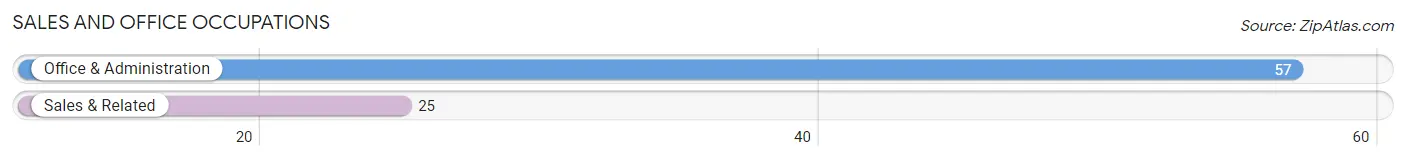
The most common Sales and Office occupations in Leroy are Office & Administration (57 | 14.8%), and Sales & Related (25 | 6.5%).
Sales and Office Occupations by Sex
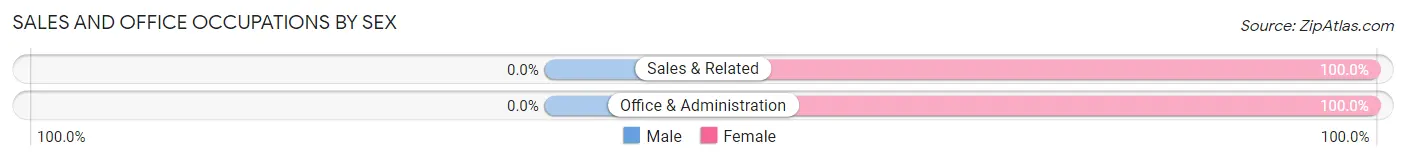
| Occupation | Male | Female |
| Sales & Related | 0 (0.0%) | 25 (100.0%) |
| Office & Administration | 0 (0.0%) | 57 (100.0%) |
| Total (Category) | 0 (0.0%) | 82 (100.0%) |
| Total (Overall) | 192 (49.7%) | 194 (50.3%) |
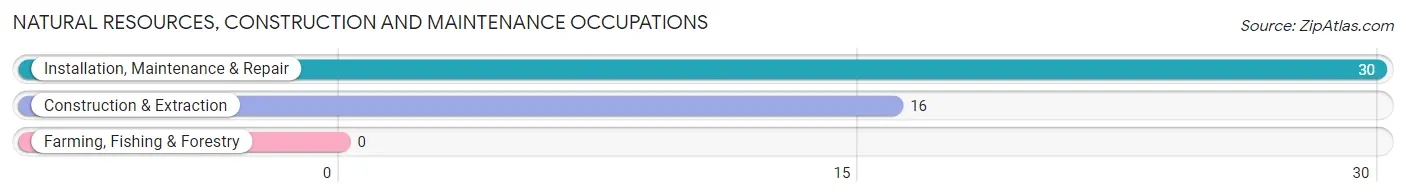
Natural Resources, Construction and Maintenance Occupations
The most common Natural Resources, Construction and Maintenance occupations in Leroy are Installation, Maintenance & Repair (30 | 7.8%), and Construction & Extraction (16 | 4.2%).
Natural Resources, Construction and Maintenance Occupations by Sex
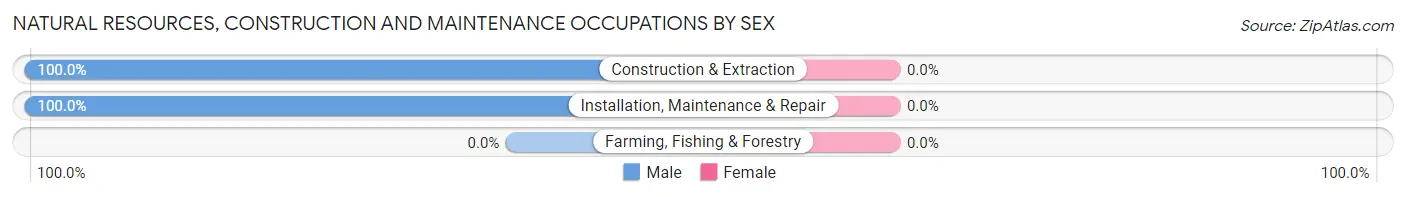
| Occupation | Male | Female |
| Farming, Fishing & Forestry | 0 (0.0%) | 0 (0.0%) |
| Construction & Extraction | 16 (100.0%) | 0 (0.0%) |
| Installation, Maintenance & Repair | 30 (100.0%) | 0 (0.0%) |
| Total (Category) | 46 (100.0%) | 0 (0.0%) |
| Total (Overall) | 192 (49.7%) | 194 (50.3%) |
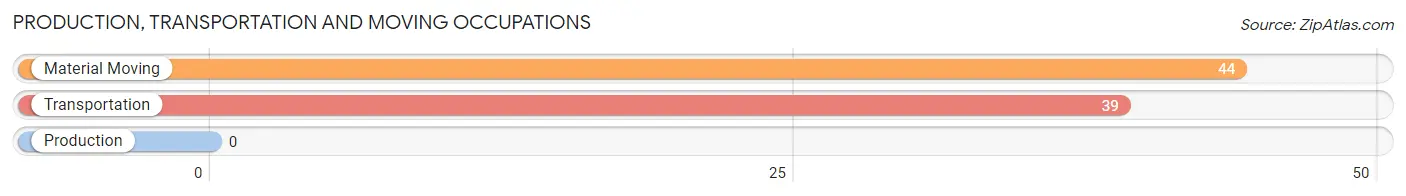
Production, Transportation and Moving Occupations
The most common Production, Transportation and Moving occupations in Leroy are Material Moving (44 | 11.4%), and Transportation (39 | 10.1%).
Production, Transportation and Moving Occupations by Sex
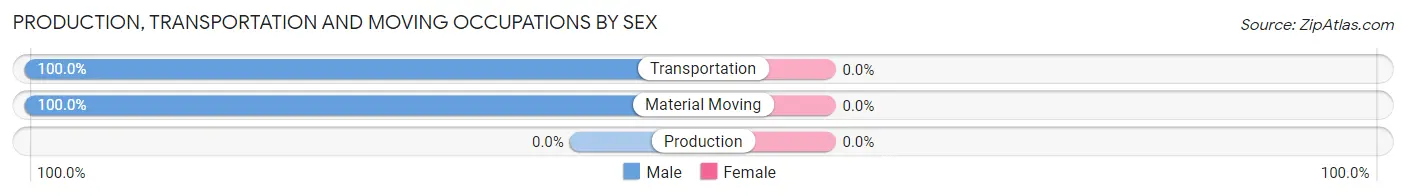
| Occupation | Male | Female |
| Production | 0 (0.0%) | 0 (0.0%) |
| Transportation | 39 (100.0%) | 0 (0.0%) |
| Material Moving | 44 (100.0%) | 0 (0.0%) |
| Total (Category) | 83 (100.0%) | 0 (0.0%) |
| Total (Overall) | 192 (49.7%) | 194 (50.3%) |
Employment Industries by Sex in Leroy
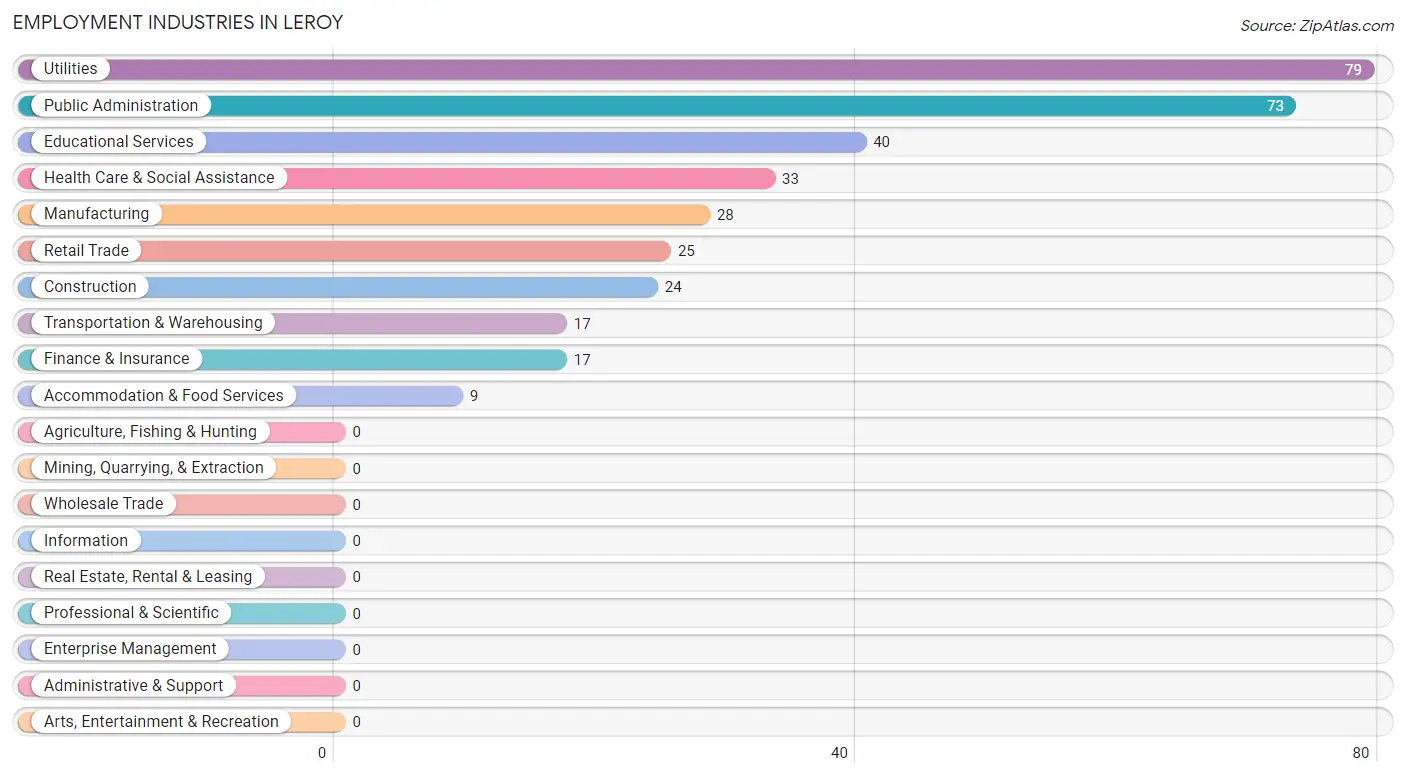
Employment Industries in Leroy
The major employment industries in Leroy include Utilities (79 | 20.5%), Public Administration (73 | 18.9%), Educational Services (40 | 10.4%), Health Care & Social Assistance (33 | 8.6%), and Manufacturing (28 | 7.2%).
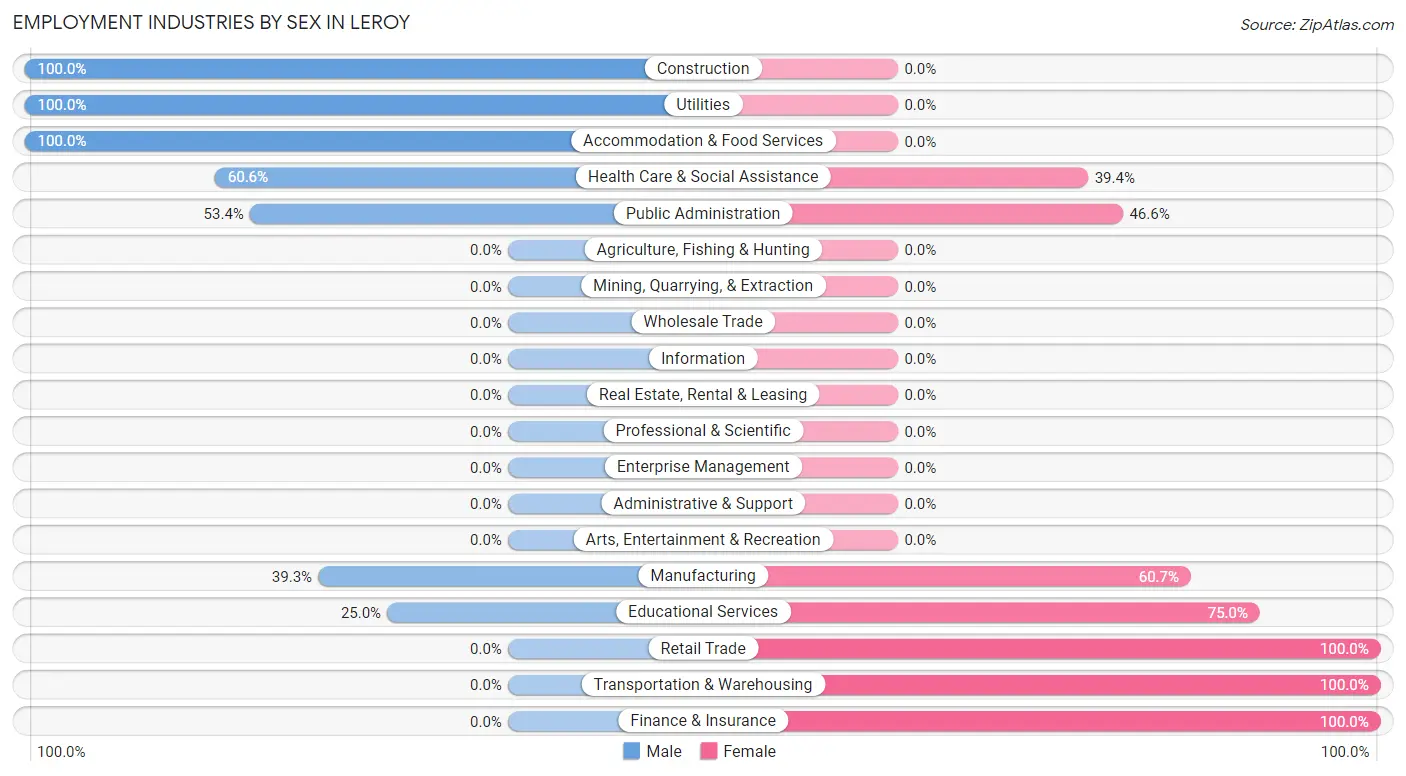
Employment Industries by Sex in Leroy
The Leroy industries that see more men than women are Construction (100.0%), Utilities (100.0%), and Accommodation & Food Services (100.0%), whereas the industries that tend to have a higher number of women are Retail Trade (100.0%), Transportation & Warehousing (100.0%), and Finance & Insurance (100.0%).
| Industry | Male | Female |
| Agriculture, Fishing & Hunting | 0 (0.0%) | 0 (0.0%) |
| Mining, Quarrying, & Extraction | 0 (0.0%) | 0 (0.0%) |
| Construction | 24 (100.0%) | 0 (0.0%) |
| Manufacturing | 11 (39.3%) | 17 (60.7%) |
| Wholesale Trade | 0 (0.0%) | 0 (0.0%) |
| Retail Trade | 0 (0.0%) | 25 (100.0%) |
| Transportation & Warehousing | 0 (0.0%) | 17 (100.0%) |
| Utilities | 79 (100.0%) | 0 (0.0%) |
| Information | 0 (0.0%) | 0 (0.0%) |
| Finance & Insurance | 0 (0.0%) | 17 (100.0%) |
| Real Estate, Rental & Leasing | 0 (0.0%) | 0 (0.0%) |
| Professional & Scientific | 0 (0.0%) | 0 (0.0%) |
| Enterprise Management | 0 (0.0%) | 0 (0.0%) |
| Administrative & Support | 0 (0.0%) | 0 (0.0%) |
| Educational Services | 10 (25.0%) | 30 (75.0%) |
| Health Care & Social Assistance | 20 (60.6%) | 13 (39.4%) |
| Arts, Entertainment & Recreation | 0 (0.0%) | 0 (0.0%) |
| Accommodation & Food Services | 9 (100.0%) | 0 (0.0%) |
| Public Administration | 39 (53.4%) | 34 (46.6%) |
| Total | 192 (49.7%) | 194 (50.3%) |
Education in Leroy
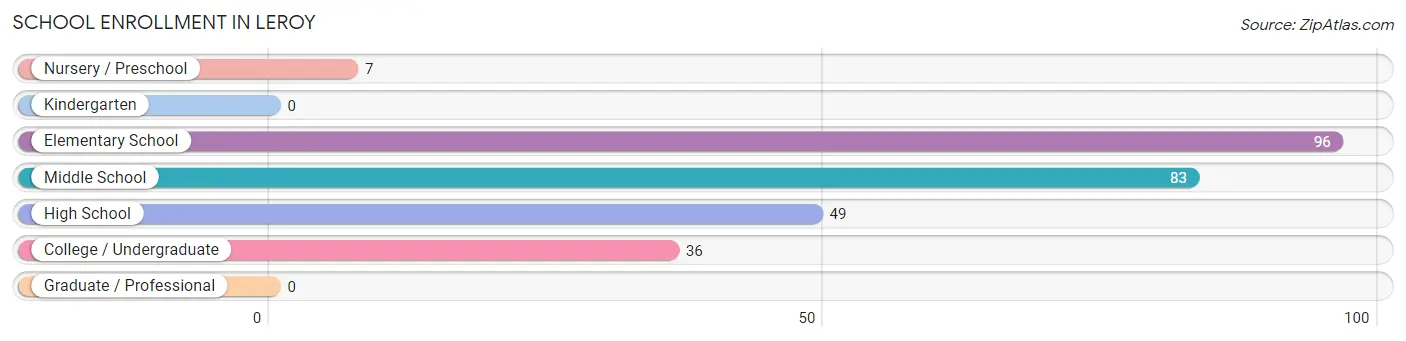
School Enrollment in Leroy
The most common levels of schooling among the 271 students in Leroy are elementary school (96 | 35.4%), middle school (83 | 30.6%), and high school (49 | 18.1%).
| School Level | # Students | % Students |
| Nursery / Preschool | 7 | 2.6% |
| Kindergarten | 0 | 0.0% |
| Elementary School | 96 | 35.4% |
| Middle School | 83 | 30.6% |
| High School | 49 | 18.1% |
| College / Undergraduate | 36 | 13.3% |
| Graduate / Professional | 0 | 0.0% |
| Total | 271 | 100.0% |
School Enrollment by Age by Funding Source in Leroy
Out of a total of 271 students who are enrolled in schools in Leroy, 23 (8.5%) attend a private institution, while the remaining 248 (91.5%) are enrolled in public schools. The age group of 3 to 4 year olds has the highest likelihood of being enrolled in private schools, with 7 (100.0% in the age bracket) enrolled. Conversely, the age group of 5 to 9 year old has the lowest likelihood of being enrolled in a private school, with 96 (100.0% in the age bracket) attending a public institution.
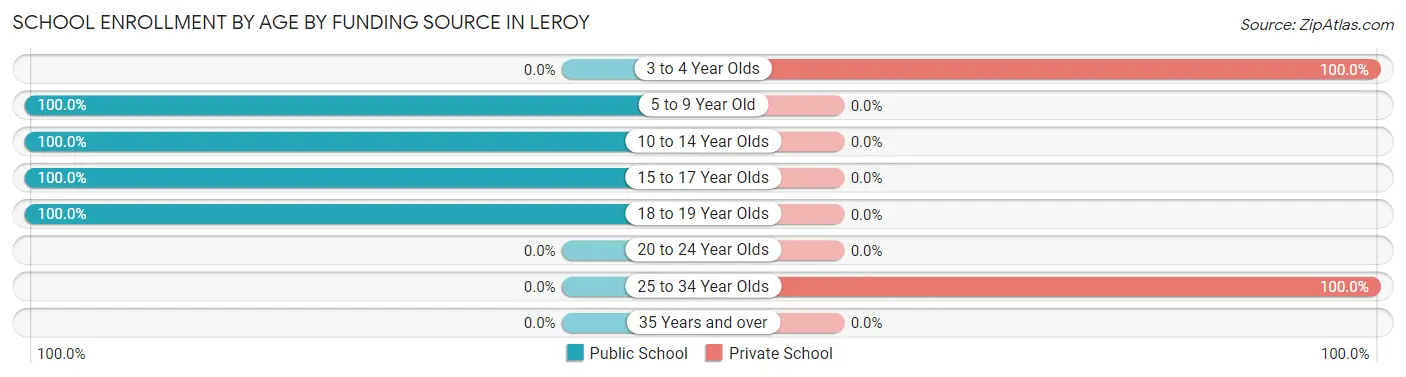
| Age Bracket | Public School | Private School |
| 3 to 4 Year Olds | 0 (0.0%) | 7 (100.0%) |
| 5 to 9 Year Old | 96 (100.0%) | 0 (0.0%) |
| 10 to 14 Year Olds | 83 (100.0%) | 0 (0.0%) |
| 15 to 17 Year Olds | 49 (100.0%) | 0 (0.0%) |
| 18 to 19 Year Olds | 20 (100.0%) | 0 (0.0%) |
| 20 to 24 Year Olds | 0 (0.0%) | 0 (0.0%) |
| 25 to 34 Year Olds | 0 (0.0%) | 16 (100.0%) |
| 35 Years and over | 0 (0.0%) | 0 (0.0%) |
| Total | 248 (91.5%) | 23 (8.5%) |
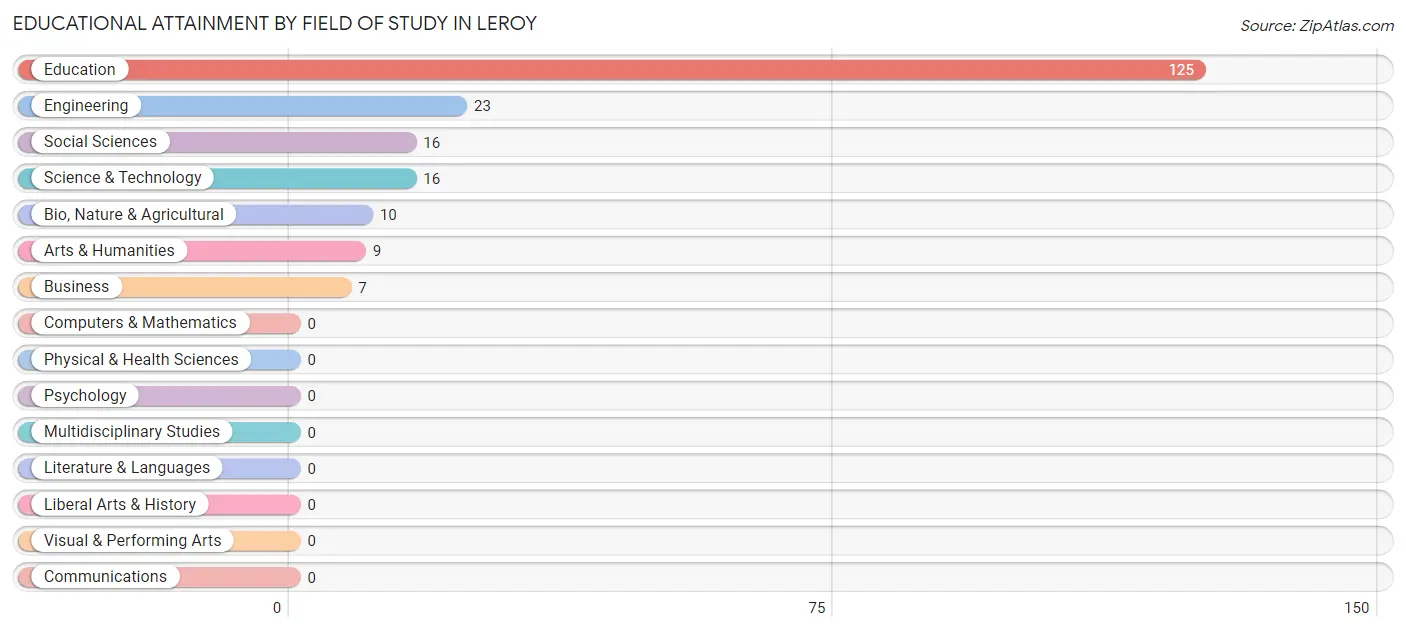
Educational Attainment by Field of Study in Leroy
Education (125 | 60.7%), engineering (23 | 11.2%), social sciences (16 | 7.8%), science & technology (16 | 7.8%), and bio, nature & agricultural (10 | 4.9%) are the most common fields of study among 206 individuals in Leroy who have obtained a bachelor's degree or higher.
| Field of Study | # Graduates | % Graduates |
| Computers & Mathematics | 0 | 0.0% |
| Bio, Nature & Agricultural | 10 | 4.9% |
| Physical & Health Sciences | 0 | 0.0% |
| Psychology | 0 | 0.0% |
| Social Sciences | 16 | 7.8% |
| Engineering | 23 | 11.2% |
| Multidisciplinary Studies | 0 | 0.0% |
| Science & Technology | 16 | 7.8% |
| Business | 7 | 3.4% |
| Education | 125 | 60.7% |
| Literature & Languages | 0 | 0.0% |
| Liberal Arts & History | 0 | 0.0% |
| Visual & Performing Arts | 0 | 0.0% |
| Communications | 0 | 0.0% |
| Arts & Humanities | 9 | 4.4% |
| Total | 206 | 100.0% |
Transportation & Commute in Leroy
Vehicle Availability by Sex in Leroy
The most prevalent vehicle ownership categories in Leroy are males with 3 vehicles (131, accounting for 70.8%) and females with 3 vehicles (89, making up 67.5%).
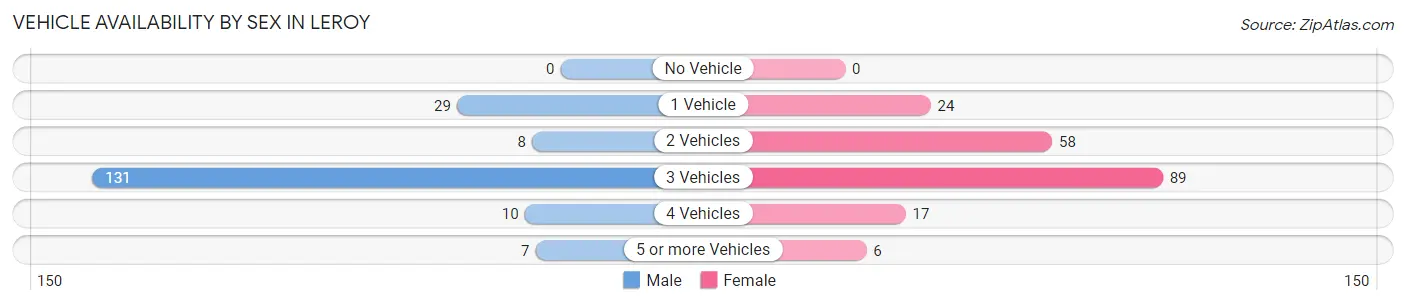
| Vehicles Available | Male | Female |
| No Vehicle | 0 (0.0%) | 0 (0.0%) |
| 1 Vehicle | 29 (15.7%) | 24 (12.4%) |
| 2 Vehicles | 8 (4.3%) | 58 (29.9%) |
| 3 Vehicles | 131 (70.8%) | 89 (45.9%) |
| 4 Vehicles | 10 (5.4%) | 17 (8.8%) |
| 5 or more Vehicles | 7 (3.8%) | 6 (3.1%) |
| Total | 185 (100.0%) | 194 (100.0%) |
Commute Time in Leroy
The most frequently occuring commute durations in Leroy are 10 to 14 minutes (80 commuters, 21.1%), 20 to 24 minutes (74 commuters, 19.5%), and 30 to 34 minutes (45 commuters, 11.9%).
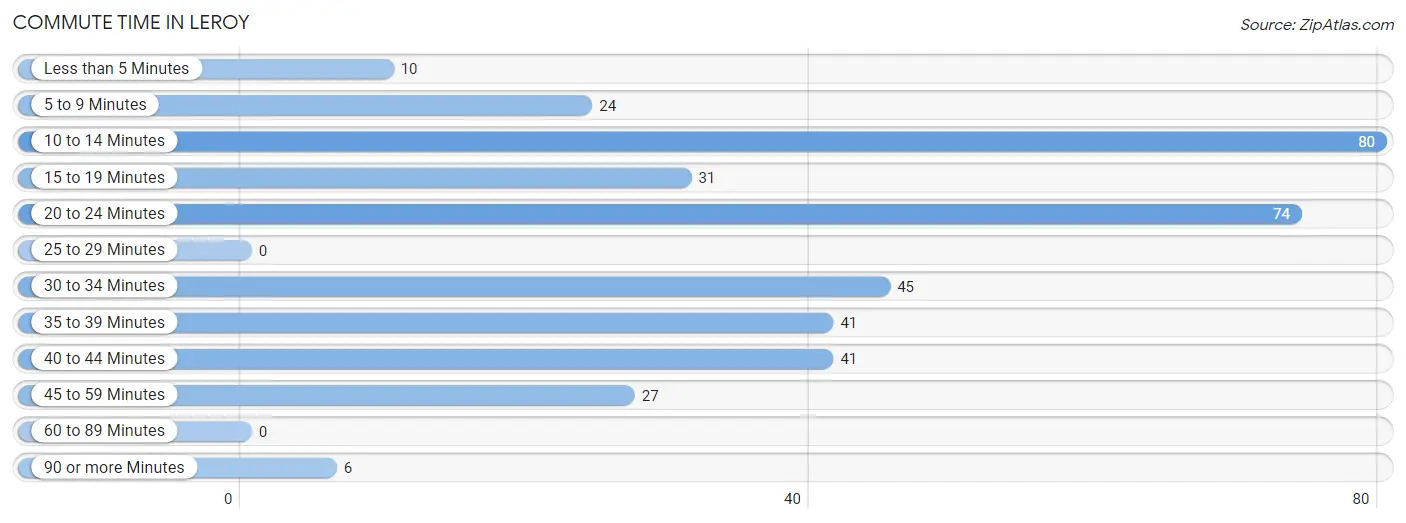
| Commute Time | # Commuters | % Commuters |
| Less than 5 Minutes | 10 | 2.6% |
| 5 to 9 Minutes | 24 | 6.3% |
| 10 to 14 Minutes | 80 | 21.1% |
| 15 to 19 Minutes | 31 | 8.2% |
| 20 to 24 Minutes | 74 | 19.5% |
| 25 to 29 Minutes | 0 | 0.0% |
| 30 to 34 Minutes | 45 | 11.9% |
| 35 to 39 Minutes | 41 | 10.8% |
| 40 to 44 Minutes | 41 | 10.8% |
| 45 to 59 Minutes | 27 | 7.1% |
| 60 to 89 Minutes | 0 | 0.0% |
| 90 or more Minutes | 6 | 1.6% |
Commute Time by Sex in Leroy
The most common commute times in Leroy are 10 to 14 minutes (74 commuters, 40.0%) for males and 20 to 24 minutes (41 commuters, 21.1%) for females.
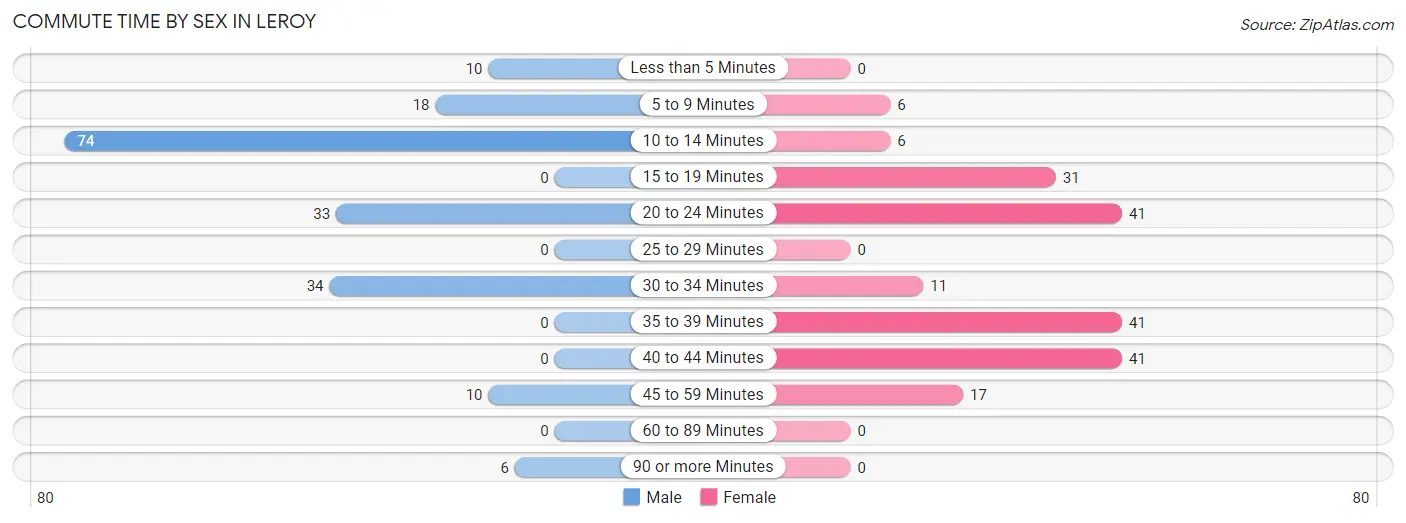
| Commute Time | Male | Female |
| Less than 5 Minutes | 10 (5.4%) | 0 (0.0%) |
| 5 to 9 Minutes | 18 (9.7%) | 6 (3.1%) |
| 10 to 14 Minutes | 74 (40.0%) | 6 (3.1%) |
| 15 to 19 Minutes | 0 (0.0%) | 31 (16.0%) |
| 20 to 24 Minutes | 33 (17.8%) | 41 (21.1%) |
| 25 to 29 Minutes | 0 (0.0%) | 0 (0.0%) |
| 30 to 34 Minutes | 34 (18.4%) | 11 (5.7%) |
| 35 to 39 Minutes | 0 (0.0%) | 41 (21.1%) |
| 40 to 44 Minutes | 0 (0.0%) | 41 (21.1%) |
| 45 to 59 Minutes | 10 (5.4%) | 17 (8.8%) |
| 60 to 89 Minutes | 0 (0.0%) | 0 (0.0%) |
| 90 or more Minutes | 6 (3.2%) | 0 (0.0%) |
Time of Departure to Work by Sex in Leroy
The most frequent times of departure to work in Leroy are 6:00 AM to 6:29 AM (54, 29.2%) for males and 6:00 AM to 6:29 AM (51, 26.3%) for females.
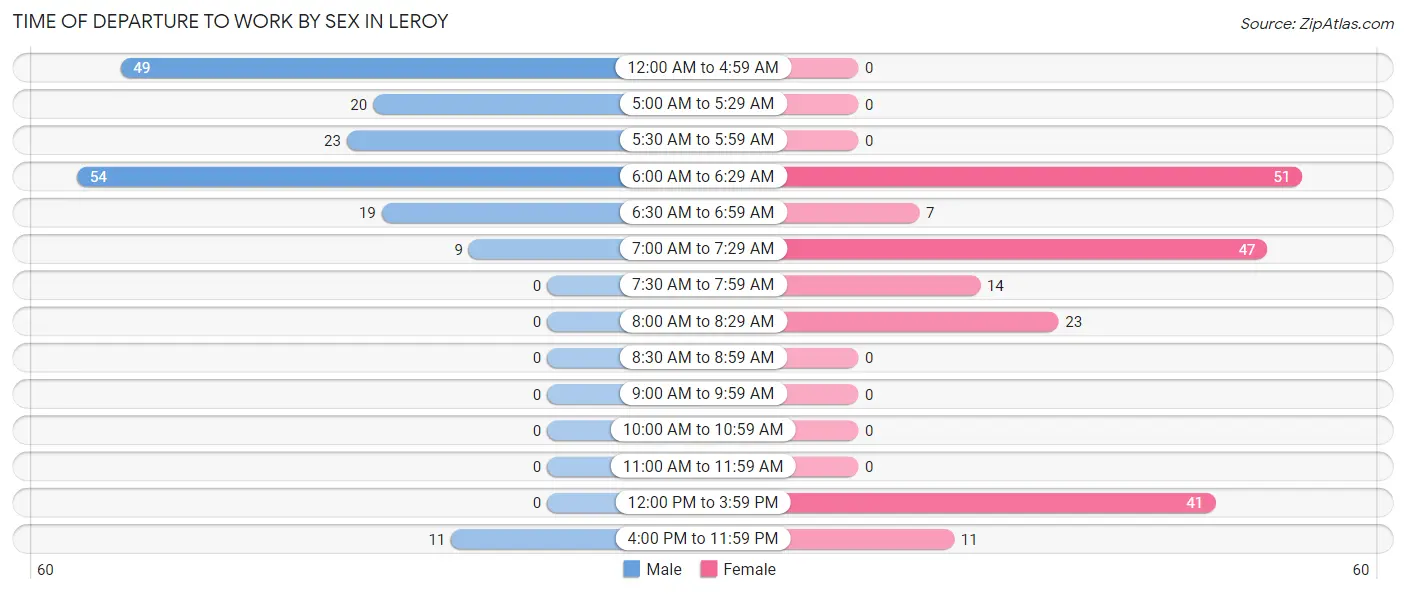
| Time of Departure | Male | Female |
| 12:00 AM to 4:59 AM | 49 (26.5%) | 0 (0.0%) |
| 5:00 AM to 5:29 AM | 20 (10.8%) | 0 (0.0%) |
| 5:30 AM to 5:59 AM | 23 (12.4%) | 0 (0.0%) |
| 6:00 AM to 6:29 AM | 54 (29.2%) | 51 (26.3%) |
| 6:30 AM to 6:59 AM | 19 (10.3%) | 7 (3.6%) |
| 7:00 AM to 7:29 AM | 9 (4.9%) | 47 (24.2%) |
| 7:30 AM to 7:59 AM | 0 (0.0%) | 14 (7.2%) |
| 8:00 AM to 8:29 AM | 0 (0.0%) | 23 (11.9%) |
| 8:30 AM to 8:59 AM | 0 (0.0%) | 0 (0.0%) |
| 9:00 AM to 9:59 AM | 0 (0.0%) | 0 (0.0%) |
| 10:00 AM to 10:59 AM | 0 (0.0%) | 0 (0.0%) |
| 11:00 AM to 11:59 AM | 0 (0.0%) | 0 (0.0%) |
| 12:00 PM to 3:59 PM | 0 (0.0%) | 41 (21.1%) |
| 4:00 PM to 11:59 PM | 11 (5.9%) | 11 (5.7%) |
| Total | 185 (100.0%) | 194 (100.0%) |
Housing Occupancy in Leroy
Occupancy by Ownership in Leroy
Of the total 350 dwellings in Leroy, owner-occupied units account for 302 (86.3%), while renter-occupied units make up 48 (13.7%).
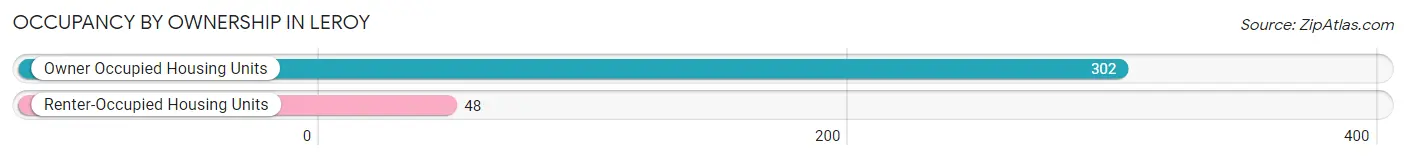
| Occupancy | # Housing Units | % Housing Units |
| Owner Occupied Housing Units | 302 | 86.3% |
| Renter-Occupied Housing Units | 48 | 13.7% |
| Total Occupied Housing Units | 350 | 100.0% |
Occupancy by Household Size in Leroy
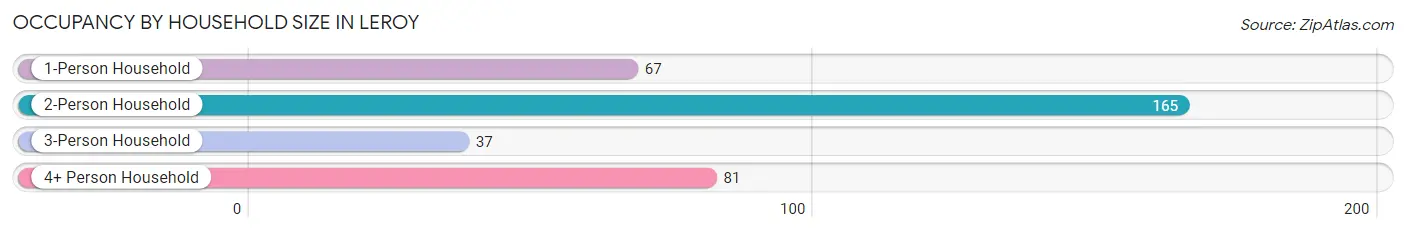
| Household Size | # Housing Units | % Housing Units |
| 1-Person Household | 67 | 19.1% |
| 2-Person Household | 165 | 47.1% |
| 3-Person Household | 37 | 10.6% |
| 4+ Person Household | 81 | 23.1% |
| Total Housing Units | 350 | 100.0% |
Occupancy by Ownership by Household Size in Leroy
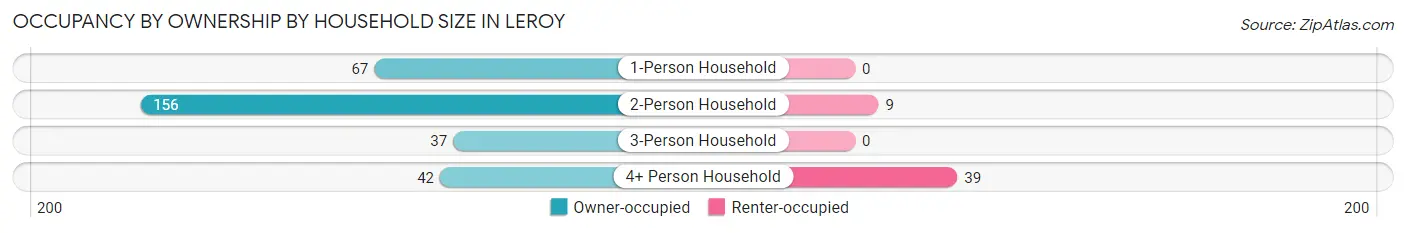
| Household Size | Owner-occupied | Renter-occupied |
| 1-Person Household | 67 (100.0%) | 0 (0.0%) |
| 2-Person Household | 156 (94.6%) | 9 (5.4%) |
| 3-Person Household | 37 (100.0%) | 0 (0.0%) |
| 4+ Person Household | 42 (51.8%) | 39 (48.1%) |
| Total Housing Units | 302 (86.3%) | 48 (13.7%) |
Occupancy by Educational Attainment in Leroy
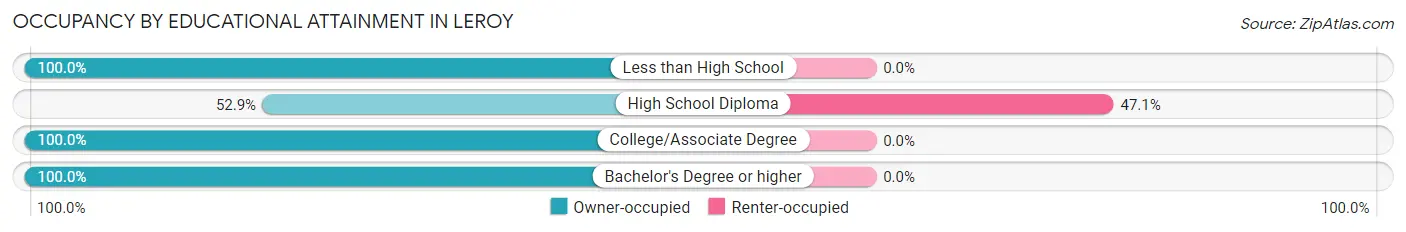
| Household Size | Owner-occupied | Renter-occupied |
| Less than High School | 6 (100.0%) | 0 (0.0%) |
| High School Diploma | 54 (52.9%) | 48 (47.1%) |
| College/Associate Degree | 136 (100.0%) | 0 (0.0%) |
| Bachelor's Degree or higher | 106 (100.0%) | 0 (0.0%) |
Occupancy by Age of Householder in Leroy
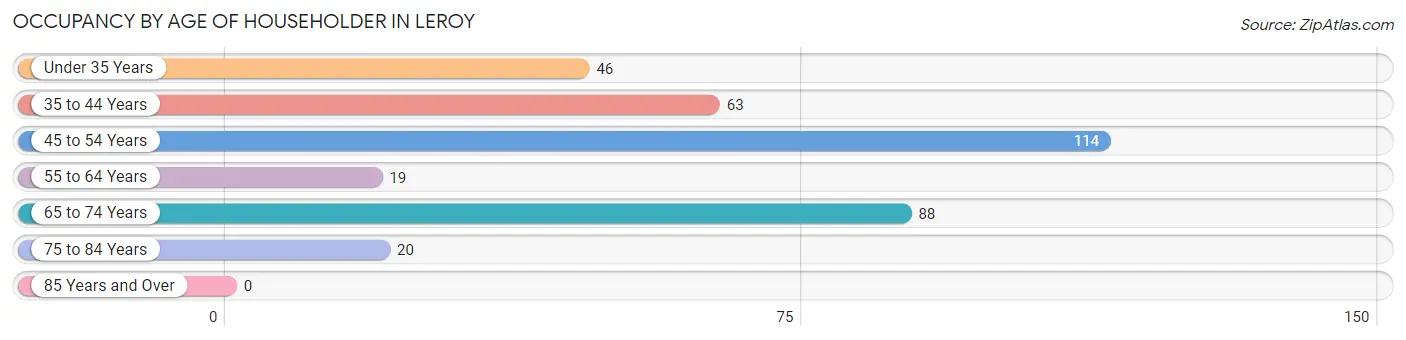
| Age Bracket | # Households | % Households |
| Under 35 Years | 46 | 13.1% |
| 35 to 44 Years | 63 | 18.0% |
| 45 to 54 Years | 114 | 32.6% |
| 55 to 64 Years | 19 | 5.4% |
| 65 to 74 Years | 88 | 25.1% |
| 75 to 84 Years | 20 | 5.7% |
| 85 Years and Over | 0 | 0.0% |
| Total | 350 | 100.0% |
Housing Finances in Leroy
Median Income by Occupancy in Leroy
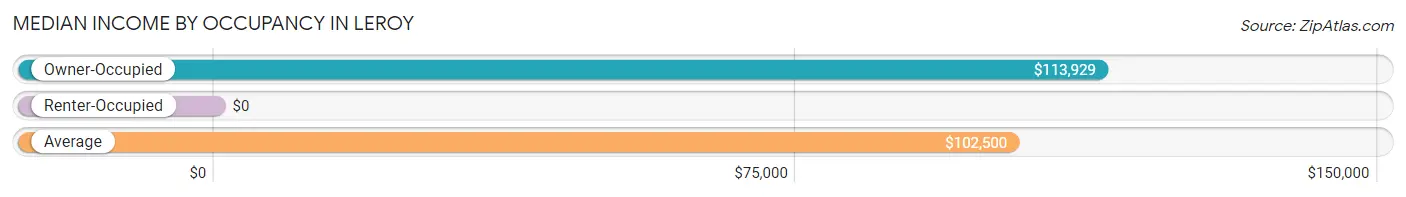
| Occupancy Type | # Households | Median Income |
| Owner-Occupied | 302 (86.3%) | $113,929 |
| Renter-Occupied | 48 (13.7%) | $0 |
| Average | 350 (100.0%) | $102,500 |
Occupancy by Householder Income Bracket in Leroy
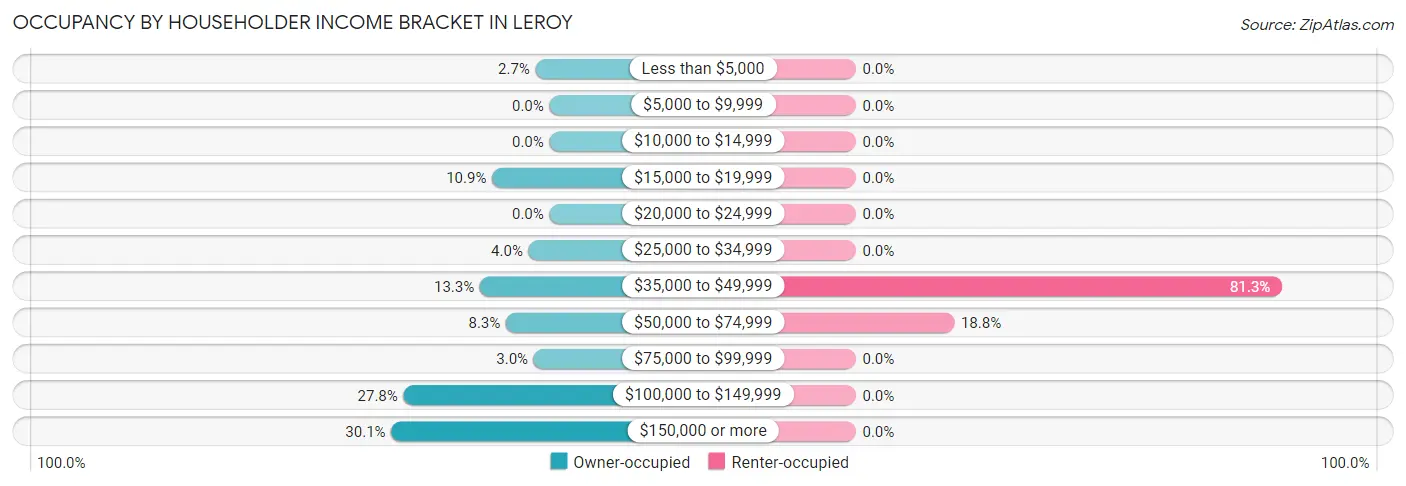
| Income Bracket | Owner-occupied | Renter-occupied |
| Less than $5,000 | 8 (2.6%) | 0 (0.0%) |
| $5,000 to $9,999 | 0 (0.0%) | 0 (0.0%) |
| $10,000 to $14,999 | 0 (0.0%) | 0 (0.0%) |
| $15,000 to $19,999 | 33 (10.9%) | 0 (0.0%) |
| $20,000 to $24,999 | 0 (0.0%) | 0 (0.0%) |
| $25,000 to $34,999 | 12 (4.0%) | 0 (0.0%) |
| $35,000 to $49,999 | 40 (13.3%) | 39 (81.2%) |
| $50,000 to $74,999 | 25 (8.3%) | 9 (18.8%) |
| $75,000 to $99,999 | 9 (3.0%) | 0 (0.0%) |
| $100,000 to $149,999 | 84 (27.8%) | 0 (0.0%) |
| $150,000 or more | 91 (30.1%) | 0 (0.0%) |
| Total | 302 (100.0%) | 48 (100.0%) |
Monthly Housing Cost Tiers in Leroy
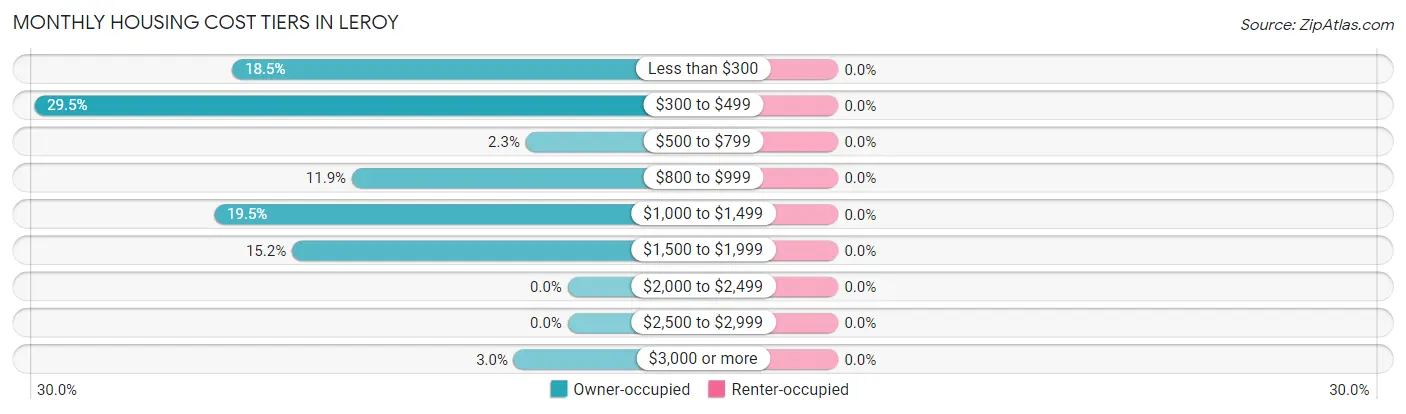
| Monthly Cost | Owner-occupied | Renter-occupied |
| Less than $300 | 56 (18.5%) | 0 (0.0%) |
| $300 to $499 | 89 (29.5%) | 0 (0.0%) |
| $500 to $799 | 7 (2.3%) | 0 (0.0%) |
| $800 to $999 | 36 (11.9%) | 0 (0.0%) |
| $1,000 to $1,499 | 59 (19.5%) | 0 (0.0%) |
| $1,500 to $1,999 | 46 (15.2%) | 0 (0.0%) |
| $2,000 to $2,499 | 0 (0.0%) | 0 (0.0%) |
| $2,500 to $2,999 | 0 (0.0%) | 0 (0.0%) |
| $3,000 or more | 9 (3.0%) | 0 (0.0%) |
| Total | 302 (100.0%) | 48 (100.0%) |
Physical Housing Characteristics in Leroy
Housing Structures in Leroy
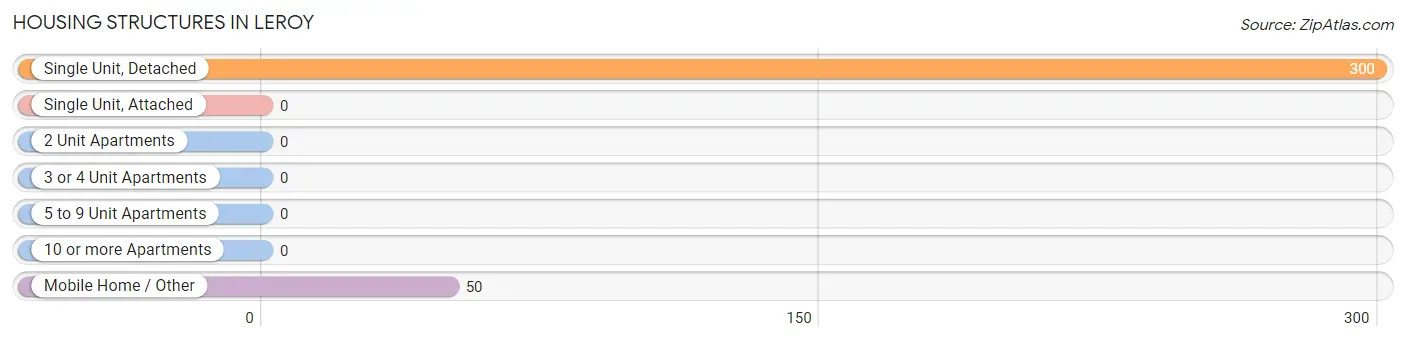
| Structure Type | # Housing Units | % Housing Units |
| Single Unit, Detached | 300 | 85.7% |
| Single Unit, Attached | 0 | 0.0% |
| 2 Unit Apartments | 0 | 0.0% |
| 3 or 4 Unit Apartments | 0 | 0.0% |
| 5 to 9 Unit Apartments | 0 | 0.0% |
| 10 or more Apartments | 0 | 0.0% |
| Mobile Home / Other | 50 | 14.3% |
| Total | 350 | 100.0% |
Housing Structures by Occupancy in Leroy
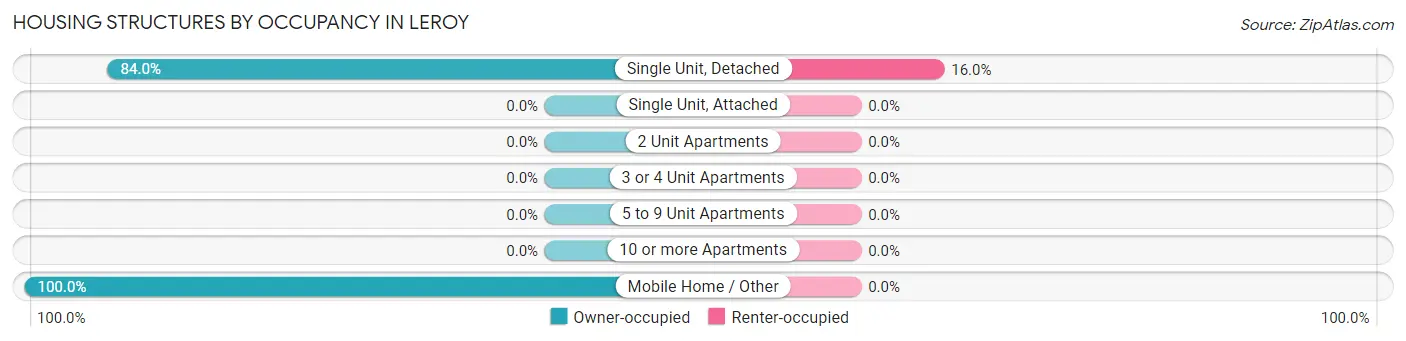
| Structure Type | Owner-occupied | Renter-occupied |
| Single Unit, Detached | 252 (84.0%) | 48 (16.0%) |
| Single Unit, Attached | 0 (0.0%) | 0 (0.0%) |
| 2 Unit Apartments | 0 (0.0%) | 0 (0.0%) |
| 3 or 4 Unit Apartments | 0 (0.0%) | 0 (0.0%) |
| 5 to 9 Unit Apartments | 0 (0.0%) | 0 (0.0%) |
| 10 or more Apartments | 0 (0.0%) | 0 (0.0%) |
| Mobile Home / Other | 50 (100.0%) | 0 (0.0%) |
| Total | 302 (86.3%) | 48 (13.7%) |
Housing Structures by Number of Rooms in Leroy
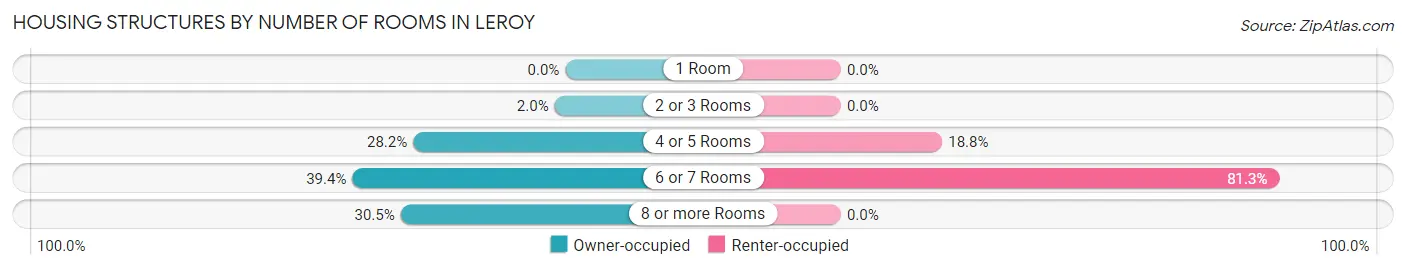
| Number of Rooms | Owner-occupied | Renter-occupied |
| 1 Room | 0 (0.0%) | 0 (0.0%) |
| 2 or 3 Rooms | 6 (2.0%) | 0 (0.0%) |
| 4 or 5 Rooms | 85 (28.1%) | 9 (18.8%) |
| 6 or 7 Rooms | 119 (39.4%) | 39 (81.2%) |
| 8 or more Rooms | 92 (30.5%) | 0 (0.0%) |
| Total | 302 (100.0%) | 48 (100.0%) |
Housing Structure by Heating Type in Leroy
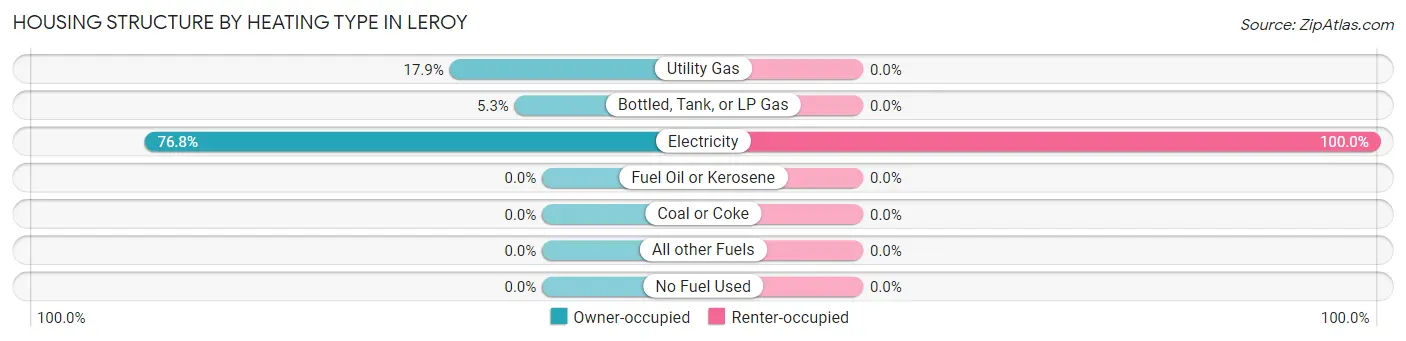
| Heating Type | Owner-occupied | Renter-occupied |
| Utility Gas | 54 (17.9%) | 0 (0.0%) |
| Bottled, Tank, or LP Gas | 16 (5.3%) | 0 (0.0%) |
| Electricity | 232 (76.8%) | 48 (100.0%) |
| Fuel Oil or Kerosene | 0 (0.0%) | 0 (0.0%) |
| Coal or Coke | 0 (0.0%) | 0 (0.0%) |
| All other Fuels | 0 (0.0%) | 0 (0.0%) |
| No Fuel Used | 0 (0.0%) | 0 (0.0%) |
| Total | 302 (100.0%) | 48 (100.0%) |
Household Vehicle Usage in Leroy
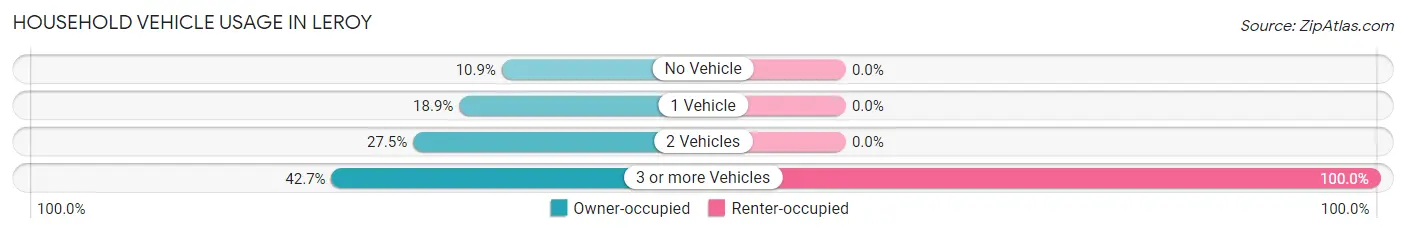
| Vehicles per Household | Owner-occupied | Renter-occupied |
| No Vehicle | 33 (10.9%) | 0 (0.0%) |
| 1 Vehicle | 57 (18.9%) | 0 (0.0%) |
| 2 Vehicles | 83 (27.5%) | 0 (0.0%) |
| 3 or more Vehicles | 129 (42.7%) | 48 (100.0%) |
| Total | 302 (100.0%) | 48 (100.0%) |
Real Estate & Mortgages in Leroy
Real Estate and Mortgage Overview in Leroy
| Characteristic | Without Mortgage | With Mortgage |
| Housing Units | 145 | 157 |
| Median Property Value | - | - |
| Median Household Income | - | - |
| Monthly Housing Costs | $329 | $9 |
| Real Estate Taxes | $386 | $0 |
Property Value by Mortgage Status in Leroy
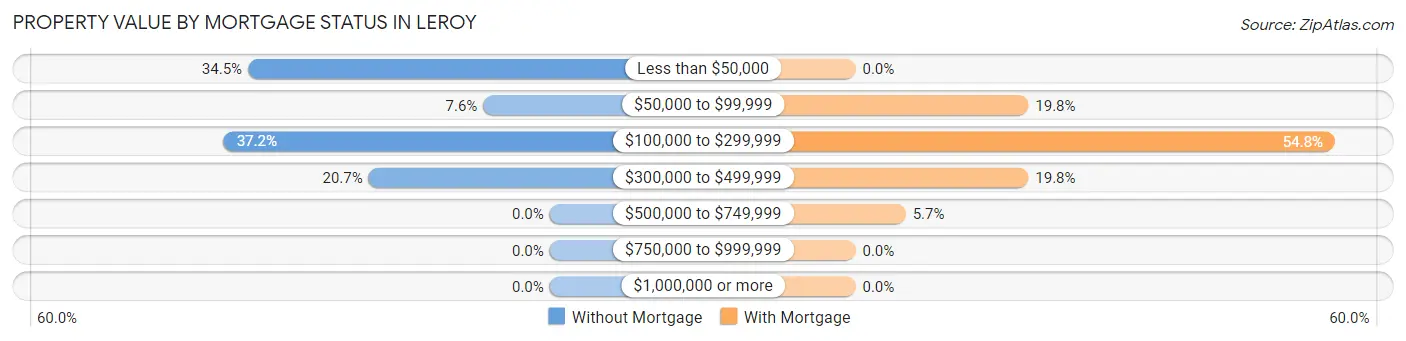
| Property Value | Without Mortgage | With Mortgage |
| Less than $50,000 | 50 (34.5%) | 0 (0.0%) |
| $50,000 to $99,999 | 11 (7.6%) | 31 (19.8%) |
| $100,000 to $299,999 | 54 (37.2%) | 86 (54.8%) |
| $300,000 to $499,999 | 30 (20.7%) | 31 (19.8%) |
| $500,000 to $749,999 | 0 (0.0%) | 9 (5.7%) |
| $750,000 to $999,999 | 0 (0.0%) | 0 (0.0%) |
| $1,000,000 or more | 0 (0.0%) | 0 (0.0%) |
| Total | 145 (100.0%) | 157 (100.0%) |
Household Income by Mortgage Status in Leroy
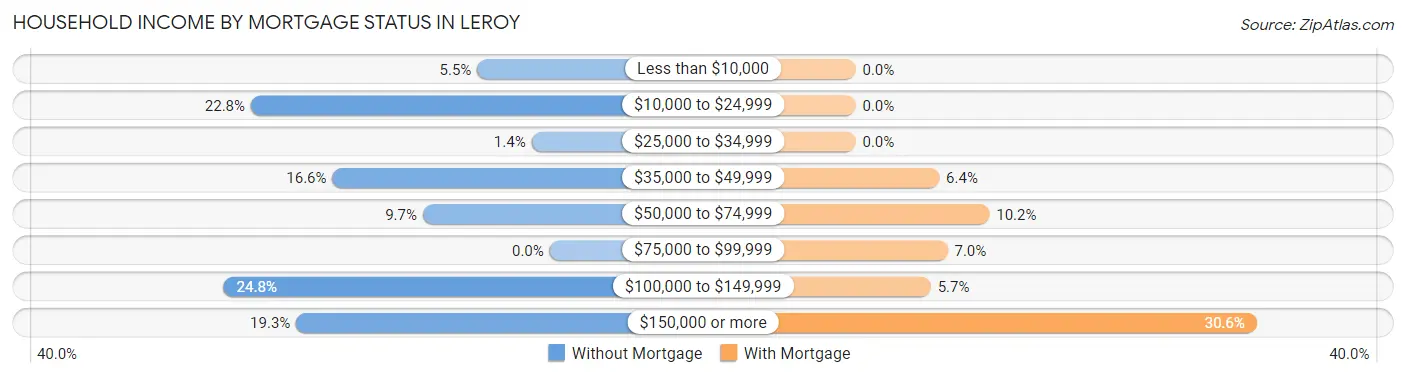
| Household Income | Without Mortgage | With Mortgage |
| Less than $10,000 | 8 (5.5%) | 0 (0.0%) |
| $10,000 to $24,999 | 33 (22.8%) | 0 (0.0%) |
| $25,000 to $34,999 | 2 (1.4%) | 0 (0.0%) |
| $35,000 to $49,999 | 24 (16.6%) | 10 (6.4%) |
| $50,000 to $74,999 | 14 (9.7%) | 16 (10.2%) |
| $75,000 to $99,999 | 0 (0.0%) | 11 (7.0%) |
| $100,000 to $149,999 | 36 (24.8%) | 9 (5.7%) |
| $150,000 or more | 28 (19.3%) | 48 (30.6%) |
| Total | 145 (100.0%) | 157 (100.0%) |
Property Value to Household Income Ratio in Leroy
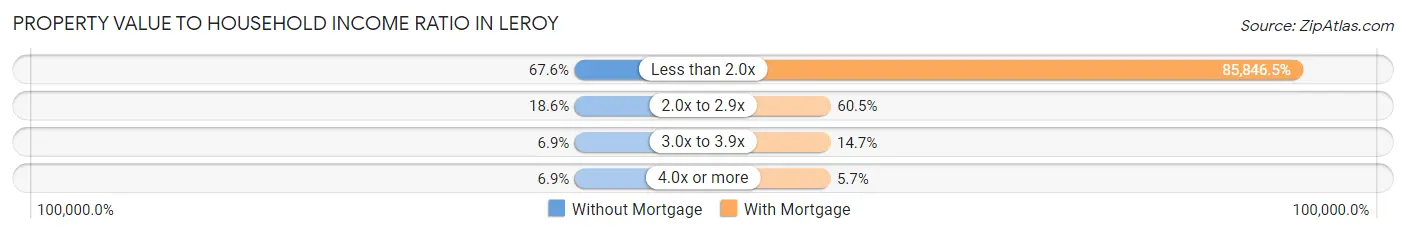
| Value-to-Income Ratio | Without Mortgage | With Mortgage |
| Less than 2.0x | 98 (67.6%) | 134,779 (85,846.5%) |
| 2.0x to 2.9x | 27 (18.6%) | 95 (60.5%) |
| 3.0x to 3.9x | 10 (6.9%) | 23 (14.6%) |
| 4.0x or more | 10 (6.9%) | 9 (5.7%) |
| Total | 145 (100.0%) | 157 (100.0%) |
Real Estate Taxes by Mortgage Status in Leroy
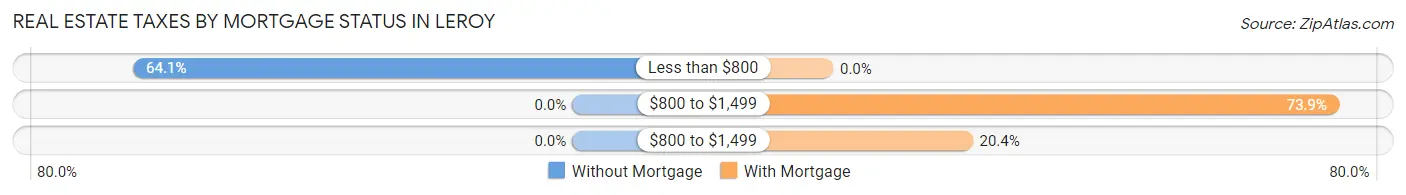
| Property Taxes | Without Mortgage | With Mortgage |
| Less than $800 | 93 (64.1%) | 0 (0.0%) |
| $800 to $1,499 | 0 (0.0%) | 116 (73.9%) |
| $800 to $1,499 | 0 (0.0%) | 32 (20.4%) |
| Total | 145 (100.0%) | 157 (100.0%) |
Health & Disability in Leroy
Health Insurance Coverage by Age in Leroy
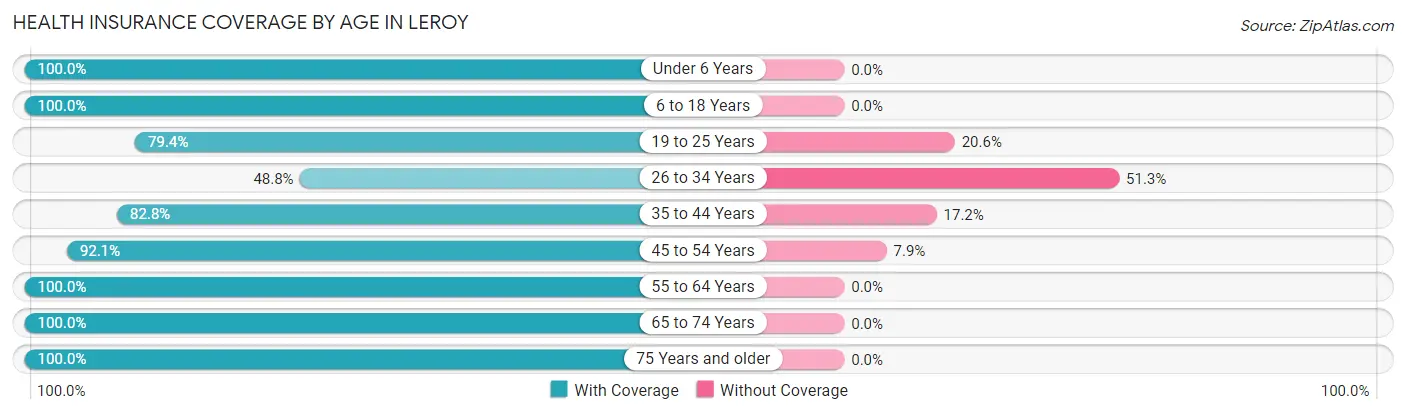
| Age Bracket | With Coverage | Without Coverage |
| Under 6 Years | 78 (100.0%) | 0 (0.0%) |
| 6 to 18 Years | 244 (100.0%) | 0 (0.0%) |
| 19 to 25 Years | 54 (79.4%) | 14 (20.6%) |
| 26 to 34 Years | 39 (48.7%) | 41 (51.2%) |
| 35 to 44 Years | 125 (82.8%) | 26 (17.2%) |
| 45 to 54 Years | 175 (92.1%) | 15 (7.9%) |
| 55 to 64 Years | 79 (100.0%) | 0 (0.0%) |
| 65 to 74 Years | 138 (100.0%) | 0 (0.0%) |
| 75 Years and older | 33 (100.0%) | 0 (0.0%) |
| Total | 965 (90.9%) | 96 (9.0%) |
Health Insurance Coverage by Citizenship Status in Leroy
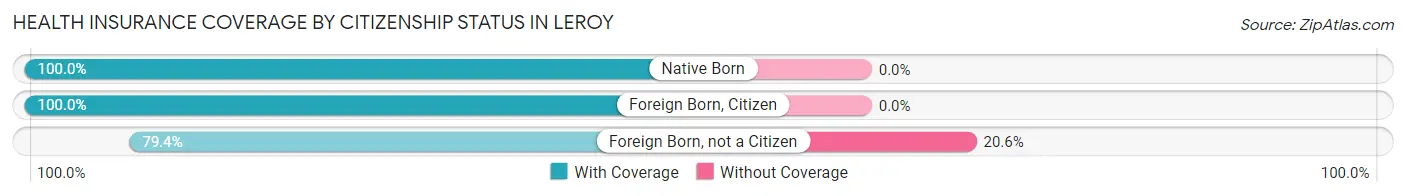
| Citizenship Status | With Coverage | Without Coverage |
| Native Born | 78 (100.0%) | 0 (0.0%) |
| Foreign Born, Citizen | 244 (100.0%) | 0 (0.0%) |
| Foreign Born, not a Citizen | 54 (79.4%) | 14 (20.6%) |
Health Insurance Coverage by Household Income in Leroy
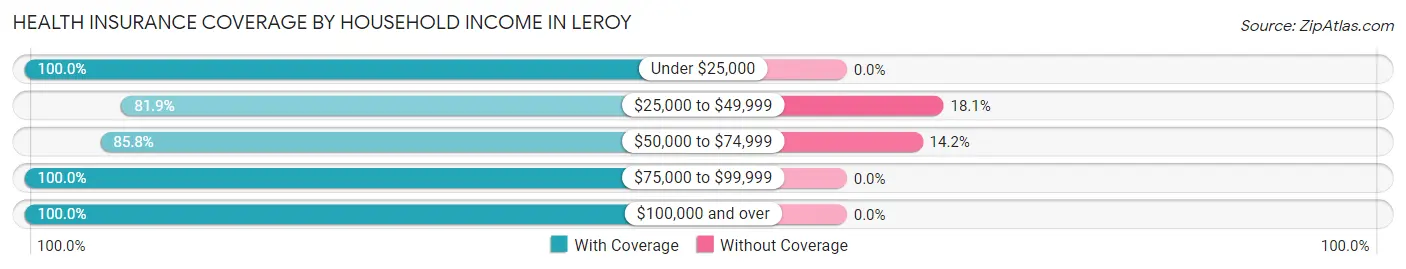
| Household Income | With Coverage | Without Coverage |
| Under $25,000 | 41 (100.0%) | 0 (0.0%) |
| $25,000 to $49,999 | 316 (81.9%) | 70 (18.1%) |
| $50,000 to $74,999 | 157 (85.8%) | 26 (14.2%) |
| $75,000 to $99,999 | 18 (100.0%) | 0 (0.0%) |
| $100,000 and over | 433 (100.0%) | 0 (0.0%) |
Public vs Private Health Insurance Coverage by Age in Leroy
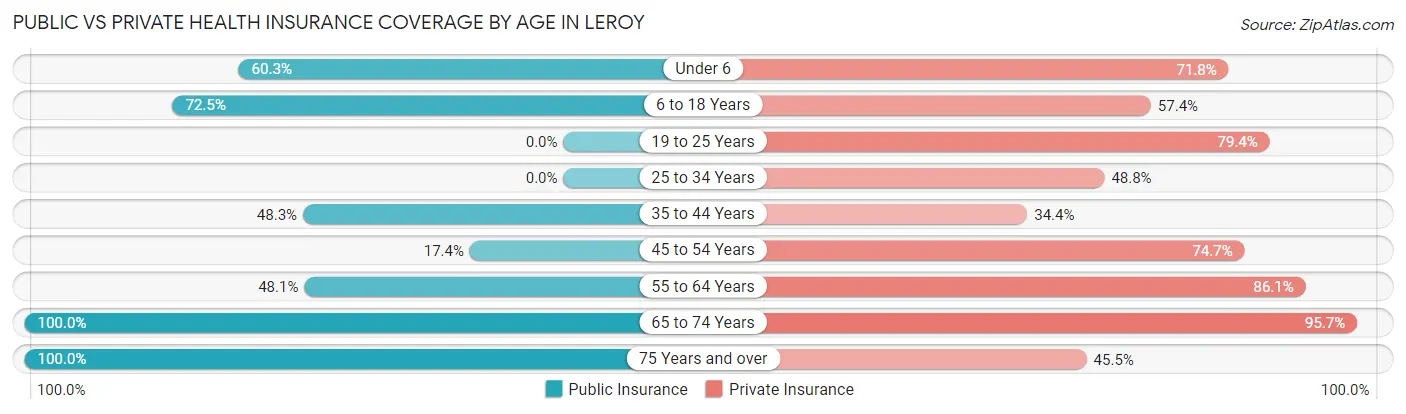
| Age Bracket | Public Insurance | Private Insurance |
| Under 6 | 47 (60.3%) | 56 (71.8%) |
| 6 to 18 Years | 177 (72.5%) | 140 (57.4%) |
| 19 to 25 Years | 0 (0.0%) | 54 (79.4%) |
| 25 to 34 Years | 0 (0.0%) | 39 (48.7%) |
| 35 to 44 Years | 73 (48.3%) | 52 (34.4%) |
| 45 to 54 Years | 33 (17.4%) | 142 (74.7%) |
| 55 to 64 Years | 38 (48.1%) | 68 (86.1%) |
| 65 to 74 Years | 138 (100.0%) | 132 (95.7%) |
| 75 Years and over | 33 (100.0%) | 15 (45.5%) |
| Total | 539 (50.8%) | 698 (65.8%) |
Disability Status by Sex by Age in Leroy
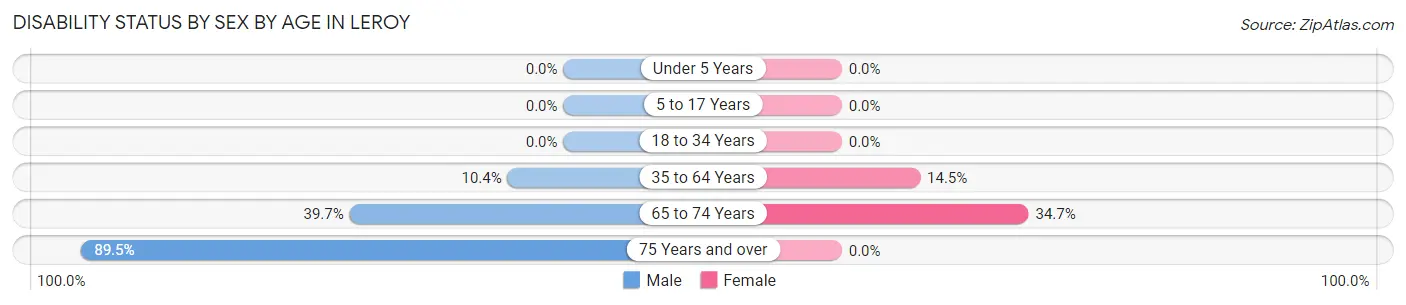
| Age Bracket | Male | Female |
| Under 5 Years | 0 (0.0%) | 0 (0.0%) |
| 5 to 17 Years | 0 (0.0%) | 0 (0.0%) |
| 18 to 34 Years | 0 (0.0%) | 0 (0.0%) |
| 35 to 64 Years | 20 (10.4%) | 33 (14.5%) |
| 65 to 74 Years | 25 (39.7%) | 26 (34.7%) |
| 75 Years and over | 17 (89.5%) | 0 (0.0%) |
Disability Class by Sex by Age in Leroy
Disability Class: Hearing Difficulty
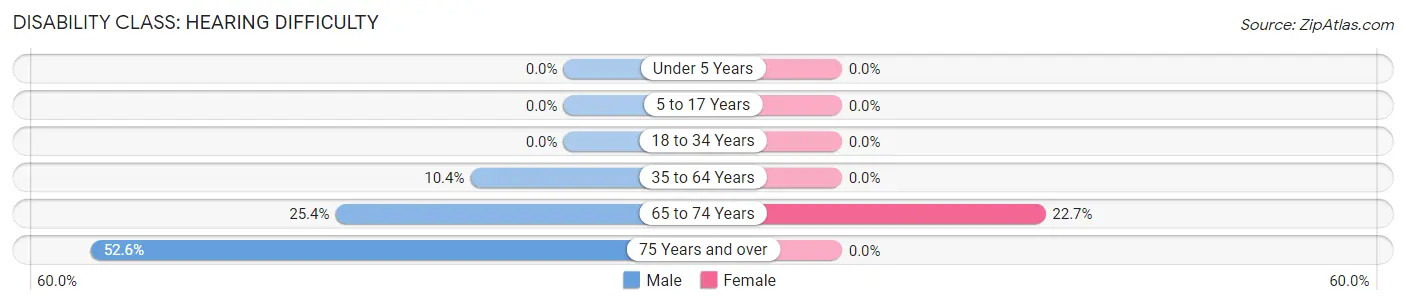
| Age Bracket | Male | Female |
| Under 5 Years | 0 (0.0%) | 0 (0.0%) |
| 5 to 17 Years | 0 (0.0%) | 0 (0.0%) |
| 18 to 34 Years | 0 (0.0%) | 0 (0.0%) |
| 35 to 64 Years | 20 (10.4%) | 0 (0.0%) |
| 65 to 74 Years | 16 (25.4%) | 17 (22.7%) |
| 75 Years and over | 10 (52.6%) | 0 (0.0%) |
Disability Class: Vision Difficulty
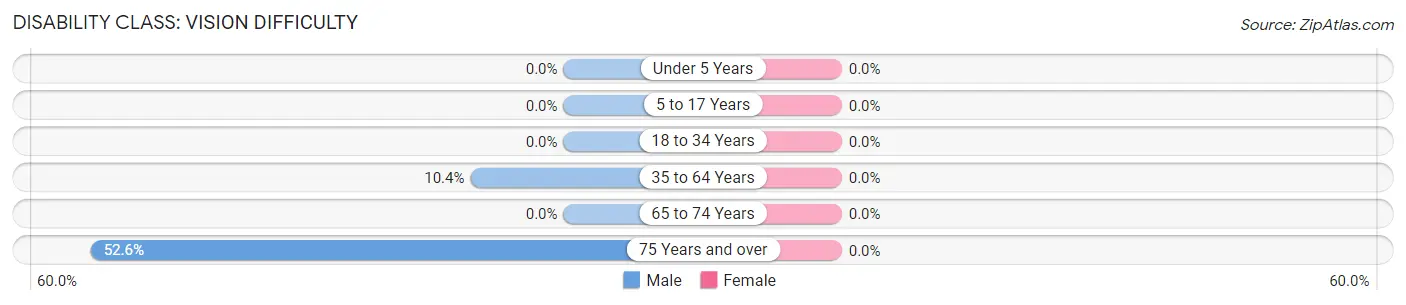
| Age Bracket | Male | Female |
| Under 5 Years | 0 (0.0%) | 0 (0.0%) |
| 5 to 17 Years | 0 (0.0%) | 0 (0.0%) |
| 18 to 34 Years | 0 (0.0%) | 0 (0.0%) |
| 35 to 64 Years | 20 (10.4%) | 0 (0.0%) |
| 65 to 74 Years | 0 (0.0%) | 0 (0.0%) |
| 75 Years and over | 10 (52.6%) | 0 (0.0%) |
Disability Class: Cognitive Difficulty
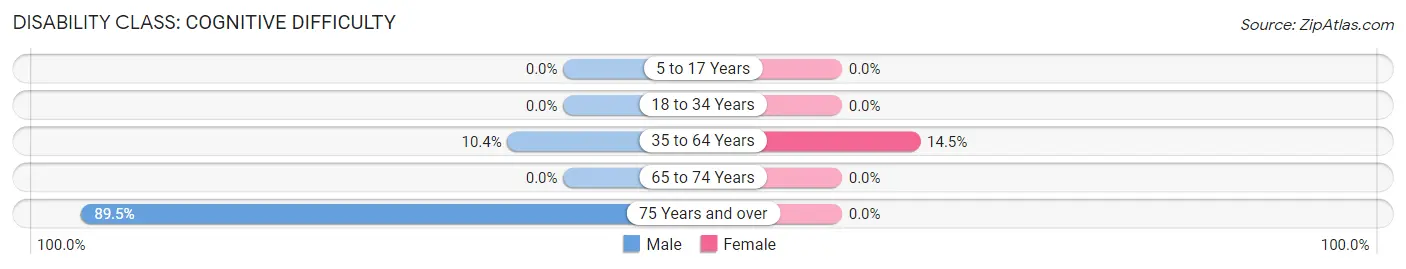
| Age Bracket | Male | Female |
| 5 to 17 Years | 0 (0.0%) | 0 (0.0%) |
| 18 to 34 Years | 0 (0.0%) | 0 (0.0%) |
| 35 to 64 Years | 20 (10.4%) | 33 (14.5%) |
| 65 to 74 Years | 0 (0.0%) | 0 (0.0%) |
| 75 Years and over | 17 (89.5%) | 0 (0.0%) |
Disability Class: Ambulatory Difficulty
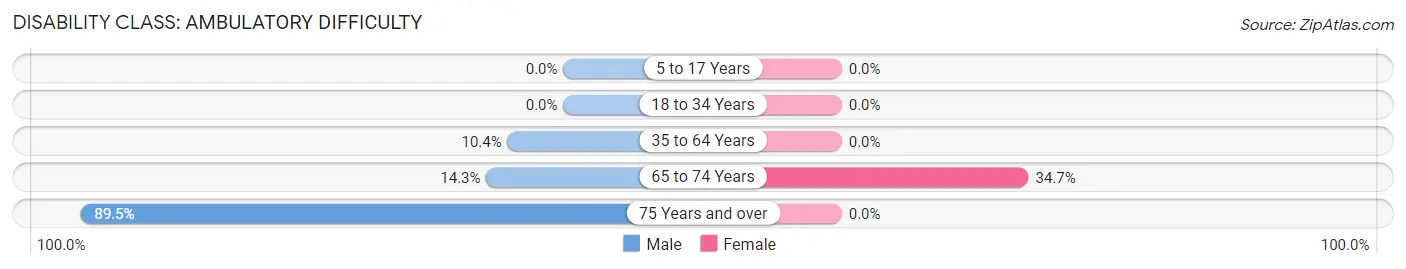
| Age Bracket | Male | Female |
| 5 to 17 Years | 0 (0.0%) | 0 (0.0%) |
| 18 to 34 Years | 0 (0.0%) | 0 (0.0%) |
| 35 to 64 Years | 20 (10.4%) | 0 (0.0%) |
| 65 to 74 Years | 9 (14.3%) | 26 (34.7%) |
| 75 Years and over | 17 (89.5%) | 0 (0.0%) |
Disability Class: Self-Care Difficulty
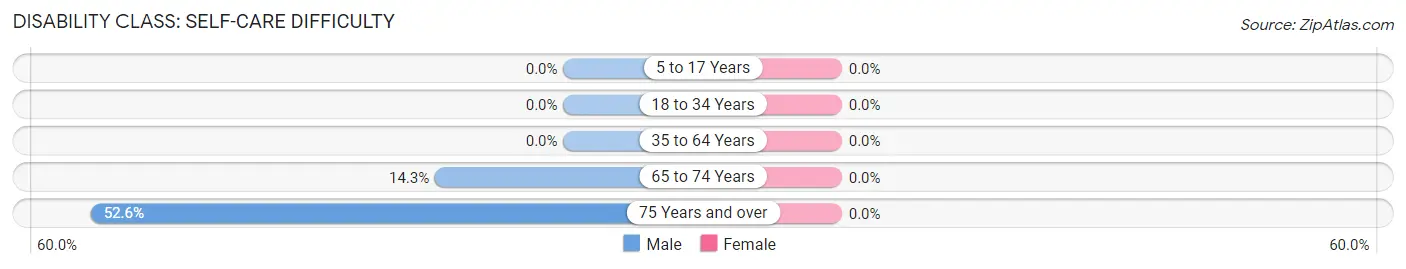
| Age Bracket | Male | Female |
| 5 to 17 Years | 0 (0.0%) | 0 (0.0%) |
| 18 to 34 Years | 0 (0.0%) | 0 (0.0%) |
| 35 to 64 Years | 0 (0.0%) | 0 (0.0%) |
| 65 to 74 Years | 9 (14.3%) | 0 (0.0%) |
| 75 Years and over | 10 (52.6%) | 0 (0.0%) |
Technology Access in Leroy
Computing Device Access in Leroy
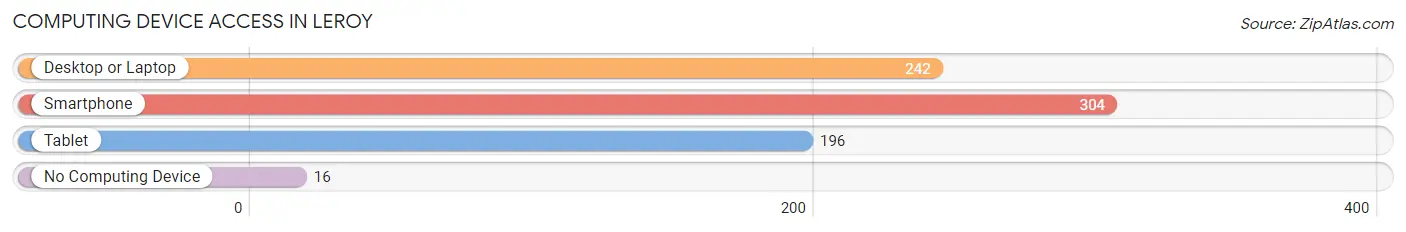
| Device Type | # Households | % Households |
| Desktop or Laptop | 242 | 69.1% |
| Smartphone | 304 | 86.9% |
| Tablet | 196 | 56.0% |
| No Computing Device | 16 | 4.6% |
| Total | 350 | 100.0% |
Internet Access in Leroy
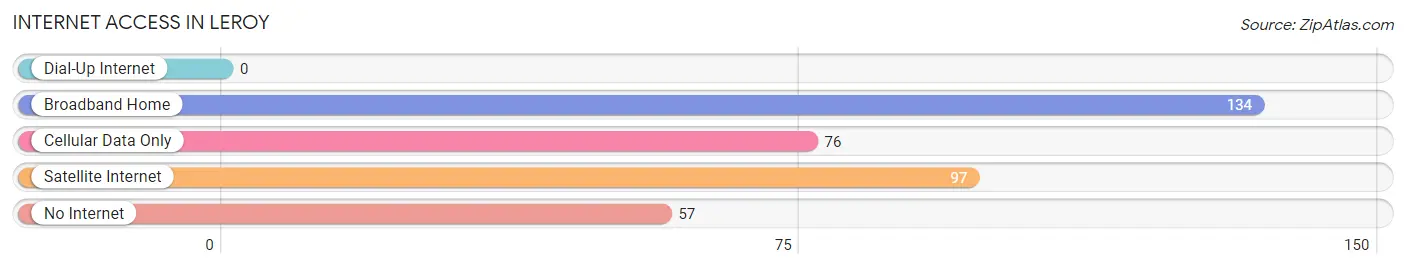
| Internet Type | # Households | % Households |
| Dial-Up Internet | 0 | 0.0% |
| Broadband Home | 134 | 38.3% |
| Cellular Data Only | 76 | 21.7% |
| Satellite Internet | 97 | 27.7% |
| No Internet | 57 | 16.3% |
| Total | 350 | 100.0% |
Leroy Summary
Leroy is a small town located in the northwest corner of Alabama, in the county of Baldwin. It is situated on the banks of the Tombigbee River, and is part of the Mobile metropolitan area. The town has a population of approximately 1,500 people, and is known for its rural charm and friendly atmosphere.
History
Leroy was founded in 1818 by a group of settlers from Georgia. The town was named after a local Native American chief, Chief Leroy. The town was originally a trading post, and the settlers built a fort to protect themselves from Native American attacks. The town grew slowly, and by the mid-1800s, it had become a thriving agricultural community.
In the late 1800s, the town began to experience a period of growth and prosperity. The railroad was built through the town, and the lumber industry began to flourish. The town also became a popular destination for tourists, who came to enjoy the natural beauty of the area.
In the early 1900s, the town experienced a period of decline. The lumber industry declined, and the railroad was abandoned. The town was hit hard by the Great Depression, and many of the businesses closed. However, the town was able to survive, and in the 1950s, it began to experience a period of growth and revitalization.
Geography
Leroy is located in the northwest corner of Alabama, in the county of Baldwin. It is situated on the banks of the Tombigbee River, and is part of the Mobile metropolitan area. The town is surrounded by rolling hills and forests, and is known for its rural charm and friendly atmosphere.
The climate in Leroy is humid subtropical, with hot summers and mild winters. The average annual temperature is around 70 degrees Fahrenheit, and the average annual precipitation is around 50 inches.
Economy
The economy of Leroy is largely based on agriculture and tourism. The town is home to several farms, which produce a variety of crops, including corn, soybeans, cotton, and peanuts. The town is also home to several tourist attractions, including the historic Fort Mims, the Tombigbee River, and the nearby Gulf Coast beaches.
In addition to agriculture and tourism, the town is also home to several small businesses, including restaurants, shops, and other services. The town is also home to a small manufacturing sector, which produces a variety of products, including furniture, clothing, and electronics.
Demographics
As of the 2010 census, the population of Leroy was 1,500 people. The racial makeup of the town was 95.3% White, 2.7% African American, 0.3% Native American, 0.3% Asian, and 1.3% from other races. The median household income was $35,000, and the median family income was $41,000.
The town is home to a variety of religious denominations, including Baptist, Methodist, and Catholic. The town is also home to a variety of cultural and recreational activities, including festivals, concerts, and sporting events.
Conclusion
Leroy is a small town located in the northwest corner of Alabama, in the county of Baldwin. It is situated on the banks of the Tombigbee River, and is part of the Mobile metropolitan area. The town has a population of approximately 1,500 people, and is known for its rural charm and friendly atmosphere. The economy of Leroy is largely based on agriculture and tourism, and the town is home to a variety of religious denominations and cultural and recreational activities.
Common Questions
What is the Total Population of Leroy?
Total Population of Leroy is 1,061.
What is the Total Male Population of Leroy?
Total Male Population of Leroy is 530.
What is the Total Female Population of Leroy?
Total Female Population of Leroy is 531.
What is the Ratio of Males per 100 Females in Leroy?
There are 99.81 Males per 100 Females in Leroy.
What is the Ratio of Females per 100 Males in Leroy?
There are 100.19 Females per 100 Males in Leroy.
What is the Median Population Age in Leroy?
Median Population Age in Leroy is 37.5 Years.
What is the Average Family Size in Leroy
Average Family Size in Leroy is 3.7 People.
What is the Average Household Size in Leroy
Average Household Size in Leroy is 3.0 People.
What is Per Capita Income in Leroy?
Per Capita income in Leroy is $34,031.
What is the Median Family Income in Leroy?
Median Family Income in Leroy is $114,464.
What is the Median Household income in Leroy?
Median Household Income in Leroy is $102,500.
What is Inequality or Gini Index in Leroy?
Inequality or Gini Index in Leroy is 0.35.
How Large is the Labor Force in Leroy?
There are 420 People in the Labor Forcein in Leroy.
What is the Percentage of People in the Labor Force in Leroy?
53.3% of People are in the Labor Force in Leroy.
What is the Unemployment Rate in Leroy?
Unemployment Rate in Leroy is 8.1%.