Hayden, AL
Hayden Map
Hayden Overview
1,579
TOTAL POPULATION
688
MALE POPULATION
891
FEMALE POPULATION
77.22
MALES / 100 FEMALES
129.51
FEMALES / 100 MALES
38.8
MEDIAN AGE
3.4
AVG FAMILY SIZE
2.9
AVG HOUSEHOLD SIZE
$32,210
PER CAPITA INCOME
$105,144
AVG FAMILY INCOME
$80,221
AVG HOUSEHOLD INCOME
51.6%
WAGE / INCOME GAP [ % ]
48.4¢/ $1
WAGE / INCOME GAP [ $ ]
0.36
INEQUALITY / GINI INDEX
642
LABOR FORCE [ PEOPLE ]
52.7%
PERCENT IN LABOR FORCE
2.2%
UNEMPLOYMENT RATE
Hayden Zip Codes
Hayden Area Codes
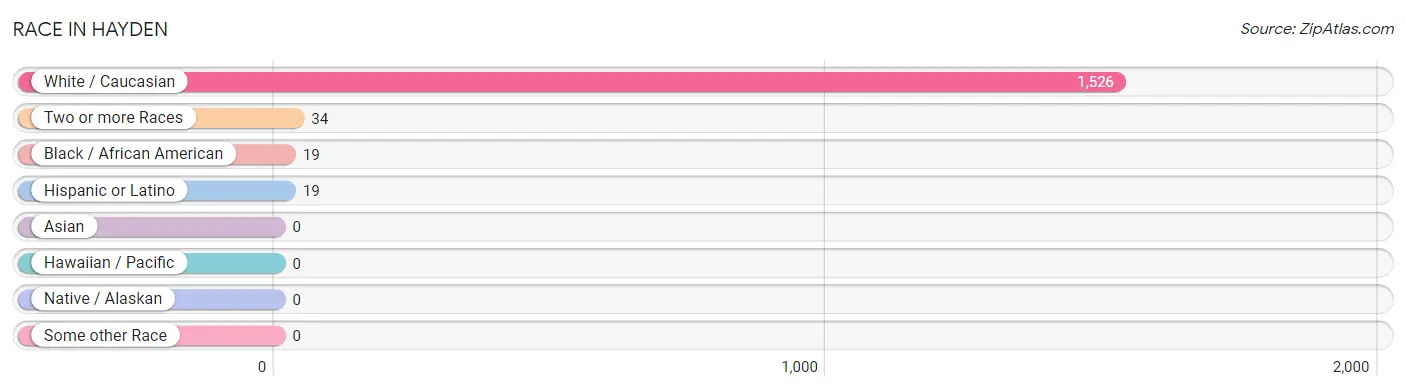
Race in Hayden
The most populous races in Hayden are White / Caucasian (1,526 | 96.6%), Two or more Races (34 | 2.1%), and Black / African American (19 | 1.2%).
| Race | # Population | % Population |
| Asian | 0 | 0.0% |
| Black / African American | 19 | 1.2% |
| Hawaiian / Pacific | 0 | 0.0% |
| Hispanic or Latino | 19 | 1.2% |
| Native / Alaskan | 0 | 0.0% |
| White / Caucasian | 1,526 | 96.6% |
| Two or more Races | 34 | 2.1% |
| Some other Race | 0 | 0.0% |
| Total | 1,579 | 100.0% |
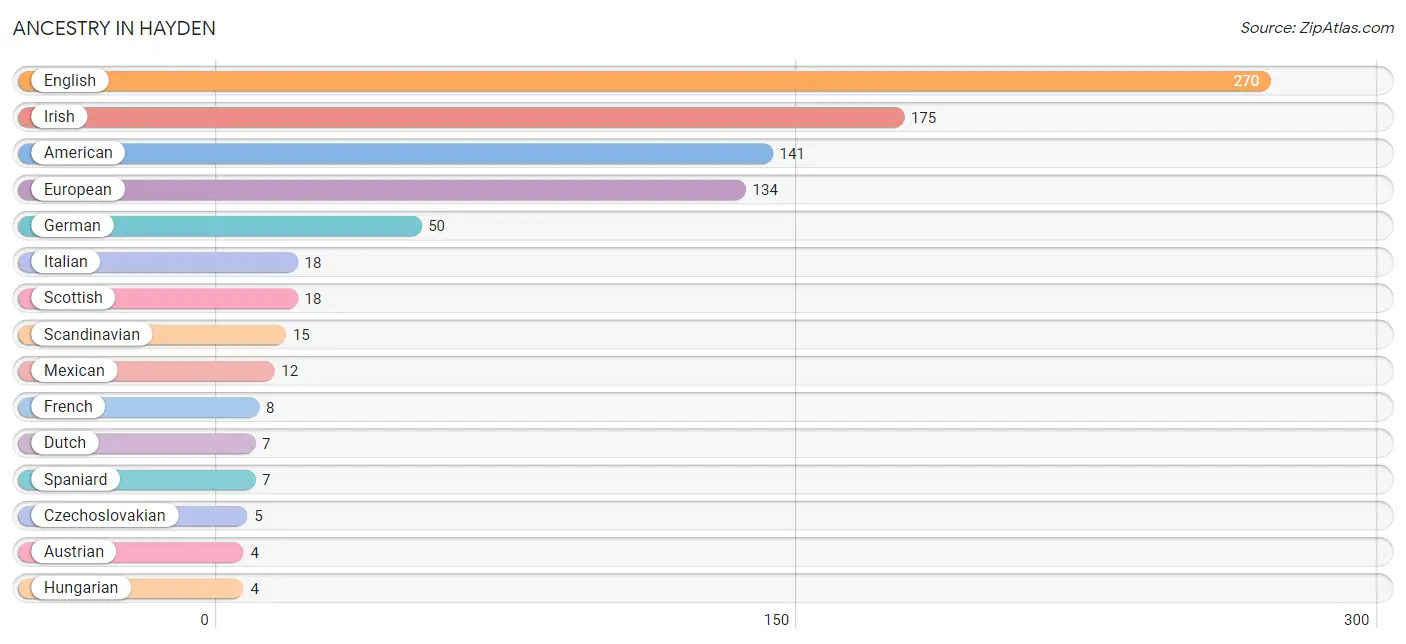
Ancestry in Hayden
The most populous ancestries reported in Hayden are English (270 | 17.1%), Irish (175 | 11.1%), American (141 | 8.9%), European (134 | 8.5%), and German (50 | 3.2%), together accounting for 48.8% of all Hayden residents.
| Ancestry | # Population | % Population |
| American | 141 | 8.9% |
| Austrian | 4 | 0.3% |
| British | 2 | 0.1% |
| Czechoslovakian | 5 | 0.3% |
| Dutch | 7 | 0.4% |
| English | 270 | 17.1% |
| European | 134 | 8.5% |
| French | 8 | 0.5% |
| German | 50 | 3.2% |
| Hungarian | 4 | 0.3% |
| Irish | 175 | 11.1% |
| Italian | 18 | 1.1% |
| Mexican | 12 | 0.8% |
| Scandinavian | 15 | 0.9% |
| Scotch-Irish | 4 | 0.3% |
| Scottish | 18 | 1.1% |
| Spaniard | 7 | 0.4% |
| Welsh | 4 | 0.3% | View All 18 Rows |
Immigrants in Hayden

| Immigration Origin | # Population | % Population | View All 0 Rows |
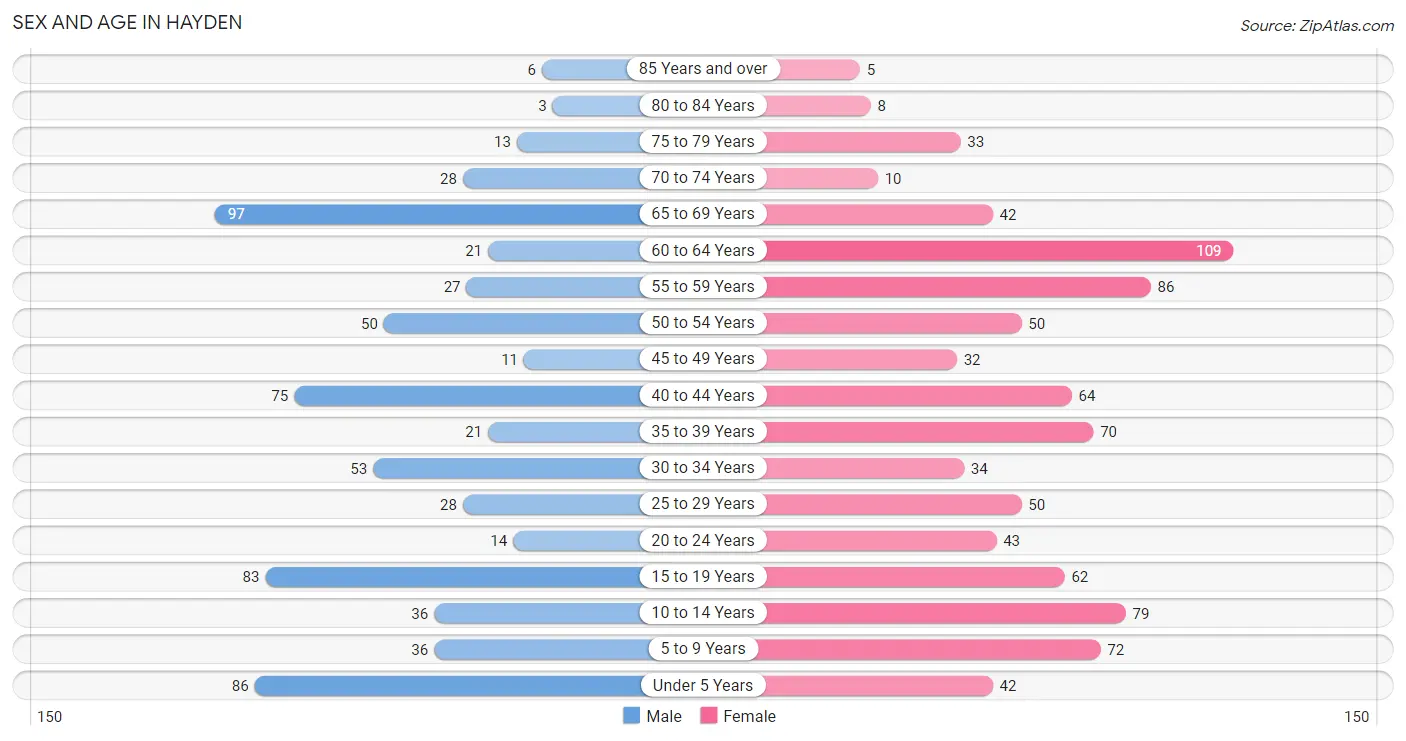
Sex and Age in Hayden
Sex and Age in Hayden
The most populous age groups in Hayden are 65 to 69 Years (97 | 14.1%) for men and 60 to 64 Years (109 | 12.2%) for women.
| Age Bracket | Male | Female |
| Under 5 Years | 86 (12.5%) | 42 (4.7%) |
| 5 to 9 Years | 36 (5.2%) | 72 (8.1%) |
| 10 to 14 Years | 36 (5.2%) | 79 (8.9%) |
| 15 to 19 Years | 83 (12.1%) | 62 (7.0%) |
| 20 to 24 Years | 14 (2.0%) | 43 (4.8%) |
| 25 to 29 Years | 28 (4.1%) | 50 (5.6%) |
| 30 to 34 Years | 53 (7.7%) | 34 (3.8%) |
| 35 to 39 Years | 21 (3.0%) | 70 (7.9%) |
| 40 to 44 Years | 75 (10.9%) | 64 (7.2%) |
| 45 to 49 Years | 11 (1.6%) | 32 (3.6%) |
| 50 to 54 Years | 50 (7.3%) | 50 (5.6%) |
| 55 to 59 Years | 27 (3.9%) | 86 (9.7%) |
| 60 to 64 Years | 21 (3.0%) | 109 (12.2%) |
| 65 to 69 Years | 97 (14.1%) | 42 (4.7%) |
| 70 to 74 Years | 28 (4.1%) | 10 (1.1%) |
| 75 to 79 Years | 13 (1.9%) | 33 (3.7%) |
| 80 to 84 Years | 3 (0.4%) | 8 (0.9%) |
| 85 Years and over | 6 (0.9%) | 5 (0.6%) |
| Total | 688 (100.0%) | 891 (100.0%) |
Families and Households in Hayden
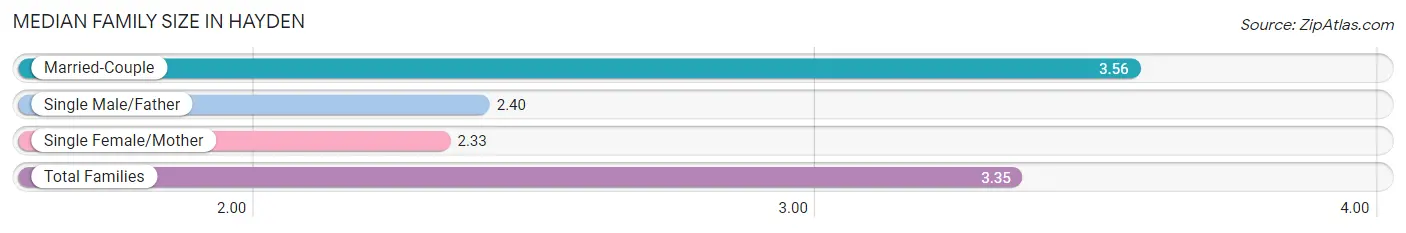
Median Family Size in Hayden
The median family size in Hayden is 3.35 persons per family, with married-couple families (343 | 82.9%) accounting for the largest median family size of 3.56 persons per family. On the other hand, single female/mother families (46 | 11.1%) represent the smallest median family size with 2.33 persons per family.
| Family Type | # Families | Family Size |
| Married-Couple | 343 (82.9%) | 3.56 |
| Single Male/Father | 25 (6.0%) | 2.40 |
| Single Female/Mother | 46 (11.1%) | 2.33 |
| Total Families | 414 (100.0%) | 3.35 |
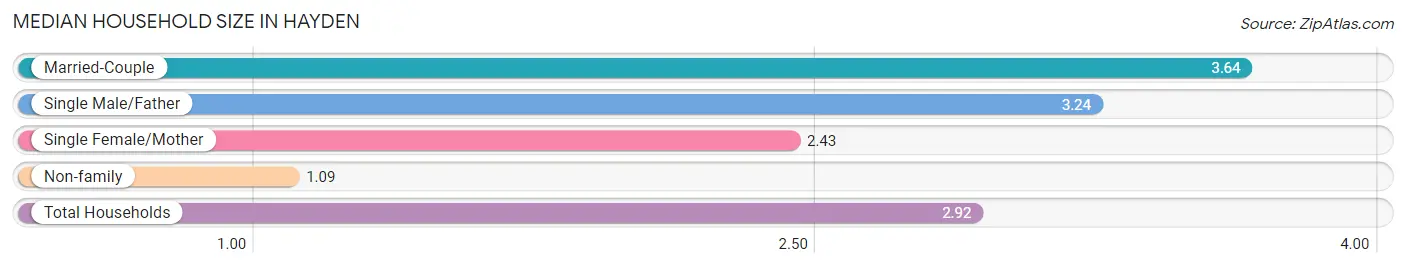
Median Household Size in Hayden
The median household size in Hayden is 2.92 persons per household, with married-couple households (343 | 63.4%) accounting for the largest median household size of 3.64 persons per household. non-family households (127 | 23.5%) represent the smallest median household size with 1.09 persons per household.
| Household Type | # Households | Household Size |
| Married-Couple | 343 (63.4%) | 3.64 |
| Single Male/Father | 25 (4.6%) | 3.24 |
| Single Female/Mother | 46 (8.5%) | 2.43 |
| Non-family | 127 (23.5%) | 1.09 |
| Total Households | 541 (100.0%) | 2.92 |
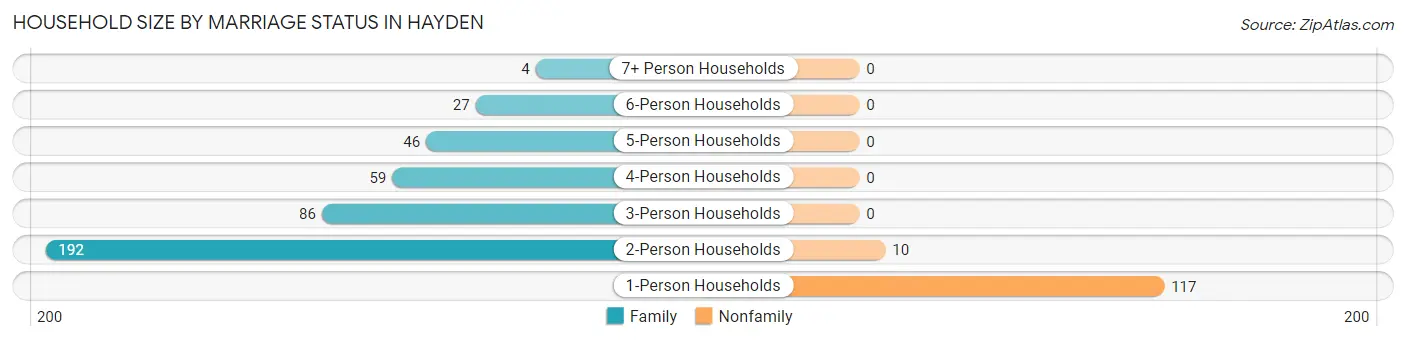
Household Size by Marriage Status in Hayden
Out of a total of 541 households in Hayden, 414 (76.5%) are family households, while 127 (23.5%) are nonfamily households. The most numerous type of family households are 2-person households, comprising 192, and the most common type of nonfamily households are 1-person households, comprising 117.
| Household Size | Family Households | Nonfamily Households |
| 1-Person Households | - | 117 (21.6%) |
| 2-Person Households | 192 (35.5%) | 10 (1.8%) |
| 3-Person Households | 86 (15.9%) | 0 (0.0%) |
| 4-Person Households | 59 (10.9%) | 0 (0.0%) |
| 5-Person Households | 46 (8.5%) | 0 (0.0%) |
| 6-Person Households | 27 (5.0%) | 0 (0.0%) |
| 7+ Person Households | 4 (0.7%) | 0 (0.0%) |
| Total | 414 (76.5%) | 127 (23.5%) |
Female Fertility in Hayden
Fertility by Age in Hayden
| Age Bracket | Women with Births | Births / 1,000 Women |
| 15 to 19 years | 0 (0.0%) | 0.0 |
| 20 to 34 years | 0 (0.0%) | 0.0 |
| 35 to 50 years | 0 (0.0%) | 0.0 |
| Total | 0 (0.0%) | 0.0 |
Fertility by Age by Marriage Status in Hayden
| Age Bracket | Married | Unmarried |
| 15 to 19 years | 0 (0.0%) | 0 (0.0%) |
| 20 to 34 years | 0 (0.0%) | 0 (0.0%) |
| 35 to 50 years | 0 (0.0%) | 0 (0.0%) |
| Total | 0 (0.0%) | 0 (0.0%) |
Fertility by Education in Hayden
| Educational Attainment | Women with Births | Births / 1,000 Women |
| Less than High School | 0 (0.0%) | 0.0 |
| High School Diploma | 0 (0.0%) | 0.0 |
| College or Associate's Degree | 0 (0.0%) | 0.0 |
| Bachelor's Degree | 0 (0.0%) | 0.0 |
| Graduate Degree | 0 (0.0%) | 0.0 |
| Total | 0 (0.0%) | 0.0 |
Fertility by Education by Marriage Status in Hayden
| Educational Attainment | Married | Unmarried |
| Less than High School | 0 (0.0%) | 0 (0.0%) |
| High School Diploma | 0 (0.0%) | 0 (0.0%) |
| College or Associate's Degree | 0 (0.0%) | 0 (0.0%) |
| Bachelor's Degree | 0 (0.0%) | 0 (0.0%) |
| Graduate Degree | 0 (0.0%) | 0 (0.0%) |
| Total | 0 (0.0%) | 0 (0.0%) |
Income in Hayden
Income Overview in Hayden
Per Capita Income in Hayden is $32,210, while median incomes of families and households are $105,144 and $80,221 respectively.
| Characteristic | Number | Measure |
| Per Capita Income | 1,579 | $32,210 |
| Median Family Income | 414 | $105,144 |
| Mean Family Income | 414 | $96,957 |
| Median Household Income | 541 | $80,221 |
| Mean Household Income | 541 | $88,559 |
| Income Deficit | 414 | $0 |
| Wage / Income Gap (%) | 1,579 | 51.59% |
| Wage / Income Gap ($) | 1,579 | 48.41¢ per $1 |
| Gini / Inequality Index | 1,579 | 0.36 |
Earnings by Sex in Hayden
Average Earnings in Hayden are $41,858, $70,288 for men and $34,028 for women, a difference of 51.6%.
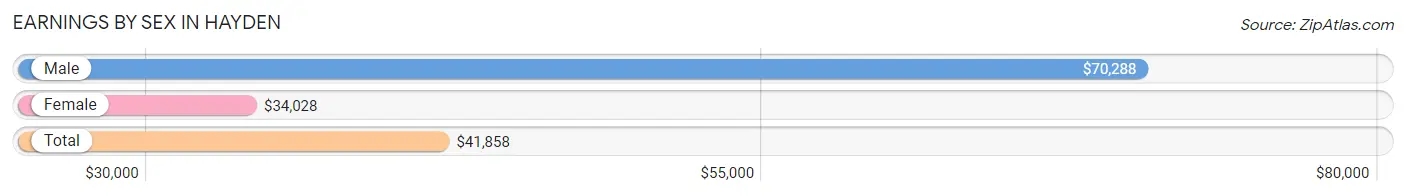
| Sex | Number | Average Earnings |
| Male | 294 (45.4%) | $70,288 |
| Female | 353 (54.6%) | $34,028 |
| Total | 647 (100.0%) | $41,858 |
Earnings by Sex by Income Bracket in Hayden
The most common earnings brackets in Hayden are $100,000+ for men (71 | 24.1%) and $40,000 to $44,999 for women (49 | 13.9%).
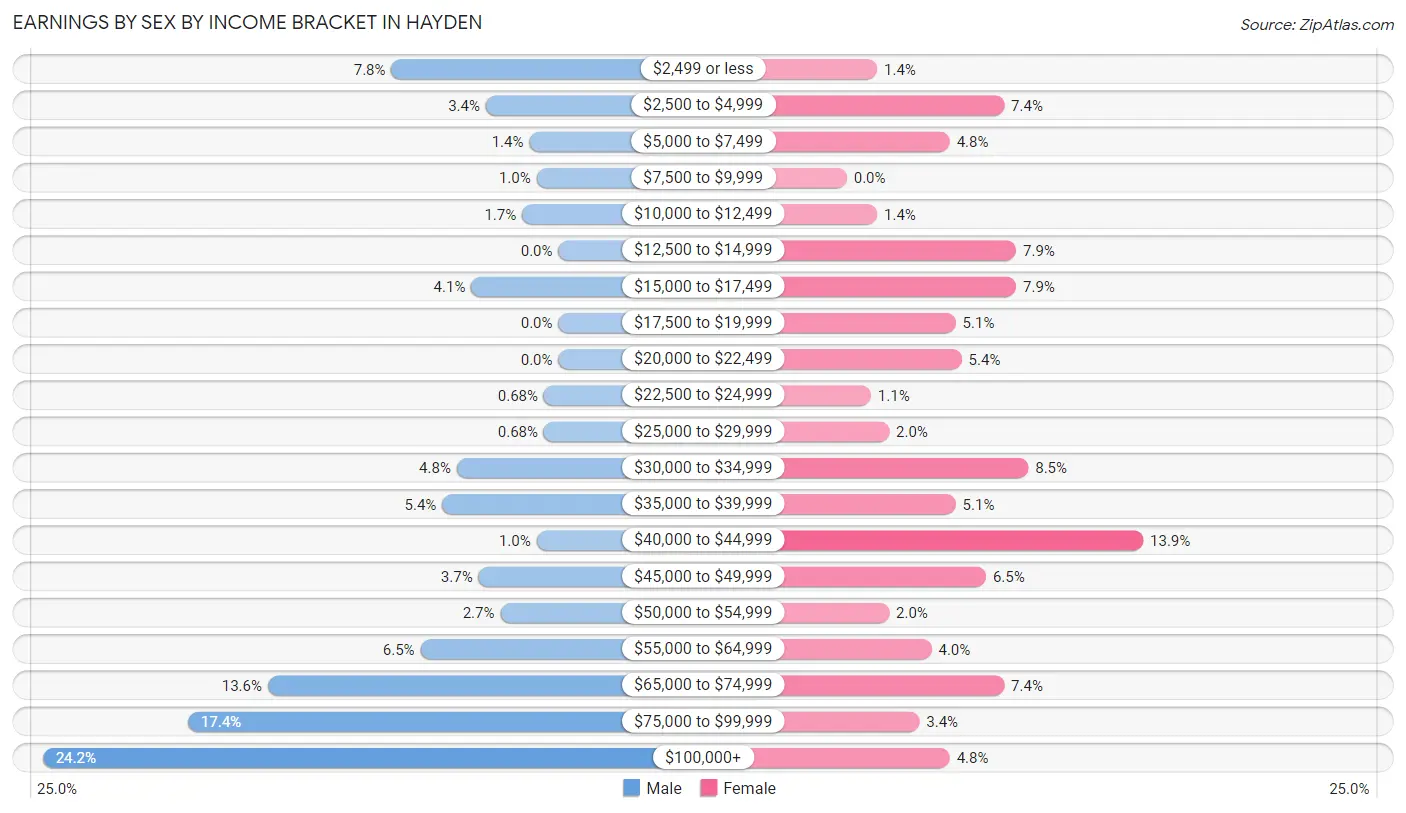
| Income | Male | Female |
| $2,499 or less | 23 (7.8%) | 5 (1.4%) |
| $2,500 to $4,999 | 10 (3.4%) | 26 (7.4%) |
| $5,000 to $7,499 | 4 (1.4%) | 17 (4.8%) |
| $7,500 to $9,999 | 3 (1.0%) | 0 (0.0%) |
| $10,000 to $12,499 | 5 (1.7%) | 5 (1.4%) |
| $12,500 to $14,999 | 0 (0.0%) | 28 (7.9%) |
| $15,000 to $17,499 | 12 (4.1%) | 28 (7.9%) |
| $17,500 to $19,999 | 0 (0.0%) | 18 (5.1%) |
| $20,000 to $22,499 | 0 (0.0%) | 19 (5.4%) |
| $22,500 to $24,999 | 2 (0.7%) | 4 (1.1%) |
| $25,000 to $29,999 | 2 (0.7%) | 7 (2.0%) |
| $30,000 to $34,999 | 14 (4.8%) | 30 (8.5%) |
| $35,000 to $39,999 | 16 (5.4%) | 18 (5.1%) |
| $40,000 to $44,999 | 3 (1.0%) | 49 (13.9%) |
| $45,000 to $49,999 | 11 (3.7%) | 23 (6.5%) |
| $50,000 to $54,999 | 8 (2.7%) | 7 (2.0%) |
| $55,000 to $64,999 | 19 (6.5%) | 14 (4.0%) |
| $65,000 to $74,999 | 40 (13.6%) | 26 (7.4%) |
| $75,000 to $99,999 | 51 (17.3%) | 12 (3.4%) |
| $100,000+ | 71 (24.1%) | 17 (4.8%) |
| Total | 294 (100.0%) | 353 (100.0%) |
Earnings by Sex by Educational Attainment in Hayden
Average earnings in Hayden are $71,250 for men and $36,797 for women, a difference of 48.4%. Men with an educational attainment of bachelor's degree enjoy the highest average annual earnings of $157,188, while those with less than high school education earn the least with $2,499. Women with an educational attainment of graduate degree earn the most with the average annual earnings of $67,750, while those with college or associate's degree education have the smallest earnings of $30,417.
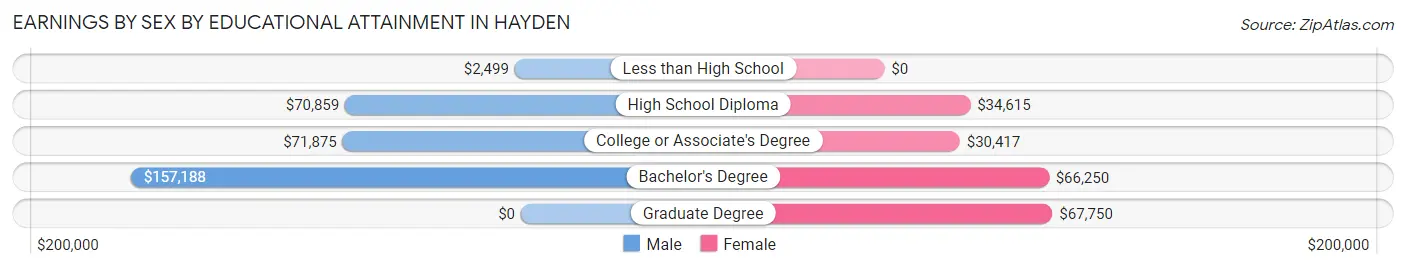
| Educational Attainment | Male Income | Female Income |
| Less than High School | $2,499 | $0 |
| High School Diploma | $70,859 | $34,615 |
| College or Associate's Degree | $71,875 | $30,417 |
| Bachelor's Degree | $157,188 | $66,250 |
| Graduate Degree | - | - |
| Total | $71,250 | $36,797 |
Family Income in Hayden
Family Income Brackets in Hayden
According to the Hayden family income data, there are 150 families falling into the $100,000 to $149,999 income range, which is the most common income bracket and makes up 36.2% of all families.
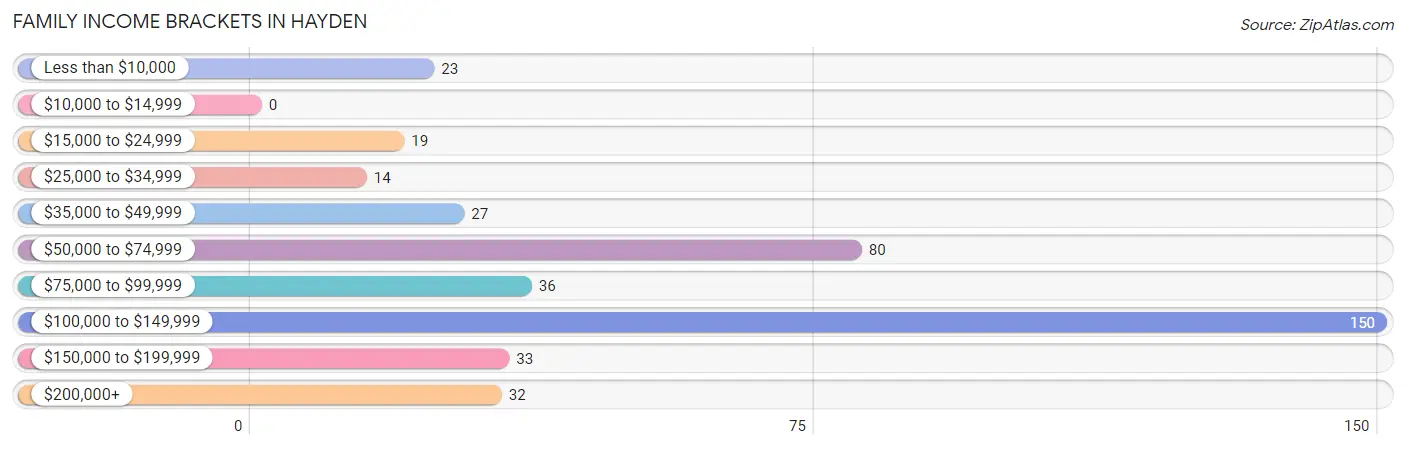
| Income Bracket | # Families | % Families |
| Less than $10,000 | 23 | 5.6% |
| $10,000 to $14,999 | 0 | 0.0% |
| $15,000 to $24,999 | 19 | 4.6% |
| $25,000 to $34,999 | 14 | 3.4% |
| $35,000 to $49,999 | 27 | 6.5% |
| $50,000 to $74,999 | 80 | 19.3% |
| $75,000 to $99,999 | 36 | 8.7% |
| $100,000 to $149,999 | 150 | 36.2% |
| $150,000 to $199,999 | 33 | 8.0% |
| $200,000+ | 32 | 7.7% |
Family Income by Famaliy Size in Hayden
4-person families (40 | 9.7%) account for the highest median family income in Hayden with $158,750 per family, while 4-person families (40 | 9.7%) have the highest median income of $39,688 per family member.
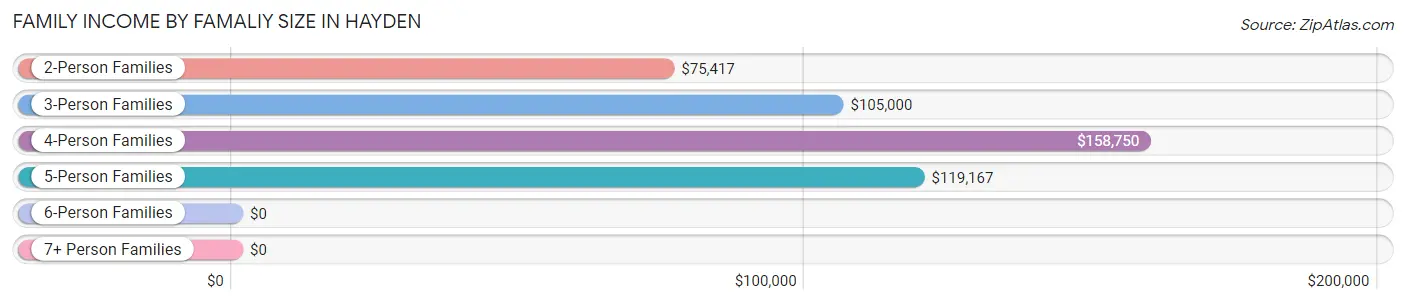
| Income Bracket | # Families | Median Income |
| 2-Person Families | 199 (48.1%) | $75,417 |
| 3-Person Families | 100 (24.1%) | $105,000 |
| 4-Person Families | 40 (9.7%) | $158,750 |
| 5-Person Families | 44 (10.6%) | $119,167 |
| 6-Person Families | 27 (6.5%) | $0 |
| 7+ Person Families | 4 (1.0%) | $0 |
| Total | 414 (100.0%) | $105,144 |
Family Income by Number of Earners in Hayden
The median family income in Hayden is $105,144, with families comprising 3+ earners (28) having the highest median family income of $148,125, while families with 1 earner (157) have the lowest median family income of $64,803, accounting for 6.8% and 37.9% of families, respectively.
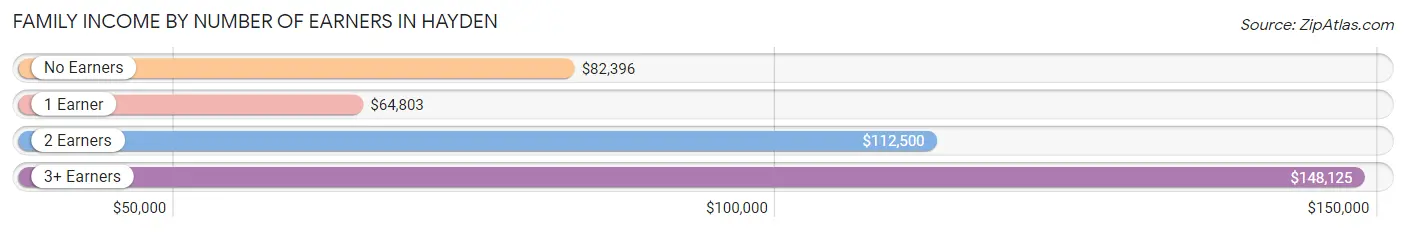
| Number of Earners | # Families | Median Income |
| No Earners | 97 (23.4%) | $82,396 |
| 1 Earner | 157 (37.9%) | $64,803 |
| 2 Earners | 132 (31.9%) | $112,500 |
| 3+ Earners | 28 (6.8%) | $148,125 |
| Total | 414 (100.0%) | $105,144 |
Household Income in Hayden
Household Income Brackets in Hayden
With 152 households falling in the category, the $100,000 to $149,999 income range is the most frequent in Hayden, accounting for 28.1% of all households. In contrast, only 12 households (2.2%) fall into the $10,000 to $14,999 income bracket, making it the least populous group.
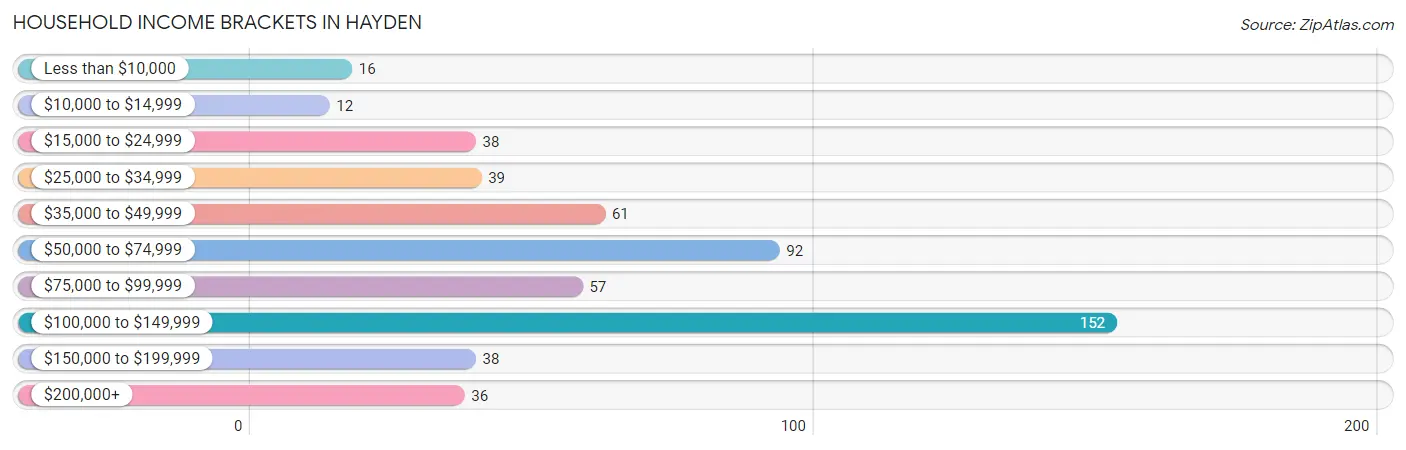
| Income Bracket | # Households | % Households |
| Less than $10,000 | 16 | 3.0% |
| $10,000 to $14,999 | 12 | 2.2% |
| $15,000 to $24,999 | 38 | 7.0% |
| $25,000 to $34,999 | 39 | 7.2% |
| $35,000 to $49,999 | 61 | 11.3% |
| $50,000 to $74,999 | 92 | 17.0% |
| $75,000 to $99,999 | 57 | 10.5% |
| $100,000 to $149,999 | 152 | 28.1% |
| $150,000 to $199,999 | 38 | 7.0% |
| $200,000+ | 36 | 6.7% |
Household Income by Householder Age in Hayden
The median household income in Hayden is $80,221, with the highest median household income of $101,667 found in the 25 to 44 years age bracket for the primary householder. A total of 198 households (36.6%) fall into this category. Meanwhile, the 15 to 24 years age bracket for the primary householder has the lowest median household income of $0, with 3 households (0.5%) in this group.
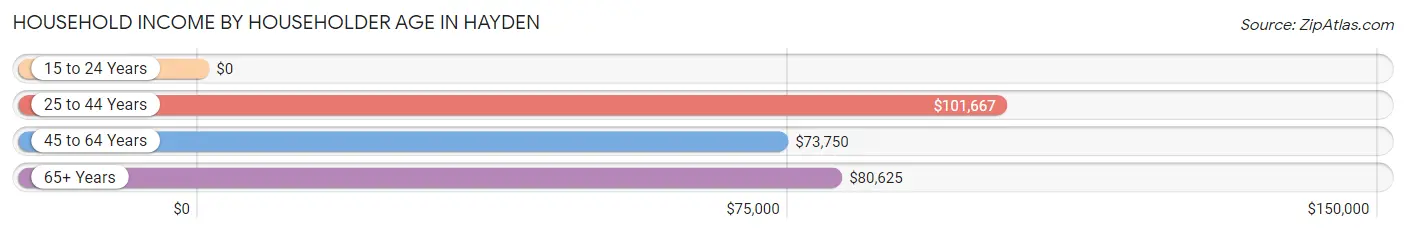
| Income Bracket | # Households | Median Income |
| 15 to 24 Years | 3 (0.5%) | $0 |
| 25 to 44 Years | 198 (36.6%) | $101,667 |
| 45 to 64 Years | 172 (31.8%) | $73,750 |
| 65+ Years | 168 (31.0%) | $80,625 |
| Total | 541 (100.0%) | $80,221 |
Poverty in Hayden
Income Below Poverty by Sex and Age in Hayden
With 11.2% poverty level for males and 11.8% for females among the residents of Hayden, 5 year old males and 5 year old females are the most vulnerable to poverty, with 11 males (68.8%) and 7 females (46.7%) in their respective age groups living below the poverty level.
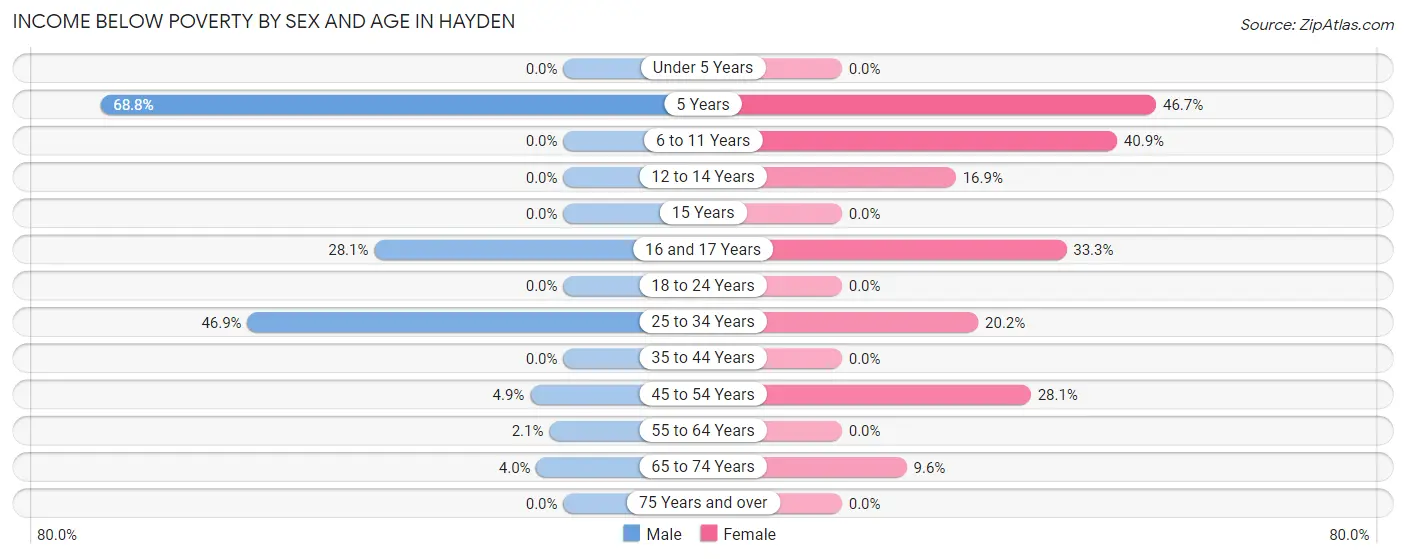
| Age Bracket | Male | Female |
| Under 5 Years | 0 (0.0%) | 0 (0.0%) |
| 5 Years | 11 (68.8%) | 7 (46.7%) |
| 6 to 11 Years | 0 (0.0%) | 29 (40.8%) |
| 12 to 14 Years | 0 (0.0%) | 11 (16.9%) |
| 15 Years | 0 (0.0%) | 0 (0.0%) |
| 16 and 17 Years | 16 (28.1%) | 13 (33.3%) |
| 18 to 24 Years | 0 (0.0%) | 0 (0.0%) |
| 25 to 34 Years | 38 (46.9%) | 17 (20.2%) |
| 35 to 44 Years | 0 (0.0%) | 0 (0.0%) |
| 45 to 54 Years | 3 (4.9%) | 23 (28.1%) |
| 55 to 64 Years | 1 (2.1%) | 0 (0.0%) |
| 65 to 74 Years | 5 (4.0%) | 5 (9.6%) |
| 75 Years and over | 0 (0.0%) | 0 (0.0%) |
| Total | 74 (11.2%) | 105 (11.8%) |
Income Above Poverty by Sex and Age in Hayden
According to the poverty statistics in Hayden, males aged under 5 years and females aged under 5 years are the age groups that are most secure financially, with 100.0% of males and 100.0% of females in these age groups living above the poverty line.
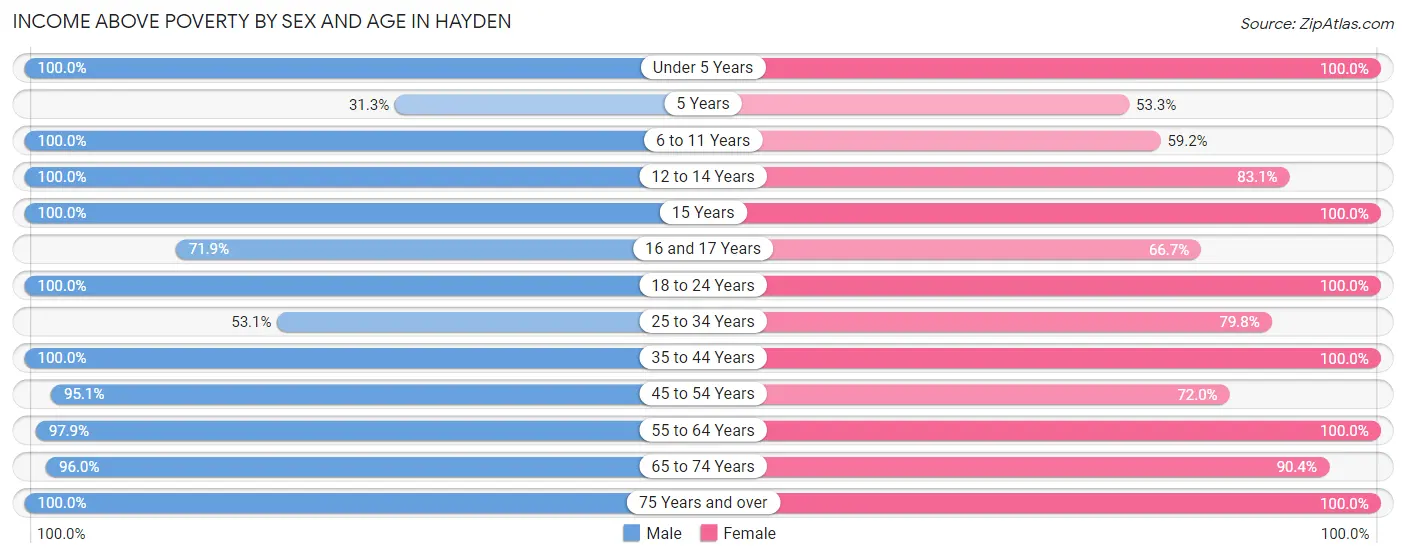
| Age Bracket | Male | Female |
| Under 5 Years | 59 (100.0%) | 42 (100.0%) |
| 5 Years | 5 (31.2%) | 8 (53.3%) |
| 6 to 11 Years | 43 (100.0%) | 42 (59.2%) |
| 12 to 14 Years | 13 (100.0%) | 54 (83.1%) |
| 15 Years | 3 (100.0%) | 6 (100.0%) |
| 16 and 17 Years | 41 (71.9%) | 26 (66.7%) |
| 18 to 24 Years | 37 (100.0%) | 60 (100.0%) |
| 25 to 34 Years | 43 (53.1%) | 67 (79.8%) |
| 35 to 44 Years | 96 (100.0%) | 134 (100.0%) |
| 45 to 54 Years | 58 (95.1%) | 59 (72.0%) |
| 55 to 64 Years | 47 (97.9%) | 195 (100.0%) |
| 65 to 74 Years | 120 (96.0%) | 47 (90.4%) |
| 75 Years and over | 22 (100.0%) | 46 (100.0%) |
| Total | 587 (88.8%) | 786 (88.2%) |
Income Below Poverty Among Married-Couple Families in Hayden
The poverty statistics for married-couple families in Hayden show that 5.0% or 17 of the total 343 families live below the poverty line. Families with 3 or 4 children have the highest poverty rate of 21.8%, comprising of 12 families. On the other hand, families with 1 or 2 children have the lowest poverty rate of 0.0%, which includes 0 families.
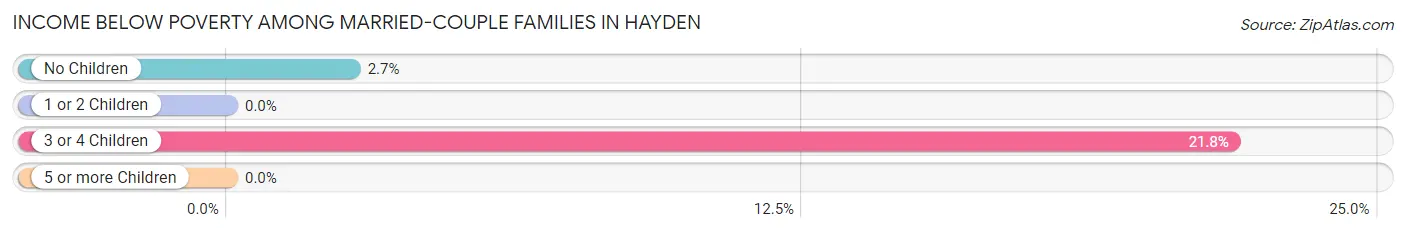
| Children | Above Poverty | Below Poverty |
| No Children | 182 (97.3%) | 5 (2.7%) |
| 1 or 2 Children | 101 (100.0%) | 0 (0.0%) |
| 3 or 4 Children | 43 (78.2%) | 12 (21.8%) |
| 5 or more Children | 0 (0.0%) | 0 (0.0%) |
| Total | 326 (95.0%) | 17 (5.0%) |
Income Below Poverty Among Single-Parent Households in Hayden
According to the poverty data in Hayden, 56.0% or 14 single-father households and 28.3% or 13 single-mother households are living below the poverty line. Among single-father households, those with 1 or 2 children have the highest poverty rate, with 14 households (77.8%) experiencing poverty. Likewise, among single-mother households, those with no children have the highest poverty rate, with 6 households (37.5%) falling below the poverty line.
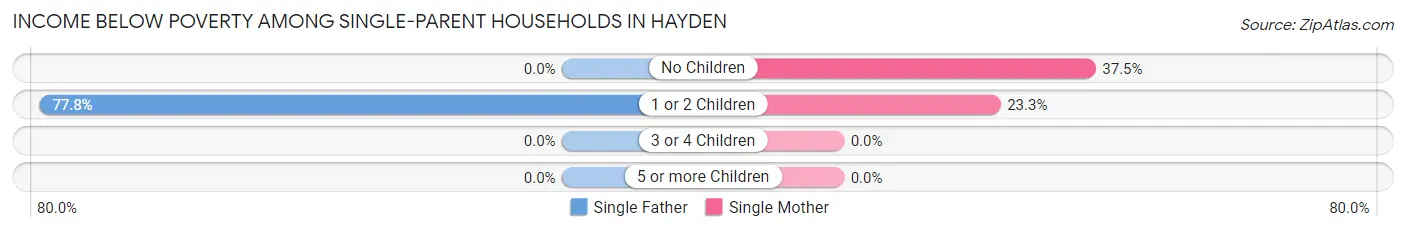
| Children | Single Father | Single Mother |
| No Children | 0 (0.0%) | 6 (37.5%) |
| 1 or 2 Children | 14 (77.8%) | 7 (23.3%) |
| 3 or 4 Children | 0 (0.0%) | 0 (0.0%) |
| 5 or more Children | 0 (0.0%) | 0 (0.0%) |
| Total | 14 (56.0%) | 13 (28.3%) |
Income Below Poverty Among Married-Couple vs Single-Parent Households in Hayden
The poverty data for Hayden shows that 17 of the married-couple family households (5.0%) and 27 of the single-parent households (38.0%) are living below the poverty level. Within the married-couple family households, those with 3 or 4 children have the highest poverty rate, with 12 households (21.8%) falling below the poverty line. Among the single-parent households, those with 1 or 2 children have the highest poverty rate, with 21 household (43.8%) living below poverty.
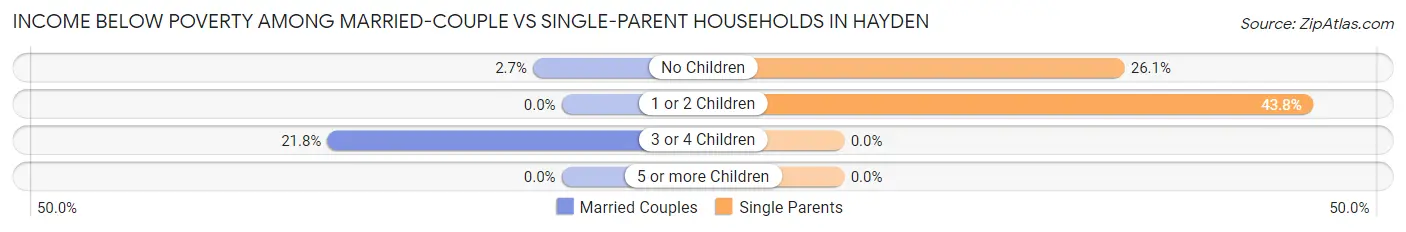
| Children | Married-Couple Families | Single-Parent Households |
| No Children | 5 (2.7%) | 6 (26.1%) |
| 1 or 2 Children | 0 (0.0%) | 21 (43.8%) |
| 3 or 4 Children | 12 (21.8%) | 0 (0.0%) |
| 5 or more Children | 0 (0.0%) | 0 (0.0%) |
| Total | 17 (5.0%) | 27 (38.0%) |
Employment Characteristics in Hayden
Employment by Class of Employer in Hayden
Among the 627 employed individuals in Hayden, private company employees (402 | 64.1%), self-employed (not incorporated) (66 | 10.5%), and local government employees (61 | 9.7%) make up the most common classes of employment.
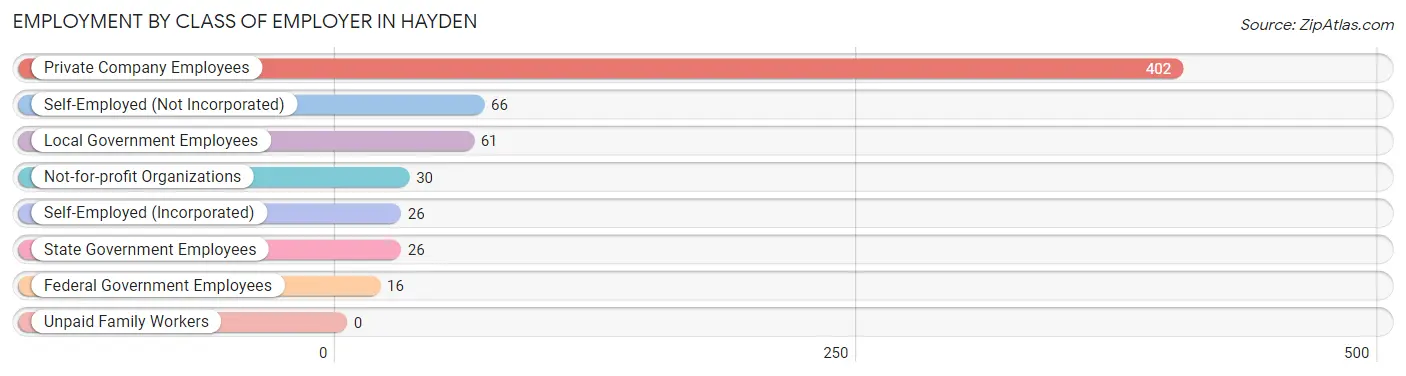
| Employer Class | # Employees | % Employees |
| Private Company Employees | 402 | 64.1% |
| Self-Employed (Incorporated) | 26 | 4.2% |
| Self-Employed (Not Incorporated) | 66 | 10.5% |
| Not-for-profit Organizations | 30 | 4.8% |
| Local Government Employees | 61 | 9.7% |
| State Government Employees | 26 | 4.2% |
| Federal Government Employees | 16 | 2.5% |
| Unpaid Family Workers | 0 | 0.0% |
| Total | 627 | 100.0% |
Employment Status by Age in Hayden
According to the labor force statistics for Hayden, out of the total population over 16 years of age (1,219), 52.7% or 642 individuals are in the labor force, with 2.2% or 14 of them unemployed. The age group with the highest labor force participation rate is 20 to 24 years, with 89.5% or 51 individuals in the labor force. Within the labor force, the 25 to 29 years age range has the highest percentage of unemployed individuals, with 7.1% or 3 of them being unemployed.
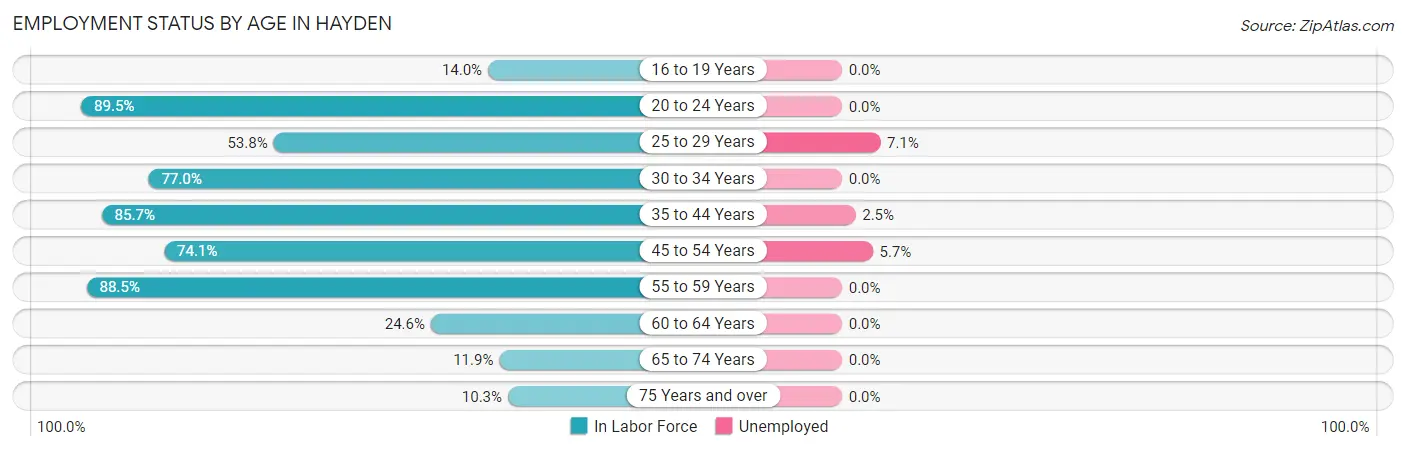
| Age Bracket | In Labor Force | Unemployed |
| 16 to 19 Years | 19 (14.0%) | 0 (0.0%) |
| 20 to 24 Years | 51 (89.5%) | 0 (0.0%) |
| 25 to 29 Years | 42 (53.8%) | 3 (7.1%) |
| 30 to 34 Years | 67 (77.0%) | 0 (0.0%) |
| 35 to 44 Years | 197 (85.7%) | 5 (2.5%) |
| 45 to 54 Years | 106 (74.1%) | 6 (5.7%) |
| 55 to 59 Years | 100 (88.5%) | 0 (0.0%) |
| 60 to 64 Years | 32 (24.6%) | 0 (0.0%) |
| 65 to 74 Years | 21 (11.9%) | 0 (0.0%) |
| 75 Years and over | 7 (10.3%) | 0 (0.0%) |
| Total | 642 (52.7%) | 14 (2.2%) |
Employment Status by Educational Attainment in Hayden
According to labor force statistics for Hayden, 69.7% of individuals (544) out of the total population between 25 and 64 years of age (781) are in the labor force, with 2.6% or 14 of them being unemployed. The group with the highest labor force participation rate are those with the educational attainment of high school diploma, with 81.7% or 188 individuals in the labor force. Within the labor force, individuals with bachelor's degree or higher education have the highest percentage of unemployment, with 6.5% or 6 of them being unemployed.
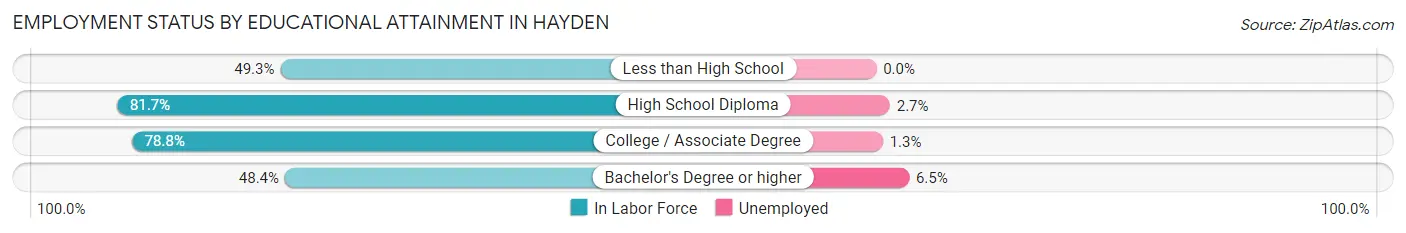
| Educational Attainment | In Labor Force | Unemployed |
| Less than High School | 33 (49.3%) | 0 (0.0%) |
| High School Diploma | 188 (81.7%) | 6 (2.7%) |
| College / Associate Degree | 230 (78.8%) | 4 (1.3%) |
| Bachelor's Degree or higher | 93 (48.4%) | 12 (6.5%) |
| Total | 544 (69.7%) | 20 (2.6%) |
Employment Occupations by Sex in Hayden
Management, Business, Science and Arts Occupations
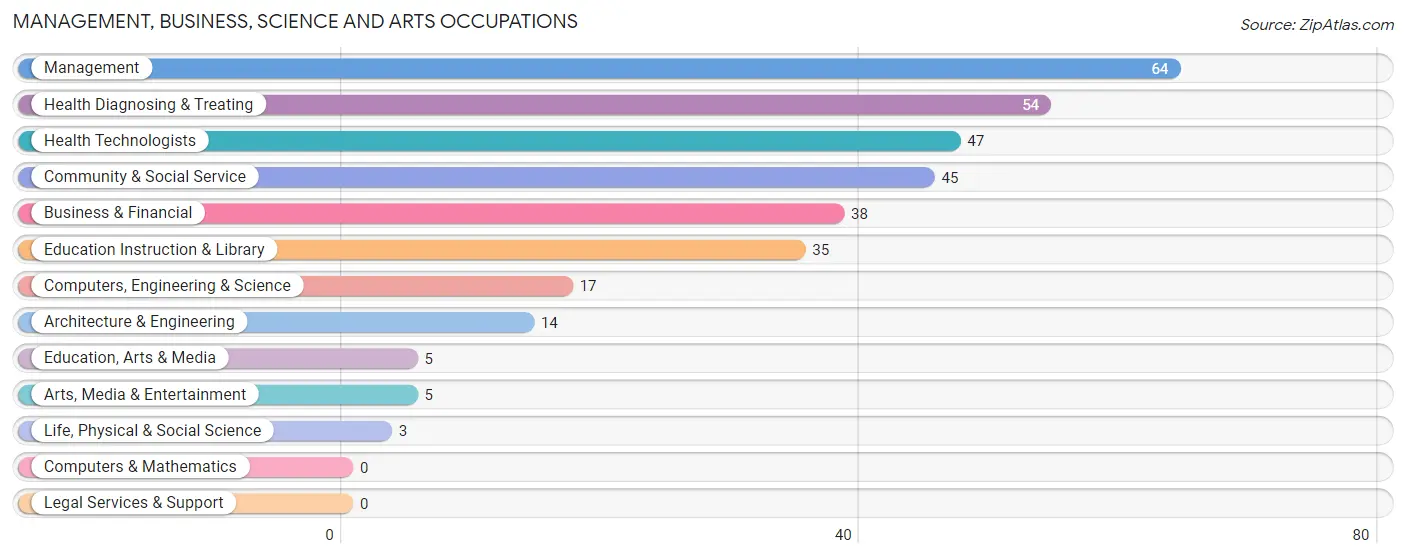
The most common Management, Business, Science and Arts occupations in Hayden are Management (64 | 10.2%), Health Diagnosing & Treating (54 | 8.6%), Health Technologists (47 | 7.5%), Community & Social Service (45 | 7.2%), and Business & Financial (38 | 6.0%).
Management, Business, Science and Arts Occupations by Sex
Within the Management, Business, Science and Arts occupations in Hayden, the most male-oriented occupations are Computers, Engineering & Science (100.0%), Architecture & Engineering (100.0%), and Life, Physical & Social Science (100.0%), while the most female-oriented occupations are Education, Arts & Media (100.0%), Arts, Media & Entertainment (100.0%), and Community & Social Service (95.6%).
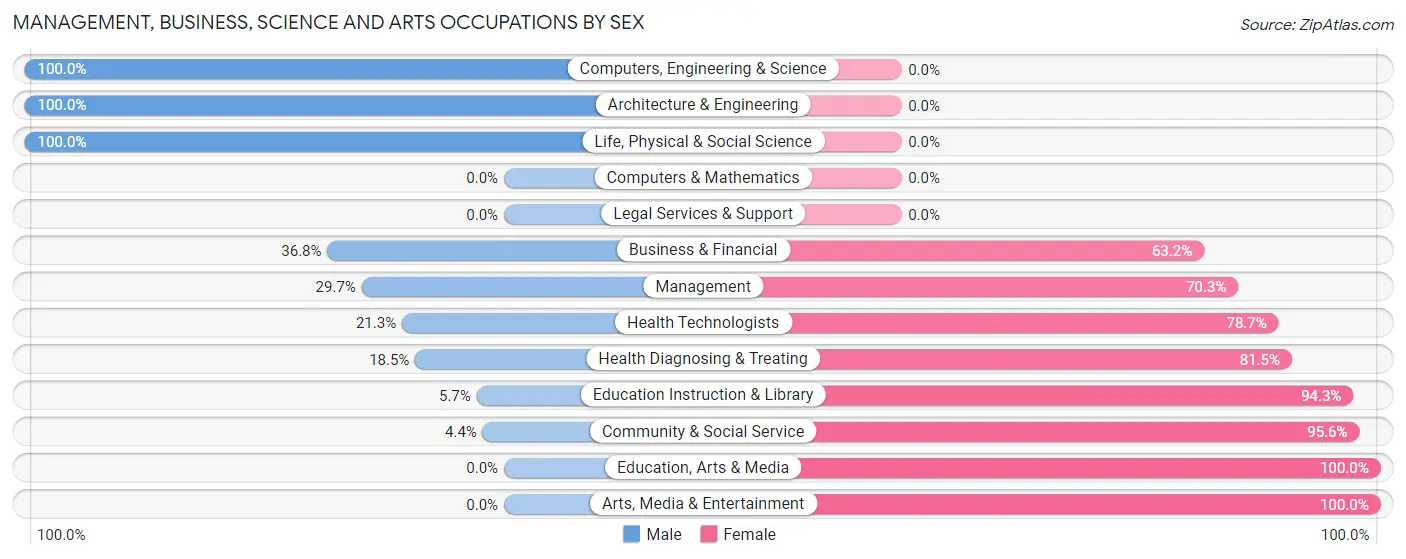
| Occupation | Male | Female |
| Management | 19 (29.7%) | 45 (70.3%) |
| Business & Financial | 14 (36.8%) | 24 (63.2%) |
| Computers, Engineering & Science | 17 (100.0%) | 0 (0.0%) |
| Computers & Mathematics | 0 (0.0%) | 0 (0.0%) |
| Architecture & Engineering | 14 (100.0%) | 0 (0.0%) |
| Life, Physical & Social Science | 3 (100.0%) | 0 (0.0%) |
| Community & Social Service | 2 (4.4%) | 43 (95.6%) |
| Education, Arts & Media | 0 (0.0%) | 5 (100.0%) |
| Legal Services & Support | 0 (0.0%) | 0 (0.0%) |
| Education Instruction & Library | 2 (5.7%) | 33 (94.3%) |
| Arts, Media & Entertainment | 0 (0.0%) | 5 (100.0%) |
| Health Diagnosing & Treating | 10 (18.5%) | 44 (81.5%) |
| Health Technologists | 10 (21.3%) | 37 (78.7%) |
| Total (Category) | 62 (28.4%) | 156 (71.6%) |
| Total (Overall) | 277 (44.1%) | 351 (55.9%) |
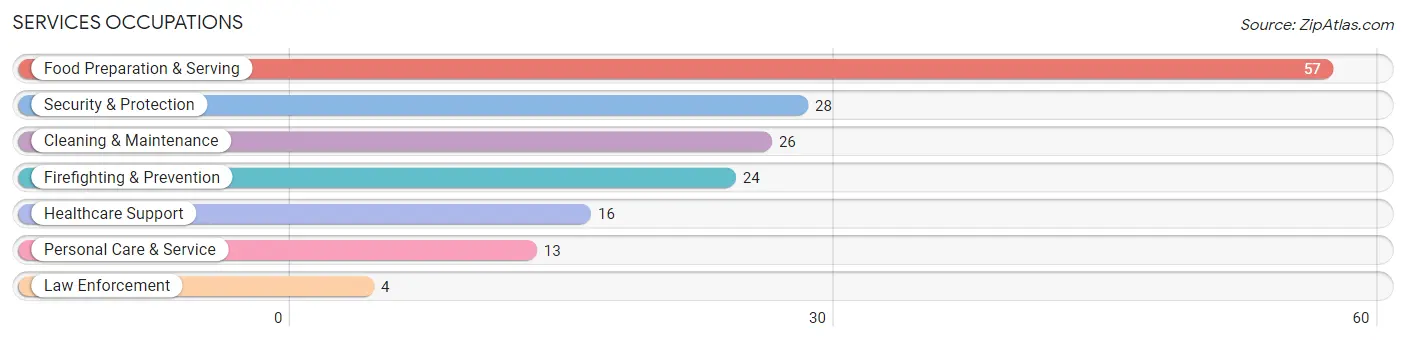
Services Occupations
The most common Services occupations in Hayden are Food Preparation & Serving (57 | 9.1%), Security & Protection (28 | 4.5%), Cleaning & Maintenance (26 | 4.1%), Firefighting & Prevention (24 | 3.8%), and Healthcare Support (16 | 2.5%).
Services Occupations by Sex
Within the Services occupations in Hayden, the most male-oriented occupations are Law Enforcement (100.0%), Security & Protection (85.7%), and Firefighting & Prevention (83.3%), while the most female-oriented occupations are Healthcare Support (100.0%), Personal Care & Service (69.2%), and Food Preparation & Serving (59.7%).
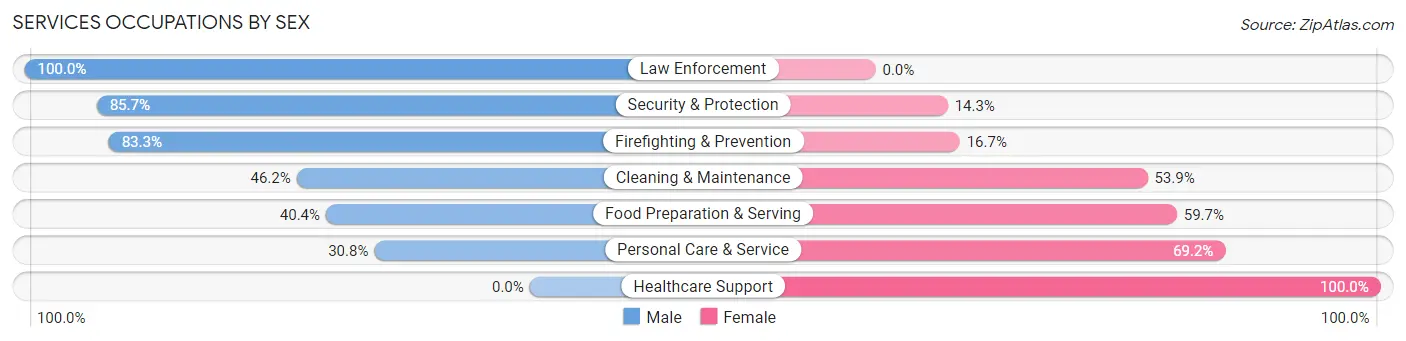
| Occupation | Male | Female |
| Healthcare Support | 0 (0.0%) | 16 (100.0%) |
| Security & Protection | 24 (85.7%) | 4 (14.3%) |
| Firefighting & Prevention | 20 (83.3%) | 4 (16.7%) |
| Law Enforcement | 4 (100.0%) | 0 (0.0%) |
| Food Preparation & Serving | 23 (40.4%) | 34 (59.7%) |
| Cleaning & Maintenance | 12 (46.2%) | 14 (53.8%) |
| Personal Care & Service | 4 (30.8%) | 9 (69.2%) |
| Total (Category) | 63 (45.0%) | 77 (55.0%) |
| Total (Overall) | 277 (44.1%) | 351 (55.9%) |
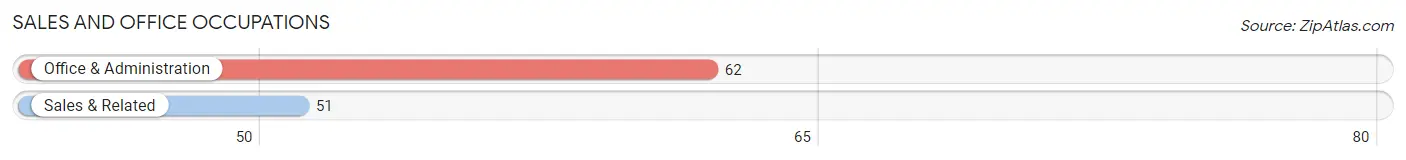
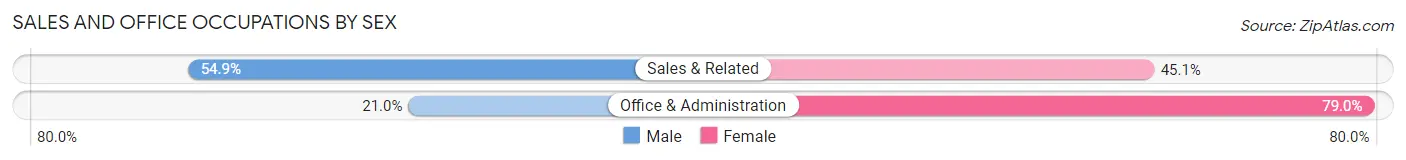
Sales and Office Occupations
The most common Sales and Office occupations in Hayden are Office & Administration (62 | 9.9%), and Sales & Related (51 | 8.1%).
Sales and Office Occupations by Sex
| Occupation | Male | Female |
| Sales & Related | 28 (54.9%) | 23 (45.1%) |
| Office & Administration | 13 (21.0%) | 49 (79.0%) |
| Total (Category) | 41 (36.3%) | 72 (63.7%) |
| Total (Overall) | 277 (44.1%) | 351 (55.9%) |
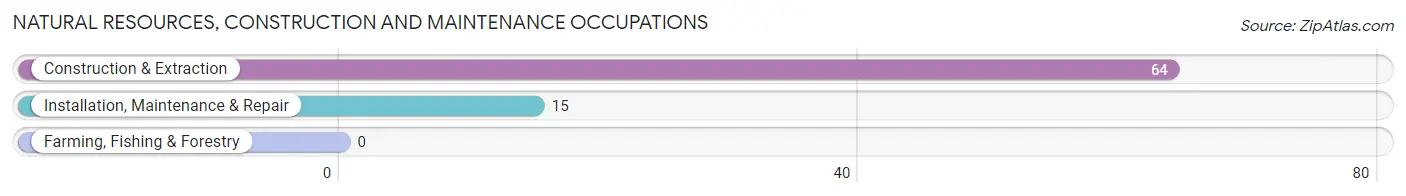
Natural Resources, Construction and Maintenance Occupations
The most common Natural Resources, Construction and Maintenance occupations in Hayden are Construction & Extraction (64 | 10.2%), and Installation, Maintenance & Repair (15 | 2.4%).
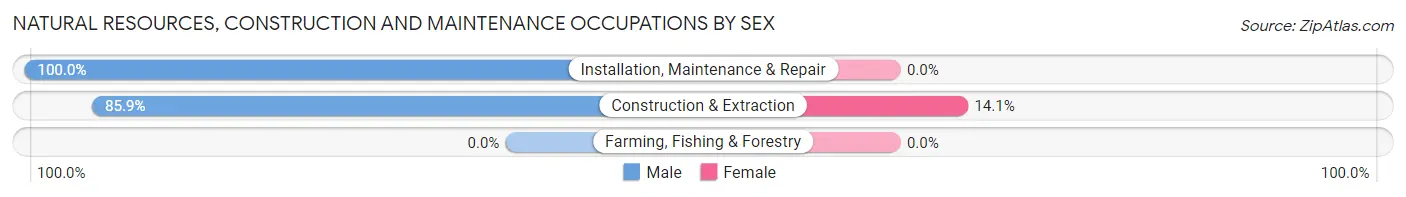
Natural Resources, Construction and Maintenance Occupations by Sex
| Occupation | Male | Female |
| Farming, Fishing & Forestry | 0 (0.0%) | 0 (0.0%) |
| Construction & Extraction | 55 (85.9%) | 9 (14.1%) |
| Installation, Maintenance & Repair | 15 (100.0%) | 0 (0.0%) |
| Total (Category) | 70 (88.6%) | 9 (11.4%) |
| Total (Overall) | 277 (44.1%) | 351 (55.9%) |
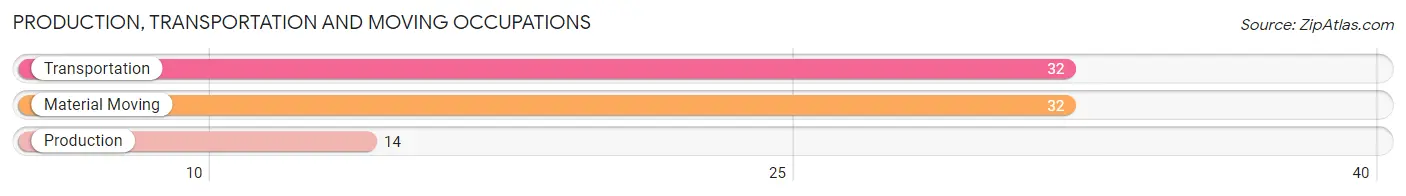
Production, Transportation and Moving Occupations
The most common Production, Transportation and Moving occupations in Hayden are Transportation (32 | 5.1%), Material Moving (32 | 5.1%), and Production (14 | 2.2%).
Production, Transportation and Moving Occupations by Sex
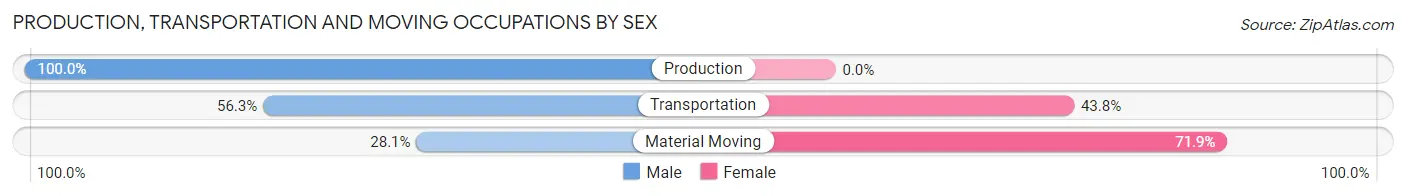
| Occupation | Male | Female |
| Production | 14 (100.0%) | 0 (0.0%) |
| Transportation | 18 (56.2%) | 14 (43.8%) |
| Material Moving | 9 (28.1%) | 23 (71.9%) |
| Total (Category) | 41 (52.6%) | 37 (47.4%) |
| Total (Overall) | 277 (44.1%) | 351 (55.9%) |
Employment Industries by Sex in Hayden
Employment Industries in Hayden
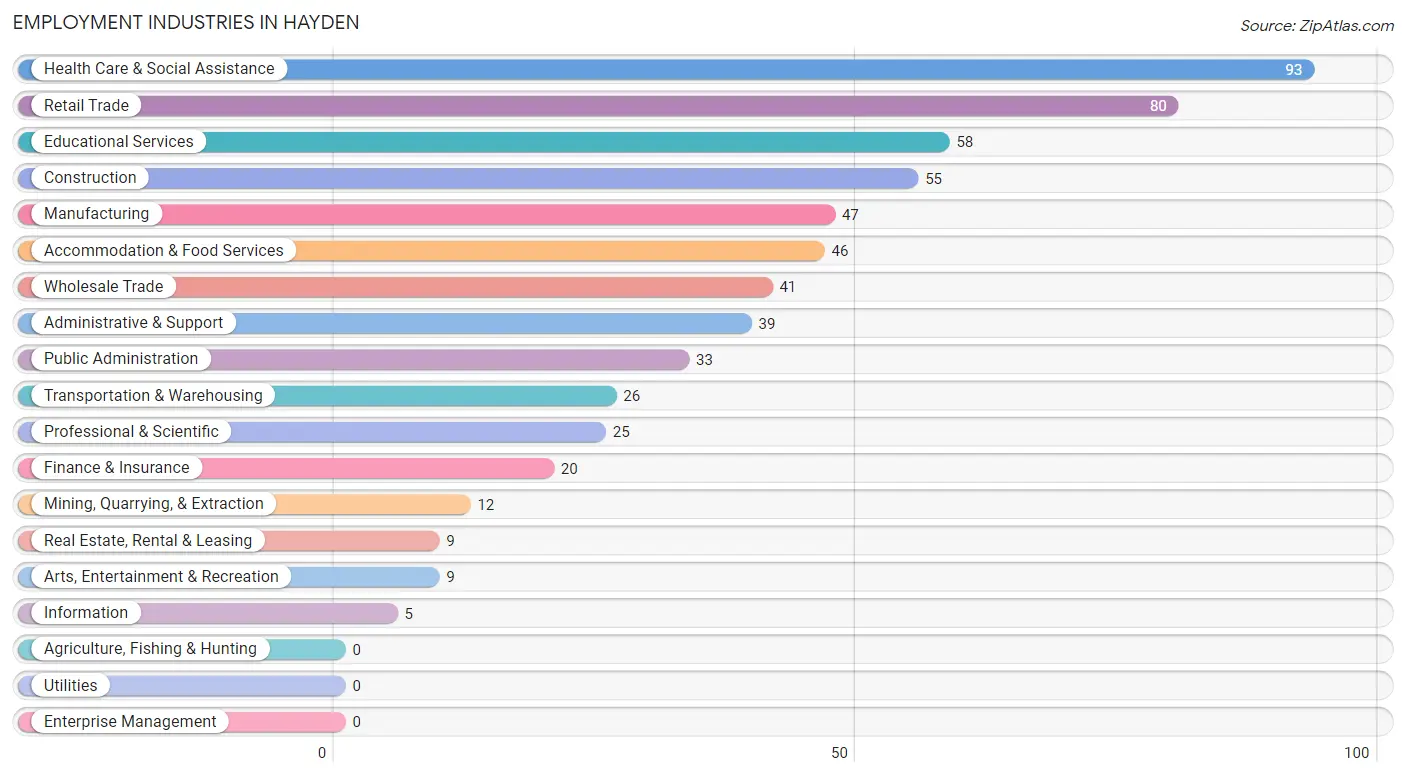
The major employment industries in Hayden include Health Care & Social Assistance (93 | 14.8%), Retail Trade (80 | 12.7%), Educational Services (58 | 9.2%), Construction (55 | 8.8%), and Manufacturing (47 | 7.5%).
Employment Industries by Sex in Hayden
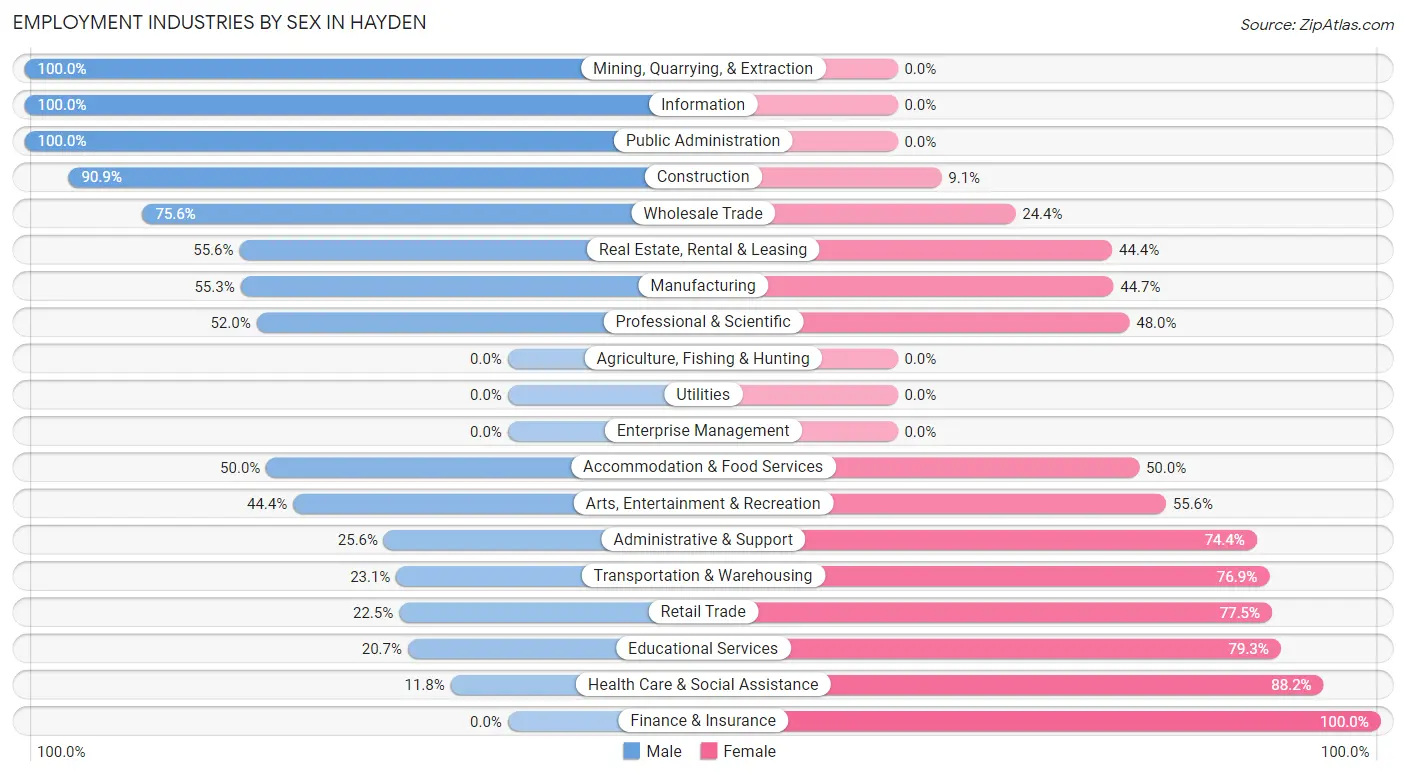
The Hayden industries that see more men than women are Mining, Quarrying, & Extraction (100.0%), Information (100.0%), and Public Administration (100.0%), whereas the industries that tend to have a higher number of women are Finance & Insurance (100.0%), Health Care & Social Assistance (88.2%), and Educational Services (79.3%).
| Industry | Male | Female |
| Agriculture, Fishing & Hunting | 0 (0.0%) | 0 (0.0%) |
| Mining, Quarrying, & Extraction | 12 (100.0%) | 0 (0.0%) |
| Construction | 50 (90.9%) | 5 (9.1%) |
| Manufacturing | 26 (55.3%) | 21 (44.7%) |
| Wholesale Trade | 31 (75.6%) | 10 (24.4%) |
| Retail Trade | 18 (22.5%) | 62 (77.5%) |
| Transportation & Warehousing | 6 (23.1%) | 20 (76.9%) |
| Utilities | 0 (0.0%) | 0 (0.0%) |
| Information | 5 (100.0%) | 0 (0.0%) |
| Finance & Insurance | 0 (0.0%) | 20 (100.0%) |
| Real Estate, Rental & Leasing | 5 (55.6%) | 4 (44.4%) |
| Professional & Scientific | 13 (52.0%) | 12 (48.0%) |
| Enterprise Management | 0 (0.0%) | 0 (0.0%) |
| Administrative & Support | 10 (25.6%) | 29 (74.4%) |
| Educational Services | 12 (20.7%) | 46 (79.3%) |
| Health Care & Social Assistance | 11 (11.8%) | 82 (88.2%) |
| Arts, Entertainment & Recreation | 4 (44.4%) | 5 (55.6%) |
| Accommodation & Food Services | 23 (50.0%) | 23 (50.0%) |
| Public Administration | 33 (100.0%) | 0 (0.0%) |
| Total | 277 (44.1%) | 351 (55.9%) |
Education in Hayden
School Enrollment in Hayden
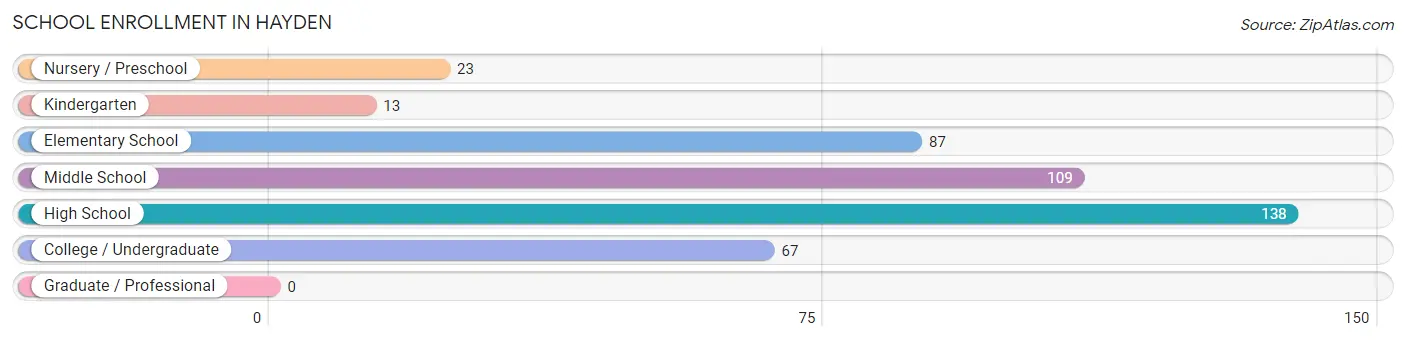
The most common levels of schooling among the 437 students in Hayden are high school (138 | 31.6%), middle school (109 | 24.9%), and elementary school (87 | 19.9%).
| School Level | # Students | % Students |
| Nursery / Preschool | 23 | 5.3% |
| Kindergarten | 13 | 3.0% |
| Elementary School | 87 | 19.9% |
| Middle School | 109 | 24.9% |
| High School | 138 | 31.6% |
| College / Undergraduate | 67 | 15.3% |
| Graduate / Professional | 0 | 0.0% |
| Total | 437 | 100.0% |
School Enrollment by Age by Funding Source in Hayden
Out of a total of 437 students who are enrolled in schools in Hayden, 91 (20.8%) attend a private institution, while the remaining 346 (79.2%) are enrolled in public schools. The age group of 20 to 24 year olds has the highest likelihood of being enrolled in private schools, with 12 (50.0% in the age bracket) enrolled. Conversely, the age group of 35 years and over has the lowest likelihood of being enrolled in a private school, with 18 (100.0% in the age bracket) attending a public institution.
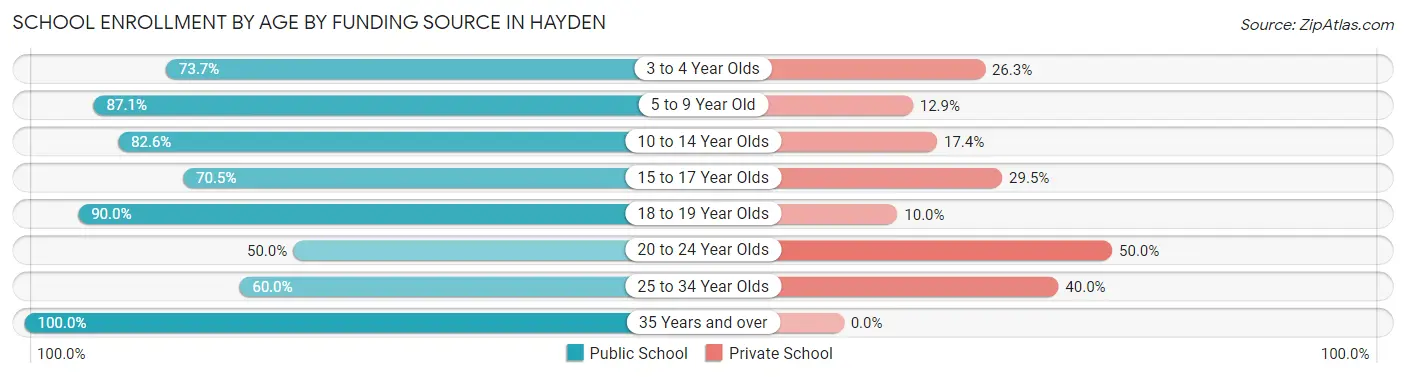
| Age Bracket | Public School | Private School |
| 3 to 4 Year Olds | 14 (73.7%) | 5 (26.3%) |
| 5 to 9 Year Old | 88 (87.1%) | 13 (12.9%) |
| 10 to 14 Year Olds | 95 (82.6%) | 20 (17.4%) |
| 15 to 17 Year Olds | 74 (70.5%) | 31 (29.5%) |
| 18 to 19 Year Olds | 36 (90.0%) | 4 (10.0%) |
| 20 to 24 Year Olds | 12 (50.0%) | 12 (50.0%) |
| 25 to 34 Year Olds | 9 (60.0%) | 6 (40.0%) |
| 35 Years and over | 18 (100.0%) | 0 (0.0%) |
| Total | 346 (79.2%) | 91 (20.8%) |
Educational Attainment by Field of Study in Hayden
Science & technology (105 | 43.4%), business (29 | 12.0%), education (26 | 10.7%), psychology (22 | 9.1%), and arts & humanities (17 | 7.0%) are the most common fields of study among 242 individuals in Hayden who have obtained a bachelor's degree or higher.
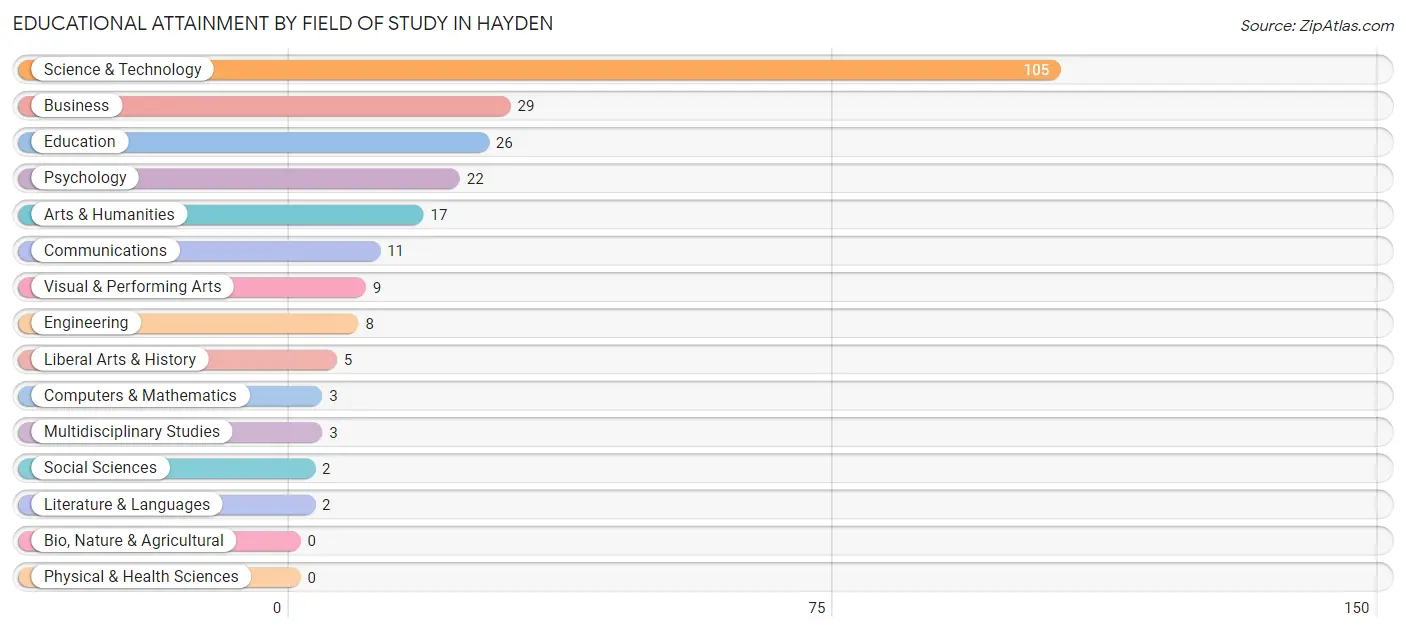
| Field of Study | # Graduates | % Graduates |
| Computers & Mathematics | 3 | 1.2% |
| Bio, Nature & Agricultural | 0 | 0.0% |
| Physical & Health Sciences | 0 | 0.0% |
| Psychology | 22 | 9.1% |
| Social Sciences | 2 | 0.8% |
| Engineering | 8 | 3.3% |
| Multidisciplinary Studies | 3 | 1.2% |
| Science & Technology | 105 | 43.4% |
| Business | 29 | 12.0% |
| Education | 26 | 10.7% |
| Literature & Languages | 2 | 0.8% |
| Liberal Arts & History | 5 | 2.1% |
| Visual & Performing Arts | 9 | 3.7% |
| Communications | 11 | 4.5% |
| Arts & Humanities | 17 | 7.0% |
| Total | 242 | 100.0% |
Transportation & Commute in Hayden
Vehicle Availability by Sex in Hayden
The most prevalent vehicle ownership categories in Hayden are males with 3 vehicles (107, accounting for 38.8%) and females with 3 vehicles (122, making up 30.5%).
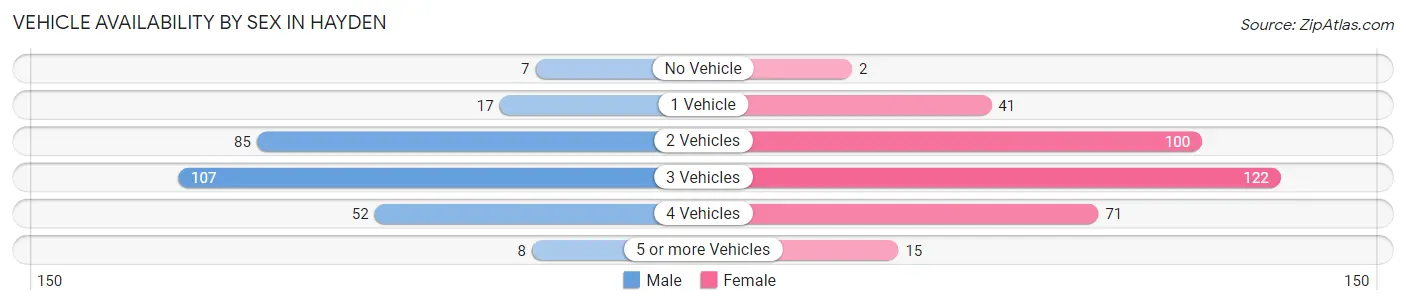
| Vehicles Available | Male | Female |
| No Vehicle | 7 (2.5%) | 2 (0.6%) |
| 1 Vehicle | 17 (6.2%) | 41 (11.7%) |
| 2 Vehicles | 85 (30.8%) | 100 (28.5%) |
| 3 Vehicles | 107 (38.8%) | 122 (34.8%) |
| 4 Vehicles | 52 (18.8%) | 71 (20.2%) |
| 5 or more Vehicles | 8 (2.9%) | 15 (4.3%) |
| Total | 276 (100.0%) | 351 (100.0%) |
Commute Time in Hayden
The most frequently occuring commute durations in Hayden are 45 to 59 minutes (114 commuters, 19.9%), 30 to 34 minutes (90 commuters, 15.7%), and 35 to 39 minutes (78 commuters, 13.6%).
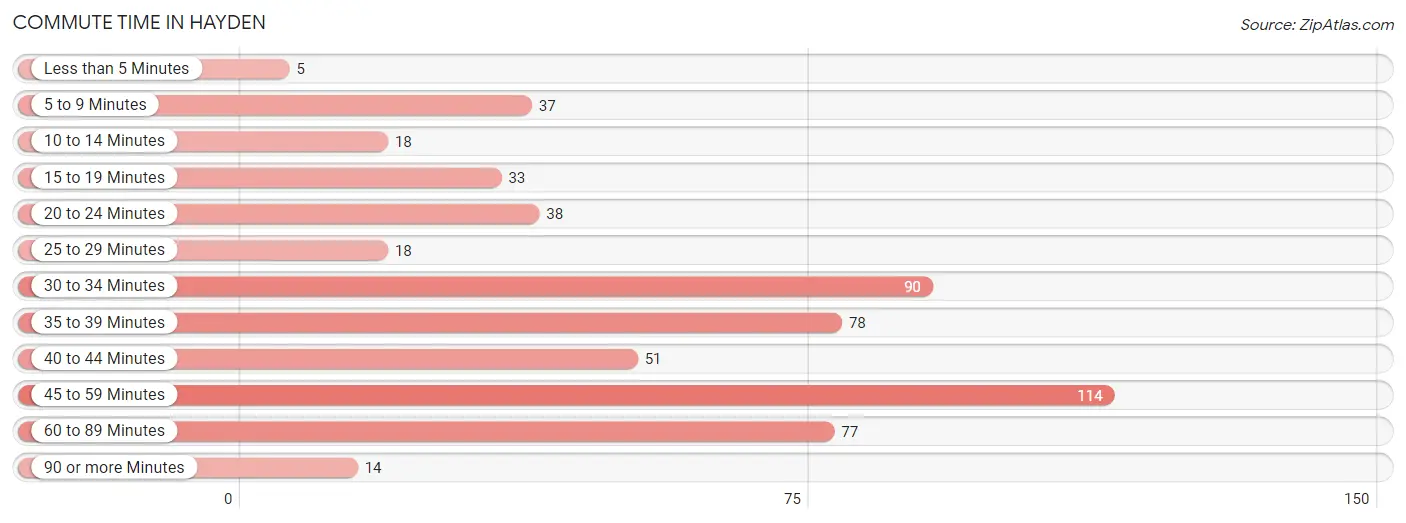
| Commute Time | # Commuters | % Commuters |
| Less than 5 Minutes | 5 | 0.9% |
| 5 to 9 Minutes | 37 | 6.5% |
| 10 to 14 Minutes | 18 | 3.1% |
| 15 to 19 Minutes | 33 | 5.8% |
| 20 to 24 Minutes | 38 | 6.6% |
| 25 to 29 Minutes | 18 | 3.1% |
| 30 to 34 Minutes | 90 | 15.7% |
| 35 to 39 Minutes | 78 | 13.6% |
| 40 to 44 Minutes | 51 | 8.9% |
| 45 to 59 Minutes | 114 | 19.9% |
| 60 to 89 Minutes | 77 | 13.4% |
| 90 or more Minutes | 14 | 2.4% |
Commute Time by Sex in Hayden
The most common commute times in Hayden are 45 to 59 minutes (69 commuters, 27.1%) for males and 30 to 34 minutes (46 commuters, 14.5%) for females.
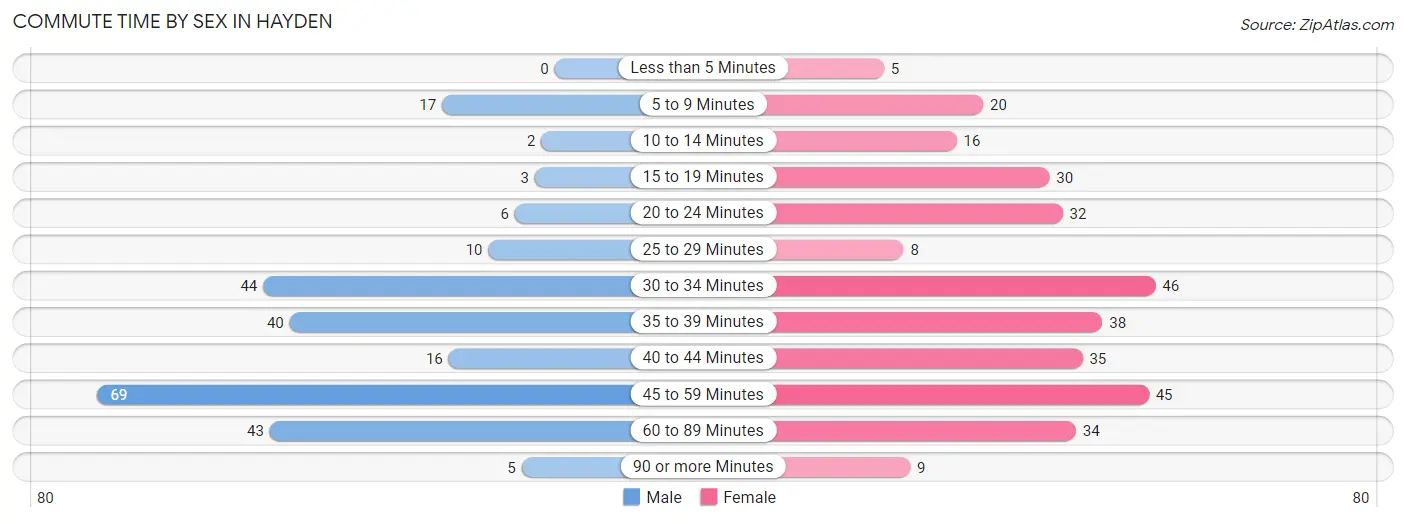
| Commute Time | Male | Female |
| Less than 5 Minutes | 0 (0.0%) | 5 (1.6%) |
| 5 to 9 Minutes | 17 (6.7%) | 20 (6.3%) |
| 10 to 14 Minutes | 2 (0.8%) | 16 (5.0%) |
| 15 to 19 Minutes | 3 (1.2%) | 30 (9.4%) |
| 20 to 24 Minutes | 6 (2.4%) | 32 (10.1%) |
| 25 to 29 Minutes | 10 (3.9%) | 8 (2.5%) |
| 30 to 34 Minutes | 44 (17.2%) | 46 (14.5%) |
| 35 to 39 Minutes | 40 (15.7%) | 38 (11.9%) |
| 40 to 44 Minutes | 16 (6.3%) | 35 (11.0%) |
| 45 to 59 Minutes | 69 (27.1%) | 45 (14.1%) |
| 60 to 89 Minutes | 43 (16.9%) | 34 (10.7%) |
| 90 or more Minutes | 5 (2.0%) | 9 (2.8%) |
Time of Departure to Work by Sex in Hayden
The most frequent times of departure to work in Hayden are 7:00 AM to 7:29 AM (49, 19.2%) for males and 7:00 AM to 7:29 AM (92, 28.9%) for females.
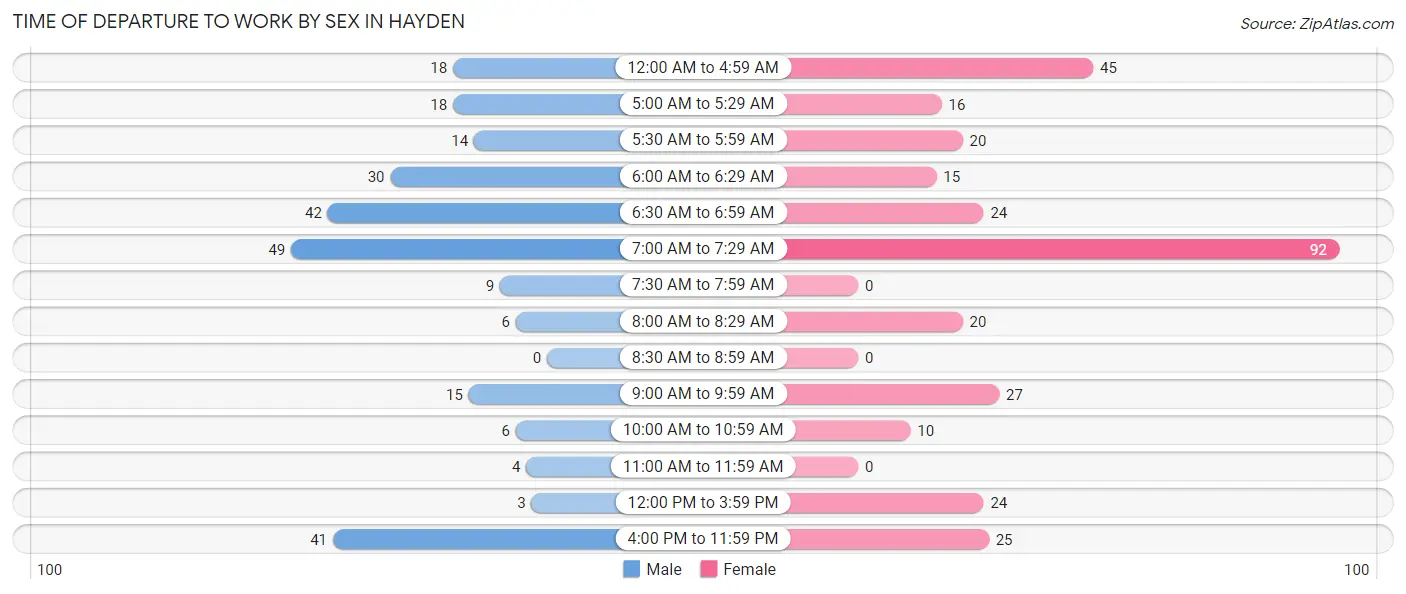
| Time of Departure | Male | Female |
| 12:00 AM to 4:59 AM | 18 (7.1%) | 45 (14.1%) |
| 5:00 AM to 5:29 AM | 18 (7.1%) | 16 (5.0%) |
| 5:30 AM to 5:59 AM | 14 (5.5%) | 20 (6.3%) |
| 6:00 AM to 6:29 AM | 30 (11.8%) | 15 (4.7%) |
| 6:30 AM to 6:59 AM | 42 (16.5%) | 24 (7.5%) |
| 7:00 AM to 7:29 AM | 49 (19.2%) | 92 (28.9%) |
| 7:30 AM to 7:59 AM | 9 (3.5%) | 0 (0.0%) |
| 8:00 AM to 8:29 AM | 6 (2.4%) | 20 (6.3%) |
| 8:30 AM to 8:59 AM | 0 (0.0%) | 0 (0.0%) |
| 9:00 AM to 9:59 AM | 15 (5.9%) | 27 (8.5%) |
| 10:00 AM to 10:59 AM | 6 (2.4%) | 10 (3.1%) |
| 11:00 AM to 11:59 AM | 4 (1.6%) | 0 (0.0%) |
| 12:00 PM to 3:59 PM | 3 (1.2%) | 24 (7.5%) |
| 4:00 PM to 11:59 PM | 41 (16.1%) | 25 (7.9%) |
| Total | 255 (100.0%) | 318 (100.0%) |
Housing Occupancy in Hayden
Occupancy by Ownership in Hayden
Of the total 541 dwellings in Hayden, owner-occupied units account for 494 (91.3%), while renter-occupied units make up 47 (8.7%).
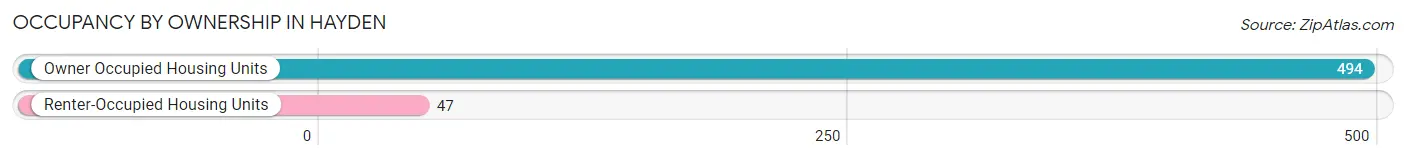
| Occupancy | # Housing Units | % Housing Units |
| Owner Occupied Housing Units | 494 | 91.3% |
| Renter-Occupied Housing Units | 47 | 8.7% |
| Total Occupied Housing Units | 541 | 100.0% |
Occupancy by Household Size in Hayden
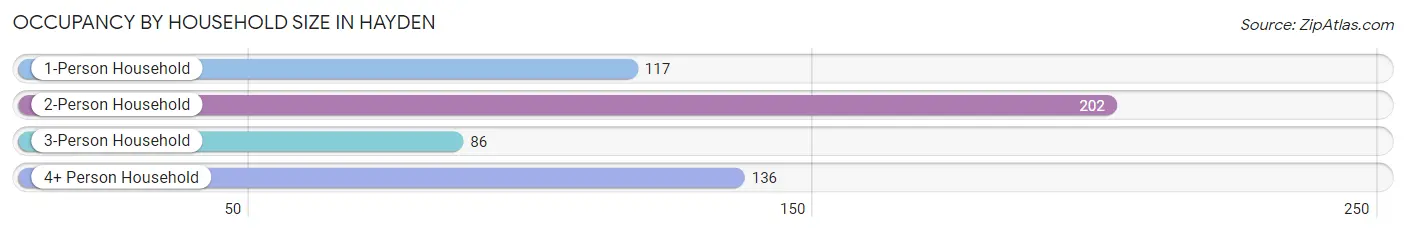
| Household Size | # Housing Units | % Housing Units |
| 1-Person Household | 117 | 21.6% |
| 2-Person Household | 202 | 37.3% |
| 3-Person Household | 86 | 15.9% |
| 4+ Person Household | 136 | 25.1% |
| Total Housing Units | 541 | 100.0% |
Occupancy by Ownership by Household Size in Hayden
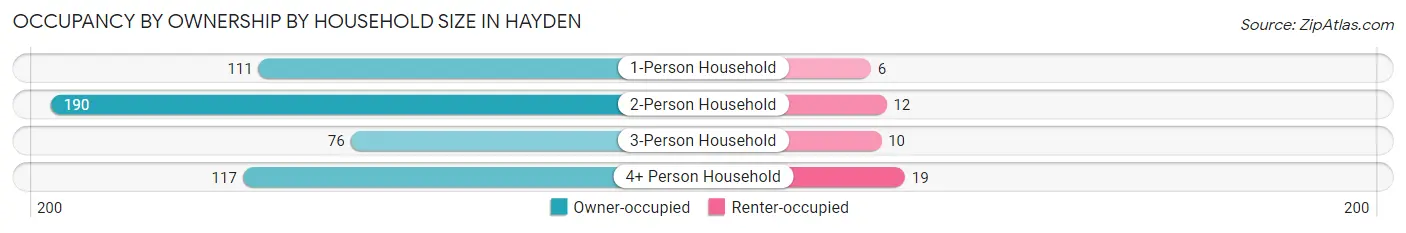
| Household Size | Owner-occupied | Renter-occupied |
| 1-Person Household | 111 (94.9%) | 6 (5.1%) |
| 2-Person Household | 190 (94.1%) | 12 (5.9%) |
| 3-Person Household | 76 (88.4%) | 10 (11.6%) |
| 4+ Person Household | 117 (86.0%) | 19 (14.0%) |
| Total Housing Units | 494 (91.3%) | 47 (8.7%) |
Occupancy by Educational Attainment in Hayden
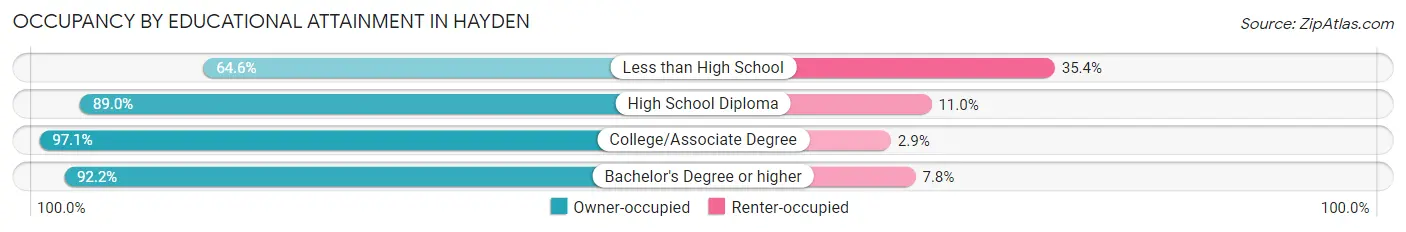
| Household Size | Owner-occupied | Renter-occupied |
| Less than High School | 31 (64.6%) | 17 (35.4%) |
| High School Diploma | 138 (89.0%) | 17 (11.0%) |
| College/Associate Degree | 266 (97.1%) | 8 (2.9%) |
| Bachelor's Degree or higher | 59 (92.2%) | 5 (7.8%) |
Occupancy by Age of Householder in Hayden
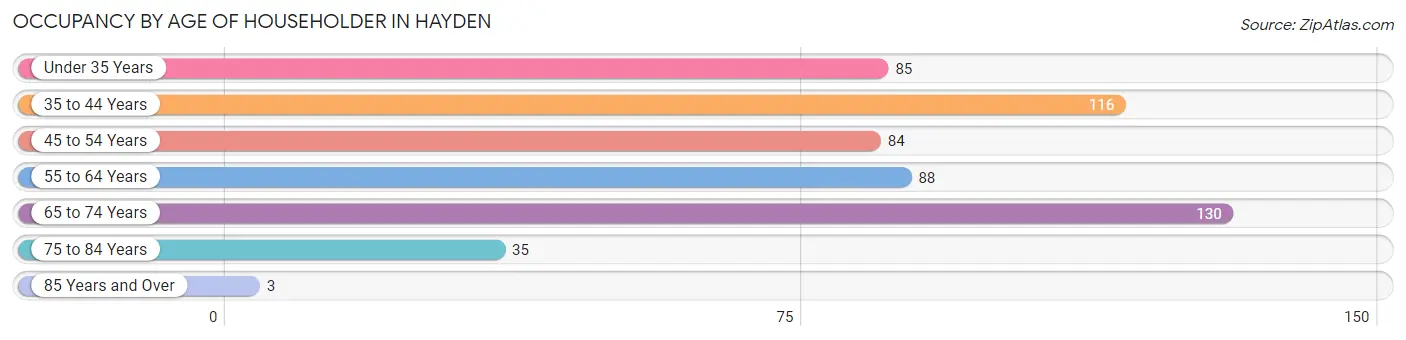
| Age Bracket | # Households | % Households |
| Under 35 Years | 85 | 15.7% |
| 35 to 44 Years | 116 | 21.4% |
| 45 to 54 Years | 84 | 15.5% |
| 55 to 64 Years | 88 | 16.3% |
| 65 to 74 Years | 130 | 24.0% |
| 75 to 84 Years | 35 | 6.5% |
| 85 Years and Over | 3 | 0.5% |
| Total | 541 | 100.0% |
Housing Finances in Hayden
Median Income by Occupancy in Hayden
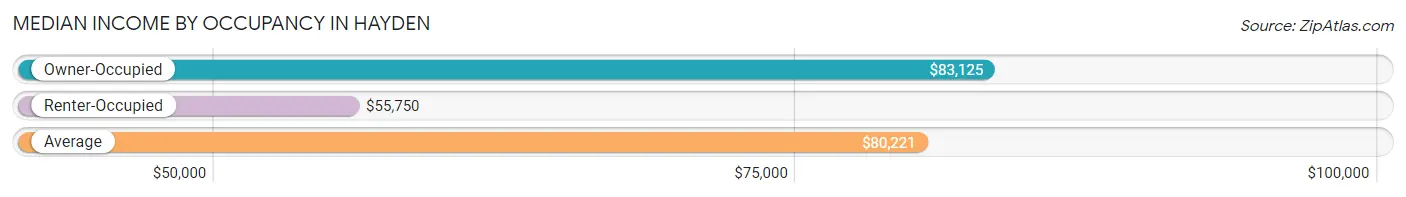
| Occupancy Type | # Households | Median Income |
| Owner-Occupied | 494 (91.3%) | $83,125 |
| Renter-Occupied | 47 (8.7%) | $55,750 |
| Average | 541 (100.0%) | $80,221 |
Occupancy by Householder Income Bracket in Hayden
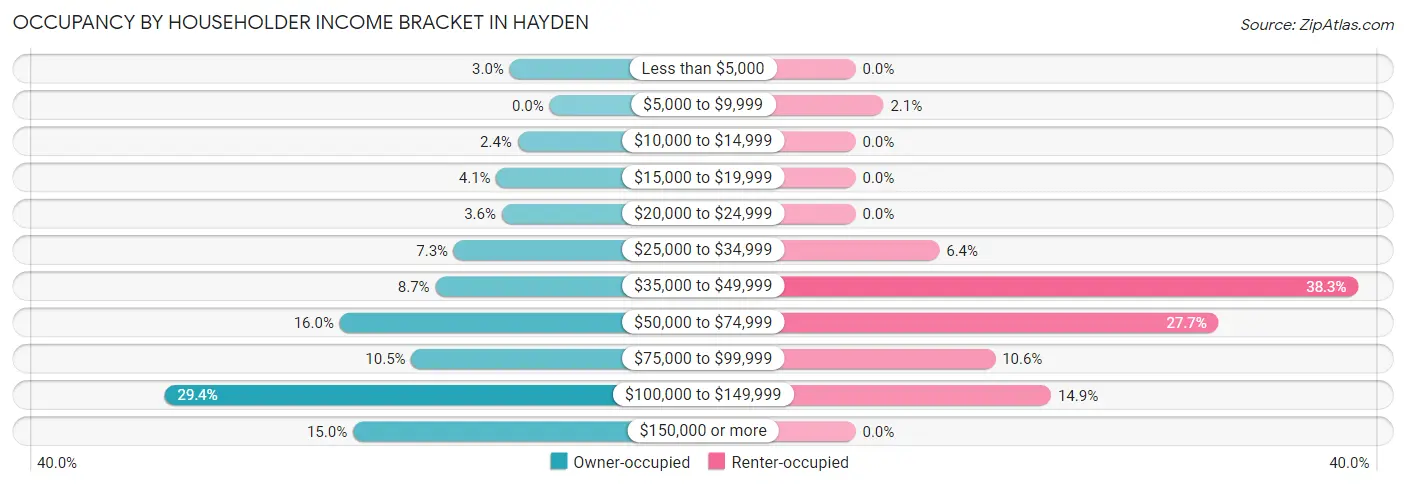
| Income Bracket | Owner-occupied | Renter-occupied |
| Less than $5,000 | 15 (3.0%) | 0 (0.0%) |
| $5,000 to $9,999 | 0 (0.0%) | 1 (2.1%) |
| $10,000 to $14,999 | 12 (2.4%) | 0 (0.0%) |
| $15,000 to $19,999 | 20 (4.1%) | 0 (0.0%) |
| $20,000 to $24,999 | 18 (3.6%) | 0 (0.0%) |
| $25,000 to $34,999 | 36 (7.3%) | 3 (6.4%) |
| $35,000 to $49,999 | 43 (8.7%) | 18 (38.3%) |
| $50,000 to $74,999 | 79 (16.0%) | 13 (27.7%) |
| $75,000 to $99,999 | 52 (10.5%) | 5 (10.6%) |
| $100,000 to $149,999 | 145 (29.3%) | 7 (14.9%) |
| $150,000 or more | 74 (15.0%) | 0 (0.0%) |
| Total | 494 (100.0%) | 47 (100.0%) |
Monthly Housing Cost Tiers in Hayden
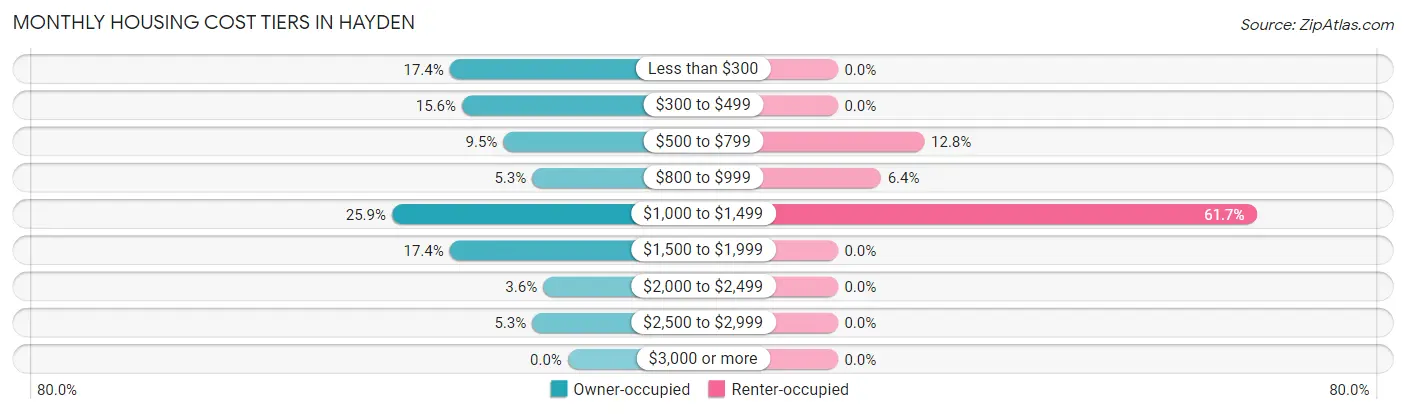
| Monthly Cost | Owner-occupied | Renter-occupied |
| Less than $300 | 86 (17.4%) | 0 (0.0%) |
| $300 to $499 | 77 (15.6%) | 0 (0.0%) |
| $500 to $799 | 47 (9.5%) | 6 (12.8%) |
| $800 to $999 | 26 (5.3%) | 3 (6.4%) |
| $1,000 to $1,499 | 128 (25.9%) | 29 (61.7%) |
| $1,500 to $1,999 | 86 (17.4%) | 0 (0.0%) |
| $2,000 to $2,499 | 18 (3.6%) | 0 (0.0%) |
| $2,500 to $2,999 | 26 (5.3%) | 0 (0.0%) |
| $3,000 or more | 0 (0.0%) | 0 (0.0%) |
| Total | 494 (100.0%) | 47 (100.0%) |
Physical Housing Characteristics in Hayden
Housing Structures in Hayden
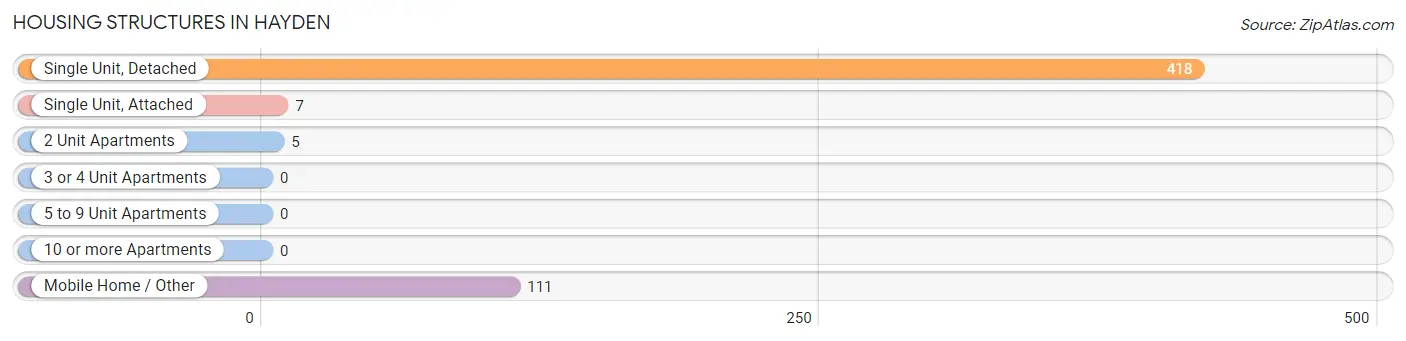
| Structure Type | # Housing Units | % Housing Units |
| Single Unit, Detached | 418 | 77.3% |
| Single Unit, Attached | 7 | 1.3% |
| 2 Unit Apartments | 5 | 0.9% |
| 3 or 4 Unit Apartments | 0 | 0.0% |
| 5 to 9 Unit Apartments | 0 | 0.0% |
| 10 or more Apartments | 0 | 0.0% |
| Mobile Home / Other | 111 | 20.5% |
| Total | 541 | 100.0% |
Housing Structures by Occupancy in Hayden
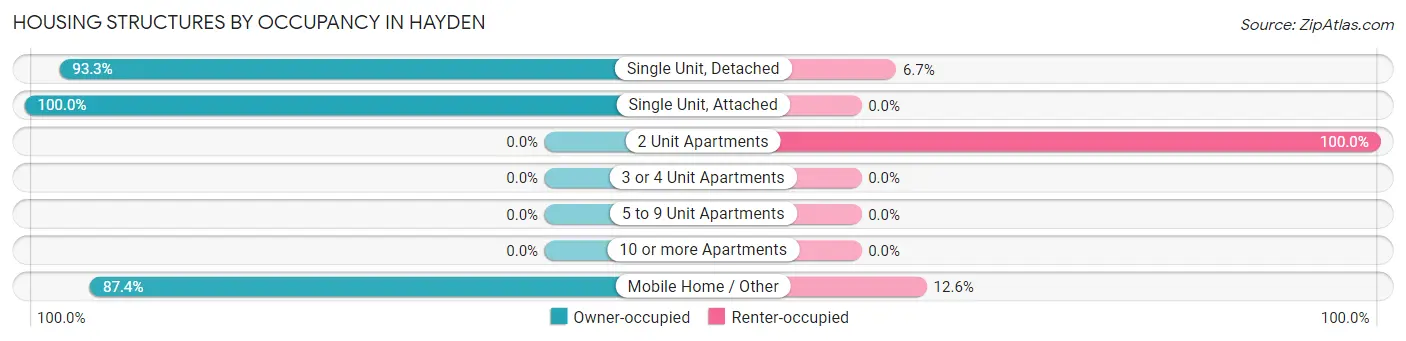
| Structure Type | Owner-occupied | Renter-occupied |
| Single Unit, Detached | 390 (93.3%) | 28 (6.7%) |
| Single Unit, Attached | 7 (100.0%) | 0 (0.0%) |
| 2 Unit Apartments | 0 (0.0%) | 5 (100.0%) |
| 3 or 4 Unit Apartments | 0 (0.0%) | 0 (0.0%) |
| 5 to 9 Unit Apartments | 0 (0.0%) | 0 (0.0%) |
| 10 or more Apartments | 0 (0.0%) | 0 (0.0%) |
| Mobile Home / Other | 97 (87.4%) | 14 (12.6%) |
| Total | 494 (91.3%) | 47 (8.7%) |
Housing Structures by Number of Rooms in Hayden
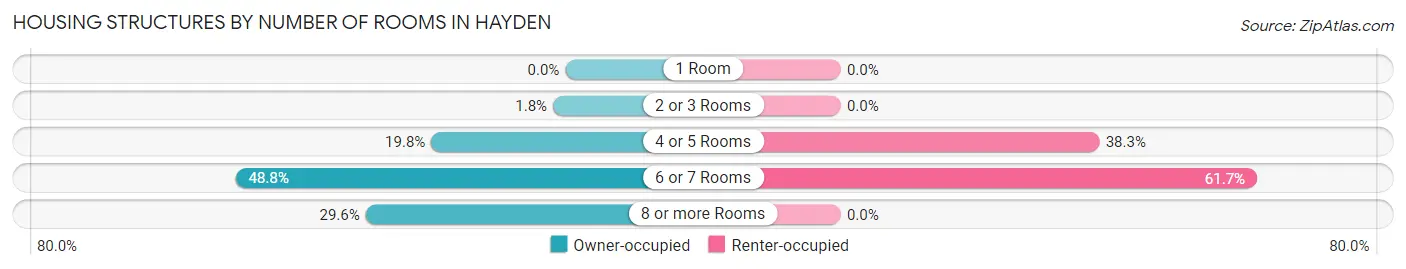
| Number of Rooms | Owner-occupied | Renter-occupied |
| 1 Room | 0 (0.0%) | 0 (0.0%) |
| 2 or 3 Rooms | 9 (1.8%) | 0 (0.0%) |
| 4 or 5 Rooms | 98 (19.8%) | 18 (38.3%) |
| 6 or 7 Rooms | 241 (48.8%) | 29 (61.7%) |
| 8 or more Rooms | 146 (29.5%) | 0 (0.0%) |
| Total | 494 (100.0%) | 47 (100.0%) |
Housing Structure by Heating Type in Hayden
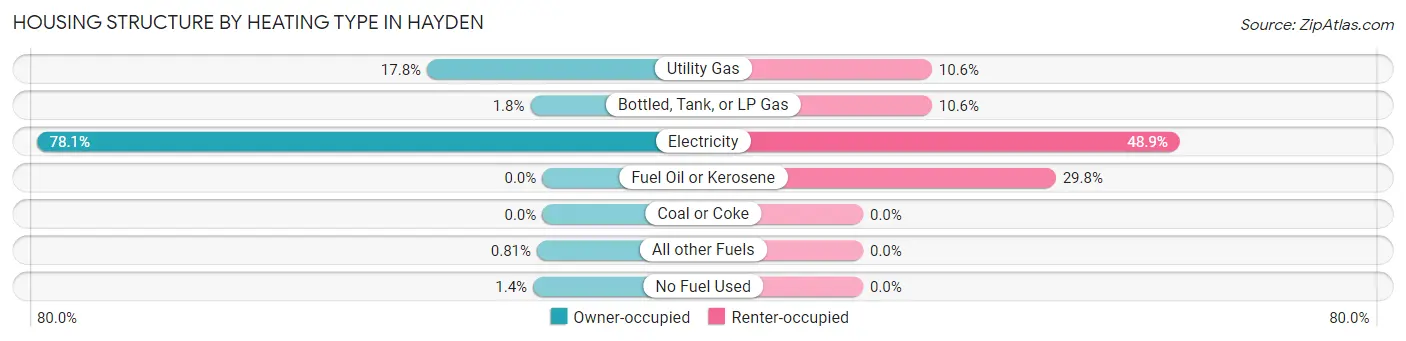
| Heating Type | Owner-occupied | Renter-occupied |
| Utility Gas | 88 (17.8%) | 5 (10.6%) |
| Bottled, Tank, or LP Gas | 9 (1.8%) | 5 (10.6%) |
| Electricity | 386 (78.1%) | 23 (48.9%) |
| Fuel Oil or Kerosene | 0 (0.0%) | 14 (29.8%) |
| Coal or Coke | 0 (0.0%) | 0 (0.0%) |
| All other Fuels | 4 (0.8%) | 0 (0.0%) |
| No Fuel Used | 7 (1.4%) | 0 (0.0%) |
| Total | 494 (100.0%) | 47 (100.0%) |
Household Vehicle Usage in Hayden
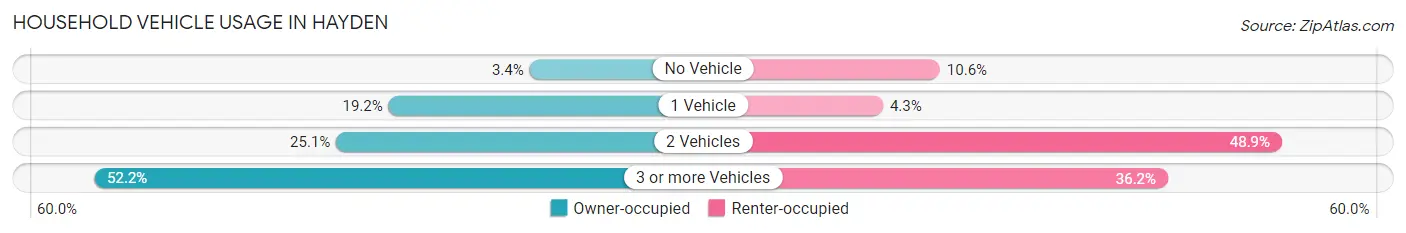
| Vehicles per Household | Owner-occupied | Renter-occupied |
| No Vehicle | 17 (3.4%) | 5 (10.6%) |
| 1 Vehicle | 95 (19.2%) | 2 (4.3%) |
| 2 Vehicles | 124 (25.1%) | 23 (48.9%) |
| 3 or more Vehicles | 258 (52.2%) | 17 (36.2%) |
| Total | 494 (100.0%) | 47 (100.0%) |
Real Estate & Mortgages in Hayden
Real Estate and Mortgage Overview in Hayden
| Characteristic | Without Mortgage | With Mortgage |
| Housing Units | 199 | 295 |
| Median Property Value | $142,500 | $242,800 |
| Median Household Income | $43,646 | $67 |
| Monthly Housing Costs | $376 | $0 |
| Real Estate Taxes | $485 | $15 |
Property Value by Mortgage Status in Hayden
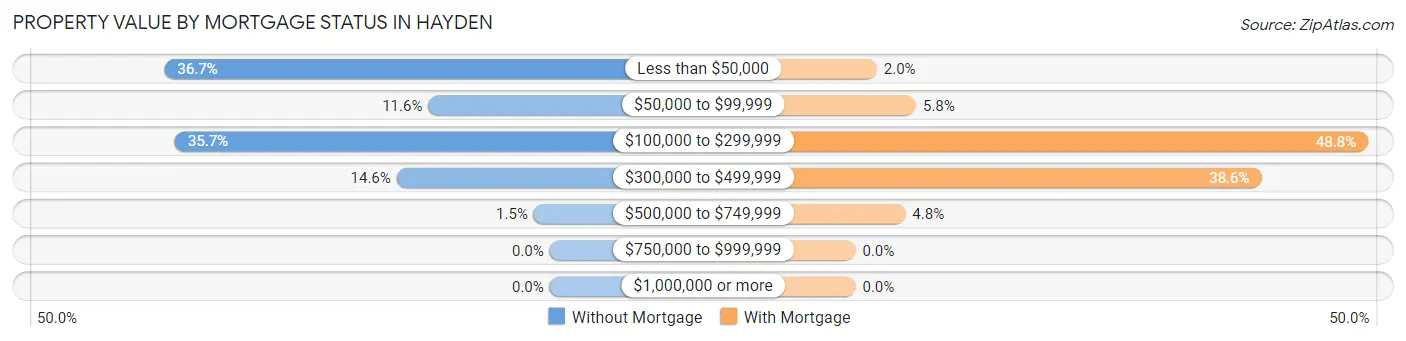
| Property Value | Without Mortgage | With Mortgage |
| Less than $50,000 | 73 (36.7%) | 6 (2.0%) |
| $50,000 to $99,999 | 23 (11.6%) | 17 (5.8%) |
| $100,000 to $299,999 | 71 (35.7%) | 144 (48.8%) |
| $300,000 to $499,999 | 29 (14.6%) | 114 (38.6%) |
| $500,000 to $749,999 | 3 (1.5%) | 14 (4.8%) |
| $750,000 to $999,999 | 0 (0.0%) | 0 (0.0%) |
| $1,000,000 or more | 0 (0.0%) | 0 (0.0%) |
| Total | 199 (100.0%) | 295 (100.0%) |
Household Income by Mortgage Status in Hayden
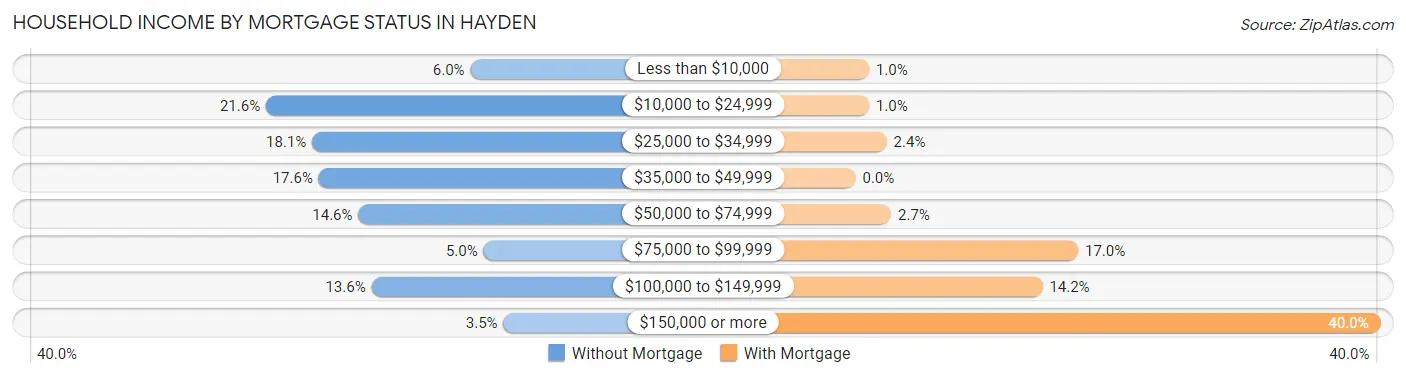
| Household Income | Without Mortgage | With Mortgage |
| Less than $10,000 | 12 (6.0%) | 3 (1.0%) |
| $10,000 to $24,999 | 43 (21.6%) | 3 (1.0%) |
| $25,000 to $34,999 | 36 (18.1%) | 7 (2.4%) |
| $35,000 to $49,999 | 35 (17.6%) | 0 (0.0%) |
| $50,000 to $74,999 | 29 (14.6%) | 8 (2.7%) |
| $75,000 to $99,999 | 10 (5.0%) | 50 (17.0%) |
| $100,000 to $149,999 | 27 (13.6%) | 42 (14.2%) |
| $150,000 or more | 7 (3.5%) | 118 (40.0%) |
| Total | 199 (100.0%) | 295 (100.0%) |
Property Value to Household Income Ratio in Hayden
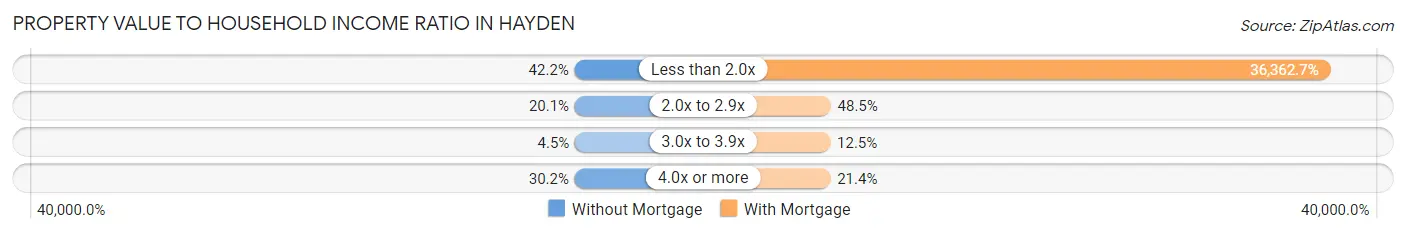
| Value-to-Income Ratio | Without Mortgage | With Mortgage |
| Less than 2.0x | 84 (42.2%) | 107,270 (36,362.7%) |
| 2.0x to 2.9x | 40 (20.1%) | 143 (48.5%) |
| 3.0x to 3.9x | 9 (4.5%) | 37 (12.5%) |
| 4.0x or more | 60 (30.1%) | 63 (21.4%) |
| Total | 199 (100.0%) | 295 (100.0%) |
Real Estate Taxes by Mortgage Status in Hayden
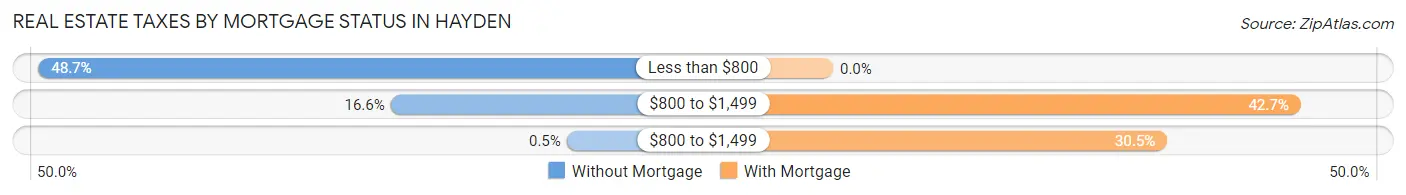
| Property Taxes | Without Mortgage | With Mortgage |
| Less than $800 | 97 (48.7%) | 0 (0.0%) |
| $800 to $1,499 | 33 (16.6%) | 126 (42.7%) |
| $800 to $1,499 | 1 (0.5%) | 90 (30.5%) |
| Total | 199 (100.0%) | 295 (100.0%) |
Health & Disability in Hayden
Health Insurance Coverage by Age in Hayden
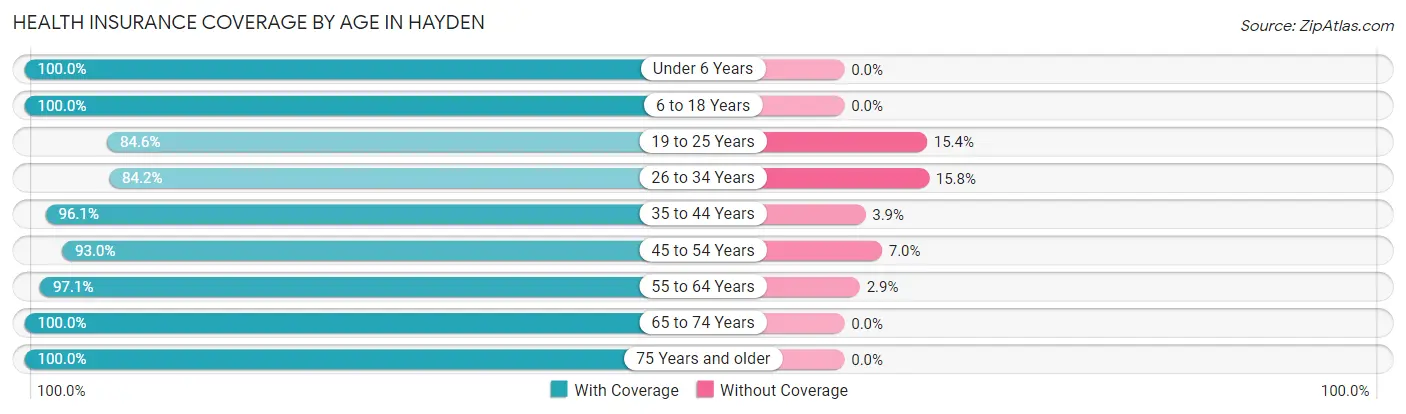
| Age Bracket | With Coverage | Without Coverage |
| Under 6 Years | 159 (100.0%) | 0 (0.0%) |
| 6 to 18 Years | 329 (100.0%) | 0 (0.0%) |
| 19 to 25 Years | 55 (84.6%) | 10 (15.4%) |
| 26 to 34 Years | 139 (84.2%) | 26 (15.8%) |
| 35 to 44 Years | 221 (96.1%) | 9 (3.9%) |
| 45 to 54 Years | 133 (93.0%) | 10 (7.0%) |
| 55 to 64 Years | 236 (97.1%) | 7 (2.9%) |
| 65 to 74 Years | 177 (100.0%) | 0 (0.0%) |
| 75 Years and older | 68 (100.0%) | 0 (0.0%) |
| Total | 1,517 (96.1%) | 62 (3.9%) |
Health Insurance Coverage by Citizenship Status in Hayden
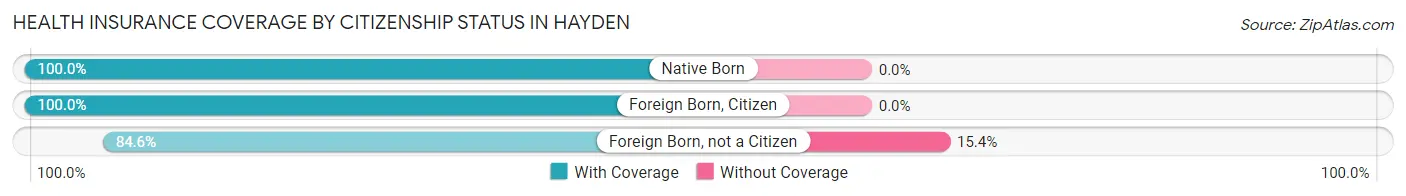
| Citizenship Status | With Coverage | Without Coverage |
| Native Born | 159 (100.0%) | 0 (0.0%) |
| Foreign Born, Citizen | 329 (100.0%) | 0 (0.0%) |
| Foreign Born, not a Citizen | 55 (84.6%) | 10 (15.4%) |
Health Insurance Coverage by Household Income in Hayden
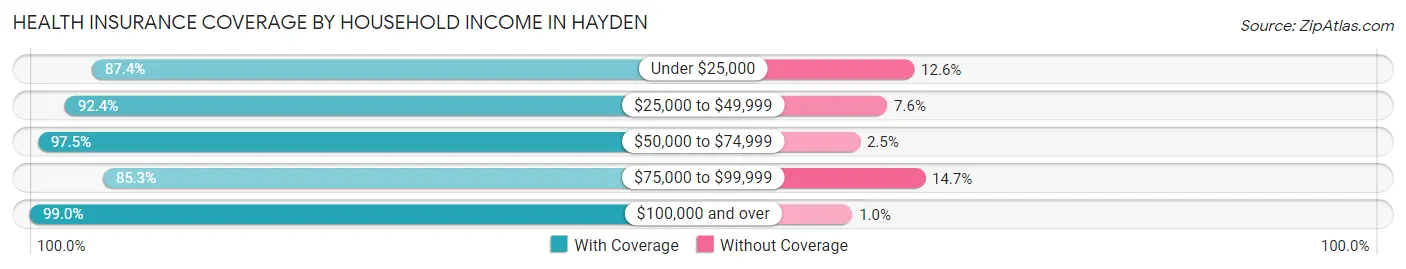
| Household Income | With Coverage | Without Coverage |
| Under $25,000 | 90 (87.4%) | 13 (12.6%) |
| $25,000 to $49,999 | 208 (92.4%) | 17 (7.6%) |
| $50,000 to $74,999 | 237 (97.5%) | 6 (2.5%) |
| $75,000 to $99,999 | 99 (85.3%) | 17 (14.7%) |
| $100,000 and over | 883 (99.0%) | 9 (1.0%) |
Public vs Private Health Insurance Coverage by Age in Hayden
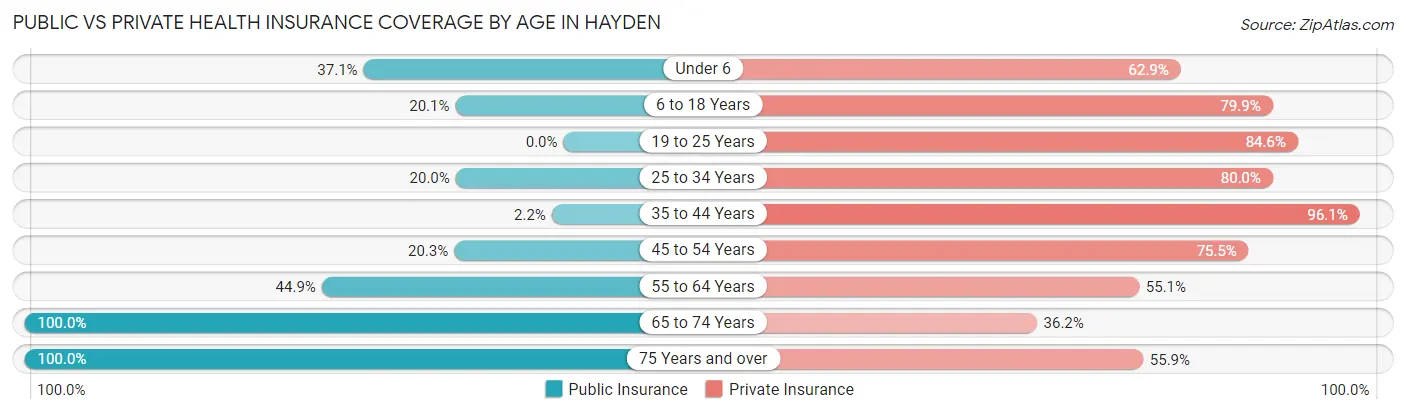
| Age Bracket | Public Insurance | Private Insurance |
| Under 6 | 59 (37.1%) | 100 (62.9%) |
| 6 to 18 Years | 66 (20.1%) | 263 (79.9%) |
| 19 to 25 Years | 0 (0.0%) | 55 (84.6%) |
| 25 to 34 Years | 33 (20.0%) | 132 (80.0%) |
| 35 to 44 Years | 5 (2.2%) | 221 (96.1%) |
| 45 to 54 Years | 29 (20.3%) | 108 (75.5%) |
| 55 to 64 Years | 109 (44.9%) | 134 (55.1%) |
| 65 to 74 Years | 177 (100.0%) | 64 (36.2%) |
| 75 Years and over | 68 (100.0%) | 38 (55.9%) |
| Total | 546 (34.6%) | 1,115 (70.6%) |
Disability Status by Sex by Age in Hayden
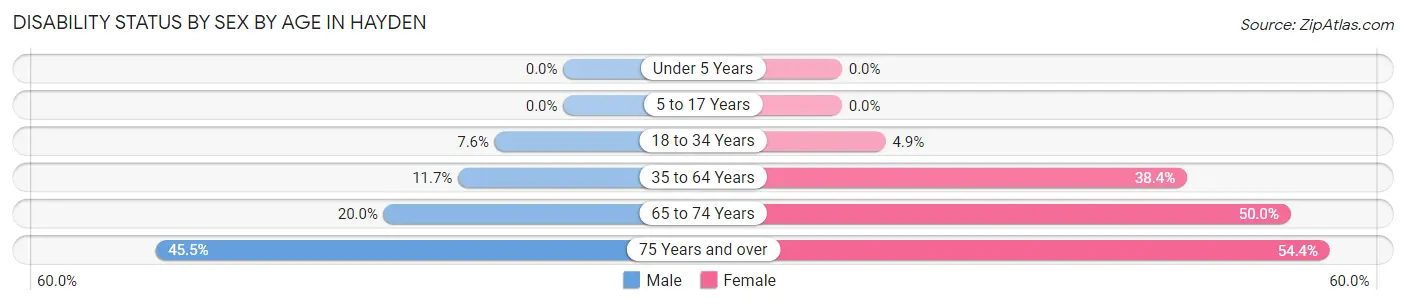
| Age Bracket | Male | Female |
| Under 5 Years | 0 (0.0%) | 0 (0.0%) |
| 5 to 17 Years | 0 (0.0%) | 0 (0.0%) |
| 18 to 34 Years | 9 (7.6%) | 7 (4.9%) |
| 35 to 64 Years | 24 (11.7%) | 158 (38.4%) |
| 65 to 74 Years | 25 (20.0%) | 26 (50.0%) |
| 75 Years and over | 10 (45.5%) | 25 (54.3%) |
Disability Class by Sex by Age in Hayden
Disability Class: Hearing Difficulty
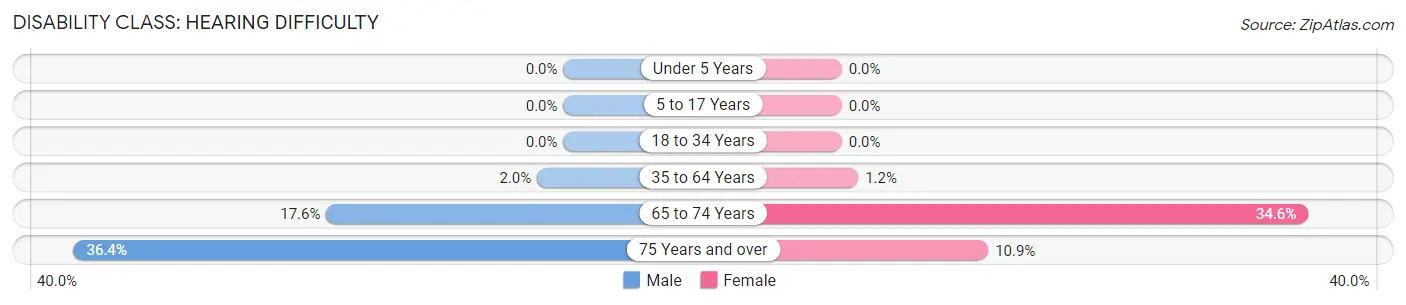
| Age Bracket | Male | Female |
| Under 5 Years | 0 (0.0%) | 0 (0.0%) |
| 5 to 17 Years | 0 (0.0%) | 0 (0.0%) |
| 18 to 34 Years | 0 (0.0%) | 0 (0.0%) |
| 35 to 64 Years | 4 (1.9%) | 5 (1.2%) |
| 65 to 74 Years | 22 (17.6%) | 18 (34.6%) |
| 75 Years and over | 8 (36.4%) | 5 (10.9%) |
Disability Class: Vision Difficulty
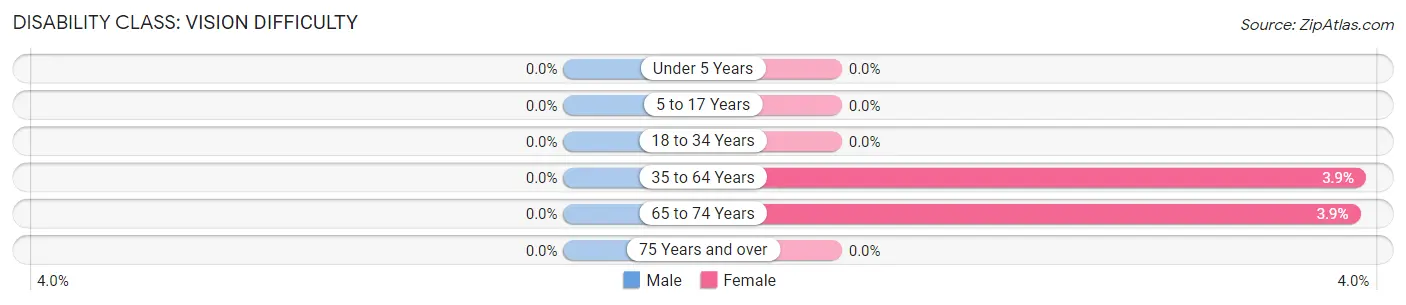
| Age Bracket | Male | Female |
| Under 5 Years | 0 (0.0%) | 0 (0.0%) |
| 5 to 17 Years | 0 (0.0%) | 0 (0.0%) |
| 18 to 34 Years | 0 (0.0%) | 0 (0.0%) |
| 35 to 64 Years | 0 (0.0%) | 16 (3.9%) |
| 65 to 74 Years | 0 (0.0%) | 2 (3.8%) |
| 75 Years and over | 0 (0.0%) | 0 (0.0%) |
Disability Class: Cognitive Difficulty
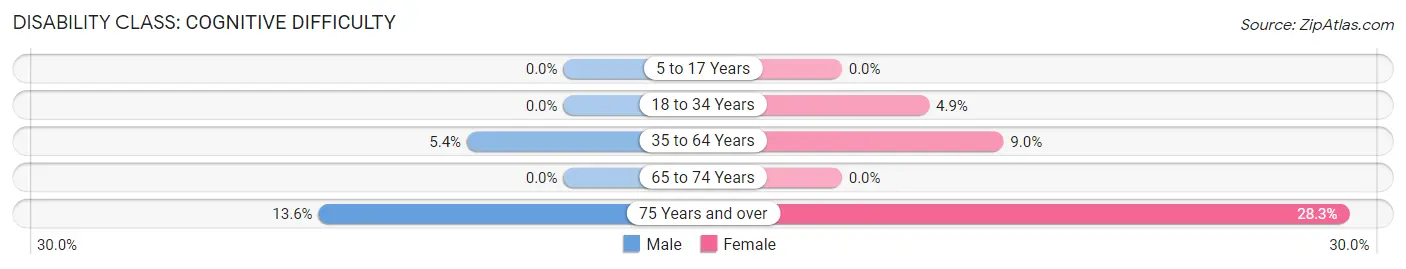
| Age Bracket | Male | Female |
| 5 to 17 Years | 0 (0.0%) | 0 (0.0%) |
| 18 to 34 Years | 0 (0.0%) | 7 (4.9%) |
| 35 to 64 Years | 11 (5.4%) | 37 (9.0%) |
| 65 to 74 Years | 0 (0.0%) | 0 (0.0%) |
| 75 Years and over | 3 (13.6%) | 13 (28.3%) |
Disability Class: Ambulatory Difficulty
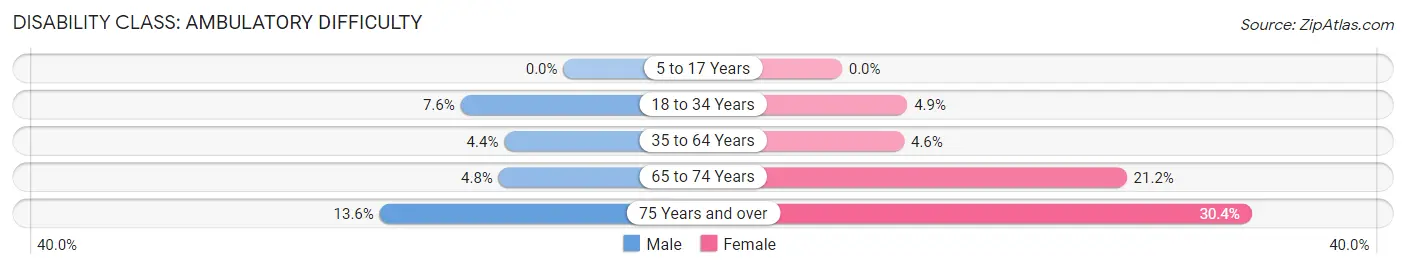
| Age Bracket | Male | Female |
| 5 to 17 Years | 0 (0.0%) | 0 (0.0%) |
| 18 to 34 Years | 9 (7.6%) | 7 (4.9%) |
| 35 to 64 Years | 9 (4.4%) | 19 (4.6%) |
| 65 to 74 Years | 6 (4.8%) | 11 (21.1%) |
| 75 Years and over | 3 (13.6%) | 14 (30.4%) |
Disability Class: Self-Care Difficulty
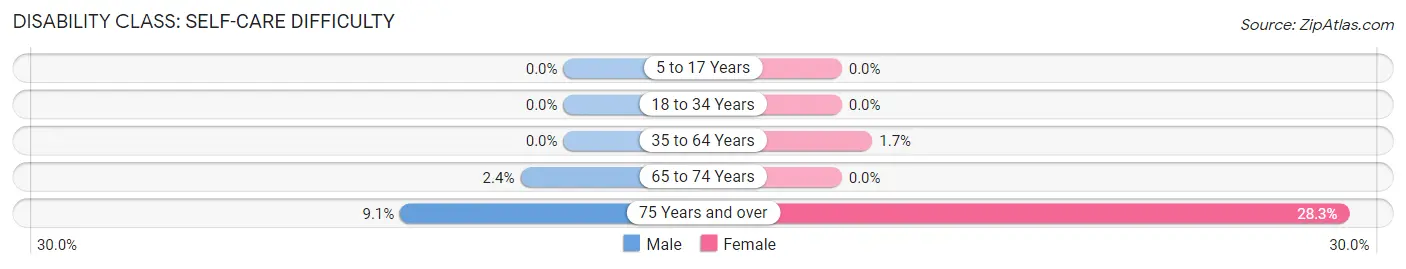
| Age Bracket | Male | Female |
| 5 to 17 Years | 0 (0.0%) | 0 (0.0%) |
| 18 to 34 Years | 0 (0.0%) | 0 (0.0%) |
| 35 to 64 Years | 0 (0.0%) | 7 (1.7%) |
| 65 to 74 Years | 3 (2.4%) | 0 (0.0%) |
| 75 Years and over | 2 (9.1%) | 13 (28.3%) |
Technology Access in Hayden
Computing Device Access in Hayden
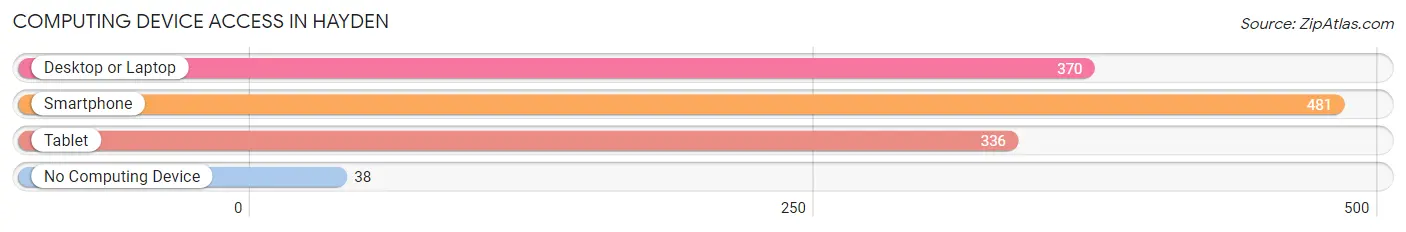
| Device Type | # Households | % Households |
| Desktop or Laptop | 370 | 68.4% |
| Smartphone | 481 | 88.9% |
| Tablet | 336 | 62.1% |
| No Computing Device | 38 | 7.0% |
| Total | 541 | 100.0% |
Internet Access in Hayden
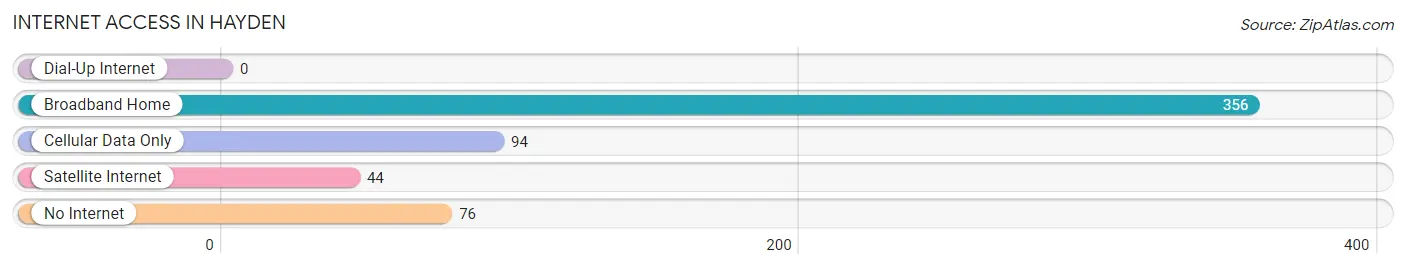
| Internet Type | # Households | % Households |
| Dial-Up Internet | 0 | 0.0% |
| Broadband Home | 356 | 65.8% |
| Cellular Data Only | 94 | 17.4% |
| Satellite Internet | 44 | 8.1% |
| No Internet | 76 | 14.1% |
| Total | 541 | 100.0% |
Hayden Summary
Hayden is a small town located in Blount County, Alabama. It is situated in the foothills of the Appalachian Mountains and is part of the Birmingham-Hoover Metropolitan Statistical Area. The town was founded in 1891 and has a population of approximately 2,000 people.
Geography
Hayden is located in the foothills of the Appalachian Mountains in Blount County, Alabama. The town is situated at the intersection of US Highway 31 and Alabama State Route 79. The terrain is mostly hilly and the area is known for its scenic beauty. The town is located approximately 25 miles northeast of Birmingham and is part of the Birmingham-Hoover Metropolitan Statistical Area.
Climate
Hayden has a humid subtropical climate with hot, humid summers and mild winters. The average annual temperature is around 64°F and the average annual precipitation is around 50 inches.
Economy
The economy of Hayden is largely based on agriculture and manufacturing. The town is home to several small businesses, including a feed mill, a sawmill, and a furniture factory. The town also has a few retail stores and restaurants.
Demographics
As of the 2010 census, the population of Hayden was 2,039. The racial makeup of the town was 97.2% White, 0.7% African American, 0.3% Native American, 0.2% Asian, 0.1% Pacific Islander, 0.7% from other races, and 0.9% from two or more races. Hispanic or Latino of any race were 1.7% of the population.
The median income for a household in Hayden was $37,500, and the median income for a family was $45,000. The per capita income for the town was $19,000. About 11.2% of families and 14.2% of the population were below the poverty line, including 18.2% of those under age 18 and 8.3% of those age 65 or over.
History
Hayden was founded in 1891 by a group of settlers from Georgia. The town was named after a local landowner, William Hayden. The town was incorporated in 1901 and has remained relatively small since then.
In the early 1900s, Hayden was a thriving agricultural community. The town was home to several cotton gins, a sawmill, and a furniture factory. The town also had a few stores and restaurants.
In the 1950s, the town began to decline as the local economy shifted away from agriculture. The furniture factory closed in the 1960s and the sawmill closed in the 1970s. The town has since seen a resurgence in recent years, with several new businesses opening in the area.
Common Questions
What is the Total Population of Hayden?
Total Population of Hayden is 1,579.
What is the Total Male Population of Hayden?
Total Male Population of Hayden is 688.
What is the Total Female Population of Hayden?
Total Female Population of Hayden is 891.
What is the Ratio of Males per 100 Females in Hayden?
There are 77.22 Males per 100 Females in Hayden.
What is the Ratio of Females per 100 Males in Hayden?
There are 129.51 Females per 100 Males in Hayden.
What is the Median Population Age in Hayden?
Median Population Age in Hayden is 38.8 Years.
What is the Average Family Size in Hayden
Average Family Size in Hayden is 3.4 People.
What is the Average Household Size in Hayden
Average Household Size in Hayden is 2.9 People.
What is Per Capita Income in Hayden?
Per Capita income in Hayden is $32,210.
What is the Median Family Income in Hayden?
Median Family Income in Hayden is $105,144.
What is the Median Household income in Hayden?
Median Household Income in Hayden is $80,221.
What is Income or Wage Gap in Hayden?
Income or Wage Gap in Hayden is 51.6%.
Women in Hayden earn 48.4 cents for every dollar earned by a man.
What is Inequality or Gini Index in Hayden?
Inequality or Gini Index in Hayden is 0.36.
How Large is the Labor Force in Hayden?
There are 642 People in the Labor Forcein in Hayden.
What is the Percentage of People in the Labor Force in Hayden?
52.7% of People are in the Labor Force in Hayden.
What is the Unemployment Rate in Hayden?
Unemployment Rate in Hayden is 2.2%.