Goshen, AL
Goshen Map
Goshen Overview
447
TOTAL POPULATION
203
MALE POPULATION
244
FEMALE POPULATION
83.20
MALES / 100 FEMALES
120.20
FEMALES / 100 MALES
40.3
MEDIAN AGE
3.5
AVG FAMILY SIZE
3.1
AVG HOUSEHOLD SIZE
$19,645
PER CAPITA INCOME
$39,583
AVG FAMILY INCOME
$39,722
AVG HOUSEHOLD INCOME
15.8%
WAGE / INCOME GAP [ % ]
84.2¢/ $1
WAGE / INCOME GAP [ $ ]
0.36
INEQUALITY / GINI INDEX
192
LABOR FORCE [ PEOPLE ]
57.3%
PERCENT IN LABOR FORCE
5.2%
UNEMPLOYMENT RATE
Goshen Zip Codes
Goshen Area Codes
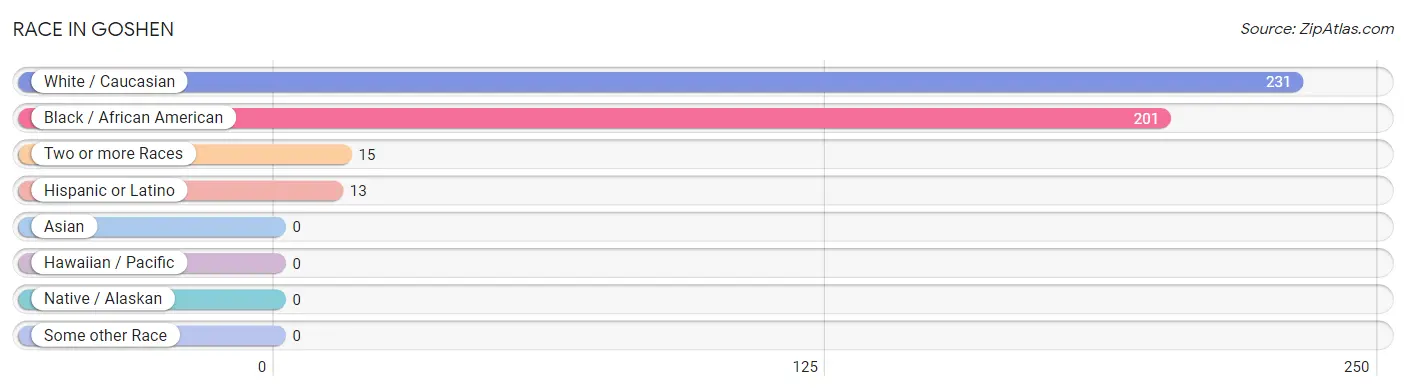
Race in Goshen
The most populous races in Goshen are White / Caucasian (231 | 51.7%), Black / African American (201 | 45.0%), and Two or more Races (15 | 3.4%).
| Race | # Population | % Population |
| Asian | 0 | 0.0% |
| Black / African American | 201 | 45.0% |
| Hawaiian / Pacific | 0 | 0.0% |
| Hispanic or Latino | 13 | 2.9% |
| Native / Alaskan | 0 | 0.0% |
| White / Caucasian | 231 | 51.7% |
| Two or more Races | 15 | 3.4% |
| Some other Race | 0 | 0.0% |
| Total | 447 | 100.0% |
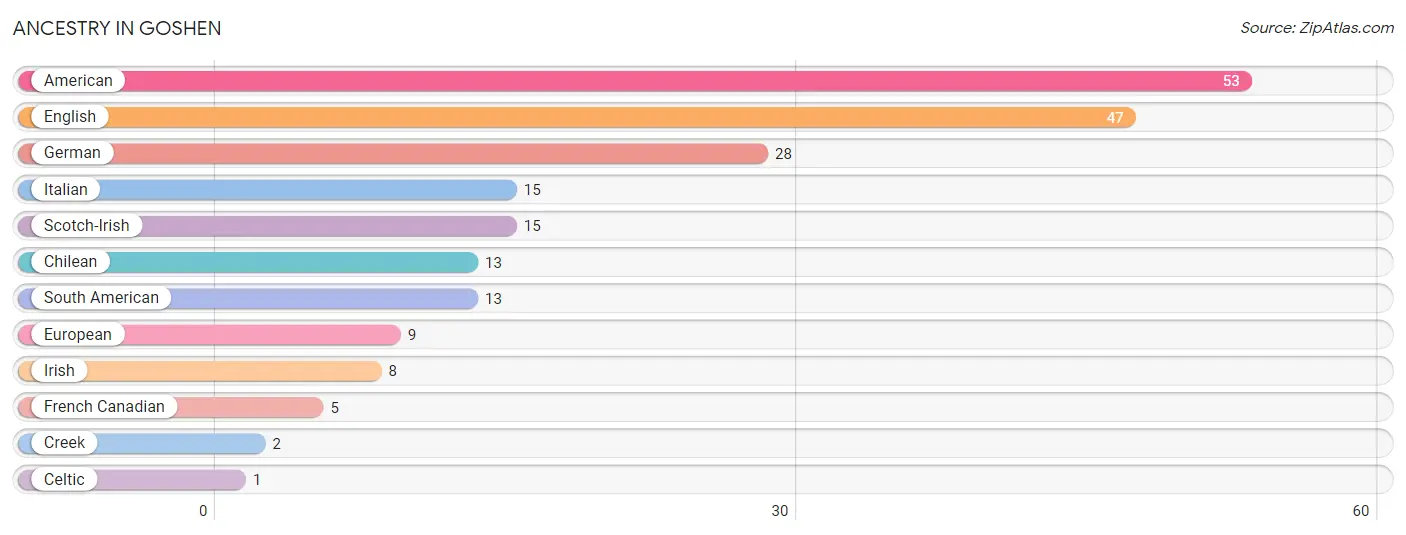
Ancestry in Goshen
The most populous ancestries reported in Goshen are American (53 | 11.9%), English (47 | 10.5%), German (28 | 6.3%), Italian (15 | 3.4%), and Scotch-Irish (15 | 3.4%), together accounting for 35.4% of all Goshen residents.
| Ancestry | # Population | % Population |
| American | 53 | 11.9% |
| Celtic | 1 | 0.2% |
| Chilean | 13 | 2.9% |
| Creek | 2 | 0.4% |
| English | 47 | 10.5% |
| European | 9 | 2.0% |
| French Canadian | 5 | 1.1% |
| German | 28 | 6.3% |
| Irish | 8 | 1.8% |
| Italian | 15 | 3.4% |
| Scotch-Irish | 15 | 3.4% |
| South American | 13 | 2.9% | View All 12 Rows |
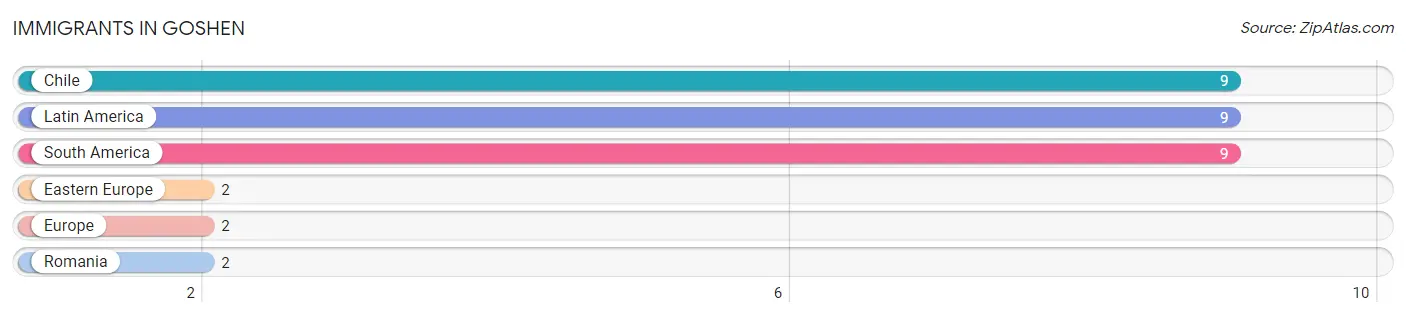
Immigrants in Goshen
The most numerous immigrant groups reported in Goshen came from Chile (9 | 2.0%), Latin America (9 | 2.0%), South America (9 | 2.0%), Eastern Europe (2 | 0.4%), and Europe (2 | 0.4%), together accounting for 6.9% of all Goshen residents.
| Immigration Origin | # Population | % Population |
| Chile | 9 | 2.0% |
| Eastern Europe | 2 | 0.4% |
| Europe | 2 | 0.4% |
| Latin America | 9 | 2.0% |
| Romania | 2 | 0.4% |
| South America | 9 | 2.0% | View All 6 Rows |
Sex and Age in Goshen
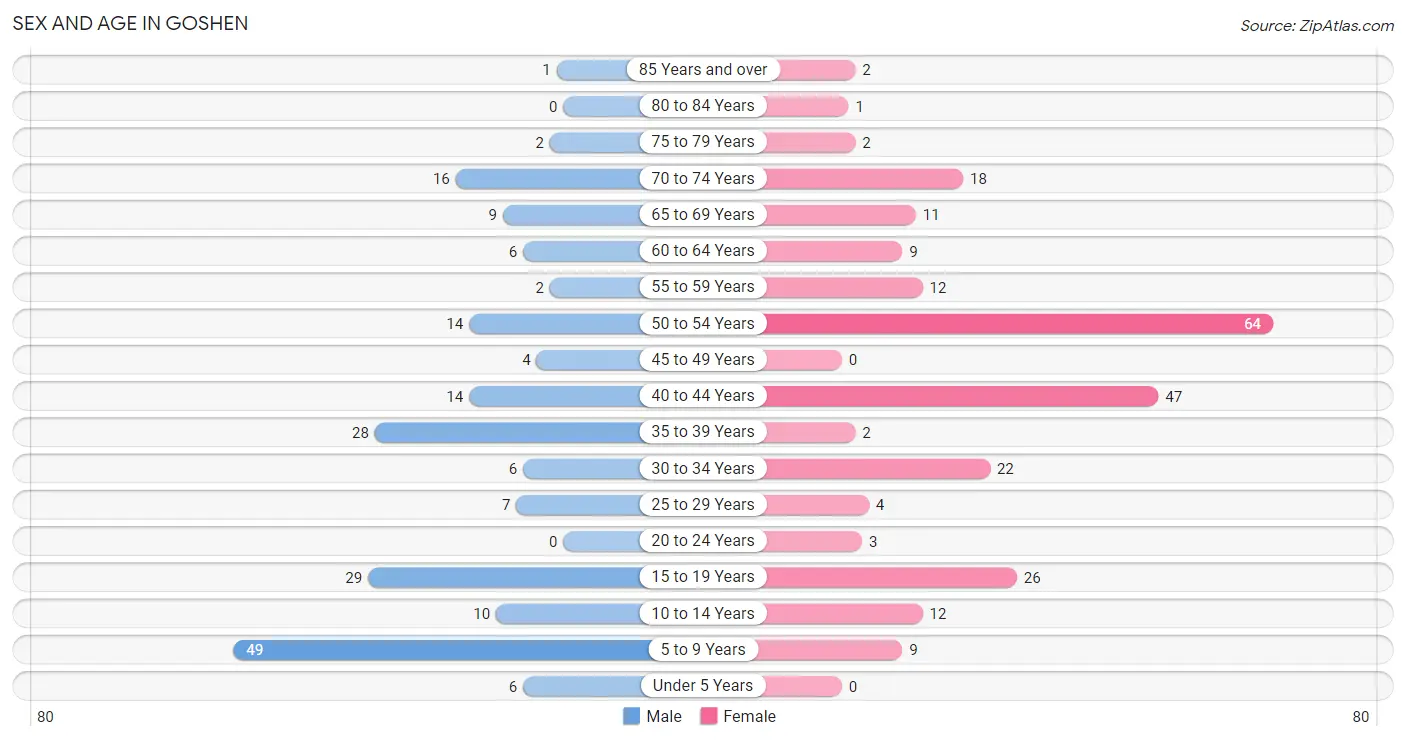
Sex and Age in Goshen
The most populous age groups in Goshen are 5 to 9 Years (49 | 24.1%) for men and 50 to 54 Years (64 | 26.2%) for women.
| Age Bracket | Male | Female |
| Under 5 Years | 6 (3.0%) | 0 (0.0%) |
| 5 to 9 Years | 49 (24.1%) | 9 (3.7%) |
| 10 to 14 Years | 10 (4.9%) | 12 (4.9%) |
| 15 to 19 Years | 29 (14.3%) | 26 (10.7%) |
| 20 to 24 Years | 0 (0.0%) | 3 (1.2%) |
| 25 to 29 Years | 7 (3.5%) | 4 (1.6%) |
| 30 to 34 Years | 6 (3.0%) | 22 (9.0%) |
| 35 to 39 Years | 28 (13.8%) | 2 (0.8%) |
| 40 to 44 Years | 14 (6.9%) | 47 (19.3%) |
| 45 to 49 Years | 4 (2.0%) | 0 (0.0%) |
| 50 to 54 Years | 14 (6.9%) | 64 (26.2%) |
| 55 to 59 Years | 2 (1.0%) | 12 (4.9%) |
| 60 to 64 Years | 6 (3.0%) | 9 (3.7%) |
| 65 to 69 Years | 9 (4.4%) | 11 (4.5%) |
| 70 to 74 Years | 16 (7.9%) | 18 (7.4%) |
| 75 to 79 Years | 2 (1.0%) | 2 (0.8%) |
| 80 to 84 Years | 0 (0.0%) | 1 (0.4%) |
| 85 Years and over | 1 (0.5%) | 2 (0.8%) |
| Total | 203 (100.0%) | 244 (100.0%) |
Families and Households in Goshen
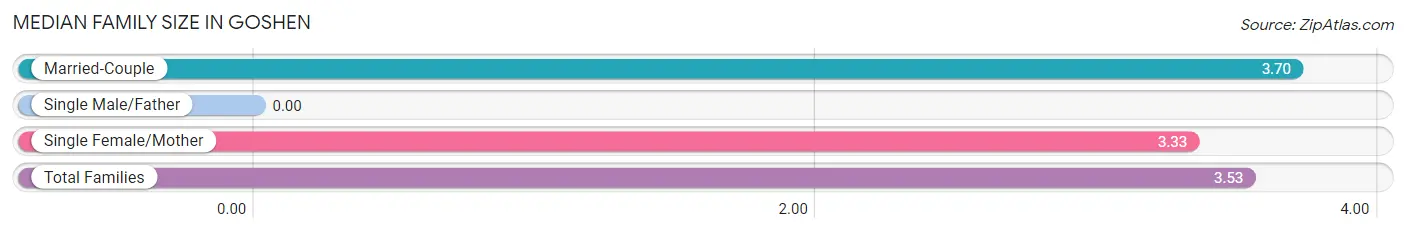
Median Family Size in Goshen
| Family Type | # Families | Family Size |
| Married-Couple | 63 (53.4%) | 3.70 |
| Single Male/Father | 0 (0.0%) | - |
| Single Female/Mother | 55 (46.6%) | 3.33 |
| Total Families | 118 (100.0%) | 3.53 |
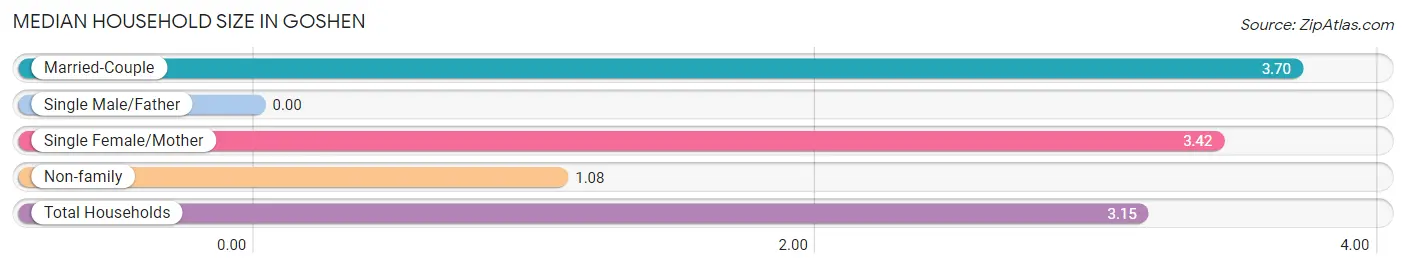
Median Household Size in Goshen
| Household Type | # Households | Household Size |
| Married-Couple | 63 (44.4%) | 3.70 |
| Single Male/Father | 0 (0.0%) | - |
| Single Female/Mother | 55 (38.7%) | 3.42 |
| Non-family | 24 (16.9%) | 1.08 |
| Total Households | 142 (100.0%) | 3.15 |
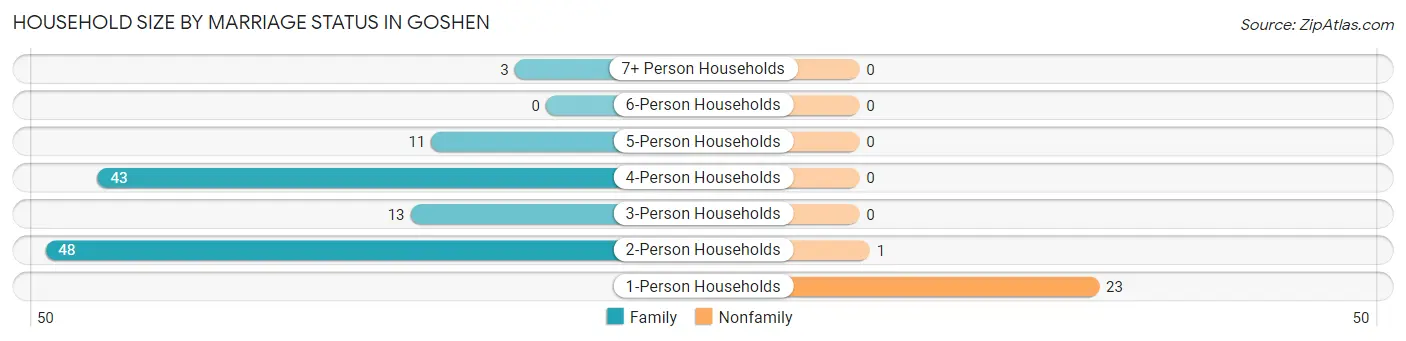
Household Size by Marriage Status in Goshen
Out of a total of 142 households in Goshen, 118 (83.1%) are family households, while 24 (16.9%) are nonfamily households. The most numerous type of family households are 2-person households, comprising 48, and the most common type of nonfamily households are 1-person households, comprising 23.
| Household Size | Family Households | Nonfamily Households |
| 1-Person Households | - | 23 (16.2%) |
| 2-Person Households | 48 (33.8%) | 1 (0.7%) |
| 3-Person Households | 13 (9.1%) | 0 (0.0%) |
| 4-Person Households | 43 (30.3%) | 0 (0.0%) |
| 5-Person Households | 11 (7.7%) | 0 (0.0%) |
| 6-Person Households | 0 (0.0%) | 0 (0.0%) |
| 7+ Person Households | 3 (2.1%) | 0 (0.0%) |
| Total | 118 (83.1%) | 24 (16.9%) |
Female Fertility in Goshen
Fertility by Age in Goshen
Average fertility rate in Goshen is 96.0 births per 1,000 women. Women in the age bracket of 20 to 34 years have the highest fertility rate with 345.0 births per 1,000 women. Women in the age bracket of 20 to 34 years acount for 100.0% of all women with births.
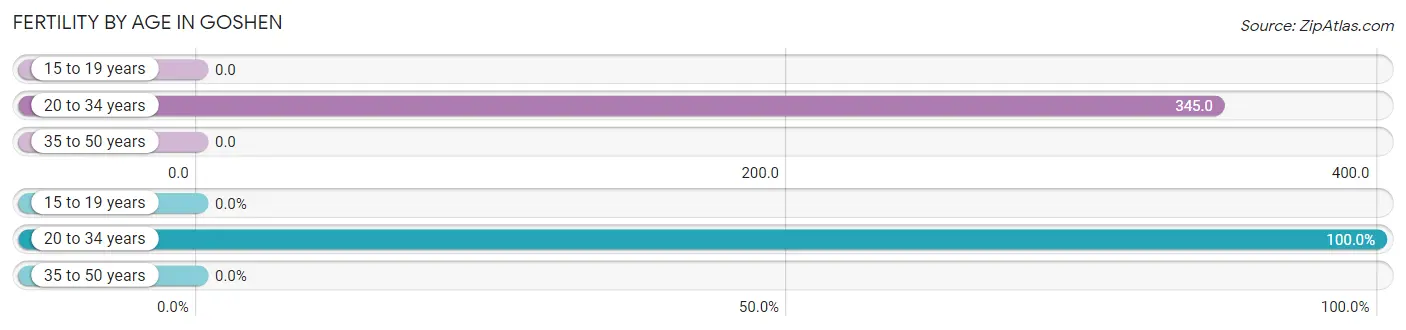
| Age Bracket | Women with Births | Births / 1,000 Women |
| 15 to 19 years | 0 (0.0%) | 0.0 |
| 20 to 34 years | 10 (100.0%) | 345.0 |
| 35 to 50 years | 0 (0.0%) | 0.0 |
| Total | 10 (100.0%) | 96.0 |
Fertility by Age by Marriage Status in Goshen
80.0% of women with births (10) in Goshen are married. The highest percentage of unmarried women with births falls into 20 to 34 years age bracket with 20.0% of them unmarried at the time of birth, while the lowest percentage of unmarried women with births belong to 20 to 34 years age bracket with 20.0% of them unmarried.
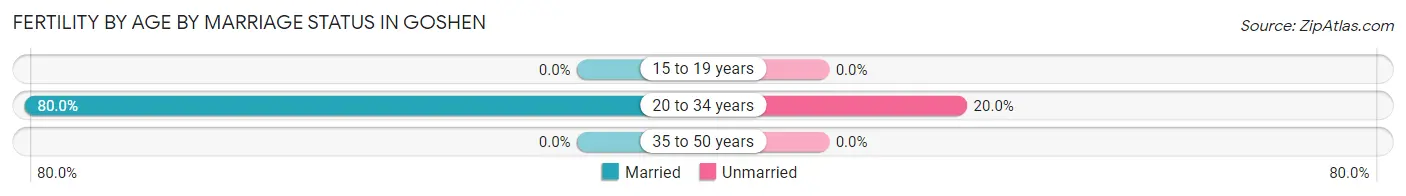
| Age Bracket | Married | Unmarried |
| 15 to 19 years | 0 (0.0%) | 0 (0.0%) |
| 20 to 34 years | 8 (80.0%) | 2 (20.0%) |
| 35 to 50 years | 0 (0.0%) | 0 (0.0%) |
| Total | 8 (80.0%) | 2 (20.0%) |
Fertility by Education in Goshen
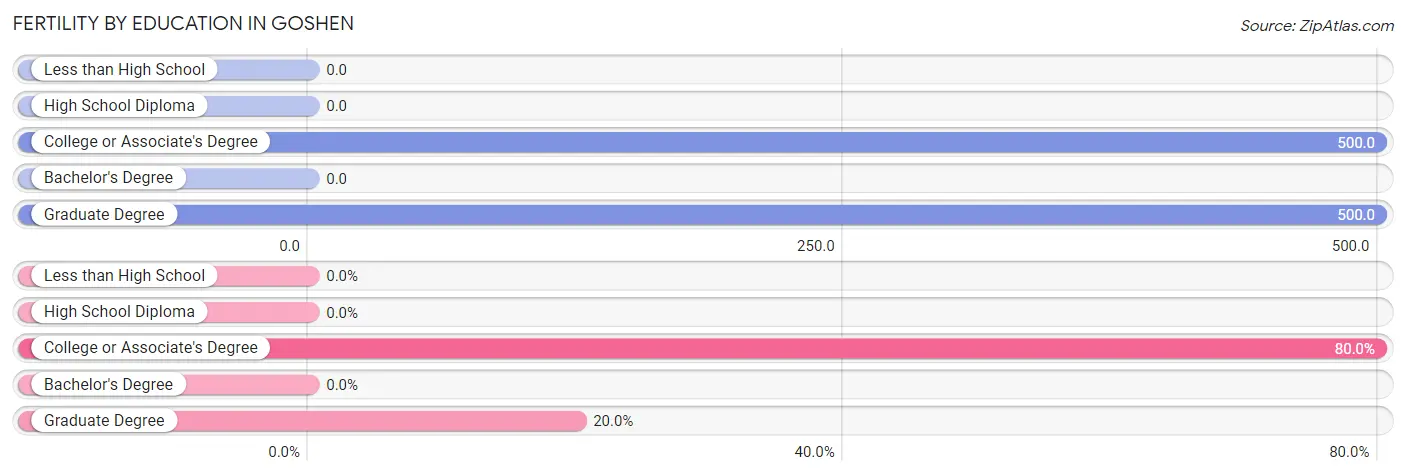
| Educational Attainment | Women with Births | Births / 1,000 Women |
| Less than High School | 0 (0.0%) | 0.0 |
| High School Diploma | 0 (0.0%) | 0.0 |
| College or Associate's Degree | 8 (80.0%) | 500.0 |
| Bachelor's Degree | 0 (0.0%) | 0.0 |
| Graduate Degree | 2 (20.0%) | 500.0 |
| Total | 10 (100.0%) | 96.0 |
Fertility by Education by Marriage Status in Goshen
20.0% of women with births in Goshen are unmarried. Women with the educational attainment of college or associate's degree are most likely to be married with 100.0% of them married at childbirth, while women with the educational attainment of graduate degree are least likely to be married with 100.0% of them unmarried at childbirth.
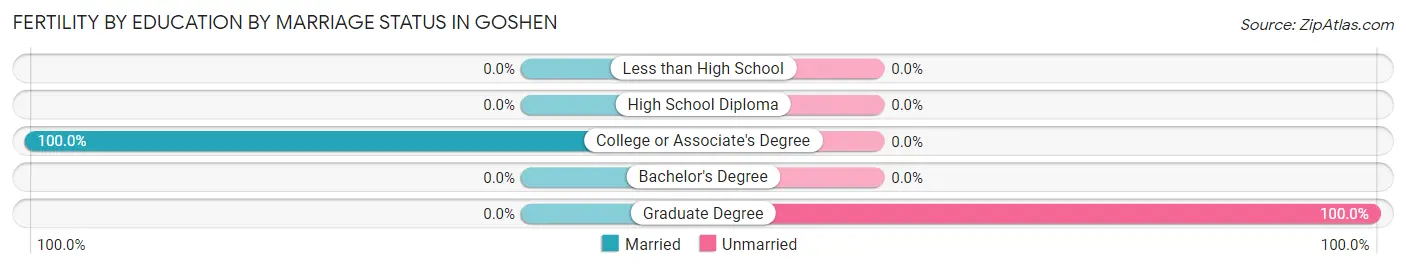
| Educational Attainment | Married | Unmarried |
| Less than High School | 0 (0.0%) | 0 (0.0%) |
| High School Diploma | 0 (0.0%) | 0 (0.0%) |
| College or Associate's Degree | 8 (100.0%) | 0 (0.0%) |
| Bachelor's Degree | 0 (0.0%) | 0 (0.0%) |
| Graduate Degree | 0 (0.0%) | 2 (100.0%) |
| Total | 8 (80.0%) | 2 (20.0%) |
Income in Goshen
Income Overview in Goshen
Per Capita Income in Goshen is $19,645, while median incomes of families and households are $39,583 and $39,722 respectively.
| Characteristic | Number | Measure |
| Per Capita Income | 447 | $19,645 |
| Median Family Income | 118 | $39,583 |
| Mean Family Income | 118 | $60,589 |
| Median Household Income | 142 | $39,722 |
| Mean Household Income | 142 | $57,682 |
| Income Deficit | 118 | $0 |
| Wage / Income Gap (%) | 447 | 15.80% |
| Wage / Income Gap ($) | 447 | 84.20¢ per $1 |
| Gini / Inequality Index | 447 | 0.36 |
Earnings by Sex in Goshen
Average Earnings in Goshen are $24,273, $28,438 for men and $23,944 for women, a difference of 15.8%.
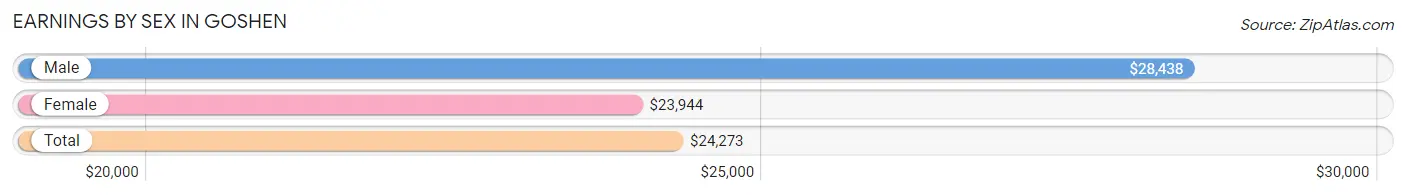
| Sex | Number | Average Earnings |
| Male | 66 (32.0%) | $28,438 |
| Female | 140 (68.0%) | $23,944 |
| Total | 206 (100.0%) | $24,273 |
Earnings by Sex by Income Bracket in Goshen
The most common earnings brackets in Goshen are $22,500 to $24,999 for men (10 | 15.1%) and $22,500 to $24,999 for women (45 | 32.1%).
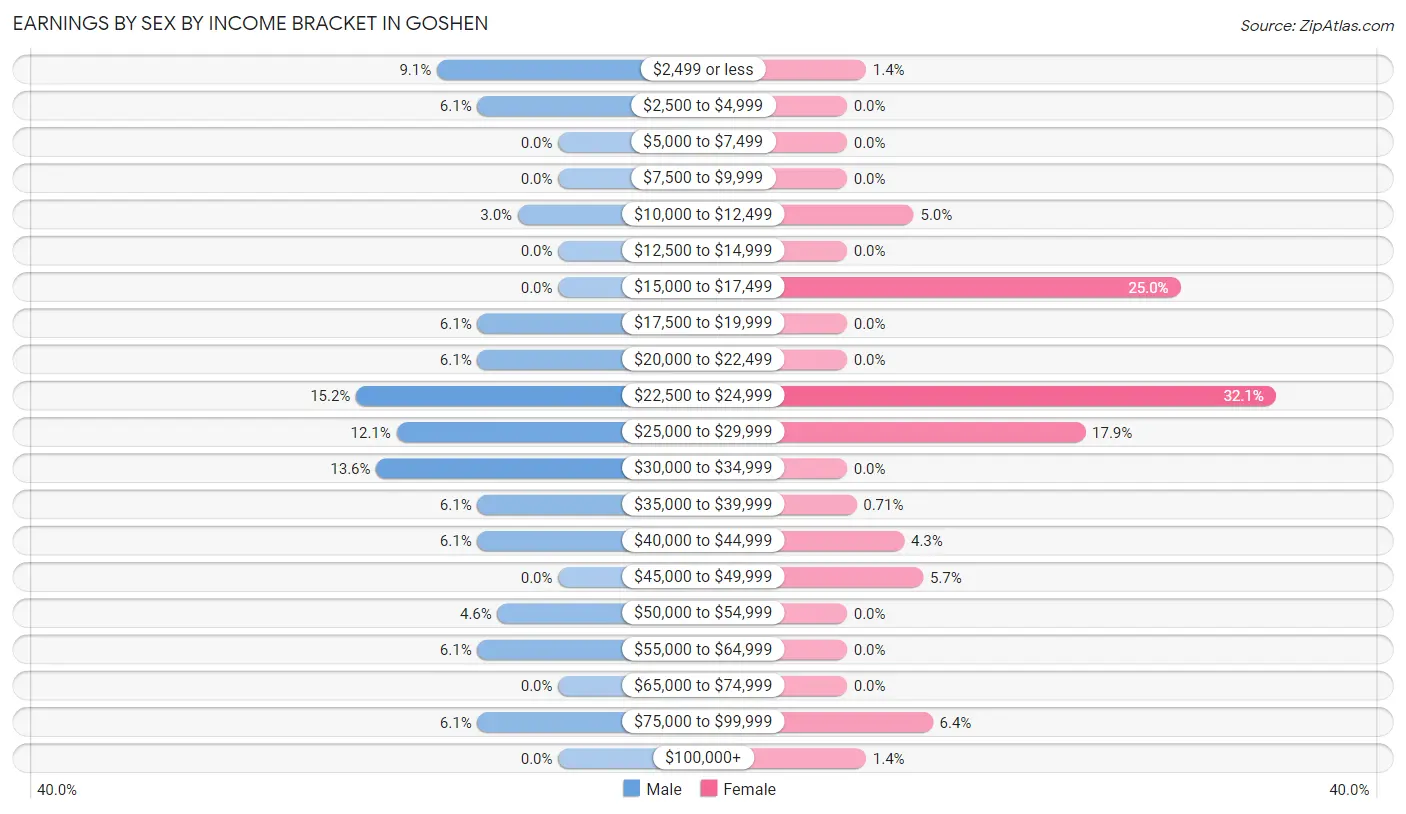
| Income | Male | Female |
| $2,499 or less | 6 (9.1%) | 2 (1.4%) |
| $2,500 to $4,999 | 4 (6.1%) | 0 (0.0%) |
| $5,000 to $7,499 | 0 (0.0%) | 0 (0.0%) |
| $7,500 to $9,999 | 0 (0.0%) | 0 (0.0%) |
| $10,000 to $12,499 | 2 (3.0%) | 7 (5.0%) |
| $12,500 to $14,999 | 0 (0.0%) | 0 (0.0%) |
| $15,000 to $17,499 | 0 (0.0%) | 35 (25.0%) |
| $17,500 to $19,999 | 4 (6.1%) | 0 (0.0%) |
| $20,000 to $22,499 | 4 (6.1%) | 0 (0.0%) |
| $22,500 to $24,999 | 10 (15.1%) | 45 (32.1%) |
| $25,000 to $29,999 | 8 (12.1%) | 25 (17.9%) |
| $30,000 to $34,999 | 9 (13.6%) | 0 (0.0%) |
| $35,000 to $39,999 | 4 (6.1%) | 1 (0.7%) |
| $40,000 to $44,999 | 4 (6.1%) | 6 (4.3%) |
| $45,000 to $49,999 | 0 (0.0%) | 8 (5.7%) |
| $50,000 to $54,999 | 3 (4.5%) | 0 (0.0%) |
| $55,000 to $64,999 | 4 (6.1%) | 0 (0.0%) |
| $65,000 to $74,999 | 0 (0.0%) | 0 (0.0%) |
| $75,000 to $99,999 | 4 (6.1%) | 9 (6.4%) |
| $100,000+ | 0 (0.0%) | 2 (1.4%) |
| Total | 66 (100.0%) | 140 (100.0%) |
Earnings by Sex by Educational Attainment in Goshen
Average earnings in Goshen are $29,688 for men and $23,917 for women, a difference of 19.4%. Men with an educational attainment of college or associate's degree enjoy the highest average annual earnings of $33,000, while those with high school diploma education earn the least with $24,167. Women with an educational attainment of bachelor's degree earn the most with the average annual earnings of $37,500, while those with high school diploma education have the smallest earnings of $22,788.
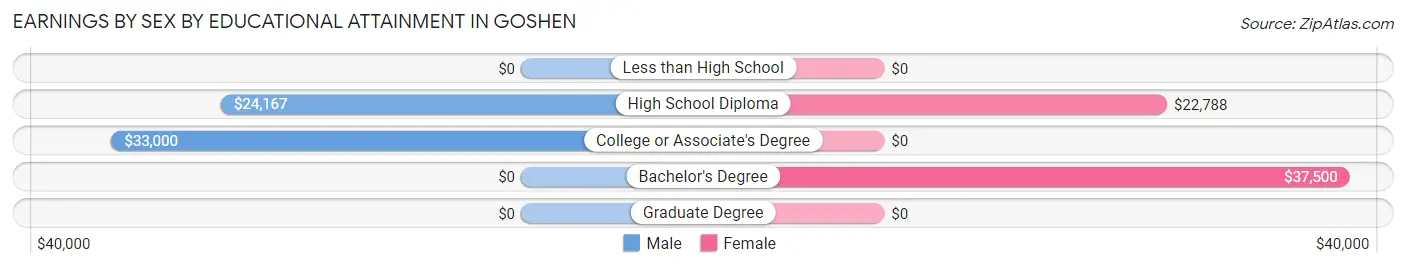
| Educational Attainment | Male Income | Female Income |
| Less than High School | - | - |
| High School Diploma | $24,167 | $22,788 |
| College or Associate's Degree | $33,000 | $0 |
| Bachelor's Degree | - | - |
| Graduate Degree | - | - |
| Total | $29,688 | $23,917 |
Family Income in Goshen
Family Income Brackets in Goshen
According to the Goshen family income data, there are 46 families falling into the $35,000 to $49,999 income range, which is the most common income bracket and makes up 39.0% of all families. Conversely, the less than $10,000 income bracket is the least frequent group with only 2 families (1.7%) belonging to this category.
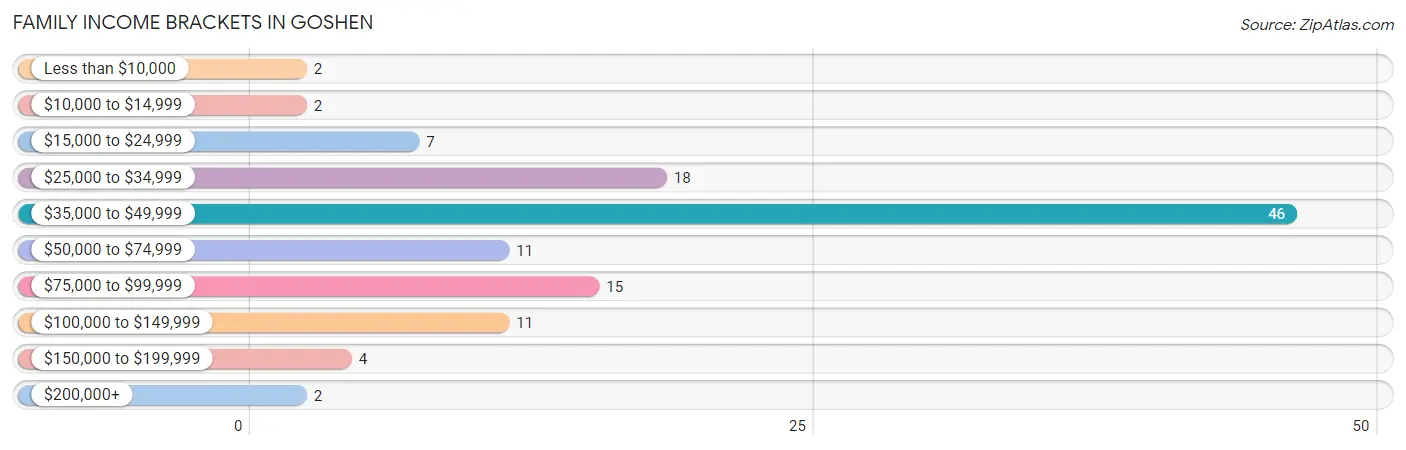
| Income Bracket | # Families | % Families |
| Less than $10,000 | 2 | 1.7% |
| $10,000 to $14,999 | 2 | 1.7% |
| $15,000 to $24,999 | 7 | 5.9% |
| $25,000 to $34,999 | 18 | 15.3% |
| $35,000 to $49,999 | 46 | 39.0% |
| $50,000 to $74,999 | 11 | 9.3% |
| $75,000 to $99,999 | 15 | 12.7% |
| $100,000 to $149,999 | 11 | 9.3% |
| $150,000 to $199,999 | 4 | 3.4% |
| $200,000+ | 2 | 1.7% |
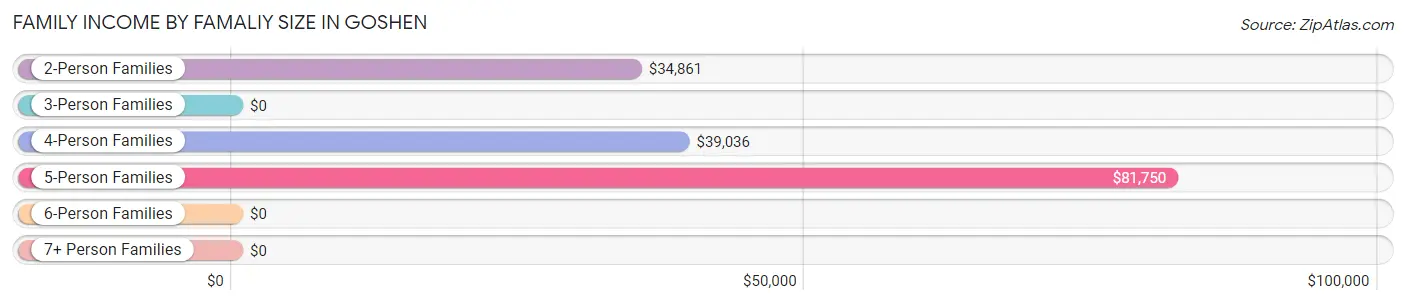
Family Income by Famaliy Size in Goshen
5-person families (11 | 9.3%) account for the highest median family income in Goshen with $81,750 per family, while 2-person families (57 | 48.3%) have the highest median income of $17,430 per family member.
| Income Bracket | # Families | Median Income |
| 2-Person Families | 57 (48.3%) | $34,861 |
| 3-Person Families | 4 (3.4%) | $0 |
| 4-Person Families | 43 (36.4%) | $39,036 |
| 5-Person Families | 11 (9.3%) | $81,750 |
| 6-Person Families | 0 (0.0%) | $0 |
| 7+ Person Families | 3 (2.5%) | $0 |
| Total | 118 (100.0%) | $39,583 |
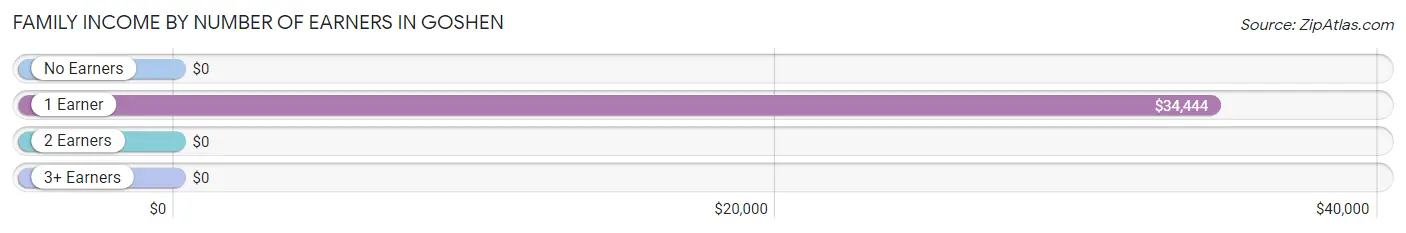
Family Income by Number of Earners in Goshen
| Number of Earners | # Families | Median Income |
| No Earners | 18 (15.2%) | $0 |
| 1 Earner | 28 (23.7%) | $34,444 |
| 2 Earners | 65 (55.1%) | $0 |
| 3+ Earners | 7 (5.9%) | $0 |
| Total | 118 (100.0%) | $39,583 |
Household Income in Goshen
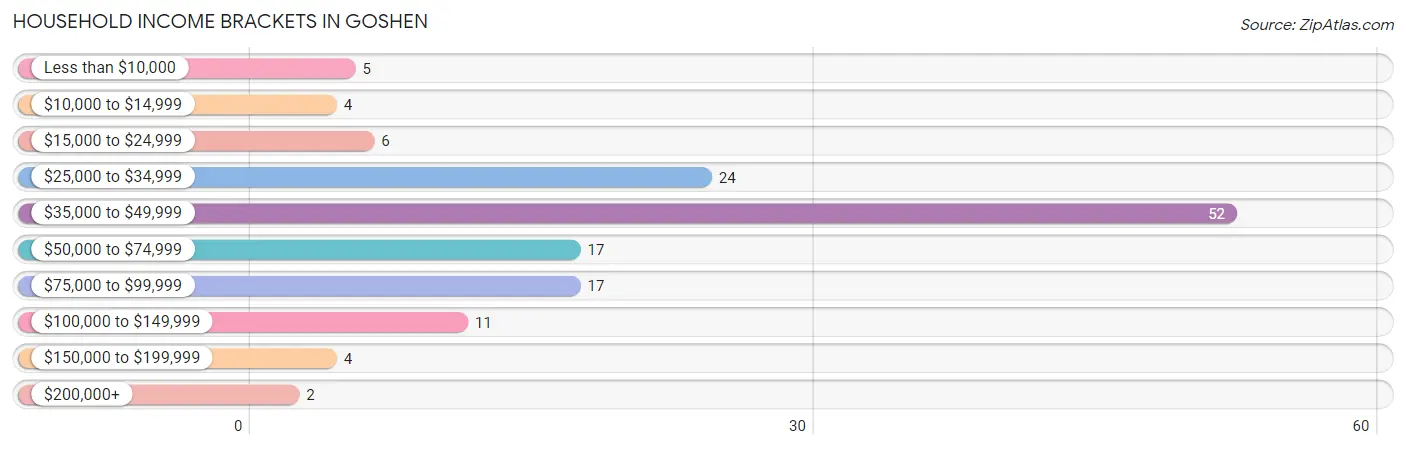
Household Income Brackets in Goshen
With 52 households falling in the category, the $35,000 to $49,999 income range is the most frequent in Goshen, accounting for 36.6% of all households. In contrast, only 2 households (1.4%) fall into the $200,000+ income bracket, making it the least populous group.
| Income Bracket | # Households | % Households |
| Less than $10,000 | 5 | 3.5% |
| $10,000 to $14,999 | 4 | 2.8% |
| $15,000 to $24,999 | 6 | 4.2% |
| $25,000 to $34,999 | 24 | 16.9% |
| $35,000 to $49,999 | 52 | 36.6% |
| $50,000 to $74,999 | 17 | 12.0% |
| $75,000 to $99,999 | 17 | 12.0% |
| $100,000 to $149,999 | 11 | 7.7% |
| $150,000 to $199,999 | 4 | 2.8% |
| $200,000+ | 2 | 1.4% |
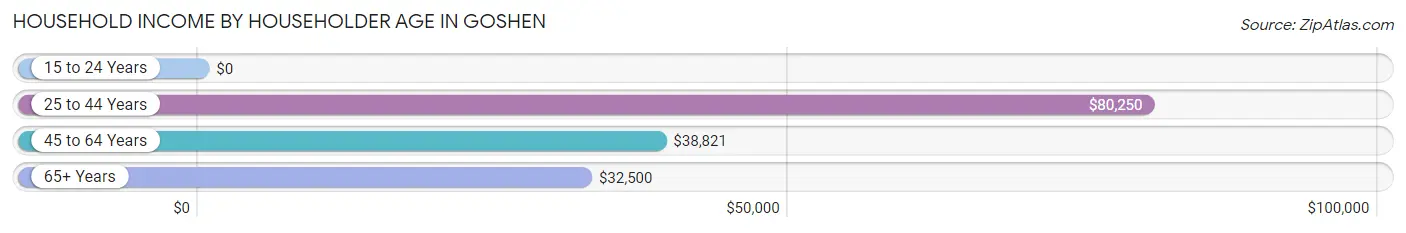
Household Income by Householder Age in Goshen
The median household income in Goshen is $39,722, with the highest median household income of $80,250 found in the 25 to 44 years age bracket for the primary householder. A total of 33 households (23.2%) fall into this category. Meanwhile, the 15 to 24 years age bracket for the primary householder has the lowest median household income of $0, with 2 households (1.4%) in this group.
| Income Bracket | # Households | Median Income |
| 15 to 24 Years | 2 (1.4%) | $0 |
| 25 to 44 Years | 33 (23.2%) | $80,250 |
| 45 to 64 Years | 79 (55.6%) | $38,821 |
| 65+ Years | 28 (19.7%) | $32,500 |
| Total | 142 (100.0%) | $39,722 |
Poverty in Goshen
Income Below Poverty by Sex and Age in Goshen
With 10.8% poverty level for males and 6.1% for females among the residents of Goshen, 35 to 44 year old males and 18 to 24 year old females are the most vulnerable to poverty, with 19 males (45.2%) and 2 females (66.7%) in their respective age groups living below the poverty level.
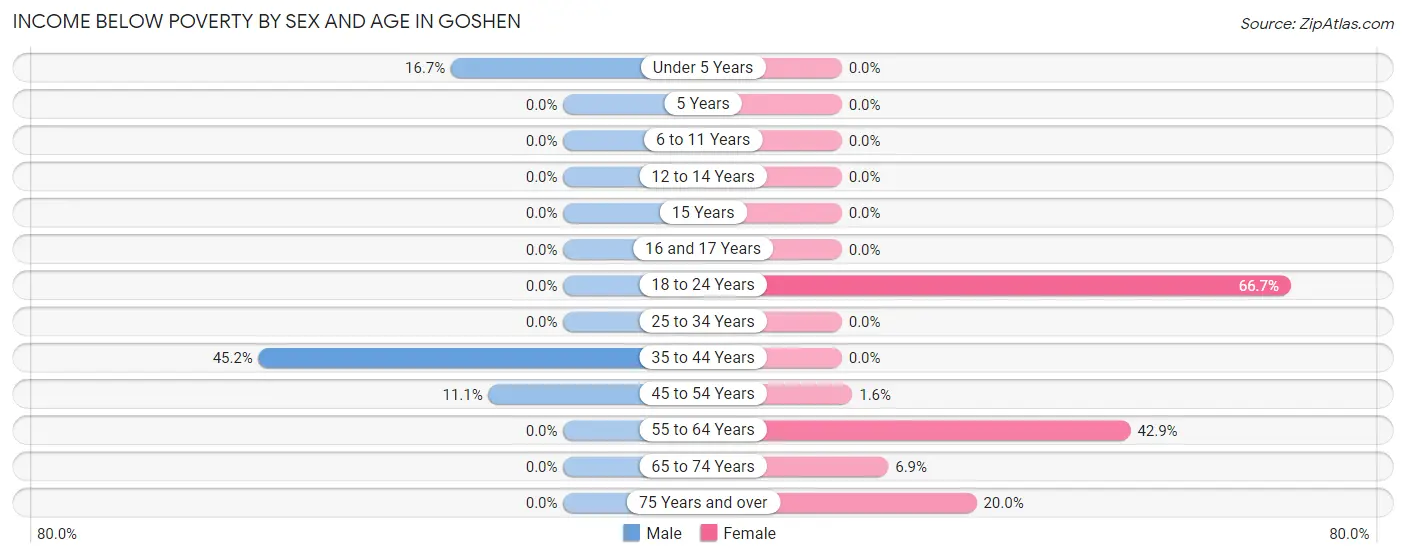
| Age Bracket | Male | Female |
| Under 5 Years | 1 (16.7%) | 0 (0.0%) |
| 5 Years | 0 (0.0%) | 0 (0.0%) |
| 6 to 11 Years | 0 (0.0%) | 0 (0.0%) |
| 12 to 14 Years | 0 (0.0%) | 0 (0.0%) |
| 15 Years | 0 (0.0%) | 0 (0.0%) |
| 16 and 17 Years | 0 (0.0%) | 0 (0.0%) |
| 18 to 24 Years | 0 (0.0%) | 2 (66.7%) |
| 25 to 34 Years | 0 (0.0%) | 0 (0.0%) |
| 35 to 44 Years | 19 (45.2%) | 0 (0.0%) |
| 45 to 54 Years | 2 (11.1%) | 1 (1.6%) |
| 55 to 64 Years | 0 (0.0%) | 9 (42.9%) |
| 65 to 74 Years | 0 (0.0%) | 2 (6.9%) |
| 75 Years and over | 0 (0.0%) | 1 (20.0%) |
| Total | 22 (10.8%) | 15 (6.1%) |
Income Above Poverty by Sex and Age in Goshen
According to the poverty statistics in Goshen, males aged 5 years and females aged 6 to 11 years are the age groups that are most secure financially, with 100.0% of males and 100.0% of females in these age groups living above the poverty line.
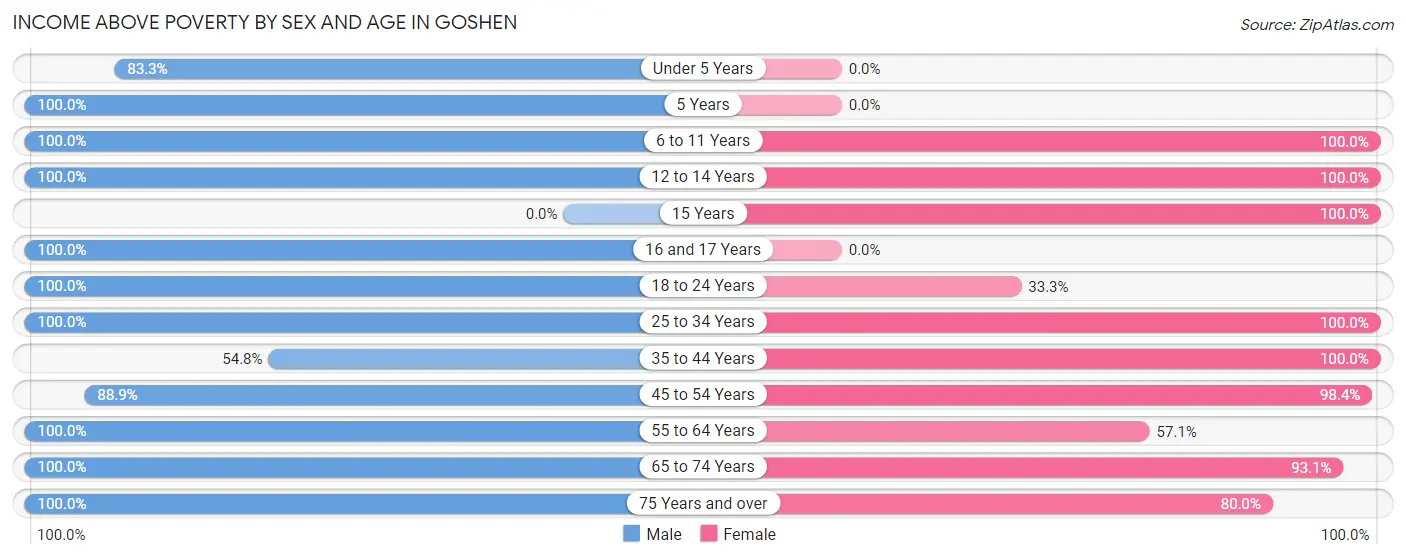
| Age Bracket | Male | Female |
| Under 5 Years | 5 (83.3%) | 0 (0.0%) |
| 5 Years | 6 (100.0%) | 0 (0.0%) |
| 6 to 11 Years | 47 (100.0%) | 16 (100.0%) |
| 12 to 14 Years | 6 (100.0%) | 5 (100.0%) |
| 15 Years | 0 (0.0%) | 26 (100.0%) |
| 16 and 17 Years | 21 (100.0%) | 0 (0.0%) |
| 18 to 24 Years | 8 (100.0%) | 1 (33.3%) |
| 25 to 34 Years | 13 (100.0%) | 26 (100.0%) |
| 35 to 44 Years | 23 (54.8%) | 49 (100.0%) |
| 45 to 54 Years | 16 (88.9%) | 63 (98.4%) |
| 55 to 64 Years | 8 (100.0%) | 12 (57.1%) |
| 65 to 74 Years | 25 (100.0%) | 27 (93.1%) |
| 75 Years and over | 3 (100.0%) | 4 (80.0%) |
| Total | 181 (89.2%) | 229 (93.9%) |
Income Below Poverty Among Married-Couple Families in Goshen
The poverty statistics for married-couple families in Goshen show that 3.2% or 2 of the total 63 families live below the poverty line. Families with no children have the highest poverty rate of 5.4%, comprising of 2 families. On the other hand, families with 1 or 2 children have the lowest poverty rate of 0.0%, which includes 0 families.
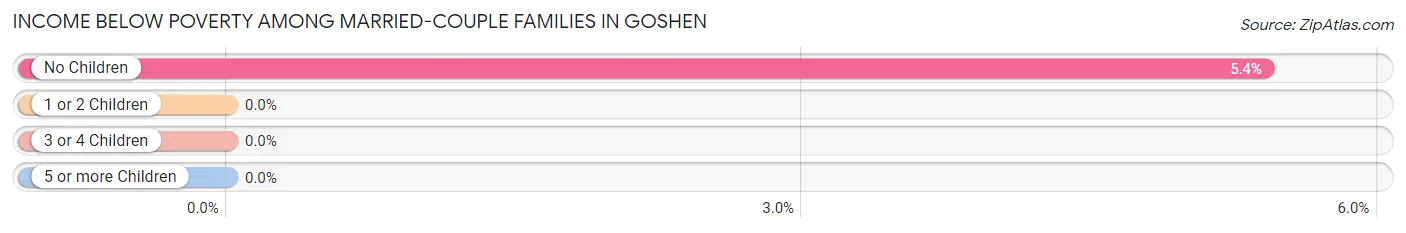
| Children | Above Poverty | Below Poverty |
| No Children | 35 (94.6%) | 2 (5.4%) |
| 1 or 2 Children | 16 (100.0%) | 0 (0.0%) |
| 3 or 4 Children | 10 (100.0%) | 0 (0.0%) |
| 5 or more Children | 0 (0.0%) | 0 (0.0%) |
| Total | 61 (96.8%) | 2 (3.2%) |
Income Below Poverty Among Single-Parent Households in Goshen
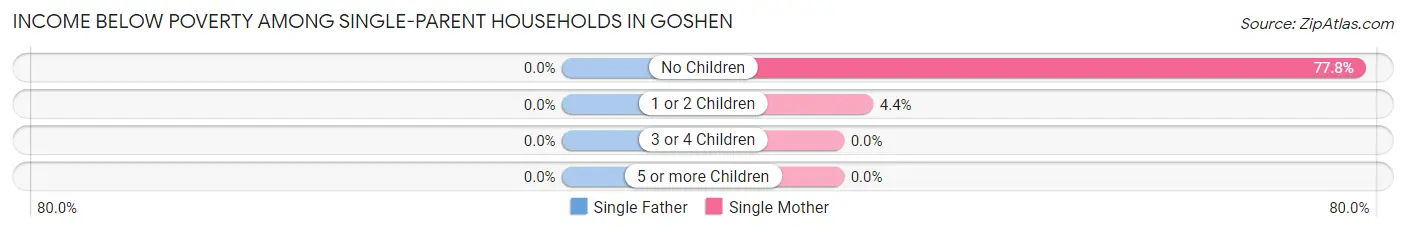
| Children | Single Father | Single Mother |
| No Children | 0 (0.0%) | 7 (77.8%) |
| 1 or 2 Children | 0 (0.0%) | 2 (4.3%) |
| 3 or 4 Children | 0 (0.0%) | 0 (0.0%) |
| 5 or more Children | 0 (0.0%) | 0 (0.0%) |
| Total | 0 (0.0%) | 9 (16.4%) |
Income Below Poverty Among Married-Couple vs Single-Parent Households in Goshen
The poverty data for Goshen shows that 2 of the married-couple family households (3.2%) and 9 of the single-parent households (16.4%) are living below the poverty level. Within the married-couple family households, those with no children have the highest poverty rate, with 2 households (5.4%) falling below the poverty line. Among the single-parent households, those with no children have the highest poverty rate, with 7 household (77.8%) living below poverty.
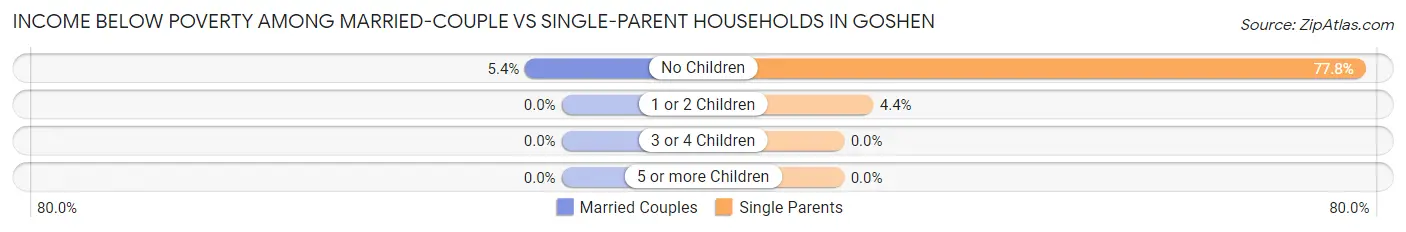
| Children | Married-Couple Families | Single-Parent Households |
| No Children | 2 (5.4%) | 7 (77.8%) |
| 1 or 2 Children | 0 (0.0%) | 2 (4.3%) |
| 3 or 4 Children | 0 (0.0%) | 0 (0.0%) |
| 5 or more Children | 0 (0.0%) | 0 (0.0%) |
| Total | 2 (3.2%) | 9 (16.4%) |
Employment Characteristics in Goshen
Employment by Class of Employer in Goshen
Among the 181 employed individuals in Goshen, private company employees (86 | 47.5%), local government employees (49 | 27.1%), and self-employed (incorporated) (15 | 8.3%) make up the most common classes of employment.
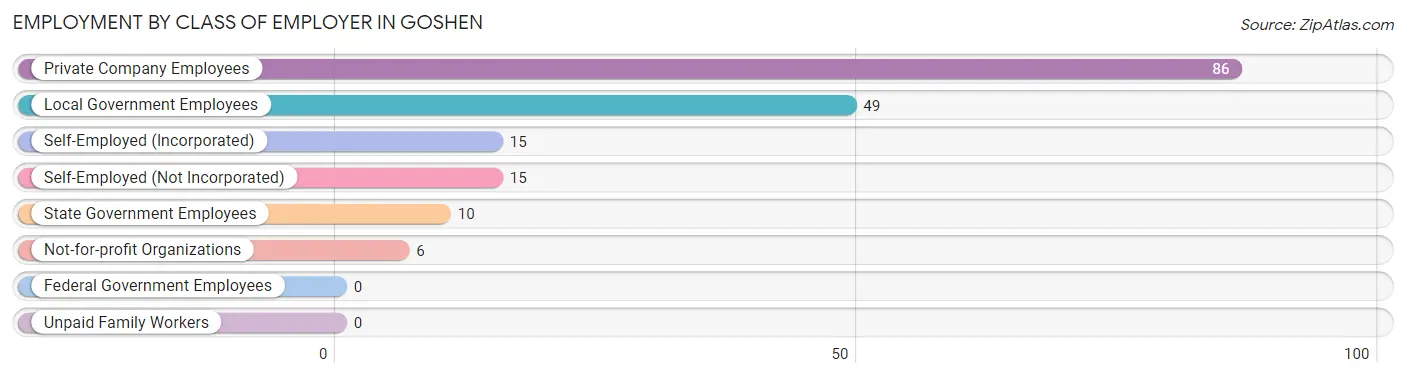
| Employer Class | # Employees | % Employees |
| Private Company Employees | 86 | 47.5% |
| Self-Employed (Incorporated) | 15 | 8.3% |
| Self-Employed (Not Incorporated) | 15 | 8.3% |
| Not-for-profit Organizations | 6 | 3.3% |
| Local Government Employees | 49 | 27.1% |
| State Government Employees | 10 | 5.5% |
| Federal Government Employees | 0 | 0.0% |
| Unpaid Family Workers | 0 | 0.0% |
| Total | 181 | 100.0% |
Employment Status by Age in Goshen
According to the labor force statistics for Goshen, out of the total population over 16 years of age (335), 57.3% or 192 individuals are in the labor force, with 5.2% or 10 of them unemployed. The age group with the highest labor force participation rate is 20 to 24 years, with 100.0% or 3 individuals in the labor force. Within the labor force, the 20 to 24 years age range has the highest percentage of unemployed individuals, with 66.7% or 2 of them being unemployed.
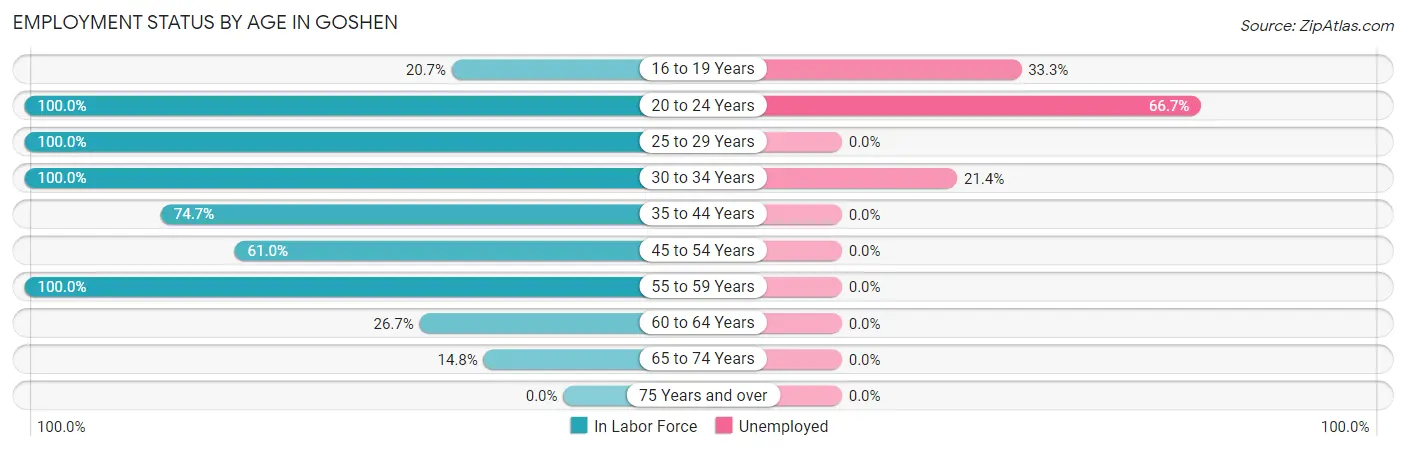
| Age Bracket | In Labor Force | Unemployed |
| 16 to 19 Years | 6 (20.7%) | 2 (33.3%) |
| 20 to 24 Years | 3 (100.0%) | 2 (66.7%) |
| 25 to 29 Years | 11 (100.0%) | 0 (0.0%) |
| 30 to 34 Years | 28 (100.0%) | 6 (21.4%) |
| 35 to 44 Years | 68 (74.7%) | 0 (0.0%) |
| 45 to 54 Years | 50 (61.0%) | 0 (0.0%) |
| 55 to 59 Years | 14 (100.0%) | 0 (0.0%) |
| 60 to 64 Years | 4 (26.7%) | 0 (0.0%) |
| 65 to 74 Years | 8 (14.8%) | 0 (0.0%) |
| 75 Years and over | 0 (0.0%) | 0 (0.0%) |
| Total | 192 (57.3%) | 10 (5.2%) |
Employment Status by Educational Attainment in Goshen
According to labor force statistics for Goshen, 72.6% of individuals (175) out of the total population between 25 and 64 years of age (241) are in the labor force, with 3.4% or 6 of them being unemployed. The group with the highest labor force participation rate are those with the educational attainment of college / associate degree, with 93.7% or 59 individuals in the labor force. Within the labor force, individuals with high school diploma education have the highest percentage of unemployment, with 6.5% or 6 of them being unemployed.
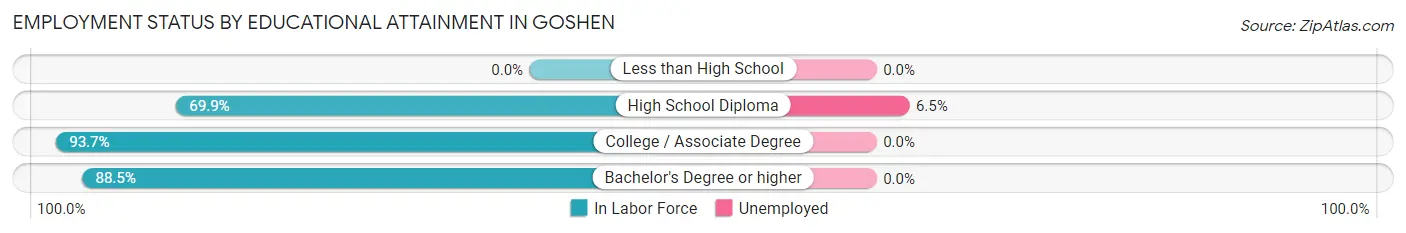
| Educational Attainment | In Labor Force | Unemployed |
| Less than High School | 0 (0.0%) | 0 (0.0%) |
| High School Diploma | 93 (69.9%) | 9 (6.5%) |
| College / Associate Degree | 59 (93.7%) | 0 (0.0%) |
| Bachelor's Degree or higher | 23 (88.5%) | 0 (0.0%) |
| Total | 175 (72.6%) | 8 (3.4%) |
Employment Occupations by Sex in Goshen
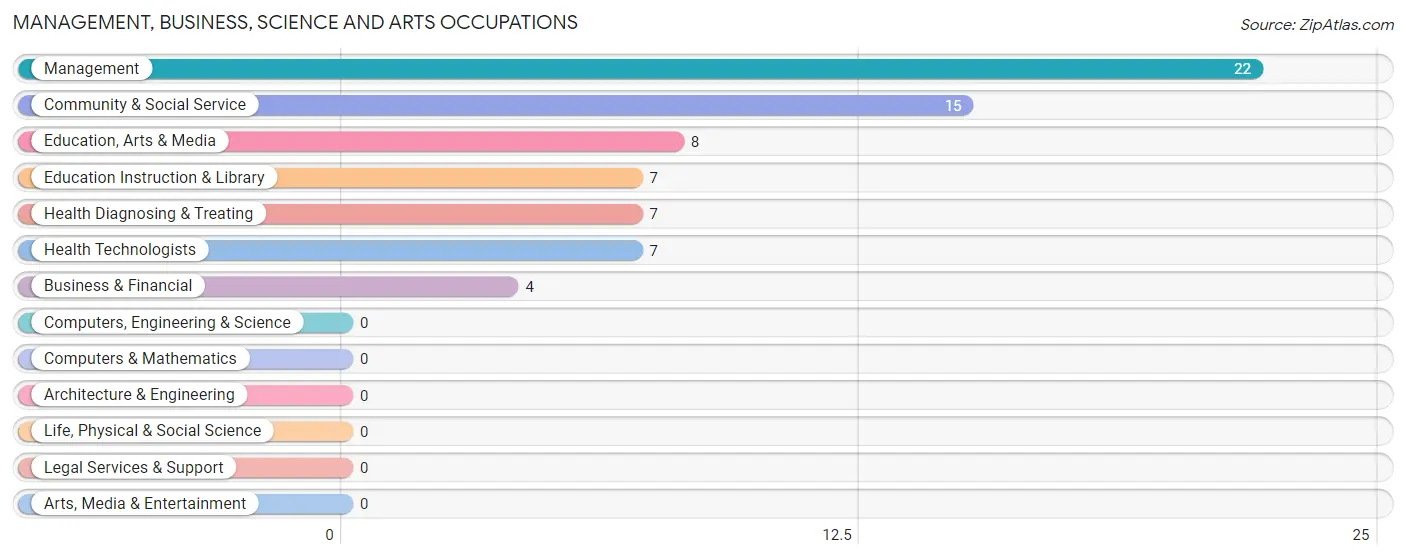
Management, Business, Science and Arts Occupations
The most common Management, Business, Science and Arts occupations in Goshen are Management (22 | 12.1%), Community & Social Service (15 | 8.2%), Education, Arts & Media (8 | 4.4%), Education Instruction & Library (7 | 3.8%), and Health Diagnosing & Treating (7 | 3.8%).
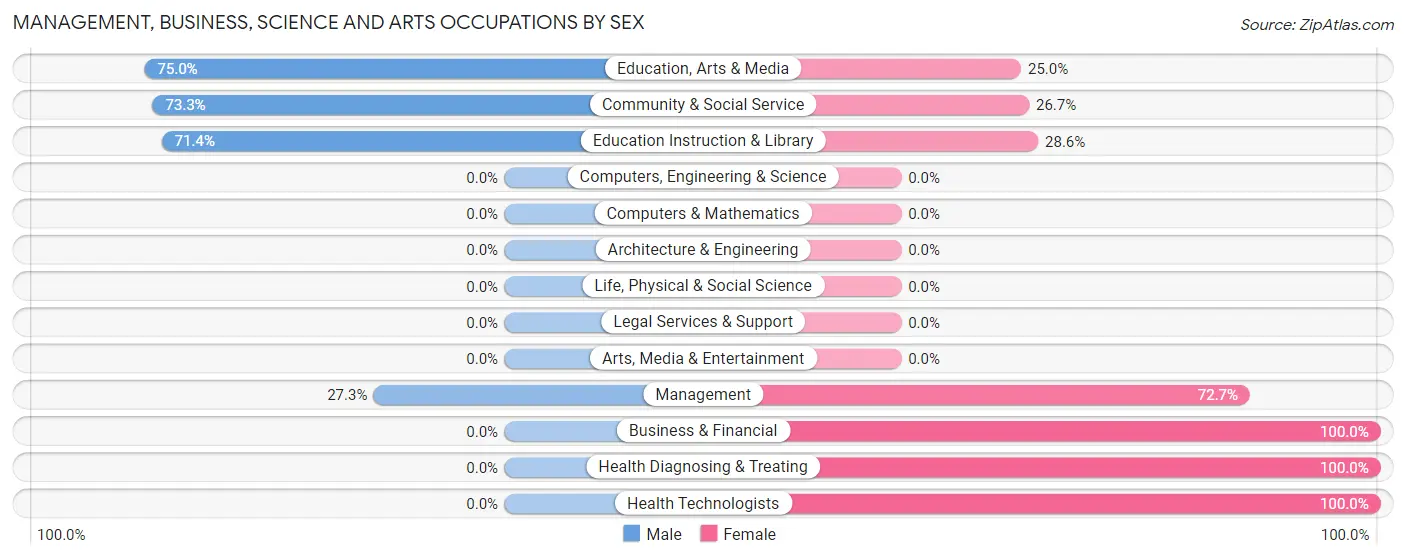
Management, Business, Science and Arts Occupations by Sex
Within the Management, Business, Science and Arts occupations in Goshen, the most male-oriented occupations are Education, Arts & Media (75.0%), Community & Social Service (73.3%), and Education Instruction & Library (71.4%), while the most female-oriented occupations are Business & Financial (100.0%), Health Diagnosing & Treating (100.0%), and Health Technologists (100.0%).
| Occupation | Male | Female |
| Management | 6 (27.3%) | 16 (72.7%) |
| Business & Financial | 0 (0.0%) | 4 (100.0%) |
| Computers, Engineering & Science | 0 (0.0%) | 0 (0.0%) |
| Computers & Mathematics | 0 (0.0%) | 0 (0.0%) |
| Architecture & Engineering | 0 (0.0%) | 0 (0.0%) |
| Life, Physical & Social Science | 0 (0.0%) | 0 (0.0%) |
| Community & Social Service | 11 (73.3%) | 4 (26.7%) |
| Education, Arts & Media | 6 (75.0%) | 2 (25.0%) |
| Legal Services & Support | 0 (0.0%) | 0 (0.0%) |
| Education Instruction & Library | 5 (71.4%) | 2 (28.6%) |
| Arts, Media & Entertainment | 0 (0.0%) | 0 (0.0%) |
| Health Diagnosing & Treating | 0 (0.0%) | 7 (100.0%) |
| Health Technologists | 0 (0.0%) | 7 (100.0%) |
| Total (Category) | 17 (35.4%) | 31 (64.6%) |
| Total (Overall) | 59 (32.4%) | 123 (67.6%) |
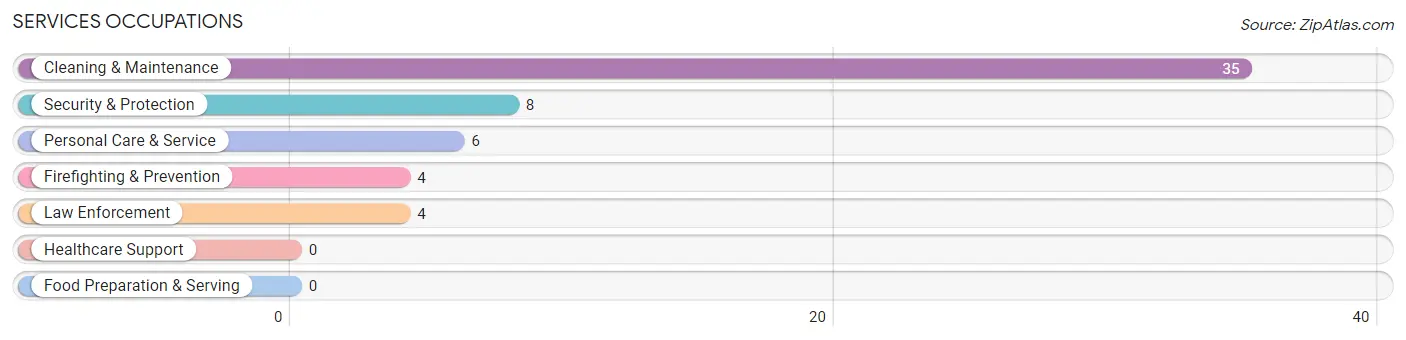
Services Occupations
The most common Services occupations in Goshen are Cleaning & Maintenance (35 | 19.2%), Security & Protection (8 | 4.4%), Personal Care & Service (6 | 3.3%), Firefighting & Prevention (4 | 2.2%), and Law Enforcement (4 | 2.2%).
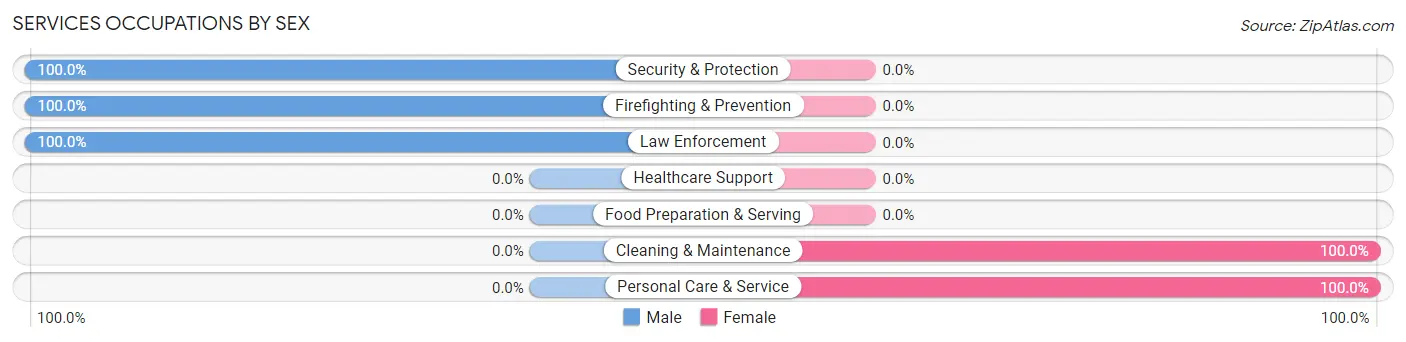
Services Occupations by Sex
Within the Services occupations in Goshen, the most male-oriented occupations are Security & Protection (100.0%), Firefighting & Prevention (100.0%), and Law Enforcement (100.0%), while the most female-oriented occupations are Cleaning & Maintenance (100.0%), and Personal Care & Service (100.0%).
| Occupation | Male | Female |
| Healthcare Support | 0 (0.0%) | 0 (0.0%) |
| Security & Protection | 8 (100.0%) | 0 (0.0%) |
| Firefighting & Prevention | 4 (100.0%) | 0 (0.0%) |
| Law Enforcement | 4 (100.0%) | 0 (0.0%) |
| Food Preparation & Serving | 0 (0.0%) | 0 (0.0%) |
| Cleaning & Maintenance | 0 (0.0%) | 35 (100.0%) |
| Personal Care & Service | 0 (0.0%) | 6 (100.0%) |
| Total (Category) | 8 (16.3%) | 41 (83.7%) |
| Total (Overall) | 59 (32.4%) | 123 (67.6%) |
Sales and Office Occupations
The most common Sales and Office occupations in Goshen are Sales & Related (56 | 30.8%), and Office & Administration (4 | 2.2%).
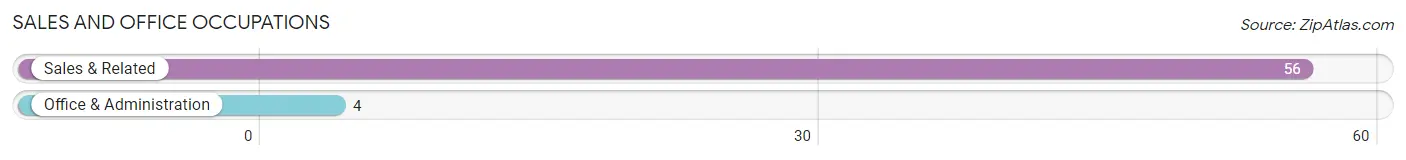
Sales and Office Occupations by Sex
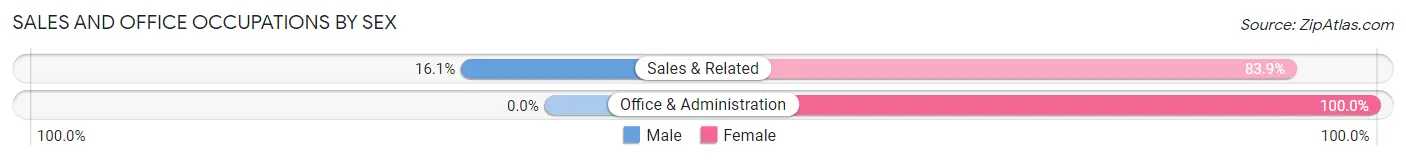
| Occupation | Male | Female |
| Sales & Related | 9 (16.1%) | 47 (83.9%) |
| Office & Administration | 0 (0.0%) | 4 (100.0%) |
| Total (Category) | 9 (15.0%) | 51 (85.0%) |
| Total (Overall) | 59 (32.4%) | 123 (67.6%) |
Natural Resources, Construction and Maintenance Occupations
The most common Natural Resources, Construction and Maintenance occupations in Goshen are , and Construction & Extraction (7 | 3.8%).
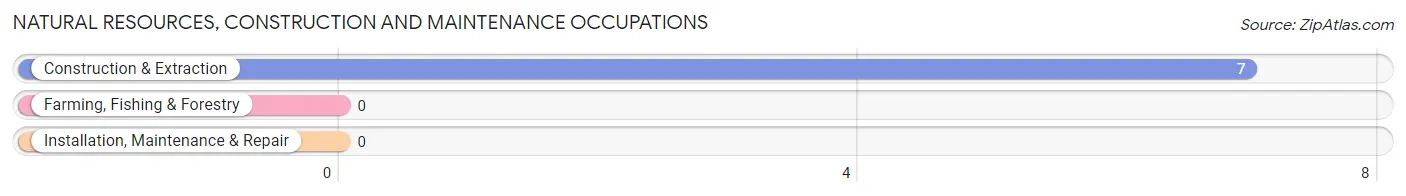
Natural Resources, Construction and Maintenance Occupations by Sex
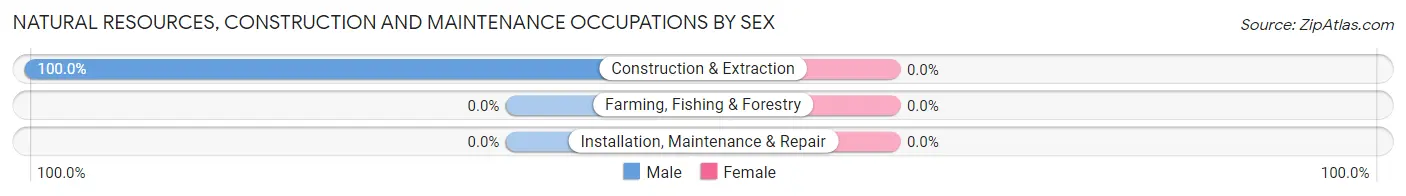
| Occupation | Male | Female |
| Farming, Fishing & Forestry | 0 (0.0%) | 0 (0.0%) |
| Construction & Extraction | 7 (100.0%) | 0 (0.0%) |
| Installation, Maintenance & Repair | 0 (0.0%) | 0 (0.0%) |
| Total (Category) | 7 (100.0%) | 0 (0.0%) |
| Total (Overall) | 59 (32.4%) | 123 (67.6%) |
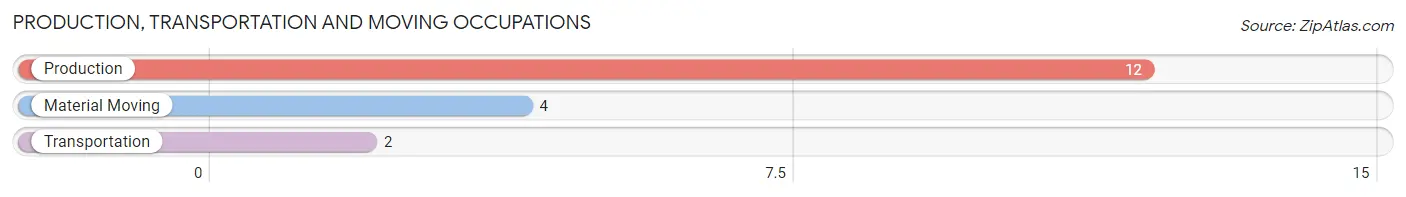
Production, Transportation and Moving Occupations
The most common Production, Transportation and Moving occupations in Goshen are Production (12 | 6.6%), Material Moving (4 | 2.2%), and Transportation (2 | 1.1%).
Production, Transportation and Moving Occupations by Sex
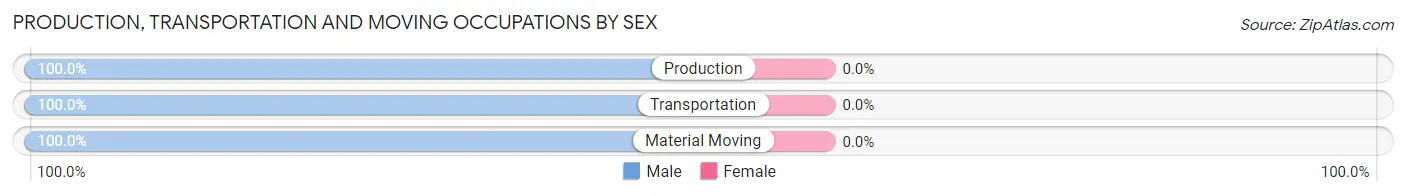
| Occupation | Male | Female |
| Production | 12 (100.0%) | 0 (0.0%) |
| Transportation | 2 (100.0%) | 0 (0.0%) |
| Material Moving | 4 (100.0%) | 0 (0.0%) |
| Total (Category) | 18 (100.0%) | 0 (0.0%) |
| Total (Overall) | 59 (32.4%) | 123 (67.6%) |
Employment Industries by Sex in Goshen
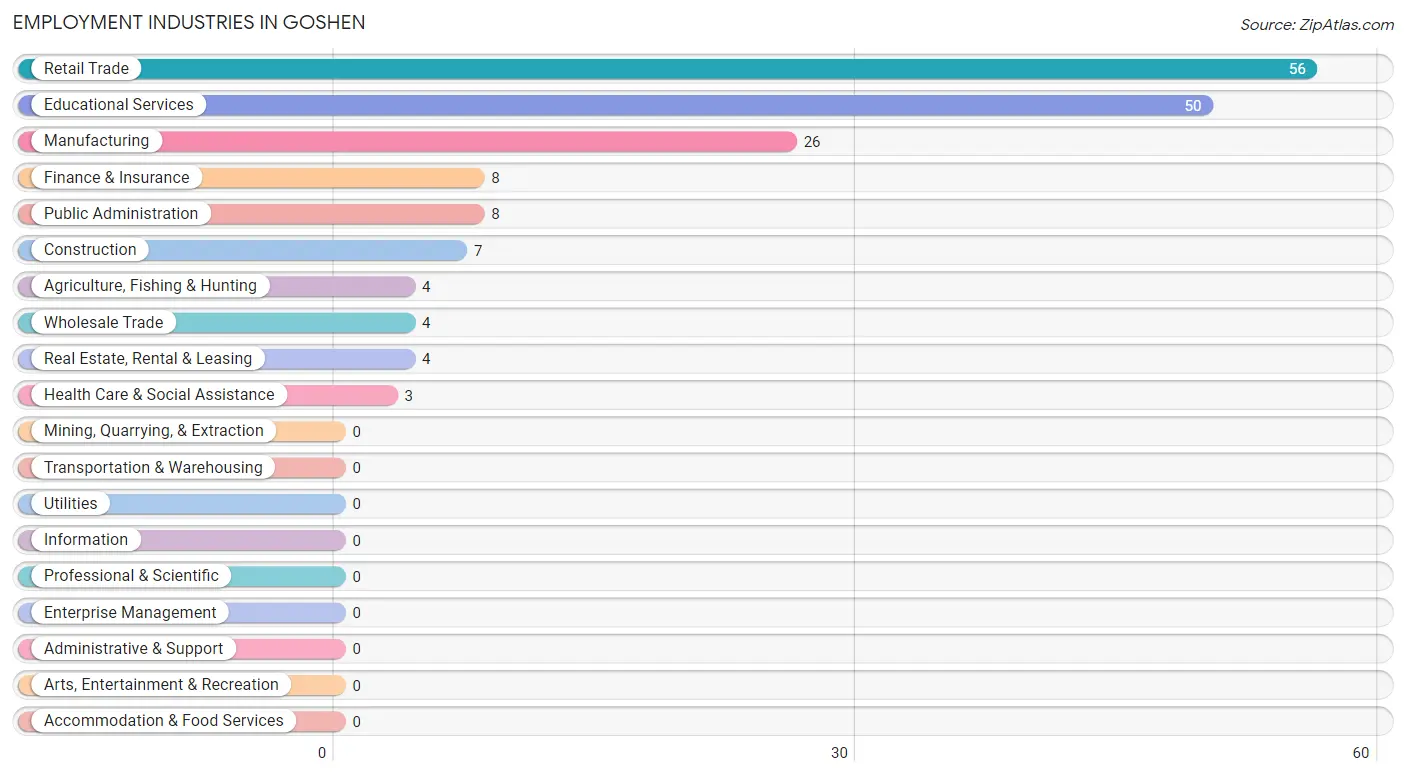
Employment Industries in Goshen
The major employment industries in Goshen include Retail Trade (56 | 30.8%), Educational Services (50 | 27.5%), Manufacturing (26 | 14.3%), Finance & Insurance (8 | 4.4%), and Public Administration (8 | 4.4%).
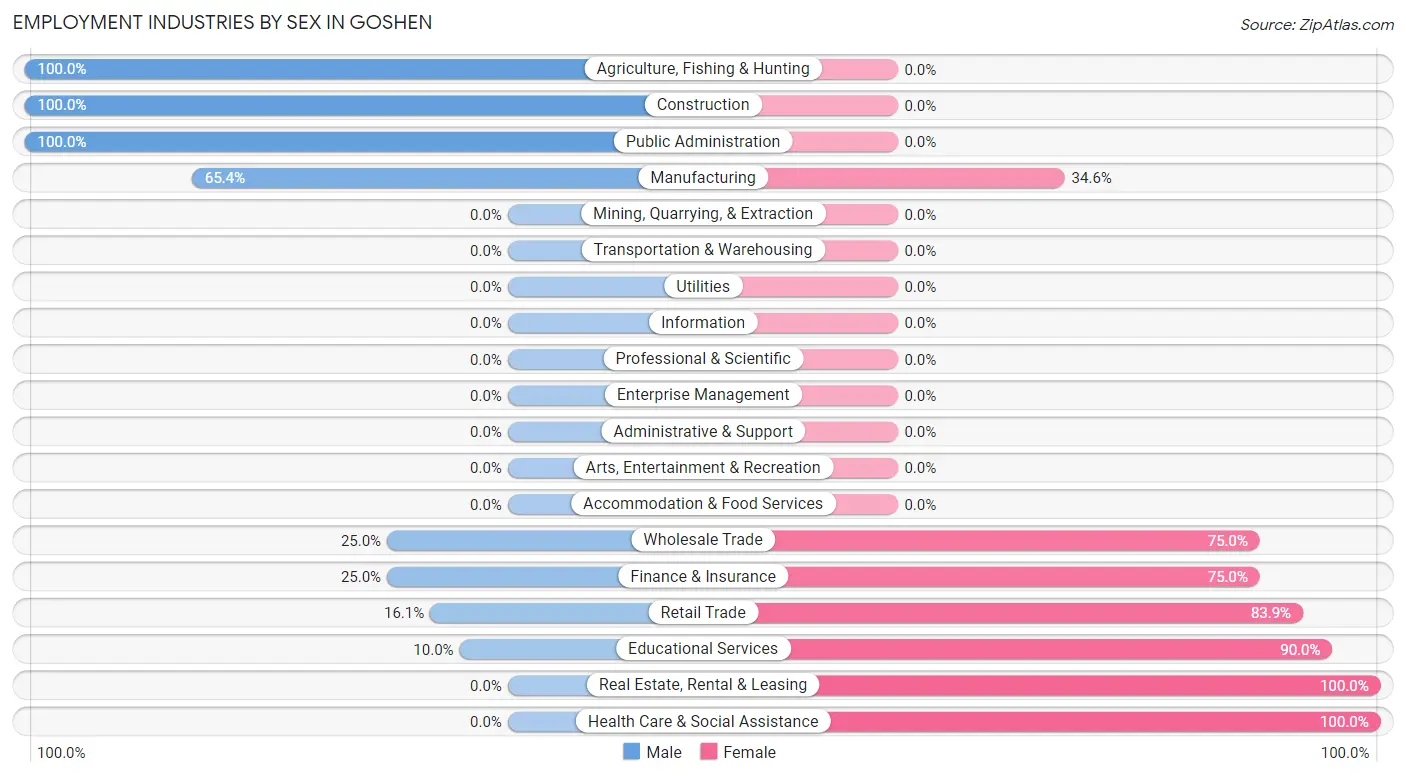
Employment Industries by Sex in Goshen
The Goshen industries that see more men than women are Agriculture, Fishing & Hunting (100.0%), Construction (100.0%), and Public Administration (100.0%), whereas the industries that tend to have a higher number of women are Real Estate, Rental & Leasing (100.0%), Health Care & Social Assistance (100.0%), and Educational Services (90.0%).
| Industry | Male | Female |
| Agriculture, Fishing & Hunting | 4 (100.0%) | 0 (0.0%) |
| Mining, Quarrying, & Extraction | 0 (0.0%) | 0 (0.0%) |
| Construction | 7 (100.0%) | 0 (0.0%) |
| Manufacturing | 17 (65.4%) | 9 (34.6%) |
| Wholesale Trade | 1 (25.0%) | 3 (75.0%) |
| Retail Trade | 9 (16.1%) | 47 (83.9%) |
| Transportation & Warehousing | 0 (0.0%) | 0 (0.0%) |
| Utilities | 0 (0.0%) | 0 (0.0%) |
| Information | 0 (0.0%) | 0 (0.0%) |
| Finance & Insurance | 2 (25.0%) | 6 (75.0%) |
| Real Estate, Rental & Leasing | 0 (0.0%) | 4 (100.0%) |
| Professional & Scientific | 0 (0.0%) | 0 (0.0%) |
| Enterprise Management | 0 (0.0%) | 0 (0.0%) |
| Administrative & Support | 0 (0.0%) | 0 (0.0%) |
| Educational Services | 5 (10.0%) | 45 (90.0%) |
| Health Care & Social Assistance | 0 (0.0%) | 3 (100.0%) |
| Arts, Entertainment & Recreation | 0 (0.0%) | 0 (0.0%) |
| Accommodation & Food Services | 0 (0.0%) | 0 (0.0%) |
| Public Administration | 8 (100.0%) | 0 (0.0%) |
| Total | 59 (32.4%) | 123 (67.6%) |
Education in Goshen
School Enrollment in Goshen
The most common levels of schooling among the 133 students in Goshen are elementary school (50 | 37.6%), high school (49 | 36.8%), and middle school (18 | 13.5%).
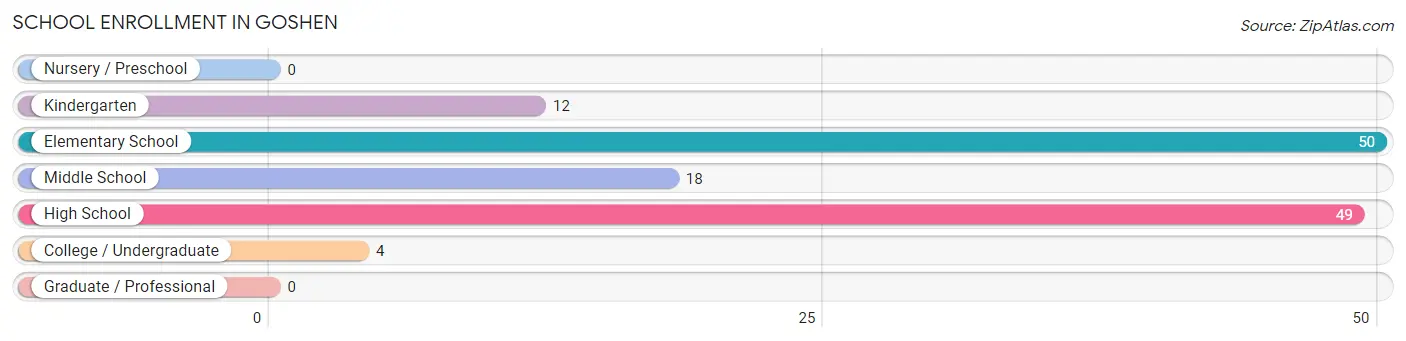
| School Level | # Students | % Students |
| Nursery / Preschool | 0 | 0.0% |
| Kindergarten | 12 | 9.0% |
| Elementary School | 50 | 37.6% |
| Middle School | 18 | 13.5% |
| High School | 49 | 36.8% |
| College / Undergraduate | 4 | 3.0% |
| Graduate / Professional | 0 | 0.0% |
| Total | 133 | 100.0% |
School Enrollment by Age by Funding Source in Goshen
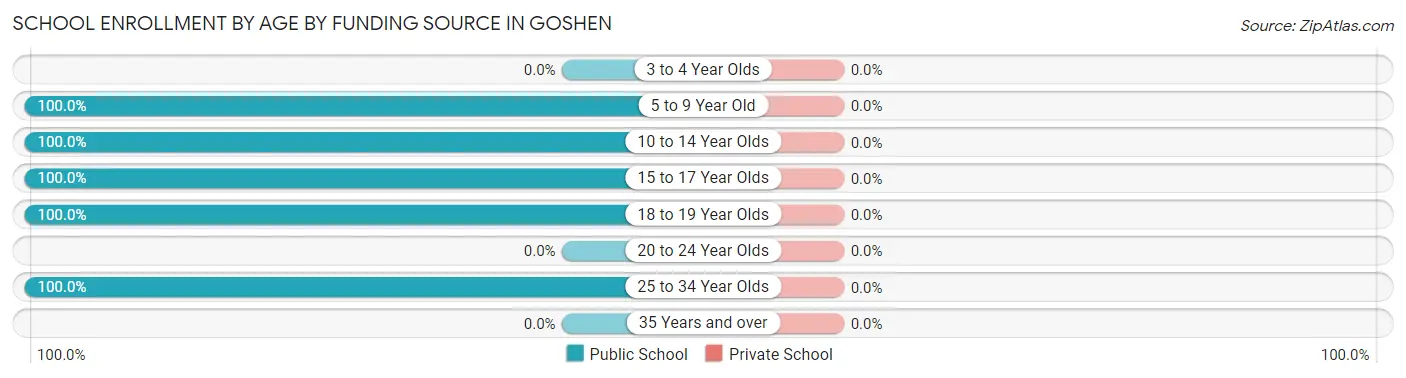
| Age Bracket | Public School | Private School |
| 3 to 4 Year Olds | 0 (0.0%) | 0 (0.0%) |
| 5 to 9 Year Old | 58 (100.0%) | 0 (0.0%) |
| 10 to 14 Year Olds | 22 (100.0%) | 0 (0.0%) |
| 15 to 17 Year Olds | 45 (100.0%) | 0 (0.0%) |
| 18 to 19 Year Olds | 4 (100.0%) | 0 (0.0%) |
| 20 to 24 Year Olds | 0 (0.0%) | 0 (0.0%) |
| 25 to 34 Year Olds | 4 (100.0%) | 0 (0.0%) |
| 35 Years and over | 0 (0.0%) | 0 (0.0%) |
| Total | 133 (100.0%) | 0 (0.0%) |
Educational Attainment by Field of Study in Goshen
Business (15 | 38.5%), education (11 | 28.2%), arts & humanities (8 | 20.5%), communications (4 | 10.3%), and liberal arts & history (1 | 2.6%) are the most common fields of study among 39 individuals in Goshen who have obtained a bachelor's degree or higher.
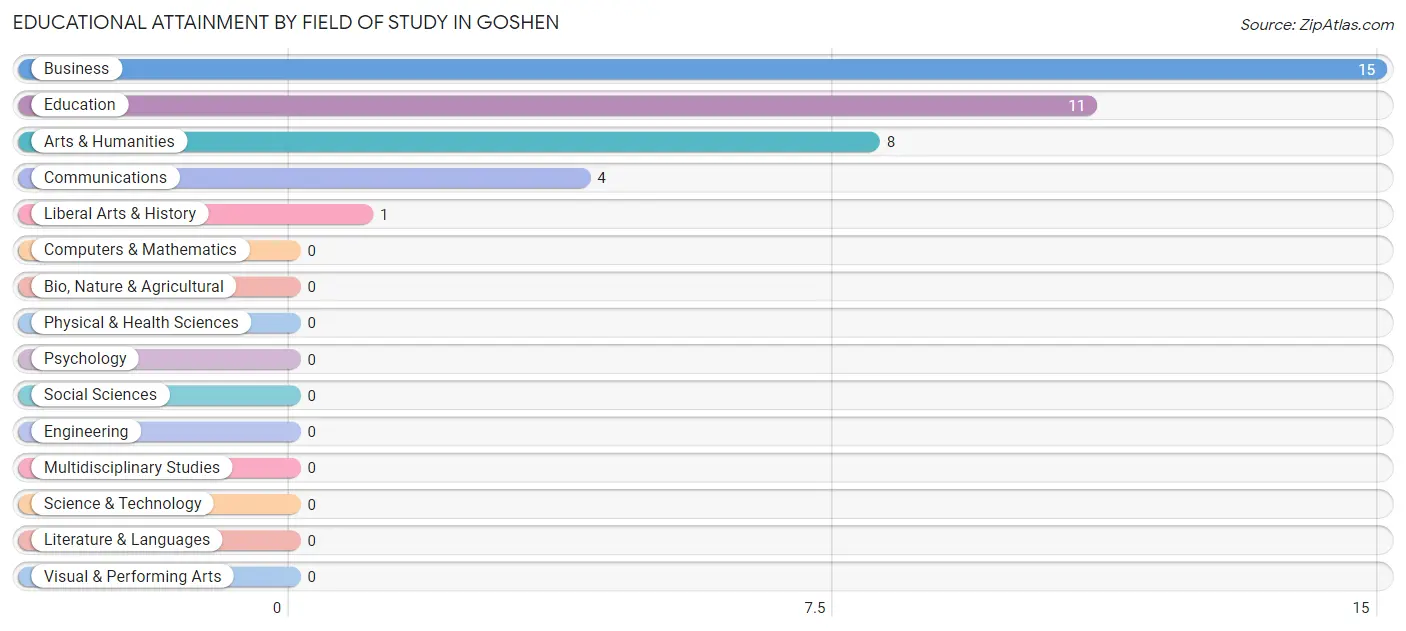
| Field of Study | # Graduates | % Graduates |
| Computers & Mathematics | 0 | 0.0% |
| Bio, Nature & Agricultural | 0 | 0.0% |
| Physical & Health Sciences | 0 | 0.0% |
| Psychology | 0 | 0.0% |
| Social Sciences | 0 | 0.0% |
| Engineering | 0 | 0.0% |
| Multidisciplinary Studies | 0 | 0.0% |
| Science & Technology | 0 | 0.0% |
| Business | 15 | 38.5% |
| Education | 11 | 28.2% |
| Literature & Languages | 0 | 0.0% |
| Liberal Arts & History | 1 | 2.6% |
| Visual & Performing Arts | 0 | 0.0% |
| Communications | 4 | 10.3% |
| Arts & Humanities | 8 | 20.5% |
| Total | 39 | 100.0% |
Transportation & Commute in Goshen
Vehicle Availability by Sex in Goshen
The most prevalent vehicle ownership categories in Goshen are males with 3 vehicles (23, accounting for 39.7%) and females with 3 vehicles (15, making up 18.7%).
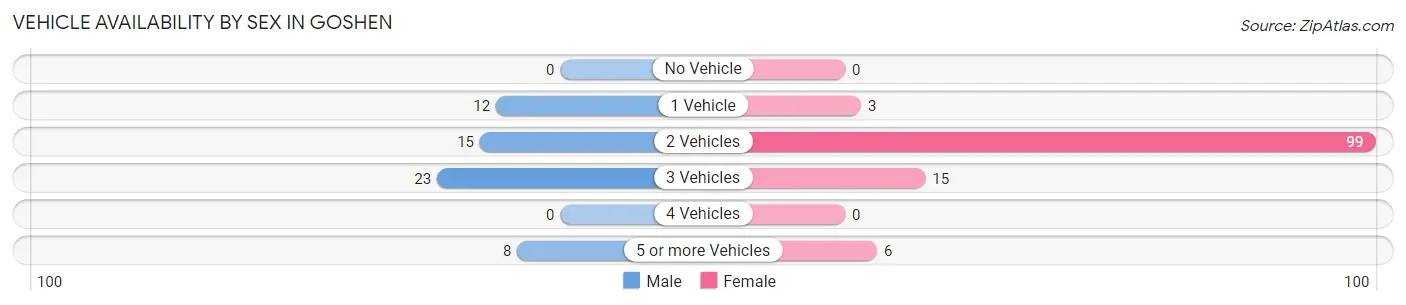
| Vehicles Available | Male | Female |
| No Vehicle | 0 (0.0%) | 0 (0.0%) |
| 1 Vehicle | 12 (20.7%) | 3 (2.4%) |
| 2 Vehicles | 15 (25.9%) | 99 (80.5%) |
| 3 Vehicles | 23 (39.7%) | 15 (12.2%) |
| 4 Vehicles | 0 (0.0%) | 0 (0.0%) |
| 5 or more Vehicles | 8 (13.8%) | 6 (4.9%) |
| Total | 58 (100.0%) | 123 (100.0%) |
Commute Time in Goshen
The most frequently occuring commute durations in Goshen are 5 to 9 minutes (50 commuters, 28.2%), 45 to 59 minutes (47 commuters, 26.6%), and 20 to 24 minutes (40 commuters, 22.6%).
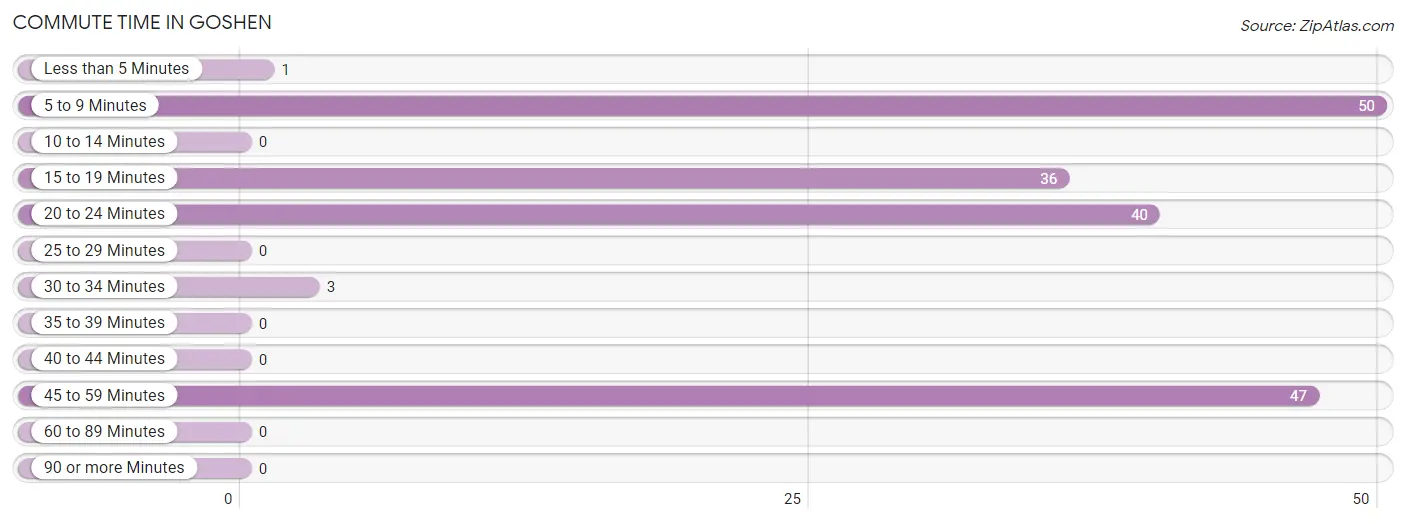
| Commute Time | # Commuters | % Commuters |
| Less than 5 Minutes | 1 | 0.6% |
| 5 to 9 Minutes | 50 | 28.2% |
| 10 to 14 Minutes | 0 | 0.0% |
| 15 to 19 Minutes | 36 | 20.3% |
| 20 to 24 Minutes | 40 | 22.6% |
| 25 to 29 Minutes | 0 | 0.0% |
| 30 to 34 Minutes | 3 | 1.7% |
| 35 to 39 Minutes | 0 | 0.0% |
| 40 to 44 Minutes | 0 | 0.0% |
| 45 to 59 Minutes | 47 | 26.6% |
| 60 to 89 Minutes | 0 | 0.0% |
| 90 or more Minutes | 0 | 0.0% |
Commute Time by Sex in Goshen
The most common commute times in Goshen are 20 to 24 minutes (21 commuters, 38.9%) for males and 5 to 9 minutes (42 commuters, 34.2%) for females.
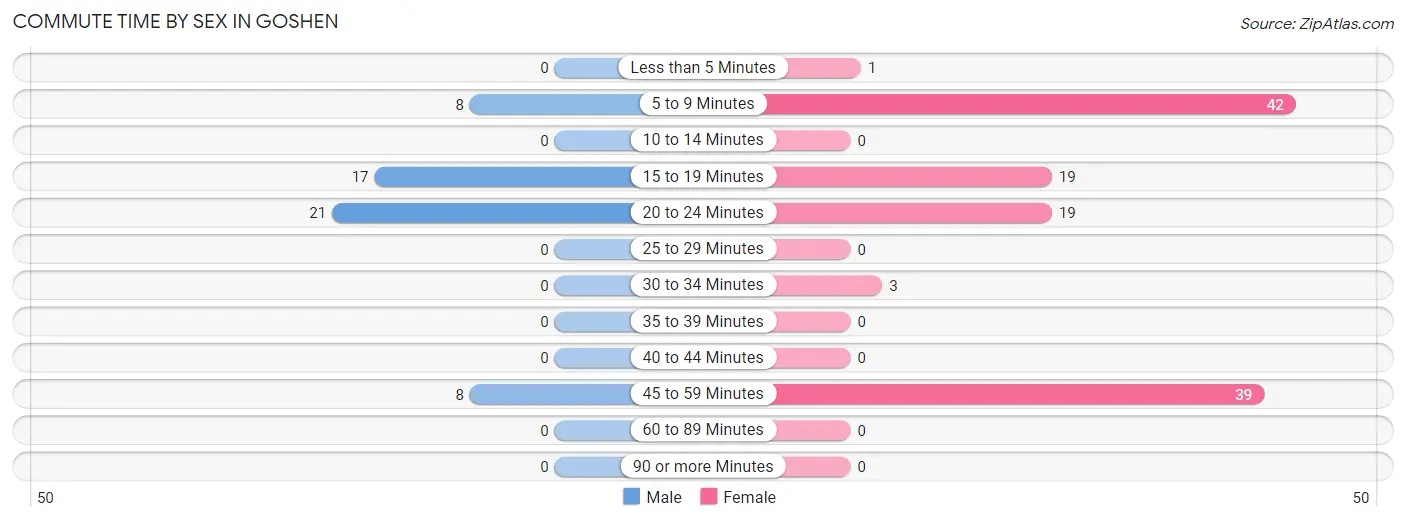
| Commute Time | Male | Female |
| Less than 5 Minutes | 0 (0.0%) | 1 (0.8%) |
| 5 to 9 Minutes | 8 (14.8%) | 42 (34.2%) |
| 10 to 14 Minutes | 0 (0.0%) | 0 (0.0%) |
| 15 to 19 Minutes | 17 (31.5%) | 19 (15.4%) |
| 20 to 24 Minutes | 21 (38.9%) | 19 (15.4%) |
| 25 to 29 Minutes | 0 (0.0%) | 0 (0.0%) |
| 30 to 34 Minutes | 0 (0.0%) | 3 (2.4%) |
| 35 to 39 Minutes | 0 (0.0%) | 0 (0.0%) |
| 40 to 44 Minutes | 0 (0.0%) | 0 (0.0%) |
| 45 to 59 Minutes | 8 (14.8%) | 39 (31.7%) |
| 60 to 89 Minutes | 0 (0.0%) | 0 (0.0%) |
| 90 or more Minutes | 0 (0.0%) | 0 (0.0%) |
Time of Departure to Work by Sex in Goshen
The most frequent times of departure to work in Goshen are 12:00 AM to 4:59 AM (17, 31.5%) for males and 8:30 AM to 8:59 AM (39, 31.7%) for females.
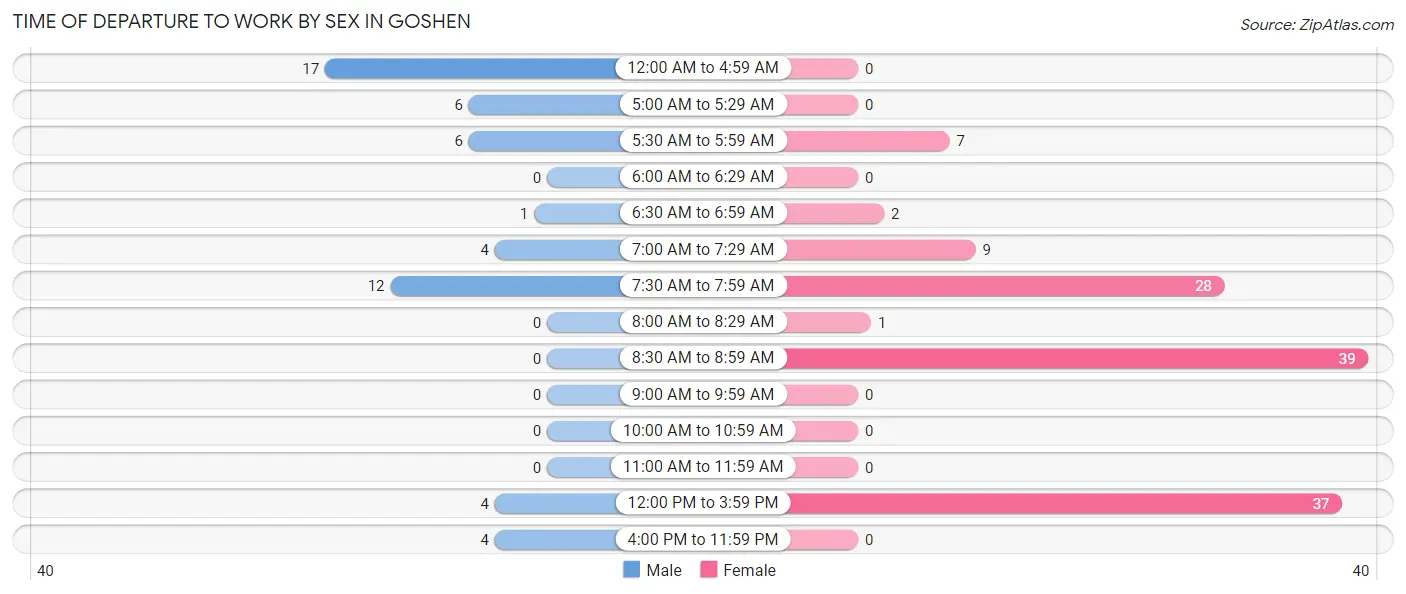
| Time of Departure | Male | Female |
| 12:00 AM to 4:59 AM | 17 (31.5%) | 0 (0.0%) |
| 5:00 AM to 5:29 AM | 6 (11.1%) | 0 (0.0%) |
| 5:30 AM to 5:59 AM | 6 (11.1%) | 7 (5.7%) |
| 6:00 AM to 6:29 AM | 0 (0.0%) | 0 (0.0%) |
| 6:30 AM to 6:59 AM | 1 (1.8%) | 2 (1.6%) |
| 7:00 AM to 7:29 AM | 4 (7.4%) | 9 (7.3%) |
| 7:30 AM to 7:59 AM | 12 (22.2%) | 28 (22.8%) |
| 8:00 AM to 8:29 AM | 0 (0.0%) | 1 (0.8%) |
| 8:30 AM to 8:59 AM | 0 (0.0%) | 39 (31.7%) |
| 9:00 AM to 9:59 AM | 0 (0.0%) | 0 (0.0%) |
| 10:00 AM to 10:59 AM | 0 (0.0%) | 0 (0.0%) |
| 11:00 AM to 11:59 AM | 0 (0.0%) | 0 (0.0%) |
| 12:00 PM to 3:59 PM | 4 (7.4%) | 37 (30.1%) |
| 4:00 PM to 11:59 PM | 4 (7.4%) | 0 (0.0%) |
| Total | 54 (100.0%) | 123 (100.0%) |
Housing Occupancy in Goshen
Occupancy by Ownership in Goshen
Of the total 142 dwellings in Goshen, owner-occupied units account for 117 (82.4%), while renter-occupied units make up 25 (17.6%).
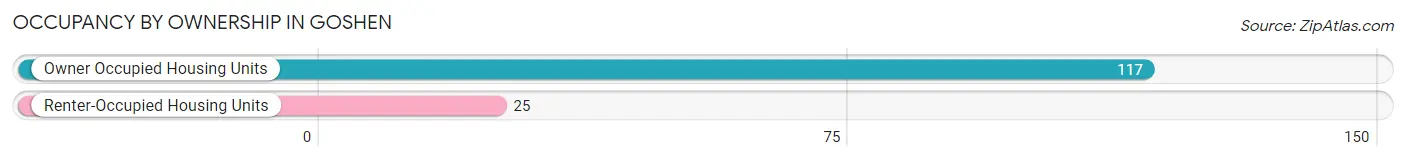
| Occupancy | # Housing Units | % Housing Units |
| Owner Occupied Housing Units | 117 | 82.4% |
| Renter-Occupied Housing Units | 25 | 17.6% |
| Total Occupied Housing Units | 142 | 100.0% |
Occupancy by Household Size in Goshen
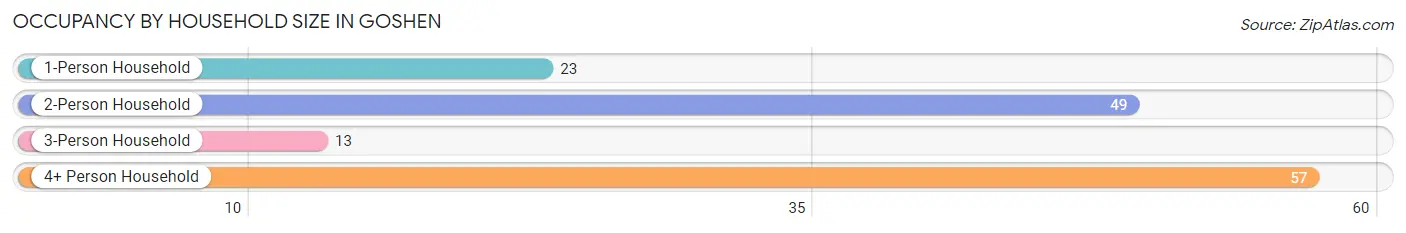
| Household Size | # Housing Units | % Housing Units |
| 1-Person Household | 23 | 16.2% |
| 2-Person Household | 49 | 34.5% |
| 3-Person Household | 13 | 9.1% |
| 4+ Person Household | 57 | 40.1% |
| Total Housing Units | 142 | 100.0% |
Occupancy by Ownership by Household Size in Goshen
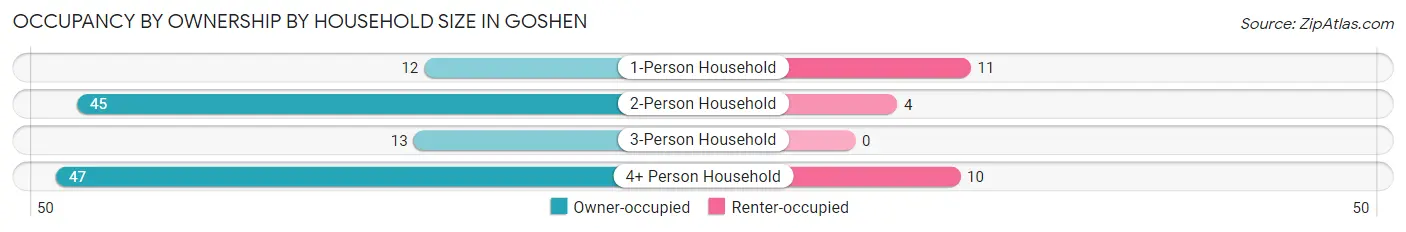
| Household Size | Owner-occupied | Renter-occupied |
| 1-Person Household | 12 (52.2%) | 11 (47.8%) |
| 2-Person Household | 45 (91.8%) | 4 (8.2%) |
| 3-Person Household | 13 (100.0%) | 0 (0.0%) |
| 4+ Person Household | 47 (82.5%) | 10 (17.5%) |
| Total Housing Units | 117 (82.4%) | 25 (17.6%) |
Occupancy by Educational Attainment in Goshen
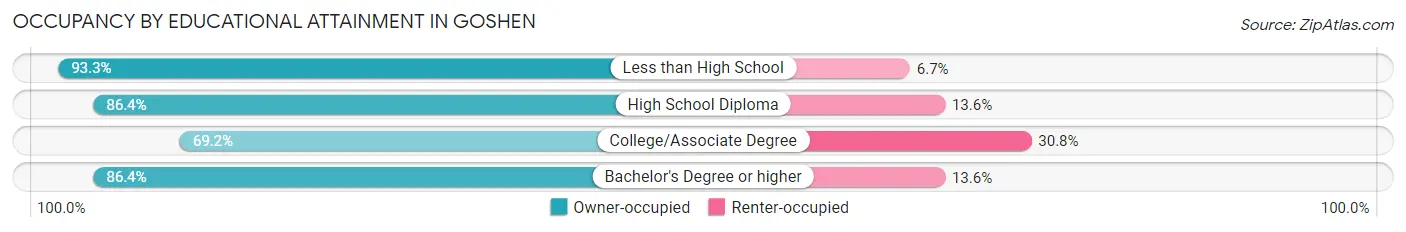
| Household Size | Owner-occupied | Renter-occupied |
| Less than High School | 14 (93.3%) | 1 (6.7%) |
| High School Diploma | 57 (86.4%) | 9 (13.6%) |
| College/Associate Degree | 27 (69.2%) | 12 (30.8%) |
| Bachelor's Degree or higher | 19 (86.4%) | 3 (13.6%) |
Occupancy by Age of Householder in Goshen
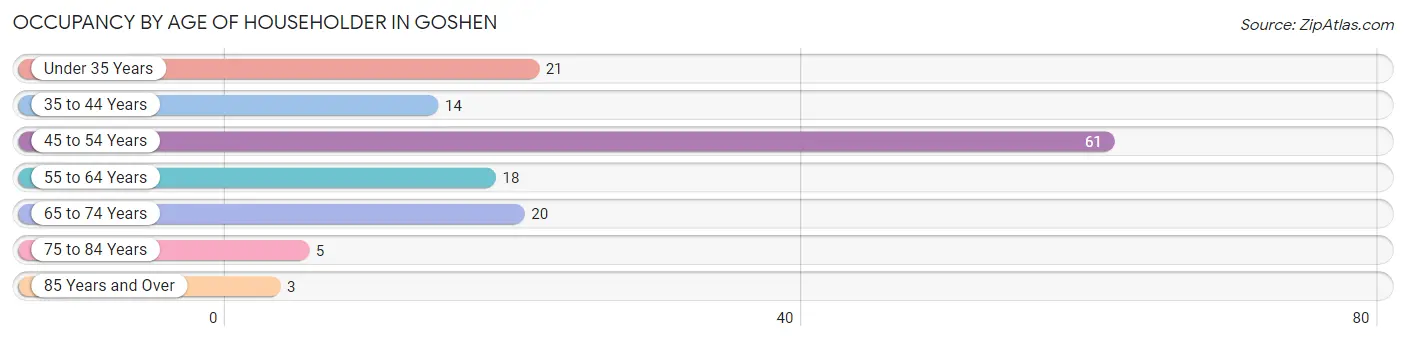
| Age Bracket | # Households | % Households |
| Under 35 Years | 21 | 14.8% |
| 35 to 44 Years | 14 | 9.9% |
| 45 to 54 Years | 61 | 43.0% |
| 55 to 64 Years | 18 | 12.7% |
| 65 to 74 Years | 20 | 14.1% |
| 75 to 84 Years | 5 | 3.5% |
| 85 Years and Over | 3 | 2.1% |
| Total | 142 | 100.0% |
Housing Finances in Goshen
Median Income by Occupancy in Goshen
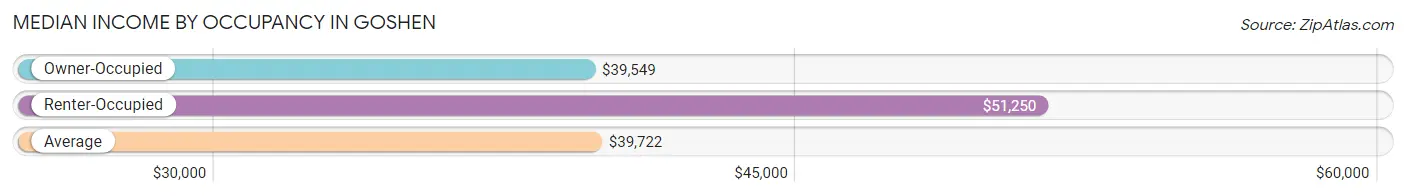
| Occupancy Type | # Households | Median Income |
| Owner-Occupied | 117 (82.4%) | $39,549 |
| Renter-Occupied | 25 (17.6%) | $51,250 |
| Average | 142 (100.0%) | $39,722 |
Occupancy by Householder Income Bracket in Goshen
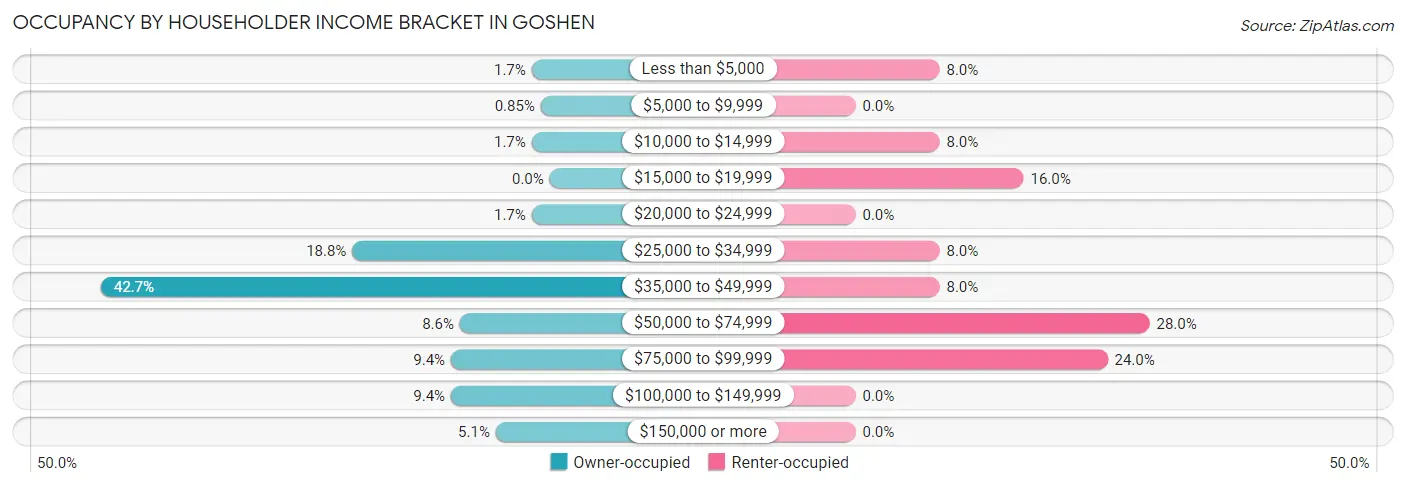
| Income Bracket | Owner-occupied | Renter-occupied |
| Less than $5,000 | 2 (1.7%) | 2 (8.0%) |
| $5,000 to $9,999 | 1 (0.9%) | 0 (0.0%) |
| $10,000 to $14,999 | 2 (1.7%) | 2 (8.0%) |
| $15,000 to $19,999 | 0 (0.0%) | 4 (16.0%) |
| $20,000 to $24,999 | 2 (1.7%) | 0 (0.0%) |
| $25,000 to $34,999 | 22 (18.8%) | 2 (8.0%) |
| $35,000 to $49,999 | 50 (42.7%) | 2 (8.0%) |
| $50,000 to $74,999 | 10 (8.6%) | 7 (28.0%) |
| $75,000 to $99,999 | 11 (9.4%) | 6 (24.0%) |
| $100,000 to $149,999 | 11 (9.4%) | 0 (0.0%) |
| $150,000 or more | 6 (5.1%) | 0 (0.0%) |
| Total | 117 (100.0%) | 25 (100.0%) |
Monthly Housing Cost Tiers in Goshen
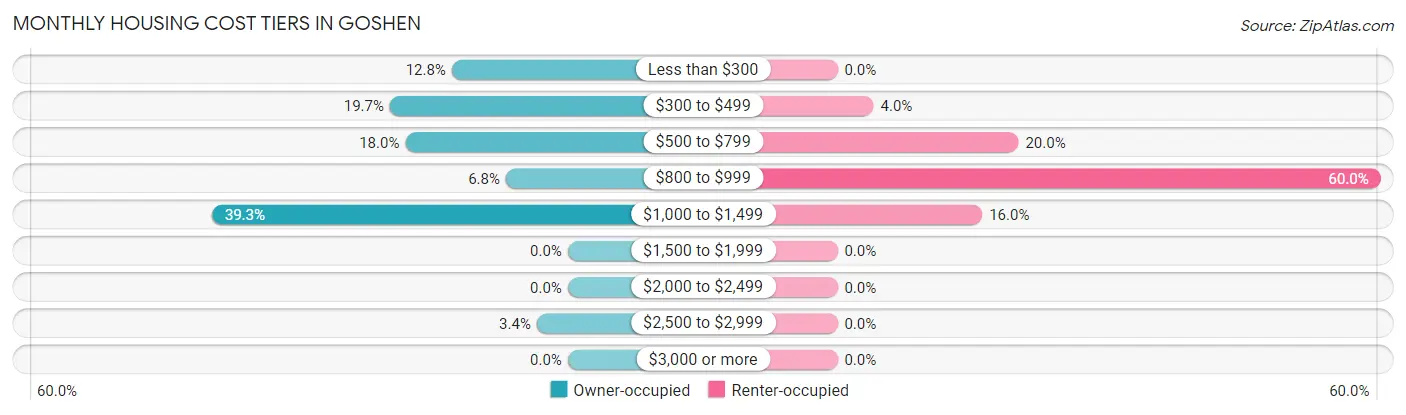
| Monthly Cost | Owner-occupied | Renter-occupied |
| Less than $300 | 15 (12.8%) | 0 (0.0%) |
| $300 to $499 | 23 (19.7%) | 1 (4.0%) |
| $500 to $799 | 21 (17.9%) | 5 (20.0%) |
| $800 to $999 | 8 (6.8%) | 15 (60.0%) |
| $1,000 to $1,499 | 46 (39.3%) | 4 (16.0%) |
| $1,500 to $1,999 | 0 (0.0%) | 0 (0.0%) |
| $2,000 to $2,499 | 0 (0.0%) | 0 (0.0%) |
| $2,500 to $2,999 | 4 (3.4%) | 0 (0.0%) |
| $3,000 or more | 0 (0.0%) | 0 (0.0%) |
| Total | 117 (100.0%) | 25 (100.0%) |
Physical Housing Characteristics in Goshen
Housing Structures in Goshen
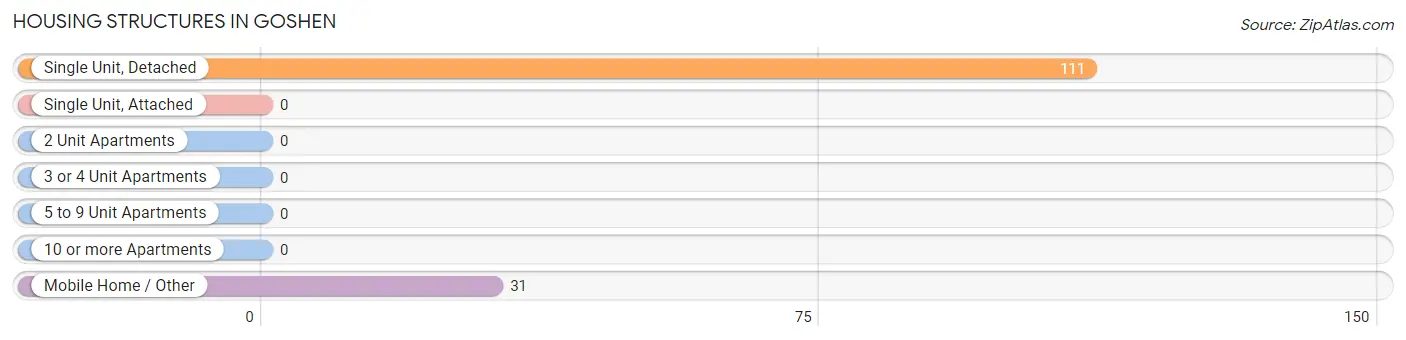
| Structure Type | # Housing Units | % Housing Units |
| Single Unit, Detached | 111 | 78.2% |
| Single Unit, Attached | 0 | 0.0% |
| 2 Unit Apartments | 0 | 0.0% |
| 3 or 4 Unit Apartments | 0 | 0.0% |
| 5 to 9 Unit Apartments | 0 | 0.0% |
| 10 or more Apartments | 0 | 0.0% |
| Mobile Home / Other | 31 | 21.8% |
| Total | 142 | 100.0% |
Housing Structures by Occupancy in Goshen
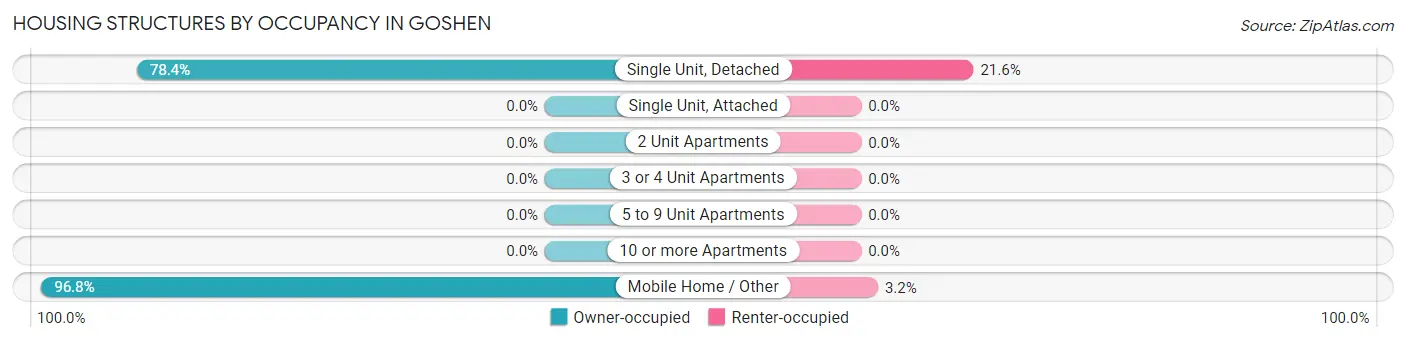
| Structure Type | Owner-occupied | Renter-occupied |
| Single Unit, Detached | 87 (78.4%) | 24 (21.6%) |
| Single Unit, Attached | 0 (0.0%) | 0 (0.0%) |
| 2 Unit Apartments | 0 (0.0%) | 0 (0.0%) |
| 3 or 4 Unit Apartments | 0 (0.0%) | 0 (0.0%) |
| 5 to 9 Unit Apartments | 0 (0.0%) | 0 (0.0%) |
| 10 or more Apartments | 0 (0.0%) | 0 (0.0%) |
| Mobile Home / Other | 30 (96.8%) | 1 (3.2%) |
| Total | 117 (82.4%) | 25 (17.6%) |
Housing Structures by Number of Rooms in Goshen
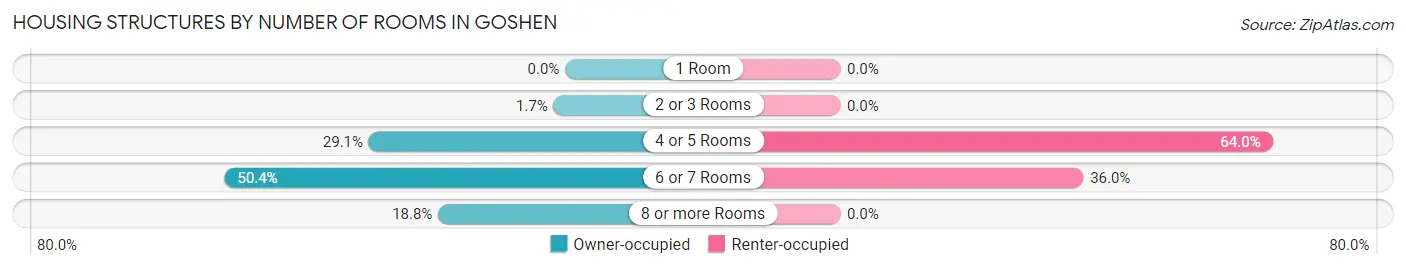
| Number of Rooms | Owner-occupied | Renter-occupied |
| 1 Room | 0 (0.0%) | 0 (0.0%) |
| 2 or 3 Rooms | 2 (1.7%) | 0 (0.0%) |
| 4 or 5 Rooms | 34 (29.1%) | 16 (64.0%) |
| 6 or 7 Rooms | 59 (50.4%) | 9 (36.0%) |
| 8 or more Rooms | 22 (18.8%) | 0 (0.0%) |
| Total | 117 (100.0%) | 25 (100.0%) |
Housing Structure by Heating Type in Goshen
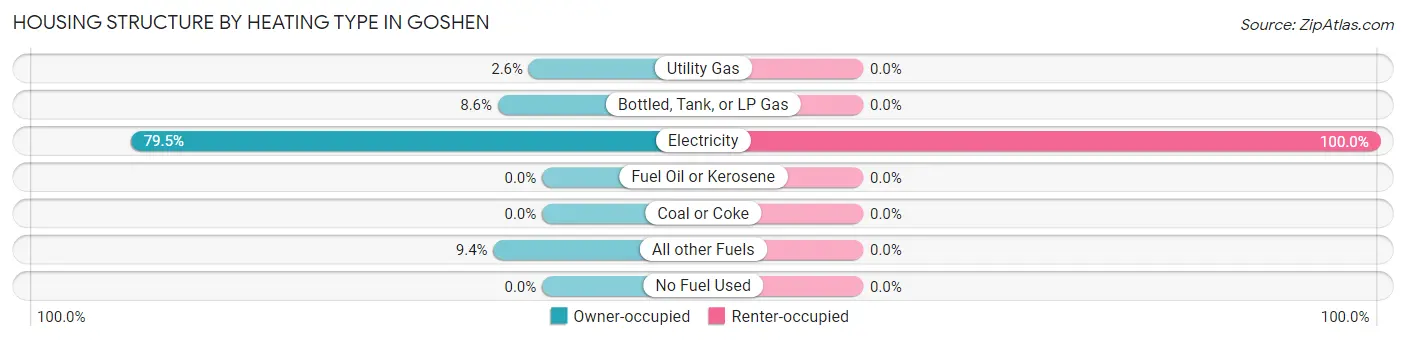
| Heating Type | Owner-occupied | Renter-occupied |
| Utility Gas | 3 (2.6%) | 0 (0.0%) |
| Bottled, Tank, or LP Gas | 10 (8.6%) | 0 (0.0%) |
| Electricity | 93 (79.5%) | 25 (100.0%) |
| Fuel Oil or Kerosene | 0 (0.0%) | 0 (0.0%) |
| Coal or Coke | 0 (0.0%) | 0 (0.0%) |
| All other Fuels | 11 (9.4%) | 0 (0.0%) |
| No Fuel Used | 0 (0.0%) | 0 (0.0%) |
| Total | 117 (100.0%) | 25 (100.0%) |
Household Vehicle Usage in Goshen
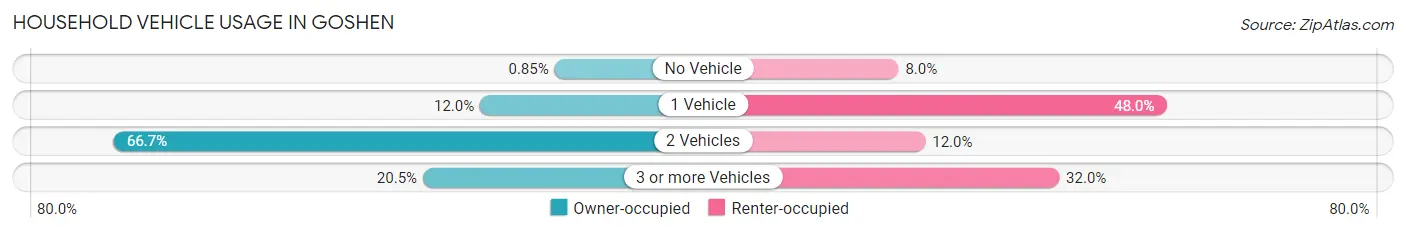
| Vehicles per Household | Owner-occupied | Renter-occupied |
| No Vehicle | 1 (0.9%) | 2 (8.0%) |
| 1 Vehicle | 14 (12.0%) | 12 (48.0%) |
| 2 Vehicles | 78 (66.7%) | 3 (12.0%) |
| 3 or more Vehicles | 24 (20.5%) | 8 (32.0%) |
| Total | 117 (100.0%) | 25 (100.0%) |
Real Estate & Mortgages in Goshen
Real Estate and Mortgage Overview in Goshen
| Characteristic | Without Mortgage | With Mortgage |
| Housing Units | 55 | 62 |
| Median Property Value | $98,100 | $131,300 |
| Median Household Income | $46,250 | $0 |
| Monthly Housing Costs | $388 | $0 |
| Real Estate Taxes | $413 | $3 |
Property Value by Mortgage Status in Goshen
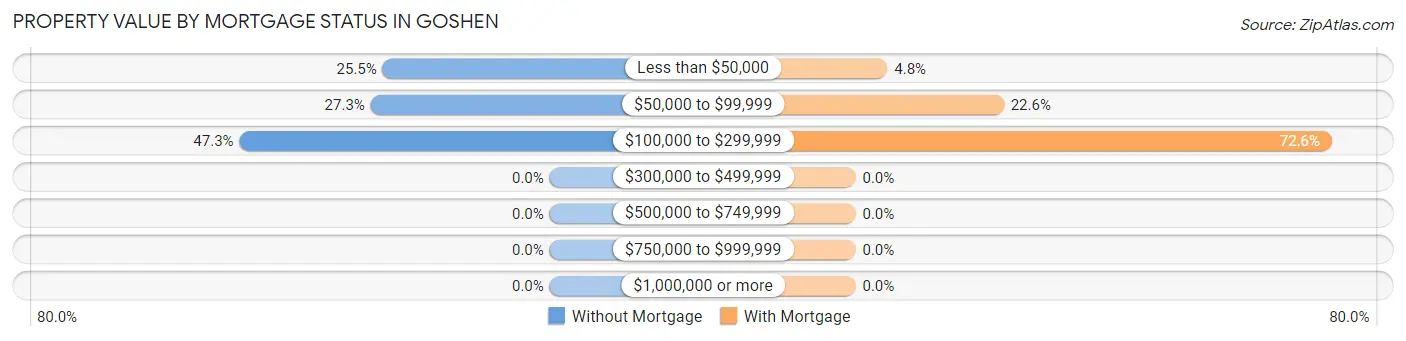
| Property Value | Without Mortgage | With Mortgage |
| Less than $50,000 | 14 (25.5%) | 3 (4.8%) |
| $50,000 to $99,999 | 15 (27.3%) | 14 (22.6%) |
| $100,000 to $299,999 | 26 (47.3%) | 45 (72.6%) |
| $300,000 to $499,999 | 0 (0.0%) | 0 (0.0%) |
| $500,000 to $749,999 | 0 (0.0%) | 0 (0.0%) |
| $750,000 to $999,999 | 0 (0.0%) | 0 (0.0%) |
| $1,000,000 or more | 0 (0.0%) | 0 (0.0%) |
| Total | 55 (100.0%) | 62 (100.0%) |
Household Income by Mortgage Status in Goshen
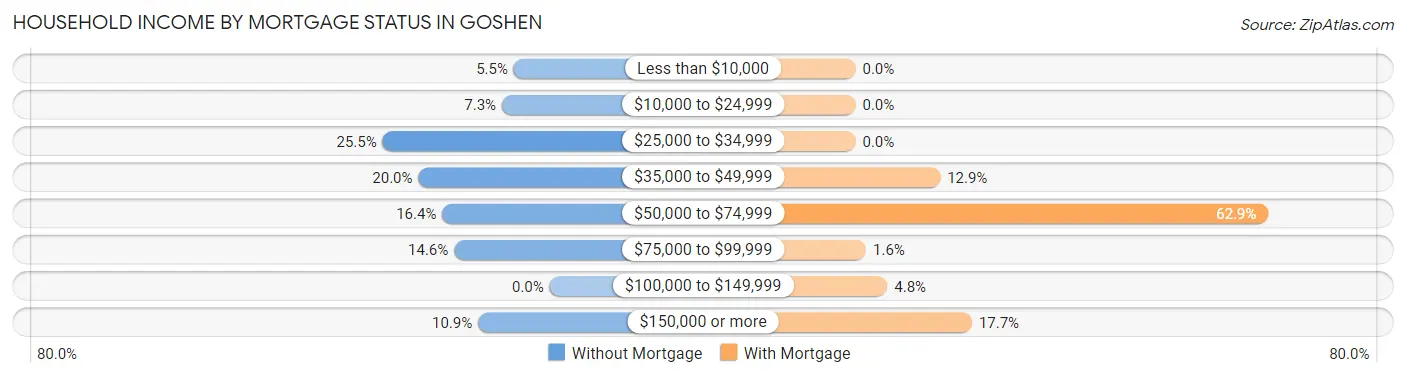
| Household Income | Without Mortgage | With Mortgage |
| Less than $10,000 | 3 (5.4%) | 0 (0.0%) |
| $10,000 to $24,999 | 4 (7.3%) | 0 (0.0%) |
| $25,000 to $34,999 | 14 (25.5%) | 0 (0.0%) |
| $35,000 to $49,999 | 11 (20.0%) | 8 (12.9%) |
| $50,000 to $74,999 | 9 (16.4%) | 39 (62.9%) |
| $75,000 to $99,999 | 8 (14.5%) | 1 (1.6%) |
| $100,000 to $149,999 | 0 (0.0%) | 3 (4.8%) |
| $150,000 or more | 6 (10.9%) | 11 (17.7%) |
| Total | 55 (100.0%) | 62 (100.0%) |
Property Value to Household Income Ratio in Goshen
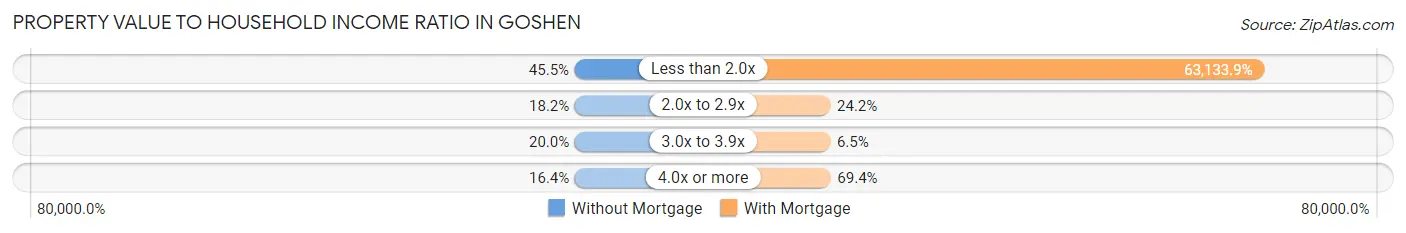
| Value-to-Income Ratio | Without Mortgage | With Mortgage |
| Less than 2.0x | 25 (45.5%) | 39,143 (63,133.9%) |
| 2.0x to 2.9x | 10 (18.2%) | 15 (24.2%) |
| 3.0x to 3.9x | 11 (20.0%) | 4 (6.5%) |
| 4.0x or more | 9 (16.4%) | 43 (69.4%) |
| Total | 55 (100.0%) | 62 (100.0%) |
Real Estate Taxes by Mortgage Status in Goshen
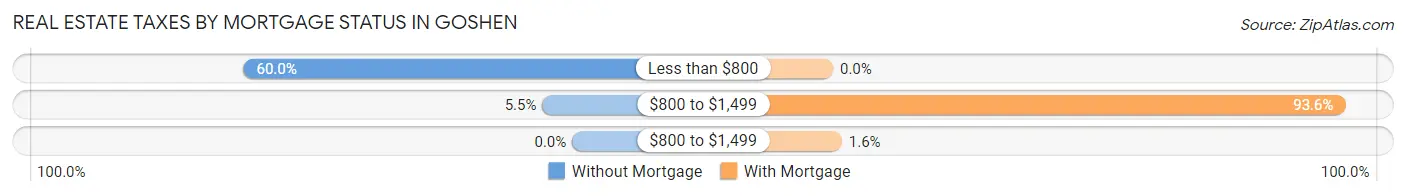
| Property Taxes | Without Mortgage | With Mortgage |
| Less than $800 | 33 (60.0%) | 0 (0.0%) |
| $800 to $1,499 | 3 (5.4%) | 58 (93.5%) |
| $800 to $1,499 | 0 (0.0%) | 1 (1.6%) |
| Total | 55 (100.0%) | 62 (100.0%) |
Health & Disability in Goshen
Health Insurance Coverage by Age in Goshen
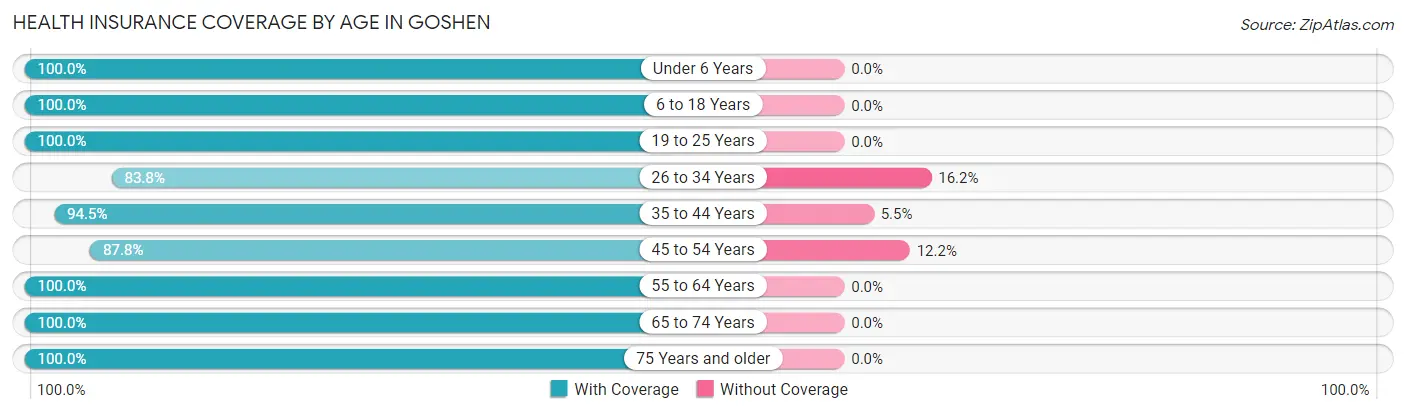
| Age Bracket | With Coverage | Without Coverage |
| Under 6 Years | 12 (100.0%) | 0 (0.0%) |
| 6 to 18 Years | 125 (100.0%) | 0 (0.0%) |
| 19 to 25 Years | 9 (100.0%) | 0 (0.0%) |
| 26 to 34 Years | 31 (83.8%) | 6 (16.2%) |
| 35 to 44 Years | 86 (94.5%) | 5 (5.5%) |
| 45 to 54 Years | 72 (87.8%) | 10 (12.2%) |
| 55 to 64 Years | 29 (100.0%) | 0 (0.0%) |
| 65 to 74 Years | 54 (100.0%) | 0 (0.0%) |
| 75 Years and older | 8 (100.0%) | 0 (0.0%) |
| Total | 426 (95.3%) | 21 (4.7%) |
Health Insurance Coverage by Citizenship Status in Goshen
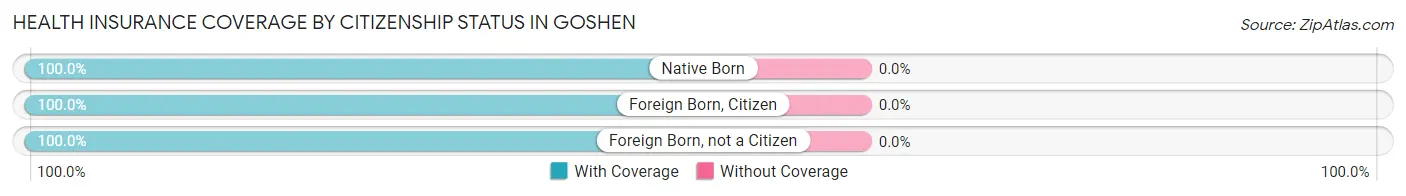
| Citizenship Status | With Coverage | Without Coverage |
| Native Born | 12 (100.0%) | 0 (0.0%) |
| Foreign Born, Citizen | 125 (100.0%) | 0 (0.0%) |
| Foreign Born, not a Citizen | 9 (100.0%) | 0 (0.0%) |
Health Insurance Coverage by Household Income in Goshen
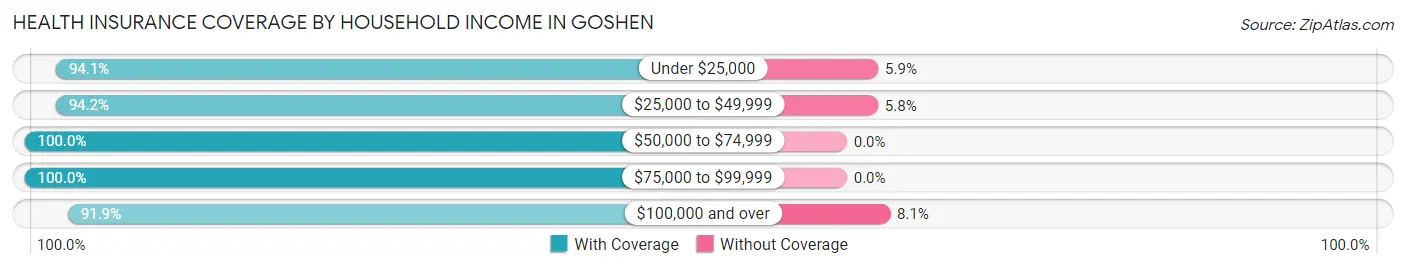
| Household Income | With Coverage | Without Coverage |
| Under $25,000 | 16 (94.1%) | 1 (5.9%) |
| $25,000 to $49,999 | 226 (94.2%) | 14 (5.8%) |
| $50,000 to $74,999 | 42 (100.0%) | 0 (0.0%) |
| $75,000 to $99,999 | 74 (100.0%) | 0 (0.0%) |
| $100,000 and over | 68 (91.9%) | 6 (8.1%) |
Public vs Private Health Insurance Coverage by Age in Goshen
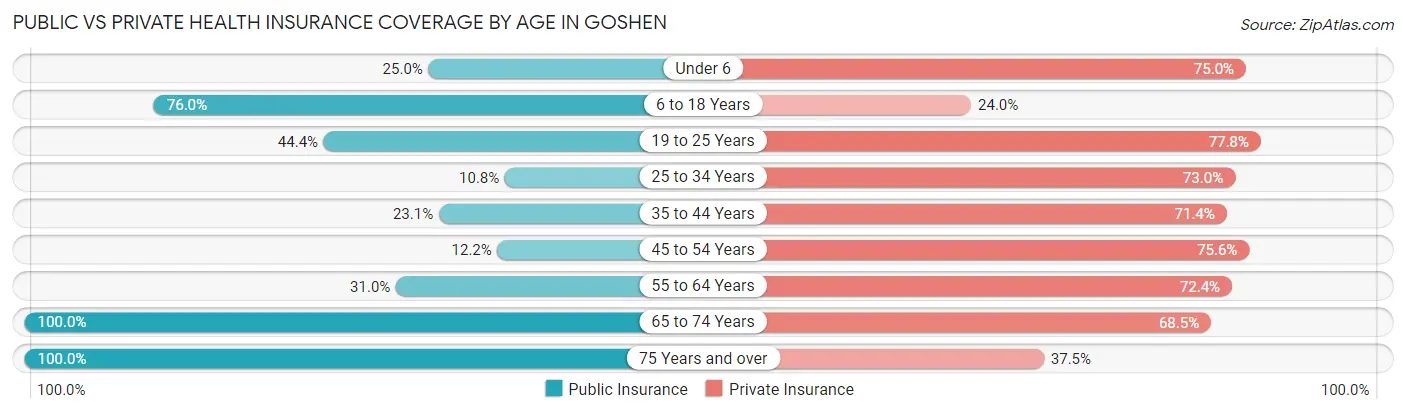
| Age Bracket | Public Insurance | Private Insurance |
| Under 6 | 3 (25.0%) | 9 (75.0%) |
| 6 to 18 Years | 95 (76.0%) | 30 (24.0%) |
| 19 to 25 Years | 4 (44.4%) | 7 (77.8%) |
| 25 to 34 Years | 4 (10.8%) | 27 (73.0%) |
| 35 to 44 Years | 21 (23.1%) | 65 (71.4%) |
| 45 to 54 Years | 10 (12.2%) | 62 (75.6%) |
| 55 to 64 Years | 9 (31.0%) | 21 (72.4%) |
| 65 to 74 Years | 54 (100.0%) | 37 (68.5%) |
| 75 Years and over | 8 (100.0%) | 3 (37.5%) |
| Total | 208 (46.5%) | 261 (58.4%) |
Disability Status by Sex by Age in Goshen
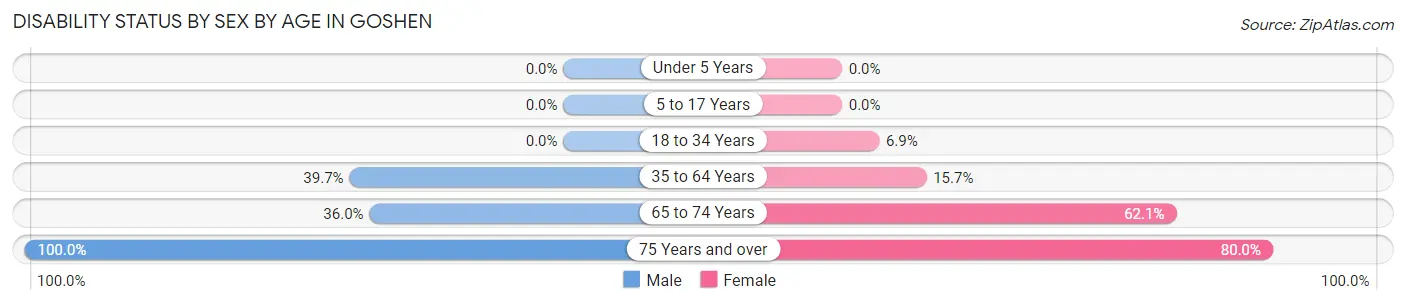
| Age Bracket | Male | Female |
| Under 5 Years | 0 (0.0%) | 0 (0.0%) |
| 5 to 17 Years | 0 (0.0%) | 0 (0.0%) |
| 18 to 34 Years | 0 (0.0%) | 2 (6.9%) |
| 35 to 64 Years | 27 (39.7%) | 21 (15.7%) |
| 65 to 74 Years | 9 (36.0%) | 18 (62.1%) |
| 75 Years and over | 3 (100.0%) | 4 (80.0%) |
Disability Class by Sex by Age in Goshen
Disability Class: Hearing Difficulty
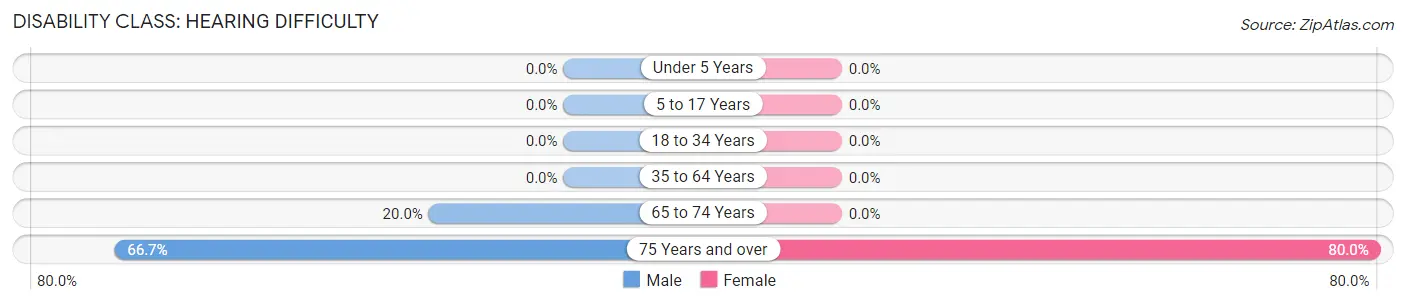
| Age Bracket | Male | Female |
| Under 5 Years | 0 (0.0%) | 0 (0.0%) |
| 5 to 17 Years | 0 (0.0%) | 0 (0.0%) |
| 18 to 34 Years | 0 (0.0%) | 0 (0.0%) |
| 35 to 64 Years | 0 (0.0%) | 0 (0.0%) |
| 65 to 74 Years | 5 (20.0%) | 0 (0.0%) |
| 75 Years and over | 2 (66.7%) | 4 (80.0%) |
Disability Class: Vision Difficulty
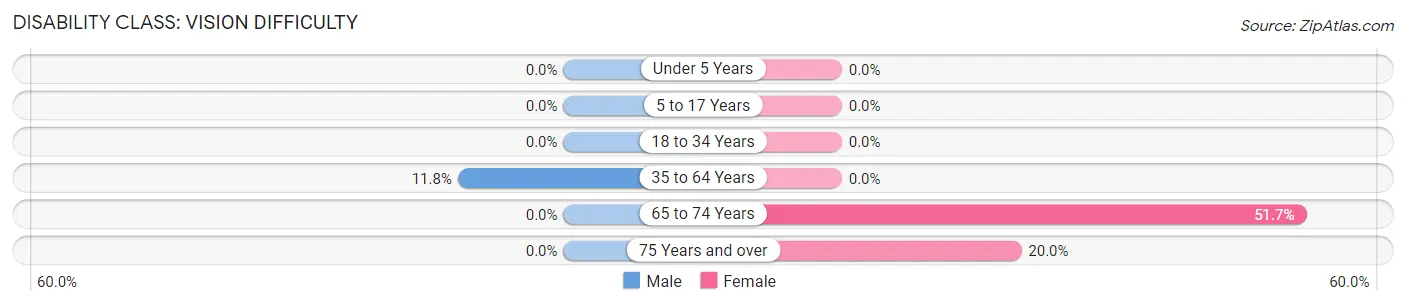
| Age Bracket | Male | Female |
| Under 5 Years | 0 (0.0%) | 0 (0.0%) |
| 5 to 17 Years | 0 (0.0%) | 0 (0.0%) |
| 18 to 34 Years | 0 (0.0%) | 0 (0.0%) |
| 35 to 64 Years | 8 (11.8%) | 0 (0.0%) |
| 65 to 74 Years | 0 (0.0%) | 15 (51.7%) |
| 75 Years and over | 0 (0.0%) | 1 (20.0%) |
Disability Class: Cognitive Difficulty
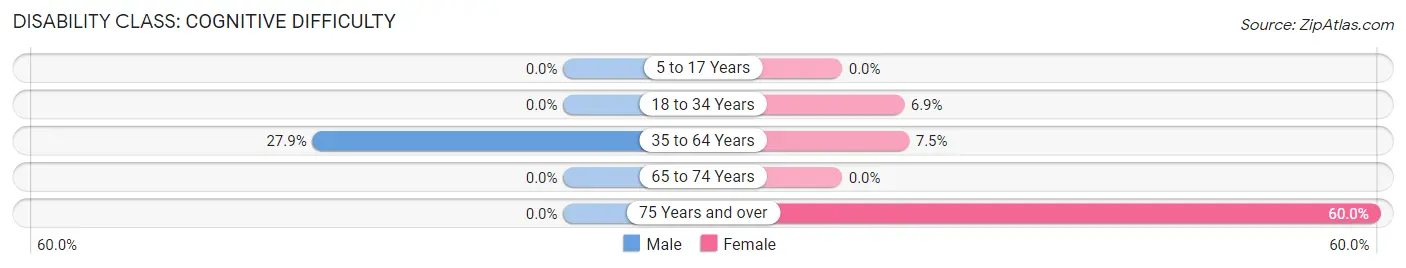
| Age Bracket | Male | Female |
| 5 to 17 Years | 0 (0.0%) | 0 (0.0%) |
| 18 to 34 Years | 0 (0.0%) | 2 (6.9%) |
| 35 to 64 Years | 19 (27.9%) | 10 (7.5%) |
| 65 to 74 Years | 0 (0.0%) | 0 (0.0%) |
| 75 Years and over | 0 (0.0%) | 3 (60.0%) |
Disability Class: Ambulatory Difficulty
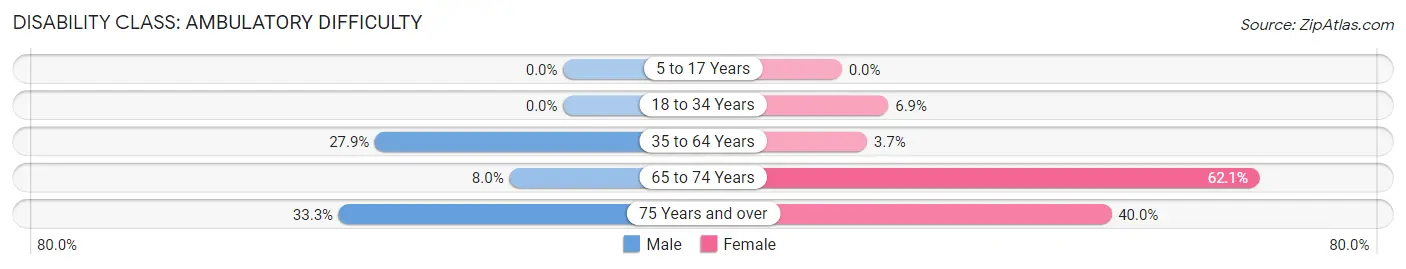
| Age Bracket | Male | Female |
| 5 to 17 Years | 0 (0.0%) | 0 (0.0%) |
| 18 to 34 Years | 0 (0.0%) | 2 (6.9%) |
| 35 to 64 Years | 19 (27.9%) | 5 (3.7%) |
| 65 to 74 Years | 2 (8.0%) | 18 (62.1%) |
| 75 Years and over | 1 (33.3%) | 2 (40.0%) |
Disability Class: Self-Care Difficulty
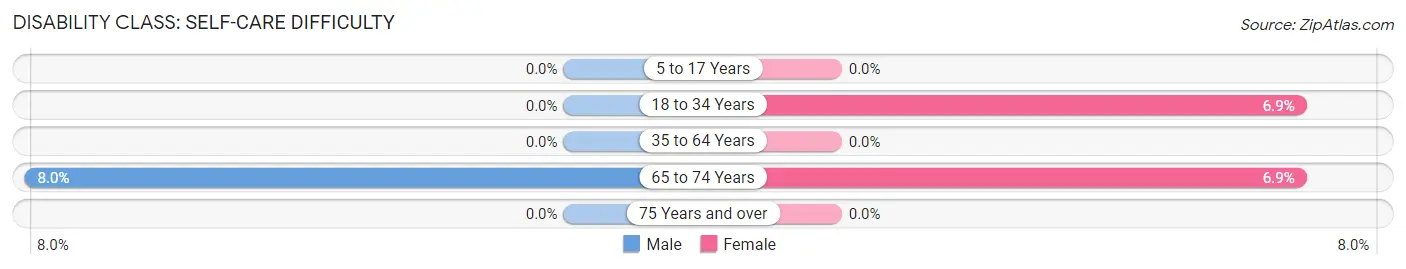
| Age Bracket | Male | Female |
| 5 to 17 Years | 0 (0.0%) | 0 (0.0%) |
| 18 to 34 Years | 0 (0.0%) | 2 (6.9%) |
| 35 to 64 Years | 0 (0.0%) | 0 (0.0%) |
| 65 to 74 Years | 2 (8.0%) | 2 (6.9%) |
| 75 Years and over | 0 (0.0%) | 0 (0.0%) |
Technology Access in Goshen
Computing Device Access in Goshen
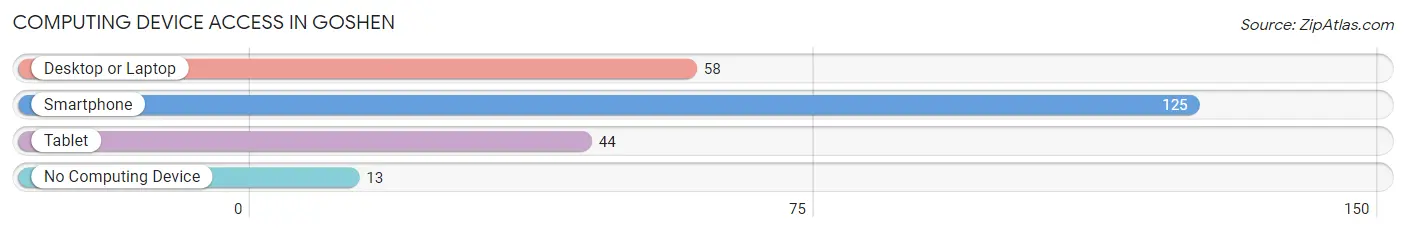
| Device Type | # Households | % Households |
| Desktop or Laptop | 58 | 40.8% |
| Smartphone | 125 | 88.0% |
| Tablet | 44 | 31.0% |
| No Computing Device | 13 | 9.1% |
| Total | 142 | 100.0% |
Internet Access in Goshen
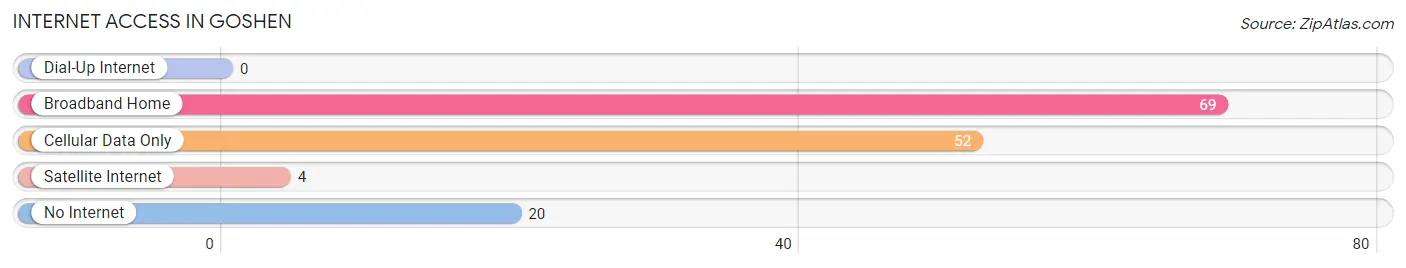
| Internet Type | # Households | % Households |
| Dial-Up Internet | 0 | 0.0% |
| Broadband Home | 69 | 48.6% |
| Cellular Data Only | 52 | 36.6% |
| Satellite Internet | 4 | 2.8% |
| No Internet | 20 | 14.1% |
| Total | 142 | 100.0% |
Goshen Summary
Goshen, Alabama is a small town located in the southeastern corner of the state, in Houston County. It is situated on the banks of the Choctawhatchee River, and is part of the Dothan metropolitan area. The town has a population of just over 1,000 people, and is known for its rural charm and friendly atmosphere.
History
Goshen was founded in 1836 by a group of settlers from Georgia. The town was named after the biblical city of Goshen, which was located in the land of Egypt. The settlers chose the name because they believed that the area was similar to the biblical city. The town was incorporated in 1837, and the first post office was established in 1838.
Goshen was an important stop on the stagecoach route between Montgomery and Pensacola. The town was also a major trading center for cotton and other agricultural products. During the Civil War, Goshen was the site of a Confederate camp, and the town was occupied by Union forces in 1865.
Geography
Goshen is located in the southeastern corner of Alabama, in Houston County. The town is situated on the banks of the Choctawhatchee River, and is part of the Dothan metropolitan area. The town is located about 25 miles south of Dothan, and about 50 miles north of Panama City, Florida.
The town has a total area of 1.2 square miles, all of which is land. The terrain is mostly flat, with some rolling hills. The climate is humid subtropical, with hot summers and mild winters.
Economy
Goshen’s economy is largely based on agriculture. The town is home to several farms, which produce cotton, corn, soybeans, and other crops. The town also has several small businesses, including a grocery store, a hardware store, and a few restaurants.
Demographics
Goshen has a population of just over 1,000 people, according to the 2010 census. The town is predominantly white, with about 85% of the population being white. The remaining 15% of the population is made up of African Americans, Hispanics, and other minorities. The median household income is $35,000, and the median home value is $90,000.
Goshen is a small, rural town with a friendly atmosphere and a rich history. The town is known for its agricultural roots, and is a great place to live for those who enjoy a slower pace of life. The town is also close to larger cities, such as Dothan and Panama City, which offer more amenities and entertainment options.
Common Questions
What is the Total Population of Goshen?
Total Population of Goshen is 447.
What is the Total Male Population of Goshen?
Total Male Population of Goshen is 203.
What is the Total Female Population of Goshen?
Total Female Population of Goshen is 244.
What is the Ratio of Males per 100 Females in Goshen?
There are 83.20 Males per 100 Females in Goshen.
What is the Ratio of Females per 100 Males in Goshen?
There are 120.20 Females per 100 Males in Goshen.
What is the Median Population Age in Goshen?
Median Population Age in Goshen is 40.3 Years.
What is the Average Family Size in Goshen
Average Family Size in Goshen is 3.5 People.
What is the Average Household Size in Goshen
Average Household Size in Goshen is 3.1 People.
What is Per Capita Income in Goshen?
Per Capita income in Goshen is $19,645.
What is the Median Family Income in Goshen?
Median Family Income in Goshen is $39,583.
What is the Median Household income in Goshen?
Median Household Income in Goshen is $39,722.
What is Income or Wage Gap in Goshen?
Income or Wage Gap in Goshen is 15.8%.
Women in Goshen earn 84.2 cents for every dollar earned by a man.
What is Inequality or Gini Index in Goshen?
Inequality or Gini Index in Goshen is 0.36.
How Large is the Labor Force in Goshen?
There are 192 People in the Labor Forcein in Goshen.
What is the Percentage of People in the Labor Force in Goshen?
57.3% of People are in the Labor Force in Goshen.
What is the Unemployment Rate in Goshen?
Unemployment Rate in Goshen is 5.2%.