Gallant, AL
Gallant Map
Gallant Overview
1,111
TOTAL POPULATION
603
MALE POPULATION
508
FEMALE POPULATION
118.70
MALES / 100 FEMALES
84.25
FEMALES / 100 MALES
46.0
MEDIAN AGE
3.4
AVG FAMILY SIZE
2.6
AVG HOUSEHOLD SIZE
$23,190
PER CAPITA INCOME
$64,667
AVG FAMILY INCOME
$50,574
AVG HOUSEHOLD INCOME
0.44
INEQUALITY / GINI INDEX
362
LABOR FORCE [ PEOPLE ]
44.0%
PERCENT IN LABOR FORCE
4.1%
UNEMPLOYMENT RATE
Gallant Zip Codes
Gallant Area Codes
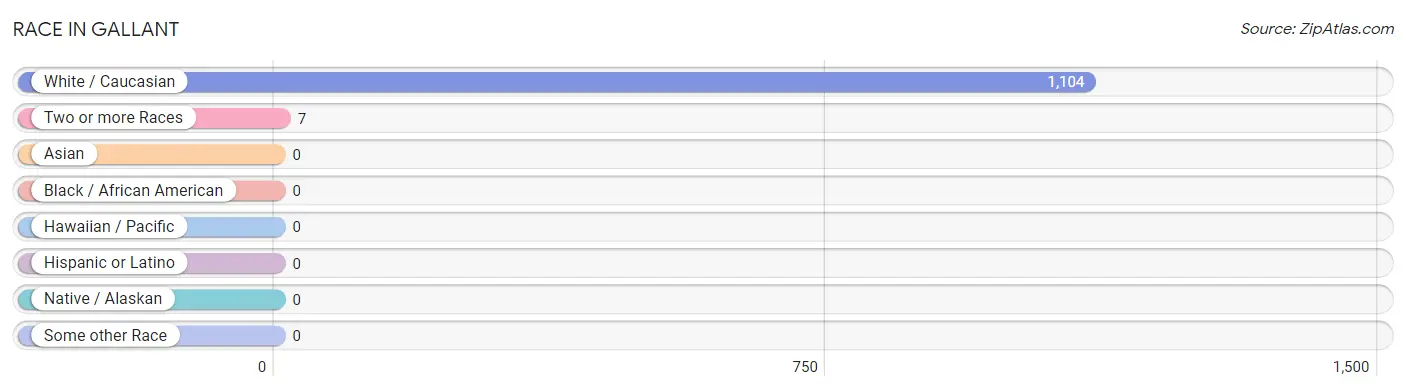
Race in Gallant
The most populous races in Gallant are White / Caucasian (1,104 | 99.4%), and Two or more Races (7 | 0.6%).
| Race | # Population | % Population |
| Asian | 0 | 0.0% |
| Black / African American | 0 | 0.0% |
| Hawaiian / Pacific | 0 | 0.0% |
| Hispanic or Latino | 0 | 0.0% |
| Native / Alaskan | 0 | 0.0% |
| White / Caucasian | 1,104 | 99.4% |
| Two or more Races | 7 | 0.6% |
| Some other Race | 0 | 0.0% |
| Total | 1,111 | 100.0% |
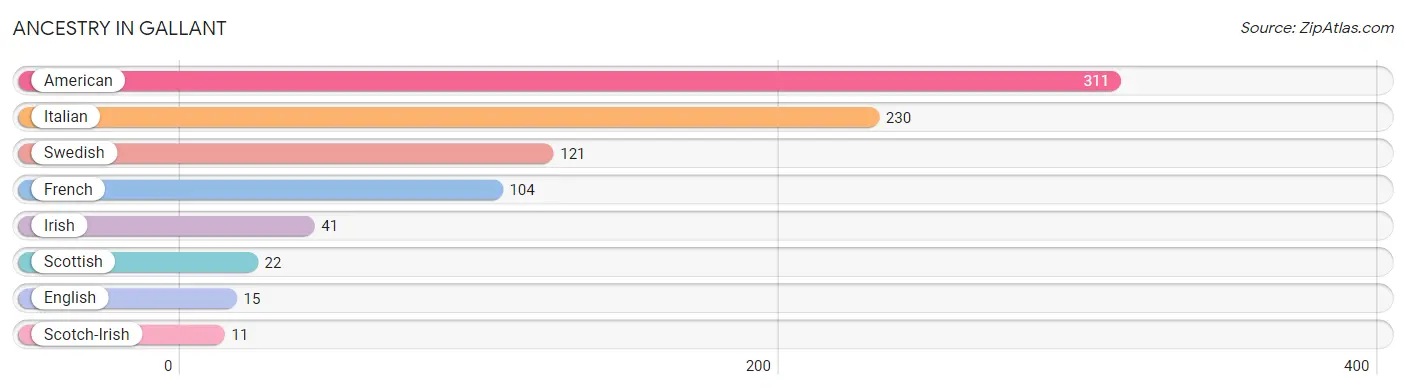
Ancestry in Gallant
The most populous ancestries reported in Gallant are American (311 | 28.0%), Italian (230 | 20.7%), Swedish (121 | 10.9%), French (104 | 9.4%), and Irish (41 | 3.7%), together accounting for 72.6% of all Gallant residents.
| Ancestry | # Population | % Population |
| American | 311 | 28.0% |
| English | 15 | 1.3% |
| French | 104 | 9.4% |
| Irish | 41 | 3.7% |
| Italian | 230 | 20.7% |
| Scotch-Irish | 11 | 1.0% |
| Scottish | 22 | 2.0% |
| Swedish | 121 | 10.9% | View All 8 Rows |
Immigrants in Gallant

| Immigration Origin | # Population | % Population | View All 0 Rows |
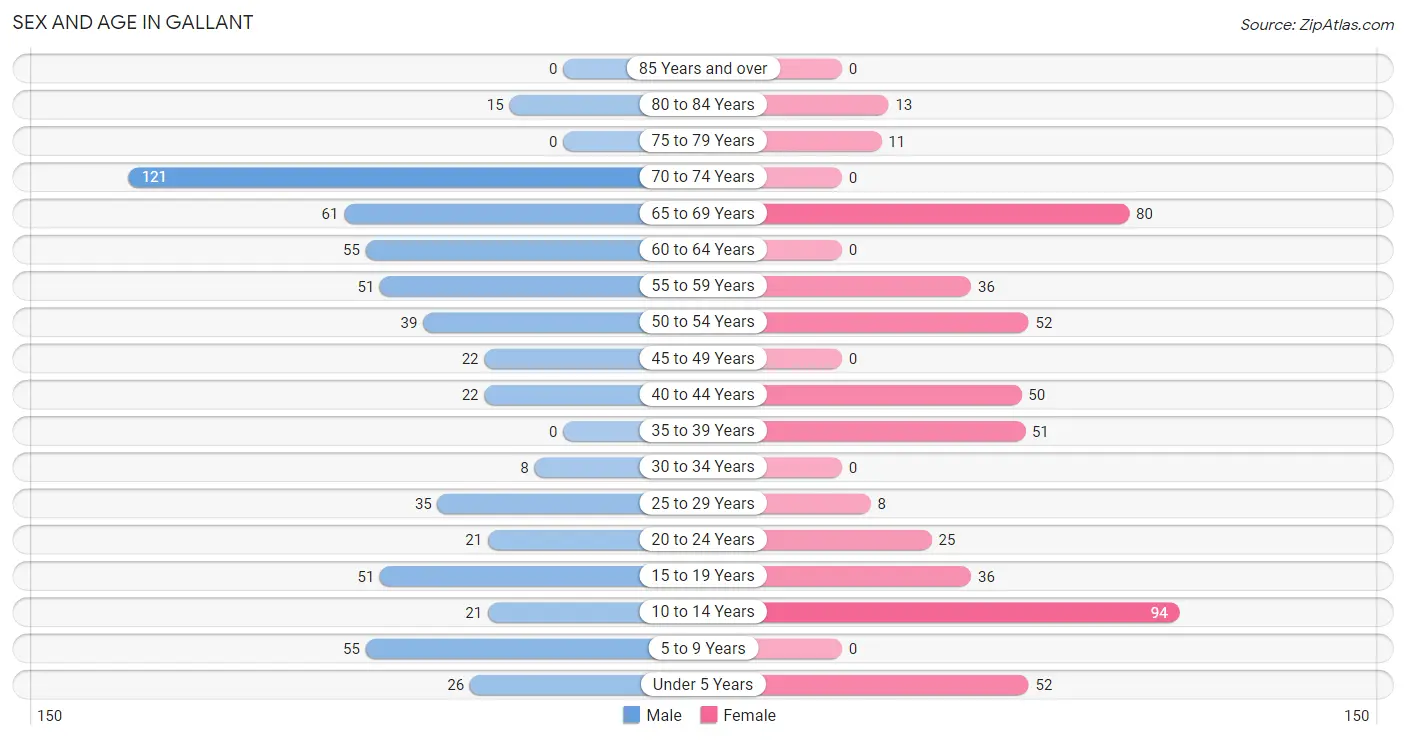
Sex and Age in Gallant
Sex and Age in Gallant
The most populous age groups in Gallant are 70 to 74 Years (121 | 20.1%) for men and 10 to 14 Years (94 | 18.5%) for women.
| Age Bracket | Male | Female |
| Under 5 Years | 26 (4.3%) | 52 (10.2%) |
| 5 to 9 Years | 55 (9.1%) | 0 (0.0%) |
| 10 to 14 Years | 21 (3.5%) | 94 (18.5%) |
| 15 to 19 Years | 51 (8.5%) | 36 (7.1%) |
| 20 to 24 Years | 21 (3.5%) | 25 (4.9%) |
| 25 to 29 Years | 35 (5.8%) | 8 (1.6%) |
| 30 to 34 Years | 8 (1.3%) | 0 (0.0%) |
| 35 to 39 Years | 0 (0.0%) | 51 (10.0%) |
| 40 to 44 Years | 22 (3.6%) | 50 (9.8%) |
| 45 to 49 Years | 22 (3.6%) | 0 (0.0%) |
| 50 to 54 Years | 39 (6.5%) | 52 (10.2%) |
| 55 to 59 Years | 51 (8.5%) | 36 (7.1%) |
| 60 to 64 Years | 55 (9.1%) | 0 (0.0%) |
| 65 to 69 Years | 61 (10.1%) | 80 (15.8%) |
| 70 to 74 Years | 121 (20.1%) | 0 (0.0%) |
| 75 to 79 Years | 0 (0.0%) | 11 (2.2%) |
| 80 to 84 Years | 15 (2.5%) | 13 (2.6%) |
| 85 Years and over | 0 (0.0%) | 0 (0.0%) |
| Total | 603 (100.0%) | 508 (100.0%) |
Families and Households in Gallant
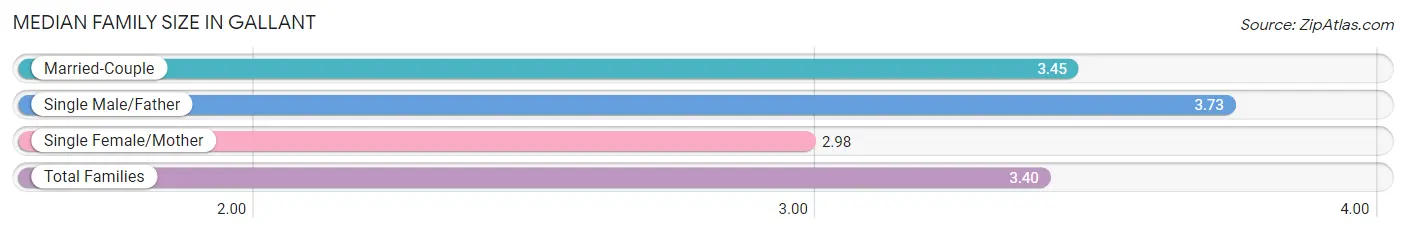
Median Family Size in Gallant
The median family size in Gallant is 3.40 persons per family, with single male/father families (22 | 7.8%) accounting for the largest median family size of 3.73 persons per family. On the other hand, single female/mother families (40 | 14.2%) represent the smallest median family size with 2.98 persons per family.
| Family Type | # Families | Family Size |
| Married-Couple | 220 (78.0%) | 3.45 |
| Single Male/Father | 22 (7.8%) | 3.73 |
| Single Female/Mother | 40 (14.2%) | 2.98 |
| Total Families | 282 (100.0%) | 3.40 |
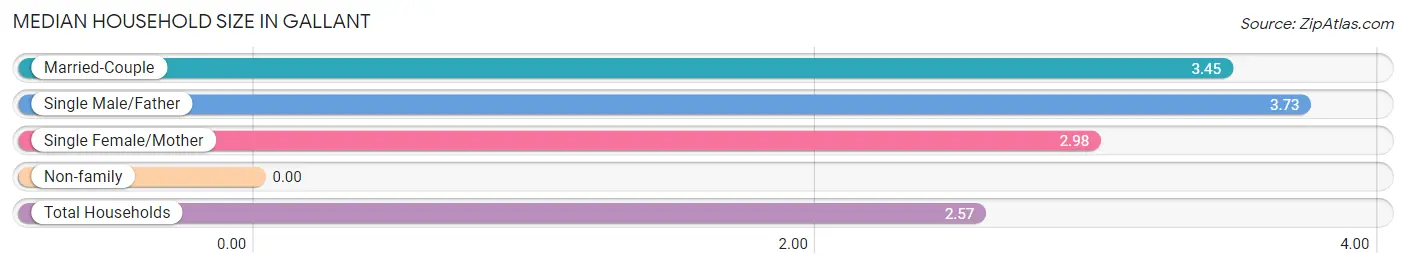
Median Household Size in Gallant
| Household Type | # Households | Household Size |
| Married-Couple | 220 (50.8%) | 3.45 |
| Single Male/Father | 22 (5.1%) | 3.73 |
| Single Female/Mother | 40 (9.2%) | 2.98 |
| Non-family | 151 (34.9%) | - |
| Total Households | 433 (100.0%) | 2.57 |
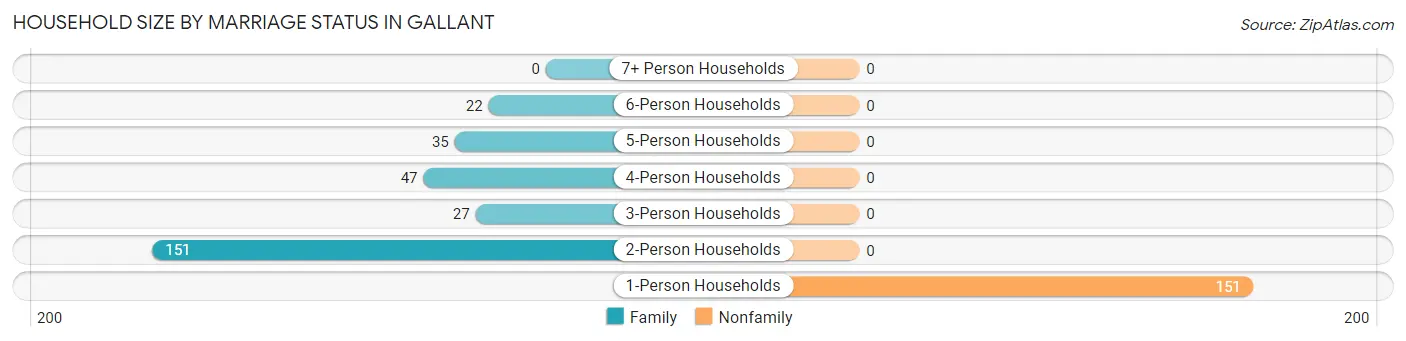
Household Size by Marriage Status in Gallant
Out of a total of 433 households in Gallant, 282 (65.1%) are family households, while 151 (34.9%) are nonfamily households. The most numerous type of family households are 2-person households, comprising 151, and the most common type of nonfamily households are 1-person households, comprising 151.
| Household Size | Family Households | Nonfamily Households |
| 1-Person Households | - | 151 (34.9%) |
| 2-Person Households | 151 (34.9%) | 0 (0.0%) |
| 3-Person Households | 27 (6.2%) | 0 (0.0%) |
| 4-Person Households | 47 (10.8%) | 0 (0.0%) |
| 5-Person Households | 35 (8.1%) | 0 (0.0%) |
| 6-Person Households | 22 (5.1%) | 0 (0.0%) |
| 7+ Person Households | 0 (0.0%) | 0 (0.0%) |
| Total | 282 (65.1%) | 151 (34.9%) |
Female Fertility in Gallant
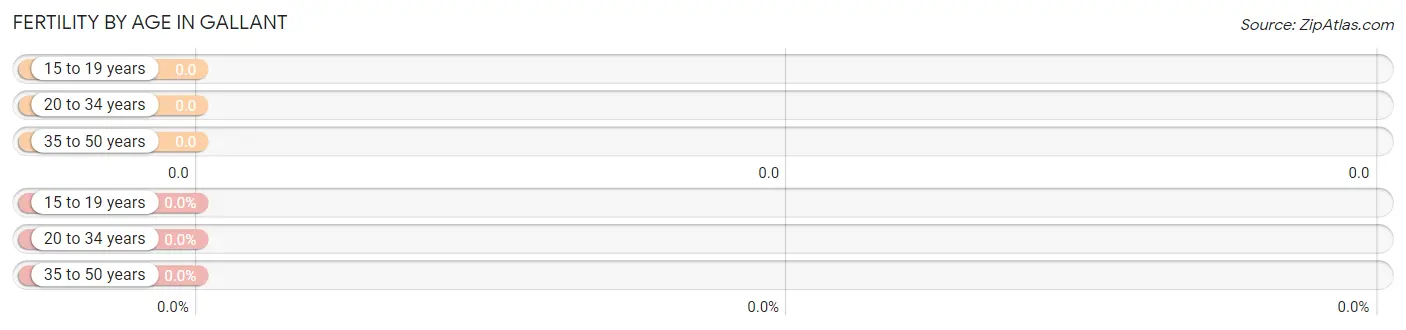
Fertility by Age in Gallant
| Age Bracket | Women with Births | Births / 1,000 Women |
| 15 to 19 years | 0 (0.0%) | 0.0 |
| 20 to 34 years | 0 (0.0%) | 0.0 |
| 35 to 50 years | 0 (0.0%) | 0.0 |
| Total | 0 (0.0%) | 0.0 |
Fertility by Age by Marriage Status in Gallant
| Age Bracket | Married | Unmarried |
| 15 to 19 years | 0 (0.0%) | 0 (0.0%) |
| 20 to 34 years | 0 (0.0%) | 0 (0.0%) |
| 35 to 50 years | 0 (0.0%) | 0 (0.0%) |
| Total | 0 (0.0%) | 0 (0.0%) |
Fertility by Education in Gallant
| Educational Attainment | Women with Births | Births / 1,000 Women |
| Less than High School | 0 (0.0%) | 0.0 |
| High School Diploma | 0 (0.0%) | 0.0 |
| College or Associate's Degree | 0 (0.0%) | 0.0 |
| Bachelor's Degree | 0 (0.0%) | 0.0 |
| Graduate Degree | 0 (0.0%) | 0.0 |
| Total | 0 (0.0%) | 0.0 |
Fertility by Education by Marriage Status in Gallant
| Educational Attainment | Married | Unmarried |
| Less than High School | 0 (0.0%) | 0 (0.0%) |
| High School Diploma | 0 (0.0%) | 0 (0.0%) |
| College or Associate's Degree | 0 (0.0%) | 0 (0.0%) |
| Bachelor's Degree | 0 (0.0%) | 0 (0.0%) |
| Graduate Degree | 0 (0.0%) | 0 (0.0%) |
| Total | 0 (0.0%) | 0 (0.0%) |
Income in Gallant
Income Overview in Gallant
Per Capita Income in Gallant is $23,190, while median incomes of families and households are $64,667 and $50,574 respectively.
| Characteristic | Number | Measure |
| Per Capita Income | 1,111 | $23,190 |
| Median Family Income | 282 | $64,667 |
| Mean Family Income | 282 | $72,763 |
| Median Household Income | 433 | $50,574 |
| Mean Household Income | 433 | $56,155 |
| Income Deficit | 282 | $0 |
| Wage / Income Gap (%) | 1,111 | 0.00% |
| Wage / Income Gap ($) | 1,111 | 100.00¢ per $1 |
| Gini / Inequality Index | 1,111 | 0.44 |
Earnings by Sex in Gallant
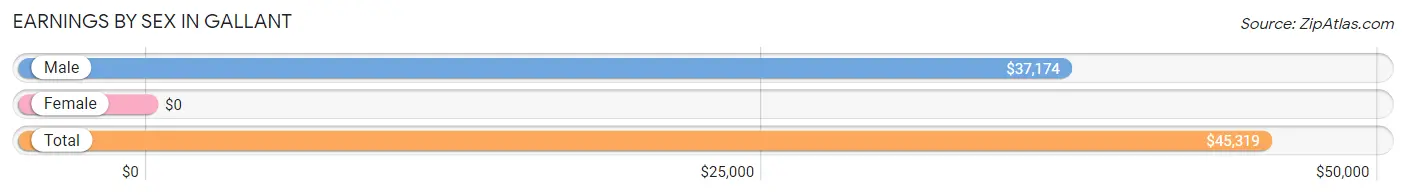
| Sex | Number | Average Earnings |
| Male | 242 (66.8%) | $37,174 |
| Female | 120 (33.2%) | $0 |
| Total | 362 (100.0%) | $45,319 |
Earnings by Sex by Income Bracket in Gallant
The most common earnings brackets in Gallant are $25,000 to $29,999 for men (45 | 18.6%) and $17,500 to $19,999 for women (43 | 35.8%).
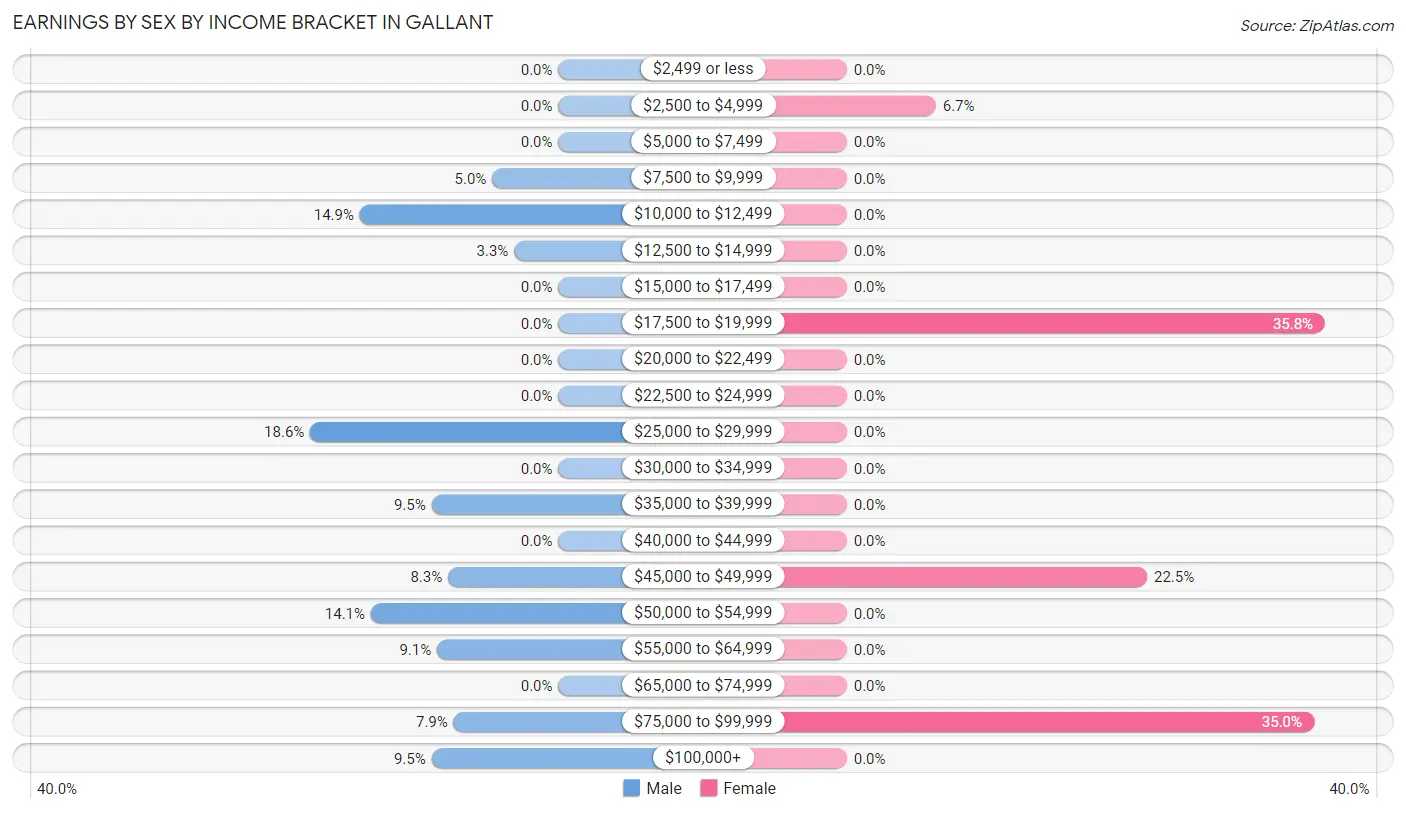
| Income | Male | Female |
| $2,499 or less | 0 (0.0%) | 0 (0.0%) |
| $2,500 to $4,999 | 0 (0.0%) | 8 (6.7%) |
| $5,000 to $7,499 | 0 (0.0%) | 0 (0.0%) |
| $7,500 to $9,999 | 12 (5.0%) | 0 (0.0%) |
| $10,000 to $12,499 | 36 (14.9%) | 0 (0.0%) |
| $12,500 to $14,999 | 8 (3.3%) | 0 (0.0%) |
| $15,000 to $17,499 | 0 (0.0%) | 0 (0.0%) |
| $17,500 to $19,999 | 0 (0.0%) | 43 (35.8%) |
| $20,000 to $22,499 | 0 (0.0%) | 0 (0.0%) |
| $22,500 to $24,999 | 0 (0.0%) | 0 (0.0%) |
| $25,000 to $29,999 | 45 (18.6%) | 0 (0.0%) |
| $30,000 to $34,999 | 0 (0.0%) | 0 (0.0%) |
| $35,000 to $39,999 | 23 (9.5%) | 0 (0.0%) |
| $40,000 to $44,999 | 0 (0.0%) | 0 (0.0%) |
| $45,000 to $49,999 | 20 (8.3%) | 27 (22.5%) |
| $50,000 to $54,999 | 34 (14.1%) | 0 (0.0%) |
| $55,000 to $64,999 | 22 (9.1%) | 0 (0.0%) |
| $65,000 to $74,999 | 0 (0.0%) | 0 (0.0%) |
| $75,000 to $99,999 | 19 (7.9%) | 42 (35.0%) |
| $100,000+ | 23 (9.5%) | 0 (0.0%) |
| Total | 242 (100.0%) | 120 (100.0%) |
Earnings by Sex by Educational Attainment in Gallant
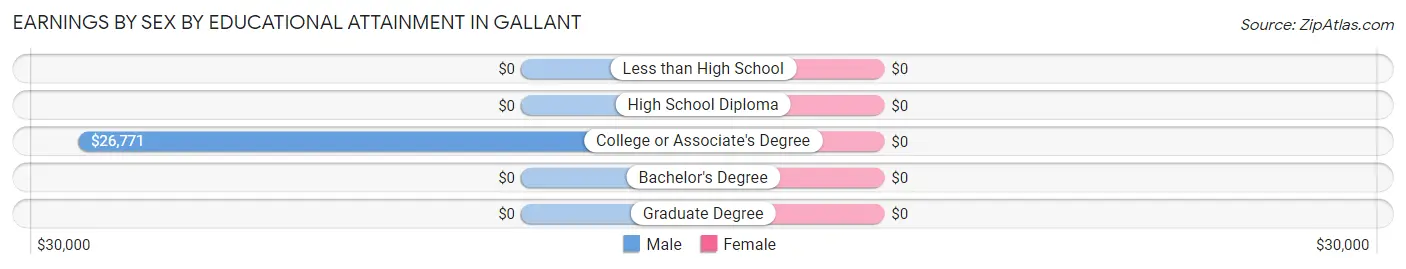
| Educational Attainment | Male Income | Female Income |
| Less than High School | - | - |
| High School Diploma | - | - |
| College or Associate's Degree | $26,771 | $0 |
| Bachelor's Degree | - | - |
| Graduate Degree | - | - |
| Total | $45,938 | $0 |
Family Income in Gallant
Family Income Brackets in Gallant
According to the Gallant family income data, there are 94 families falling into the $50,000 to $74,999 income range, which is the most common income bracket and makes up 33.3% of all families.
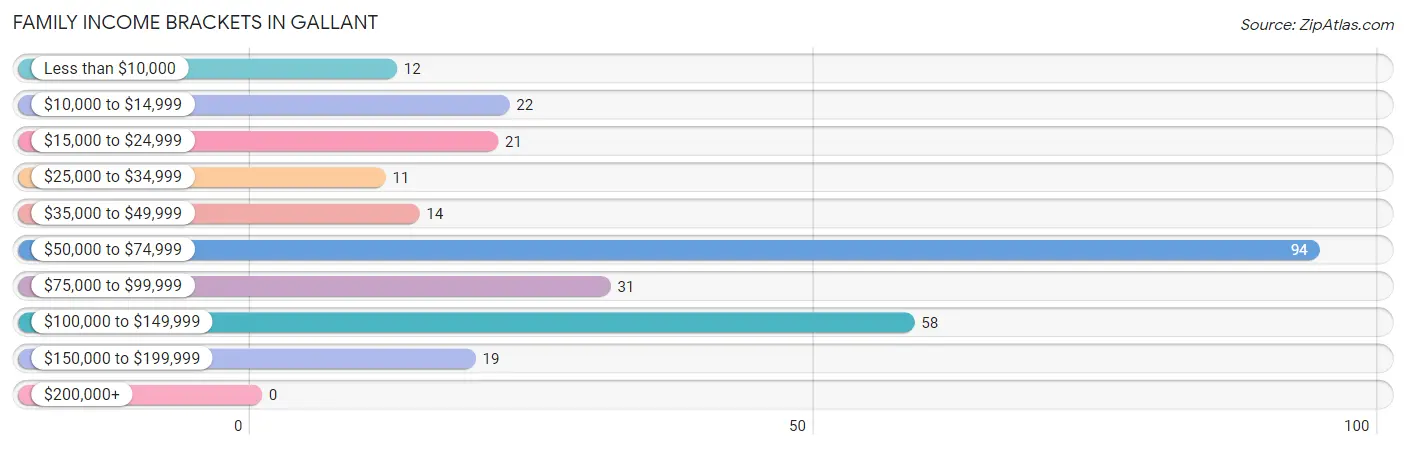
| Income Bracket | # Families | % Families |
| Less than $10,000 | 12 | 4.3% |
| $10,000 to $14,999 | 22 | 7.8% |
| $15,000 to $24,999 | 21 | 7.4% |
| $25,000 to $34,999 | 11 | 3.9% |
| $35,000 to $49,999 | 14 | 5.0% |
| $50,000 to $74,999 | 94 | 33.3% |
| $75,000 to $99,999 | 31 | 11.0% |
| $100,000 to $149,999 | 58 | 20.6% |
| $150,000 to $199,999 | 19 | 6.7% |
| $200,000+ | 0 | 0.0% |
Family Income by Famaliy Size in Gallant
2-person families (151 | 53.5%) account for the highest median family income in Gallant with $66,917 per family, while 2-person families (151 | 53.5%) have the highest median income of $33,458 per family member.
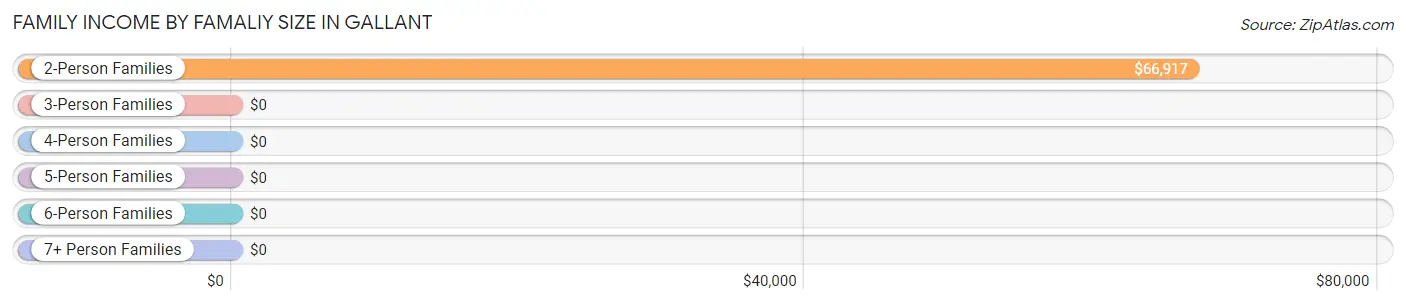
| Income Bracket | # Families | Median Income |
| 2-Person Families | 151 (53.5%) | $66,917 |
| 3-Person Families | 27 (9.6%) | $0 |
| 4-Person Families | 47 (16.7%) | $0 |
| 5-Person Families | 35 (12.4%) | $0 |
| 6-Person Families | 22 (7.8%) | $0 |
| 7+ Person Families | 0 (0.0%) | $0 |
| Total | 282 (100.0%) | $64,667 |
Family Income by Number of Earners in Gallant
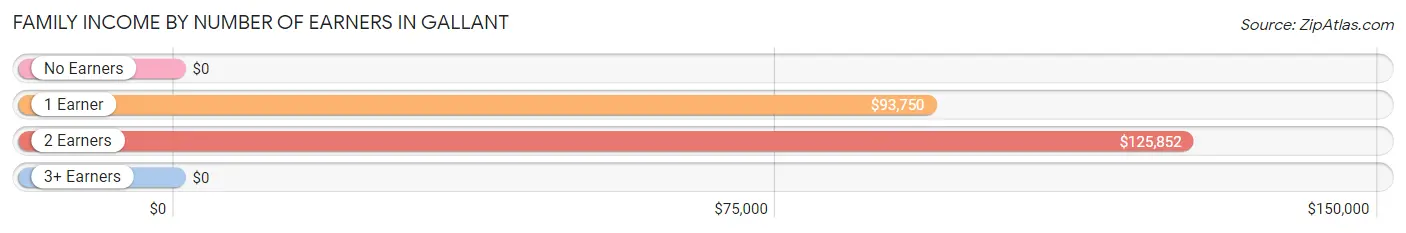
| Number of Earners | # Families | Median Income |
| No Earners | 86 (30.5%) | $0 |
| 1 Earner | 101 (35.8%) | $93,750 |
| 2 Earners | 69 (24.5%) | $125,852 |
| 3+ Earners | 26 (9.2%) | $0 |
| Total | 282 (100.0%) | $64,667 |
Household Income in Gallant
Household Income Brackets in Gallant
With 142 households falling in the category, the $15,000 to $24,999 income range is the most frequent in Gallant, accounting for 32.8% of all households.
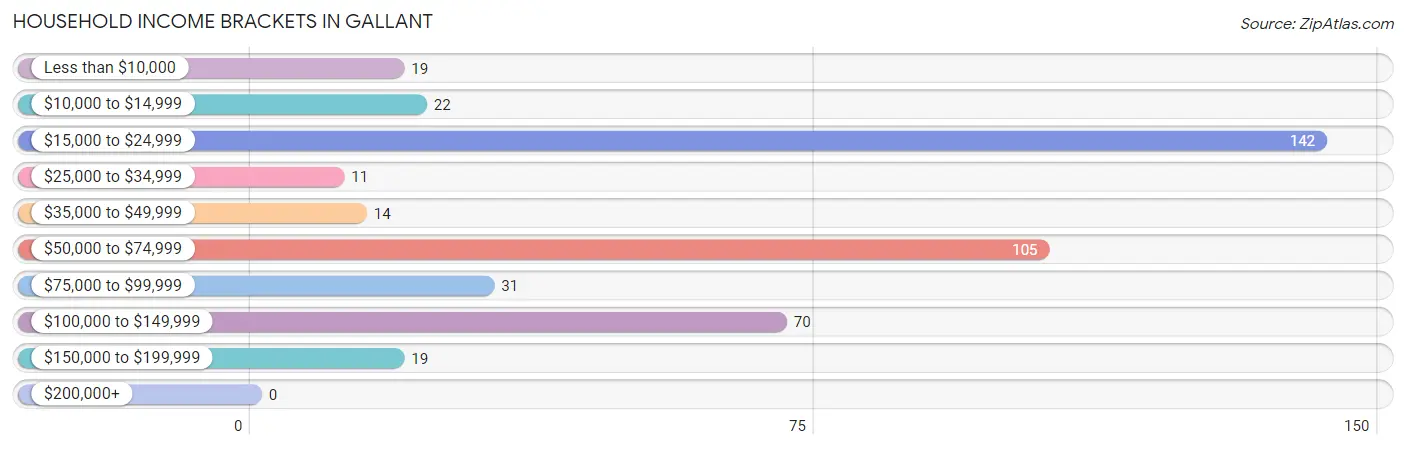
| Income Bracket | # Households | % Households |
| Less than $10,000 | 19 | 4.4% |
| $10,000 to $14,999 | 22 | 5.1% |
| $15,000 to $24,999 | 142 | 32.8% |
| $25,000 to $34,999 | 11 | 2.5% |
| $35,000 to $49,999 | 14 | 3.2% |
| $50,000 to $74,999 | 105 | 24.2% |
| $75,000 to $99,999 | 31 | 7.2% |
| $100,000 to $149,999 | 70 | 16.2% |
| $150,000 to $199,999 | 19 | 4.4% |
| $200,000+ | 0 | 0.0% |
Household Income by Householder Age in Gallant
The median household income in Gallant is $50,574, with the highest median household income of $104,453 found in the 45 to 64 years age bracket for the primary householder. A total of 105 households (24.2%) fall into this category.
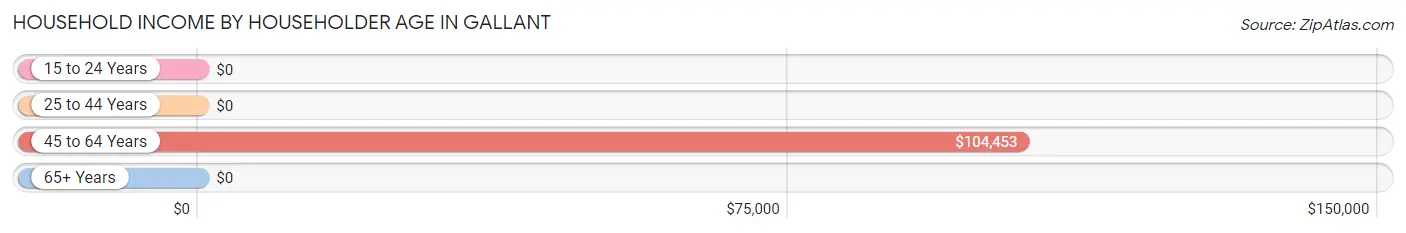
| Income Bracket | # Households | Median Income |
| 15 to 24 Years | 0 (0.0%) | $0 |
| 25 to 44 Years | 89 (20.5%) | $0 |
| 45 to 64 Years | 105 (24.2%) | $104,453 |
| 65+ Years | 239 (55.2%) | $0 |
| Total | 433 (100.0%) | $50,574 |
Poverty in Gallant
Income Below Poverty by Sex and Age in Gallant
With 8.5% poverty level for males and 32.9% for females among the residents of Gallant, 12 to 14 year old males and under 5 year old females are the most vulnerable to poverty, with 14 males (100.0%) and 52 females (100.0%) in their respective age groups living below the poverty level.
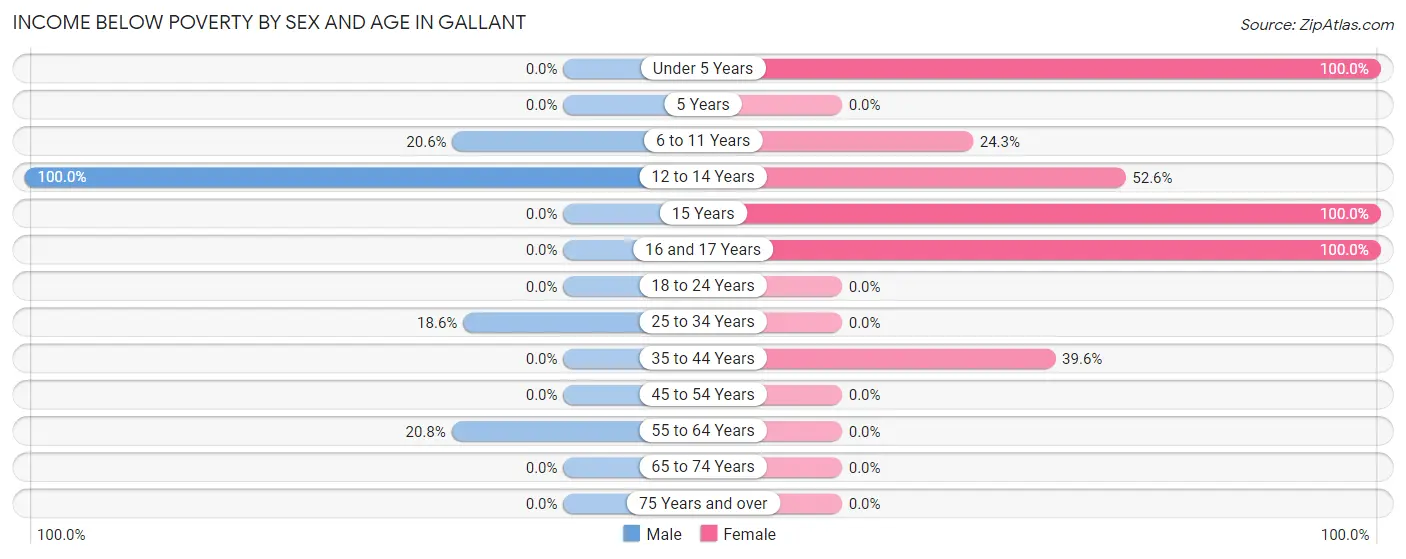
| Age Bracket | Male | Female |
| Under 5 Years | 0 (0.0%) | 52 (100.0%) |
| 5 Years | 0 (0.0%) | 0 (0.0%) |
| 6 to 11 Years | 7 (20.6%) | 9 (24.3%) |
| 12 to 14 Years | 14 (100.0%) | 30 (52.6%) |
| 15 Years | 0 (0.0%) | 23 (100.0%) |
| 16 and 17 Years | 0 (0.0%) | 13 (100.0%) |
| 18 to 24 Years | 0 (0.0%) | 0 (0.0%) |
| 25 to 34 Years | 8 (18.6%) | 0 (0.0%) |
| 35 to 44 Years | 0 (0.0%) | 40 (39.6%) |
| 45 to 54 Years | 0 (0.0%) | 0 (0.0%) |
| 55 to 64 Years | 22 (20.7%) | 0 (0.0%) |
| 65 to 74 Years | 0 (0.0%) | 0 (0.0%) |
| 75 Years and over | 0 (0.0%) | 0 (0.0%) |
| Total | 51 (8.5%) | 167 (32.9%) |
Income Above Poverty by Sex and Age in Gallant
According to the poverty statistics in Gallant, males aged under 5 years and females aged 18 to 24 years are the age groups that are most secure financially, with 100.0% of males and 100.0% of females in these age groups living above the poverty line.
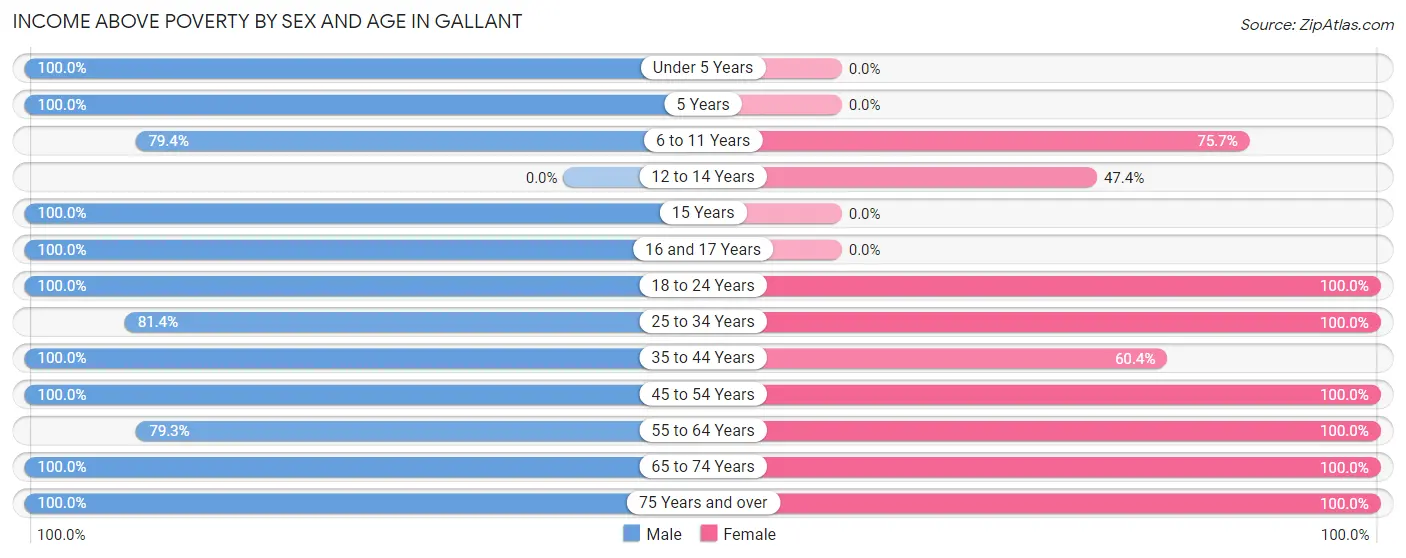
| Age Bracket | Male | Female |
| Under 5 Years | 26 (100.0%) | 0 (0.0%) |
| 5 Years | 28 (100.0%) | 0 (0.0%) |
| 6 to 11 Years | 27 (79.4%) | 28 (75.7%) |
| 12 to 14 Years | 0 (0.0%) | 27 (47.4%) |
| 15 Years | 17 (100.0%) | 0 (0.0%) |
| 16 and 17 Years | 34 (100.0%) | 0 (0.0%) |
| 18 to 24 Years | 21 (100.0%) | 25 (100.0%) |
| 25 to 34 Years | 35 (81.4%) | 8 (100.0%) |
| 35 to 44 Years | 22 (100.0%) | 61 (60.4%) |
| 45 to 54 Years | 61 (100.0%) | 52 (100.0%) |
| 55 to 64 Years | 84 (79.2%) | 36 (100.0%) |
| 65 to 74 Years | 182 (100.0%) | 80 (100.0%) |
| 75 Years and over | 15 (100.0%) | 24 (100.0%) |
| Total | 552 (91.5%) | 341 (67.1%) |
Income Below Poverty Among Married-Couple Families in Gallant
The poverty statistics for married-couple families in Gallant show that 3.6% or 8 of the total 220 families live below the poverty line. Families with 3 or 4 children have the highest poverty rate of 14.0%, comprising of 8 families. On the other hand, families with no children have the lowest poverty rate of 0.0%, which includes 0 families.
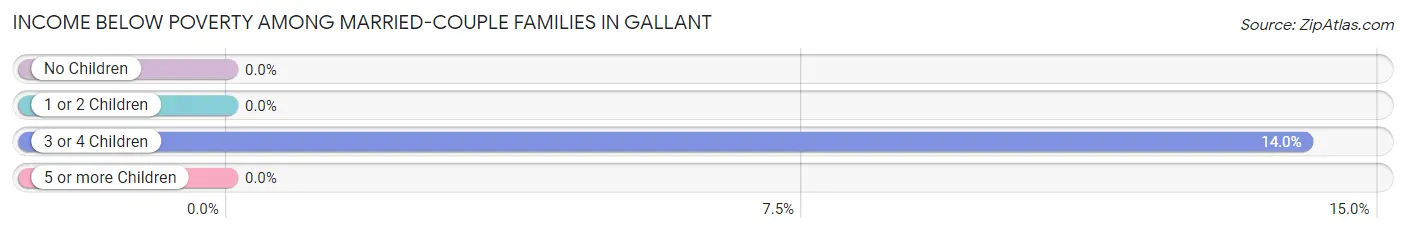
| Children | Above Poverty | Below Poverty |
| No Children | 147 (100.0%) | 0 (0.0%) |
| 1 or 2 Children | 16 (100.0%) | 0 (0.0%) |
| 3 or 4 Children | 49 (86.0%) | 8 (14.0%) |
| 5 or more Children | 0 (0.0%) | 0 (0.0%) |
| Total | 212 (96.4%) | 8 (3.6%) |
Income Below Poverty Among Single-Parent Households in Gallant
According to the poverty data in Gallant, 100.0% or 22 single-father households and 62.5% or 25 single-mother households are living below the poverty line. Among single-father households, those with 3 or 4 children have the highest poverty rate, with 22 households (100.0%) experiencing poverty. Likewise, among single-mother households, those with 1 or 2 children have the highest poverty rate, with 12 households (100.0%) falling below the poverty line.
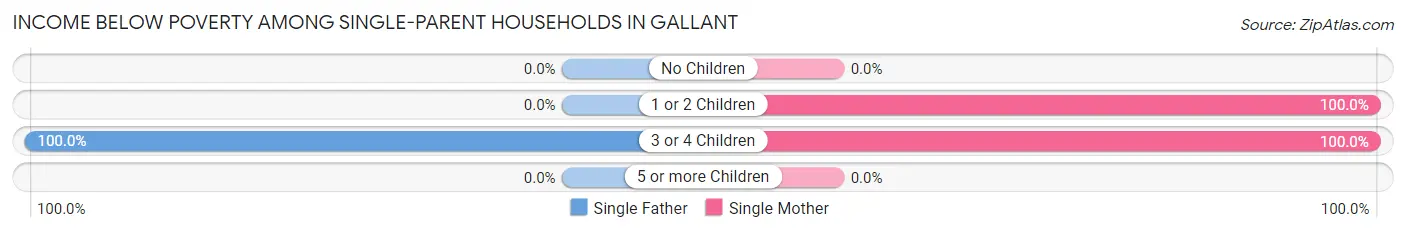
| Children | Single Father | Single Mother |
| No Children | 0 (0.0%) | 0 (0.0%) |
| 1 or 2 Children | 0 (0.0%) | 12 (100.0%) |
| 3 or 4 Children | 22 (100.0%) | 13 (100.0%) |
| 5 or more Children | 0 (0.0%) | 0 (0.0%) |
| Total | 22 (100.0%) | 25 (62.5%) |
Income Below Poverty Among Married-Couple vs Single-Parent Households in Gallant
The poverty data for Gallant shows that 8 of the married-couple family households (3.6%) and 47 of the single-parent households (75.8%) are living below the poverty level. Within the married-couple family households, those with 3 or 4 children have the highest poverty rate, with 8 households (14.0%) falling below the poverty line. Among the single-parent households, those with 1 or 2 children have the highest poverty rate, with 12 household (100.0%) living below poverty.
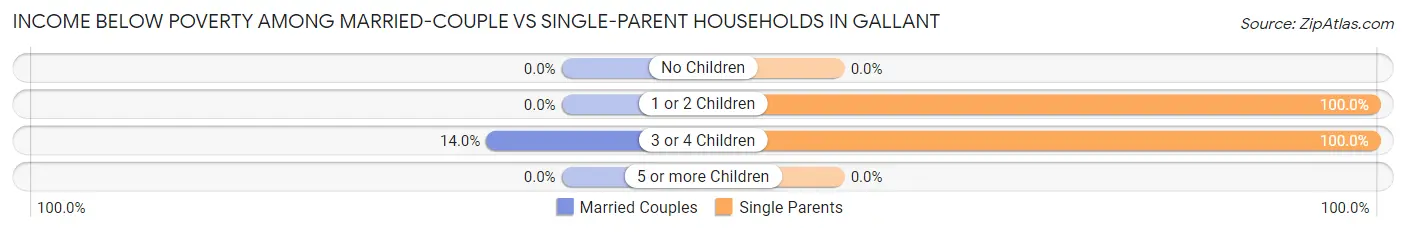
| Children | Married-Couple Families | Single-Parent Households |
| No Children | 0 (0.0%) | 0 (0.0%) |
| 1 or 2 Children | 0 (0.0%) | 12 (100.0%) |
| 3 or 4 Children | 8 (14.0%) | 35 (100.0%) |
| 5 or more Children | 0 (0.0%) | 0 (0.0%) |
| Total | 8 (3.6%) | 47 (75.8%) |
Employment Characteristics in Gallant
Employment by Class of Employer in Gallant
Among the 347 employed individuals in Gallant, private company employees (177 | 51.0%), local government employees (104 | 30.0%), and self-employed (not incorporated) (23 | 6.6%) make up the most common classes of employment.
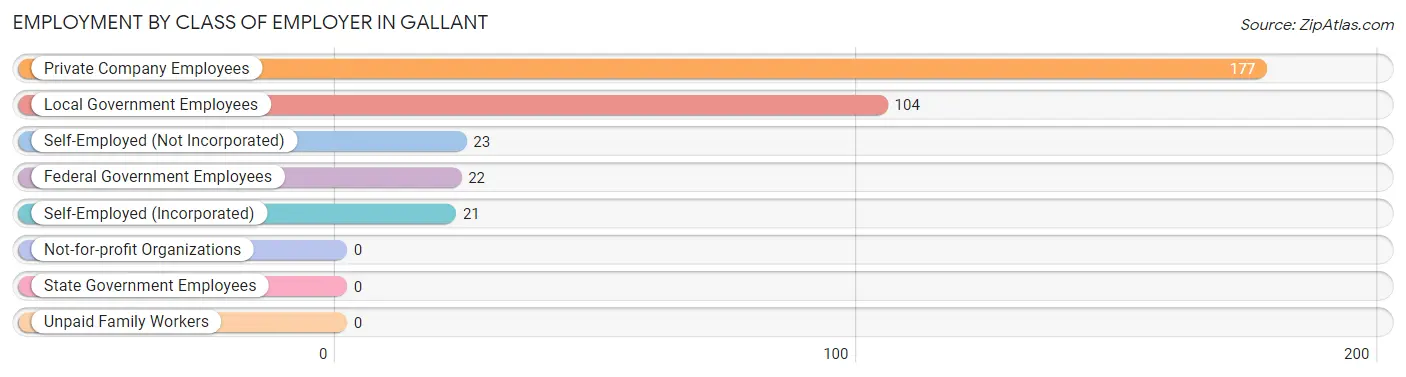
| Employer Class | # Employees | % Employees |
| Private Company Employees | 177 | 51.0% |
| Self-Employed (Incorporated) | 21 | 6.0% |
| Self-Employed (Not Incorporated) | 23 | 6.6% |
| Not-for-profit Organizations | 0 | 0.0% |
| Local Government Employees | 104 | 30.0% |
| State Government Employees | 0 | 0.0% |
| Federal Government Employees | 22 | 6.3% |
| Unpaid Family Workers | 0 | 0.0% |
| Total | 347 | 100.0% |
Employment Status by Age in Gallant
According to the labor force statistics for Gallant, out of the total population over 16 years of age (823), 44.0% or 362 individuals are in the labor force, with 4.1% or 15 of them unemployed. The age group with the highest labor force participation rate is 25 to 29 years, with 100.0% or 43 individuals in the labor force. Within the labor force, the 65 to 74 years age range has the highest percentage of unemployed individuals, with 22.4% or 15 of them being unemployed.
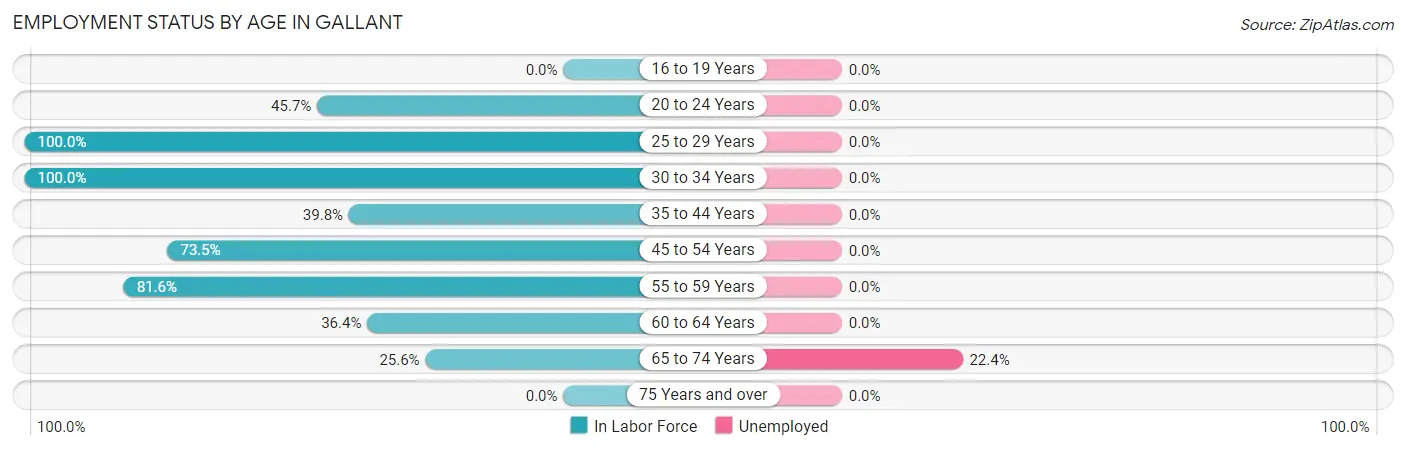
| Age Bracket | In Labor Force | Unemployed |
| 16 to 19 Years | 0 (0.0%) | 0 (0.0%) |
| 20 to 24 Years | 21 (45.7%) | 0 (0.0%) |
| 25 to 29 Years | 43 (100.0%) | 0 (0.0%) |
| 30 to 34 Years | 8 (100.0%) | 0 (0.0%) |
| 35 to 44 Years | 49 (39.8%) | 0 (0.0%) |
| 45 to 54 Years | 83 (73.5%) | 0 (0.0%) |
| 55 to 59 Years | 71 (81.6%) | 0 (0.0%) |
| 60 to 64 Years | 20 (36.4%) | 0 (0.0%) |
| 65 to 74 Years | 67 (25.6%) | 15 (22.4%) |
| 75 Years and over | 0 (0.0%) | 0 (0.0%) |
| Total | 362 (44.0%) | 15 (4.1%) |
Employment Status by Educational Attainment in Gallant
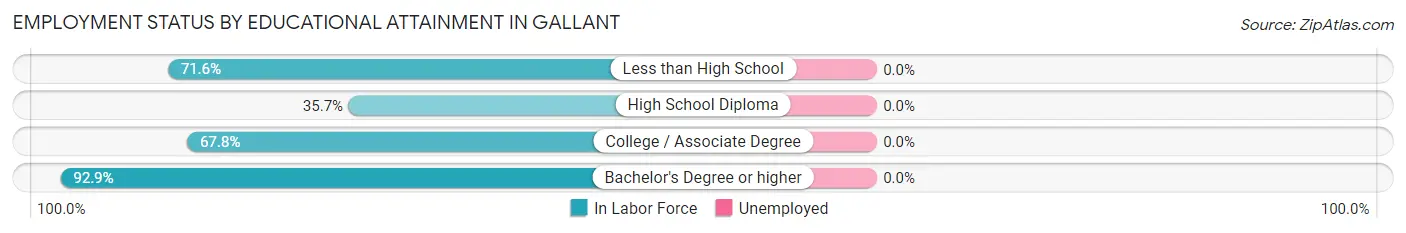
| Educational Attainment | In Labor Force | Unemployed |
| Less than High School | 48 (71.6%) | 0 (0.0%) |
| High School Diploma | 41 (35.7%) | 0 (0.0%) |
| College / Associate Degree | 120 (67.8%) | 0 (0.0%) |
| Bachelor's Degree or higher | 65 (92.9%) | 0 (0.0%) |
| Total | 274 (63.9%) | 0 (0.0%) |
Employment Occupations by Sex in Gallant
Management, Business, Science and Arts Occupations
The most common Management, Business, Science and Arts occupations in Gallant are Community & Social Service (45 | 13.0%), Education Instruction & Library (45 | 13.0%), Health Diagnosing & Treating (20 | 5.8%), Management (14 | 4.0%), and Business & Financial (12 | 3.5%).
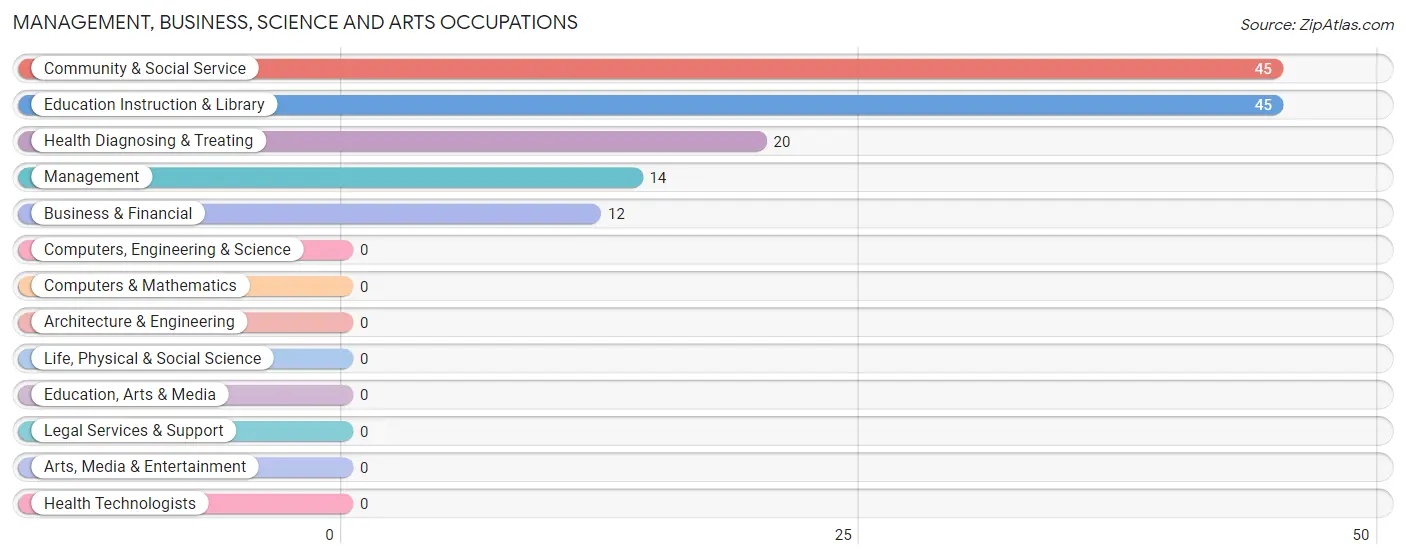
Management, Business, Science and Arts Occupations by Sex
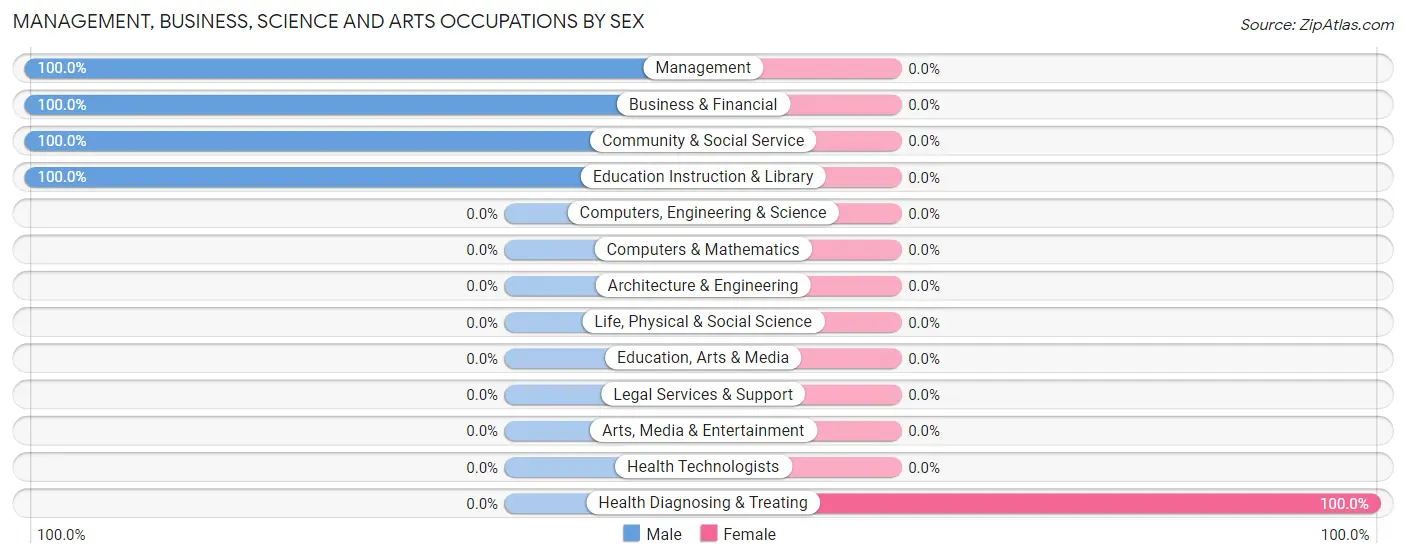
| Occupation | Male | Female |
| Management | 14 (100.0%) | 0 (0.0%) |
| Business & Financial | 12 (100.0%) | 0 (0.0%) |
| Computers, Engineering & Science | 0 (0.0%) | 0 (0.0%) |
| Computers & Mathematics | 0 (0.0%) | 0 (0.0%) |
| Architecture & Engineering | 0 (0.0%) | 0 (0.0%) |
| Life, Physical & Social Science | 0 (0.0%) | 0 (0.0%) |
| Community & Social Service | 45 (100.0%) | 0 (0.0%) |
| Education, Arts & Media | 0 (0.0%) | 0 (0.0%) |
| Legal Services & Support | 0 (0.0%) | 0 (0.0%) |
| Education Instruction & Library | 45 (100.0%) | 0 (0.0%) |
| Arts, Media & Entertainment | 0 (0.0%) | 0 (0.0%) |
| Health Diagnosing & Treating | 0 (0.0%) | 20 (100.0%) |
| Health Technologists | 0 (0.0%) | 0 (0.0%) |
| Total (Category) | 71 (78.0%) | 20 (22.0%) |
| Total (Overall) | 242 (69.7%) | 105 (30.3%) |
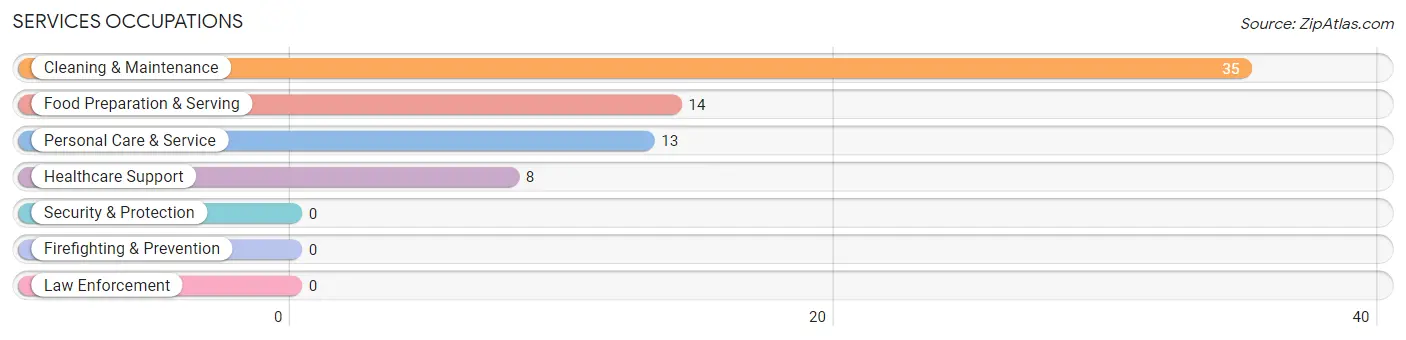
Services Occupations
The most common Services occupations in Gallant are Cleaning & Maintenance (35 | 10.1%), Food Preparation & Serving (14 | 4.0%), Personal Care & Service (13 | 3.7%), and Healthcare Support (8 | 2.3%).
Services Occupations by Sex
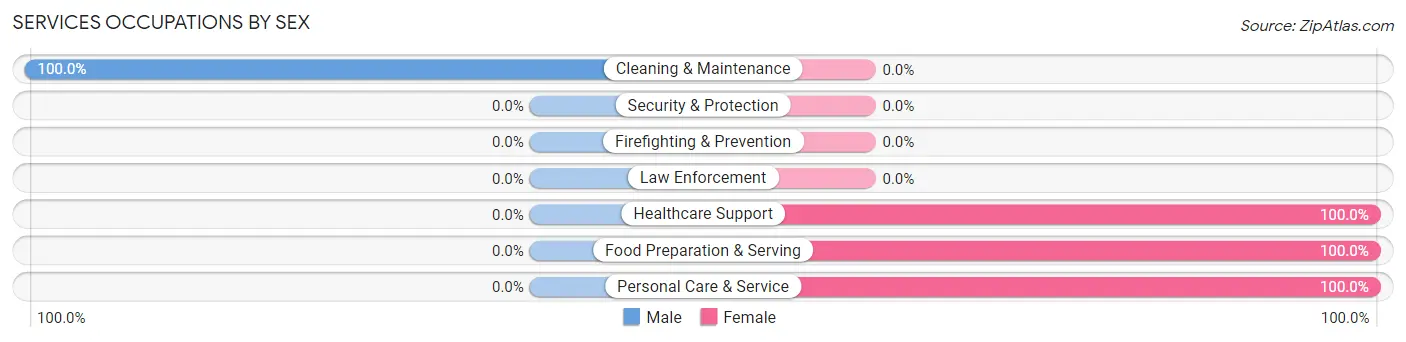
| Occupation | Male | Female |
| Healthcare Support | 0 (0.0%) | 8 (100.0%) |
| Security & Protection | 0 (0.0%) | 0 (0.0%) |
| Firefighting & Prevention | 0 (0.0%) | 0 (0.0%) |
| Law Enforcement | 0 (0.0%) | 0 (0.0%) |
| Food Preparation & Serving | 0 (0.0%) | 14 (100.0%) |
| Cleaning & Maintenance | 35 (100.0%) | 0 (0.0%) |
| Personal Care & Service | 0 (0.0%) | 13 (100.0%) |
| Total (Category) | 35 (50.0%) | 35 (50.0%) |
| Total (Overall) | 242 (69.7%) | 105 (30.3%) |
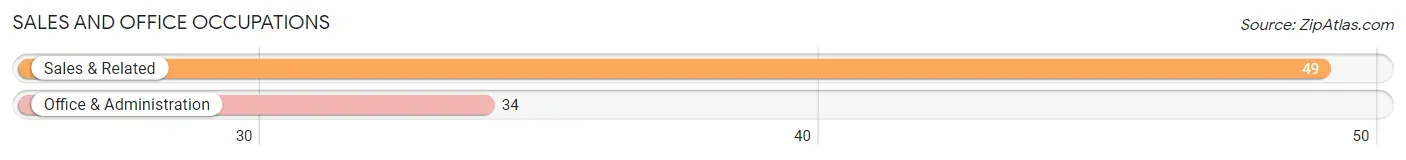
Sales and Office Occupations
The most common Sales and Office occupations in Gallant are Sales & Related (49 | 14.1%), and Office & Administration (34 | 9.8%).
Sales and Office Occupations by Sex
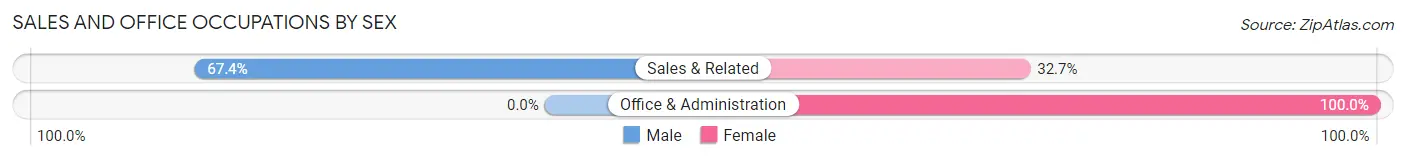
| Occupation | Male | Female |
| Sales & Related | 33 (67.3%) | 16 (32.7%) |
| Office & Administration | 0 (0.0%) | 34 (100.0%) |
| Total (Category) | 33 (39.8%) | 50 (60.2%) |
| Total (Overall) | 242 (69.7%) | 105 (30.3%) |
Natural Resources, Construction and Maintenance Occupations
The most common Natural Resources, Construction and Maintenance occupations in Gallant are , and Construction & Extraction (8 | 2.3%).
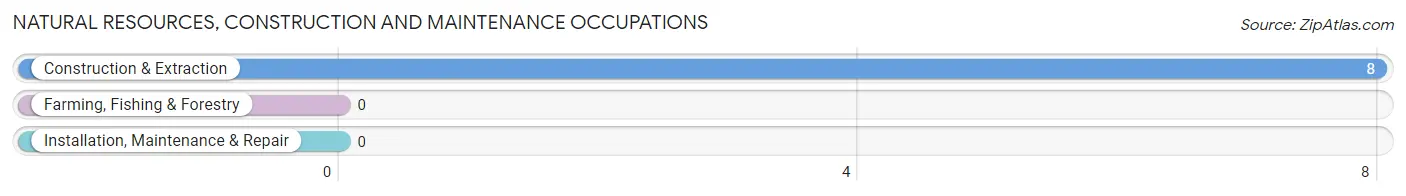
Natural Resources, Construction and Maintenance Occupations by Sex
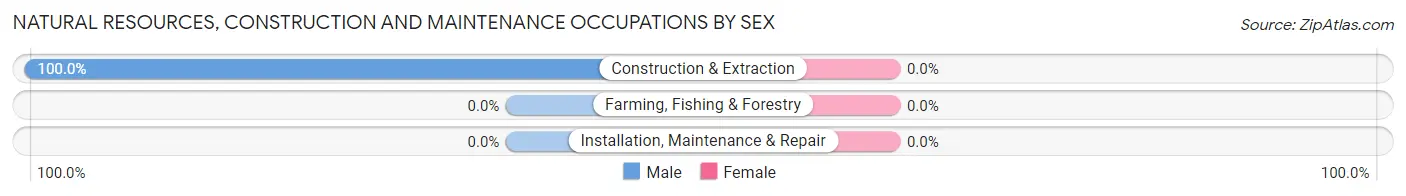
| Occupation | Male | Female |
| Farming, Fishing & Forestry | 0 (0.0%) | 0 (0.0%) |
| Construction & Extraction | 8 (100.0%) | 0 (0.0%) |
| Installation, Maintenance & Repair | 0 (0.0%) | 0 (0.0%) |
| Total (Category) | 8 (100.0%) | 0 (0.0%) |
| Total (Overall) | 242 (69.7%) | 105 (30.3%) |
Production, Transportation and Moving Occupations
The most common Production, Transportation and Moving occupations in Gallant are Production (39 | 11.2%), Material Moving (36 | 10.4%), and Transportation (20 | 5.8%).
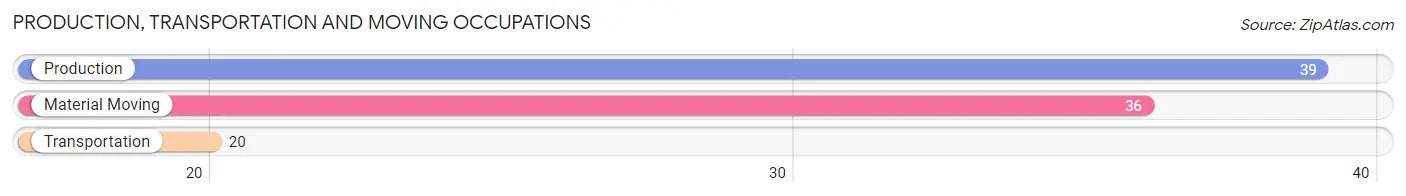
Production, Transportation and Moving Occupations by Sex
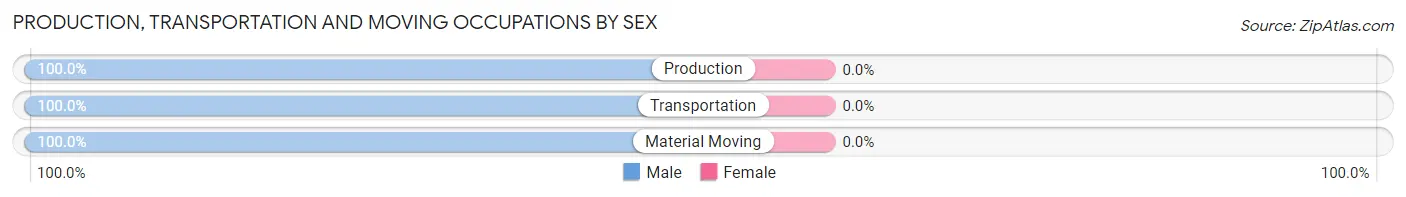
| Occupation | Male | Female |
| Production | 39 (100.0%) | 0 (0.0%) |
| Transportation | 20 (100.0%) | 0 (0.0%) |
| Material Moving | 36 (100.0%) | 0 (0.0%) |
| Total (Category) | 95 (100.0%) | 0 (0.0%) |
| Total (Overall) | 242 (69.7%) | 105 (30.3%) |
Employment Industries by Sex in Gallant
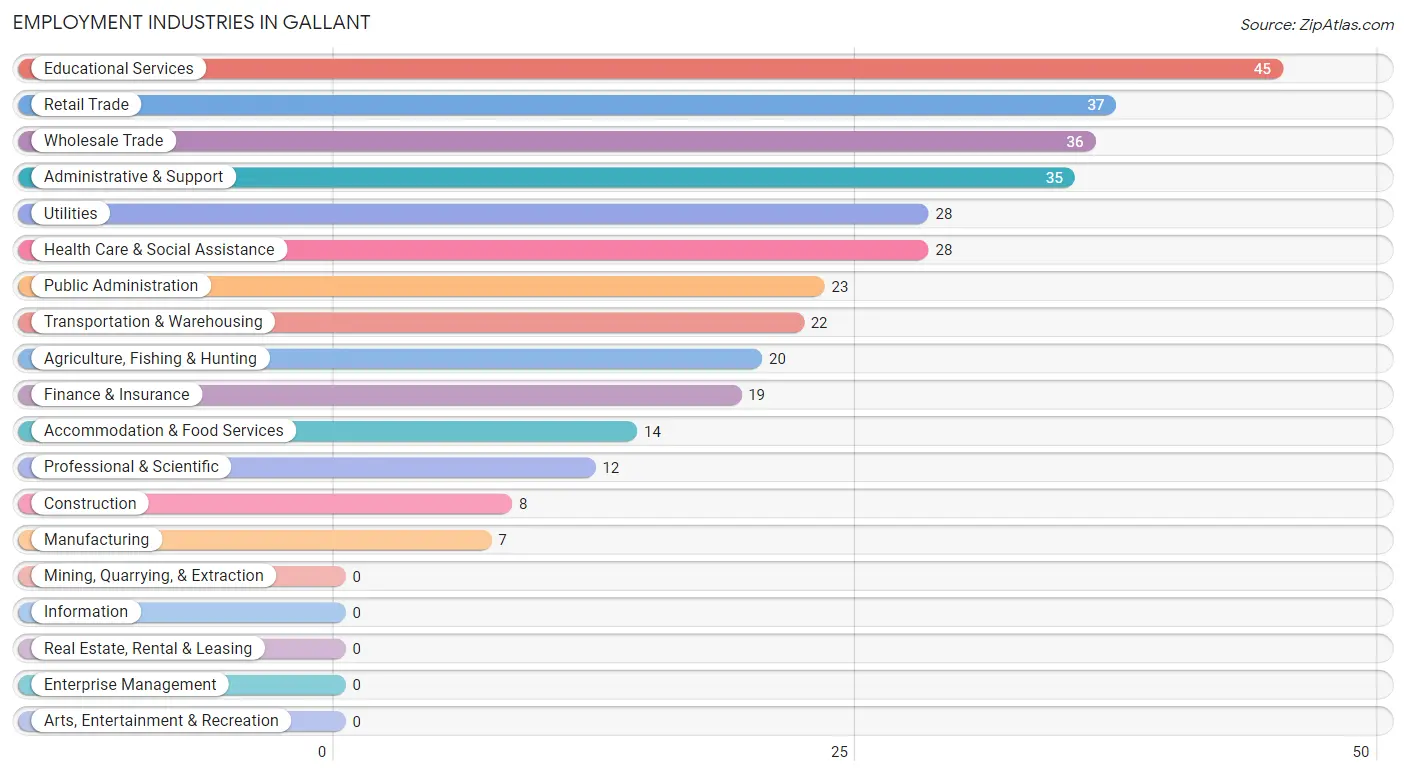
Employment Industries in Gallant
The major employment industries in Gallant include Educational Services (45 | 13.0%), Retail Trade (37 | 10.7%), Wholesale Trade (36 | 10.4%), Administrative & Support (35 | 10.1%), and Utilities (28 | 8.1%).
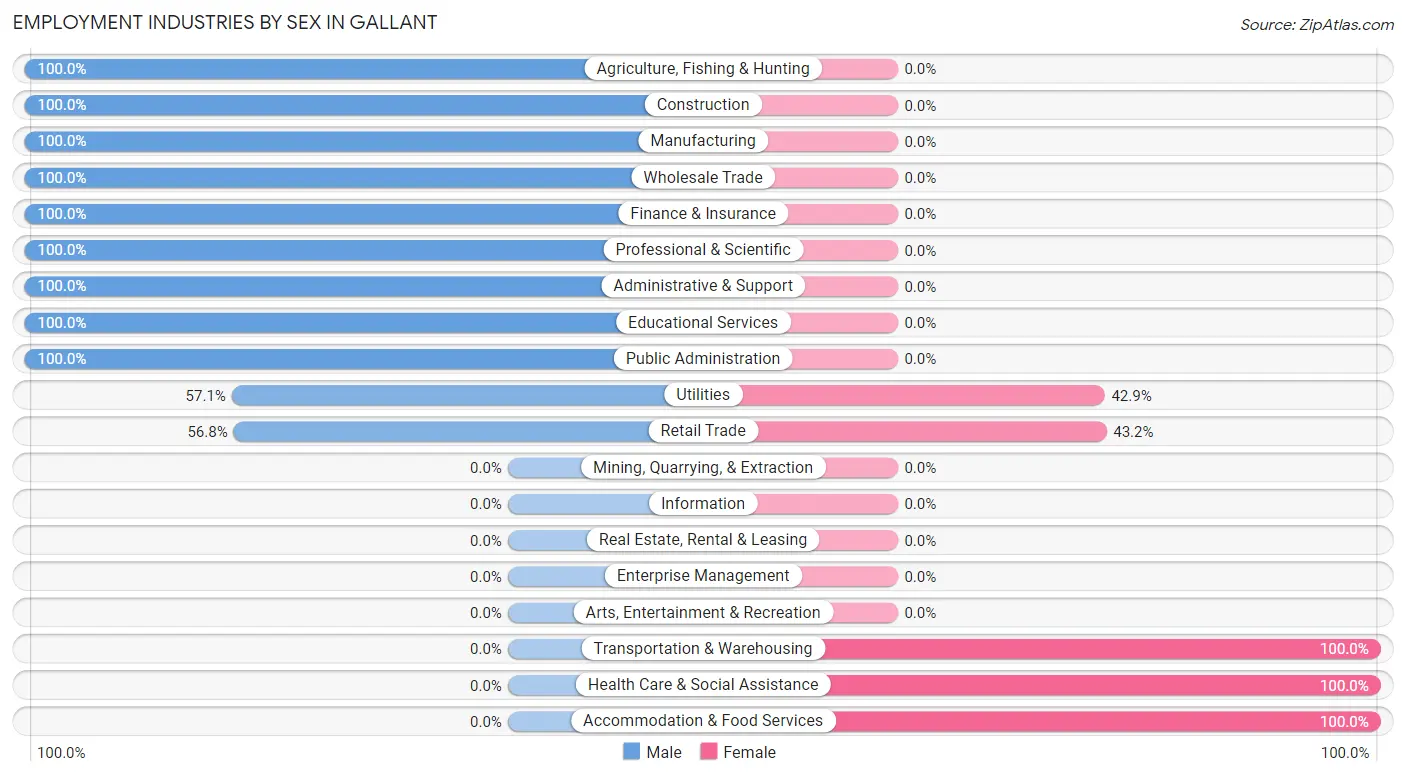
Employment Industries by Sex in Gallant
The Gallant industries that see more men than women are Agriculture, Fishing & Hunting (100.0%), Construction (100.0%), and Manufacturing (100.0%), whereas the industries that tend to have a higher number of women are Transportation & Warehousing (100.0%), Health Care & Social Assistance (100.0%), and Accommodation & Food Services (100.0%).
| Industry | Male | Female |
| Agriculture, Fishing & Hunting | 20 (100.0%) | 0 (0.0%) |
| Mining, Quarrying, & Extraction | 0 (0.0%) | 0 (0.0%) |
| Construction | 8 (100.0%) | 0 (0.0%) |
| Manufacturing | 7 (100.0%) | 0 (0.0%) |
| Wholesale Trade | 36 (100.0%) | 0 (0.0%) |
| Retail Trade | 21 (56.8%) | 16 (43.2%) |
| Transportation & Warehousing | 0 (0.0%) | 22 (100.0%) |
| Utilities | 16 (57.1%) | 12 (42.9%) |
| Information | 0 (0.0%) | 0 (0.0%) |
| Finance & Insurance | 19 (100.0%) | 0 (0.0%) |
| Real Estate, Rental & Leasing | 0 (0.0%) | 0 (0.0%) |
| Professional & Scientific | 12 (100.0%) | 0 (0.0%) |
| Enterprise Management | 0 (0.0%) | 0 (0.0%) |
| Administrative & Support | 35 (100.0%) | 0 (0.0%) |
| Educational Services | 45 (100.0%) | 0 (0.0%) |
| Health Care & Social Assistance | 0 (0.0%) | 28 (100.0%) |
| Arts, Entertainment & Recreation | 0 (0.0%) | 0 (0.0%) |
| Accommodation & Food Services | 0 (0.0%) | 14 (100.0%) |
| Public Administration | 23 (100.0%) | 0 (0.0%) |
| Total | 242 (69.7%) | 105 (30.3%) |
Education in Gallant
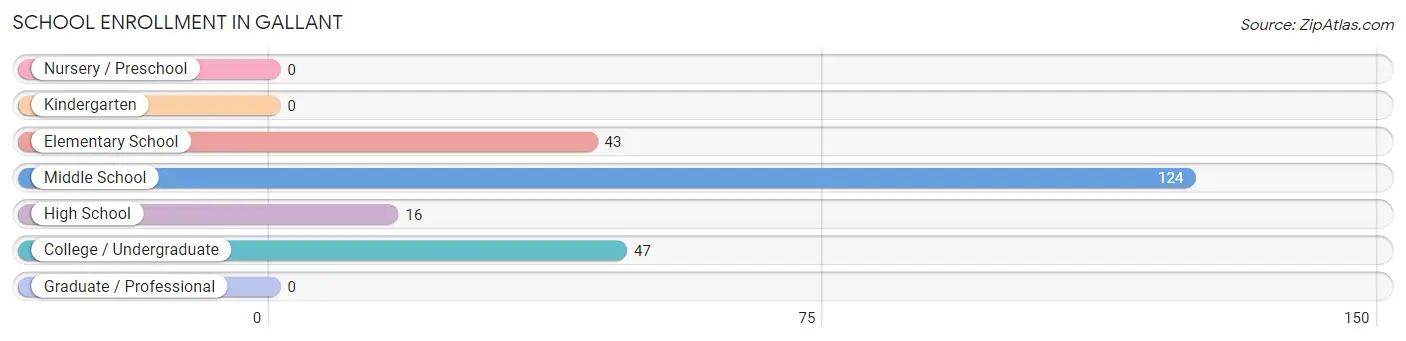
School Enrollment in Gallant
The most common levels of schooling among the 230 students in Gallant are middle school (124 | 53.9%), college / undergraduate (47 | 20.4%), and elementary school (43 | 18.7%).
| School Level | # Students | % Students |
| Nursery / Preschool | 0 | 0.0% |
| Kindergarten | 0 | 0.0% |
| Elementary School | 43 | 18.7% |
| Middle School | 124 | 53.9% |
| High School | 16 | 7.0% |
| College / Undergraduate | 47 | 20.4% |
| Graduate / Professional | 0 | 0.0% |
| Total | 230 | 100.0% |
School Enrollment by Age by Funding Source in Gallant
Out of a total of 230 students who are enrolled in schools in Gallant, 51 (22.2%) attend a private institution, while the remaining 179 (77.8%) are enrolled in public schools. The age group of 5 to 9 year old has the highest likelihood of being enrolled in private schools, with 11 (40.7% in the age bracket) enrolled. Conversely, the age group of 20 to 24 year olds has the lowest likelihood of being enrolled in a private school, with 25 (100.0% in the age bracket) attending a public institution.
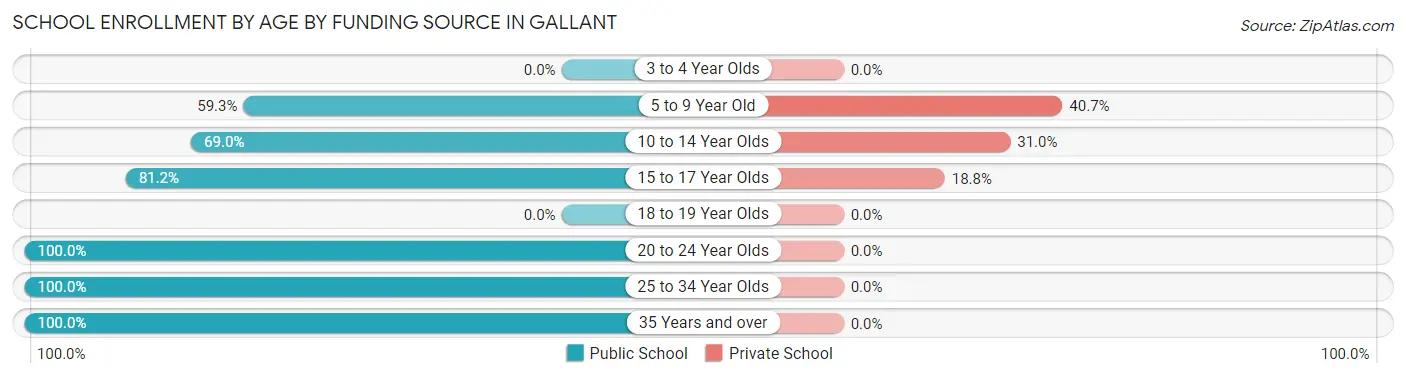
| Age Bracket | Public School | Private School |
| 3 to 4 Year Olds | 0 (0.0%) | 0 (0.0%) |
| 5 to 9 Year Old | 16 (59.3%) | 11 (40.7%) |
| 10 to 14 Year Olds | 60 (69.0%) | 27 (31.0%) |
| 15 to 17 Year Olds | 56 (81.2%) | 13 (18.8%) |
| 18 to 19 Year Olds | 0 (0.0%) | 0 (0.0%) |
| 20 to 24 Year Olds | 25 (100.0%) | 0 (0.0%) |
| 25 to 34 Year Olds | 8 (100.0%) | 0 (0.0%) |
| 35 Years and over | 14 (100.0%) | 0 (0.0%) |
| Total | 179 (77.8%) | 51 (22.2%) |
Educational Attainment by Field of Study in Gallant
Education (39 | 33.9%), liberal arts & history (22 | 19.1%), visual & performing arts (22 | 19.1%), computers & mathematics (20 | 17.4%), and engineering (12 | 10.4%) are the most common fields of study among 115 individuals in Gallant who have obtained a bachelor's degree or higher.
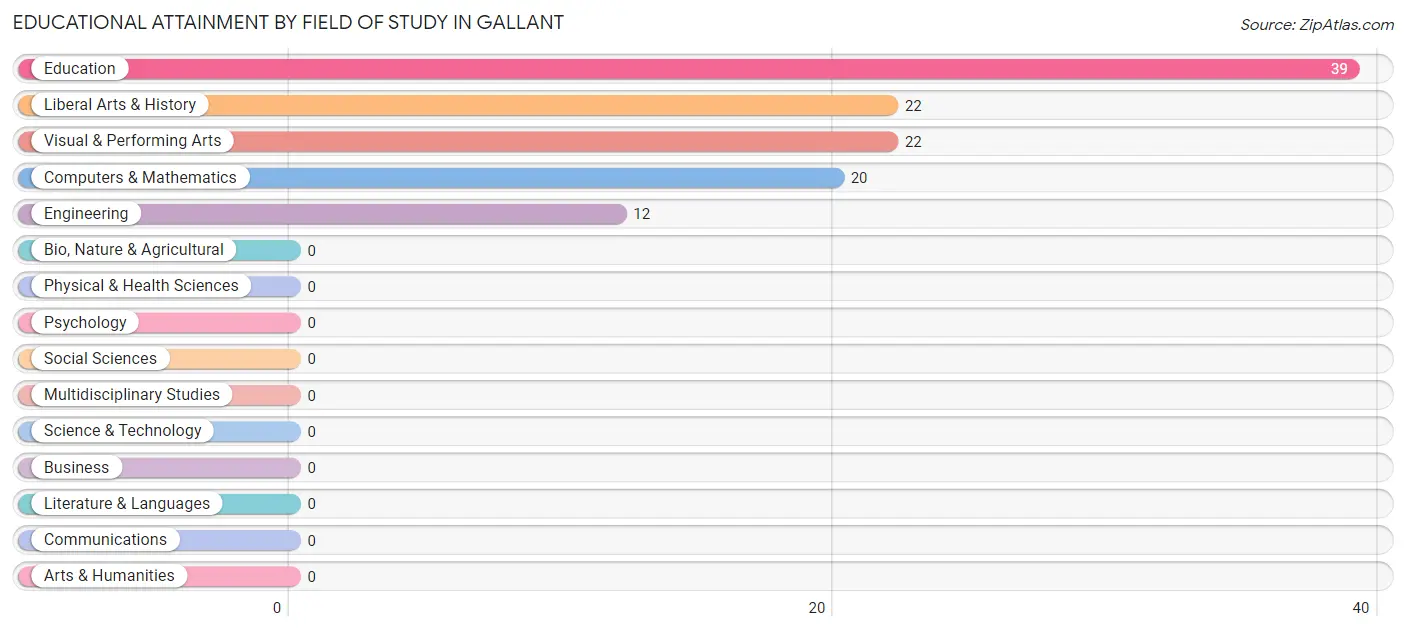
| Field of Study | # Graduates | % Graduates |
| Computers & Mathematics | 20 | 17.4% |
| Bio, Nature & Agricultural | 0 | 0.0% |
| Physical & Health Sciences | 0 | 0.0% |
| Psychology | 0 | 0.0% |
| Social Sciences | 0 | 0.0% |
| Engineering | 12 | 10.4% |
| Multidisciplinary Studies | 0 | 0.0% |
| Science & Technology | 0 | 0.0% |
| Business | 0 | 0.0% |
| Education | 39 | 33.9% |
| Literature & Languages | 0 | 0.0% |
| Liberal Arts & History | 22 | 19.1% |
| Visual & Performing Arts | 22 | 19.1% |
| Communications | 0 | 0.0% |
| Arts & Humanities | 0 | 0.0% |
| Total | 115 | 100.0% |
Transportation & Commute in Gallant
Vehicle Availability by Sex in Gallant
The most prevalent vehicle ownership categories in Gallant are males with 2 vehicles (171, accounting for 70.7%) and females with 2 vehicles (58, making up 162.9%).
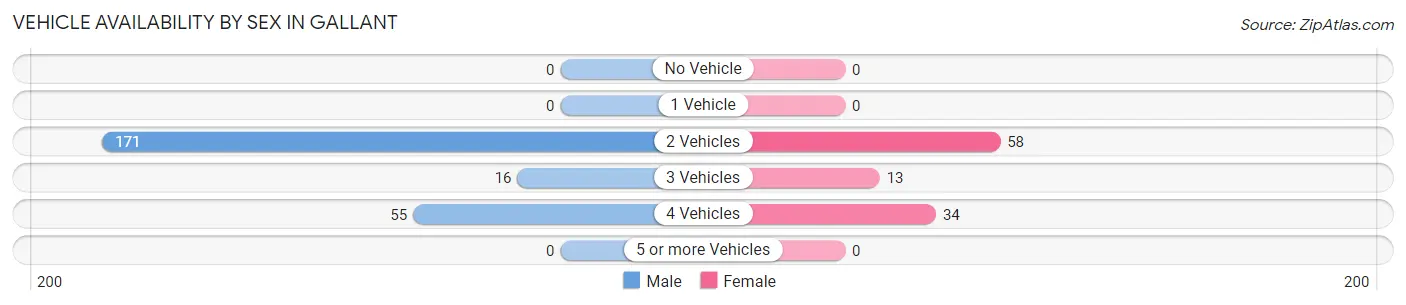
| Vehicles Available | Male | Female |
| No Vehicle | 0 (0.0%) | 0 (0.0%) |
| 1 Vehicle | 0 (0.0%) | 0 (0.0%) |
| 2 Vehicles | 171 (70.7%) | 58 (55.2%) |
| 3 Vehicles | 16 (6.6%) | 13 (12.4%) |
| 4 Vehicles | 55 (22.7%) | 34 (32.4%) |
| 5 or more Vehicles | 0 (0.0%) | 0 (0.0%) |
| Total | 242 (100.0%) | 105 (100.0%) |
Commute Time in Gallant
The most frequently occuring commute durations in Gallant are 30 to 34 minutes (80 commuters, 23.1%), 15 to 19 minutes (77 commuters, 22.2%), and 20 to 24 minutes (71 commuters, 20.5%).
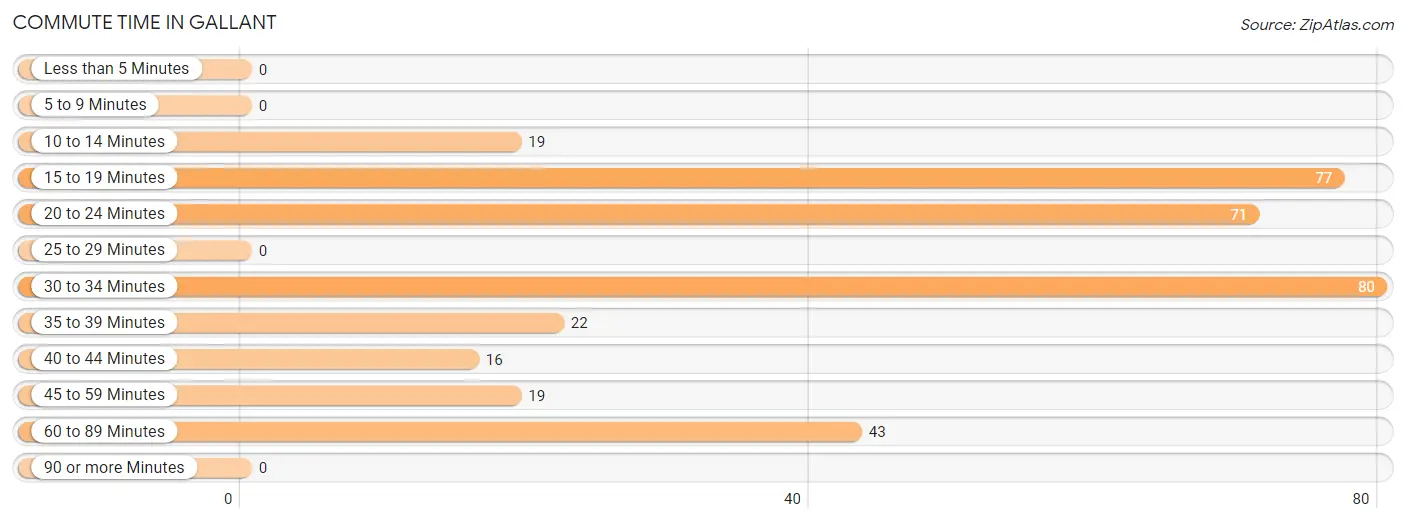
| Commute Time | # Commuters | % Commuters |
| Less than 5 Minutes | 0 | 0.0% |
| 5 to 9 Minutes | 0 | 0.0% |
| 10 to 14 Minutes | 19 | 5.5% |
| 15 to 19 Minutes | 77 | 22.2% |
| 20 to 24 Minutes | 71 | 20.5% |
| 25 to 29 Minutes | 0 | 0.0% |
| 30 to 34 Minutes | 80 | 23.1% |
| 35 to 39 Minutes | 22 | 6.3% |
| 40 to 44 Minutes | 16 | 4.6% |
| 45 to 59 Minutes | 19 | 5.5% |
| 60 to 89 Minutes | 43 | 12.4% |
| 90 or more Minutes | 0 | 0.0% |
Commute Time by Sex in Gallant
The most common commute times in Gallant are 30 to 34 minutes (67 commuters, 27.7%) for males and 15 to 19 minutes (32 commuters, 30.5%) for females.
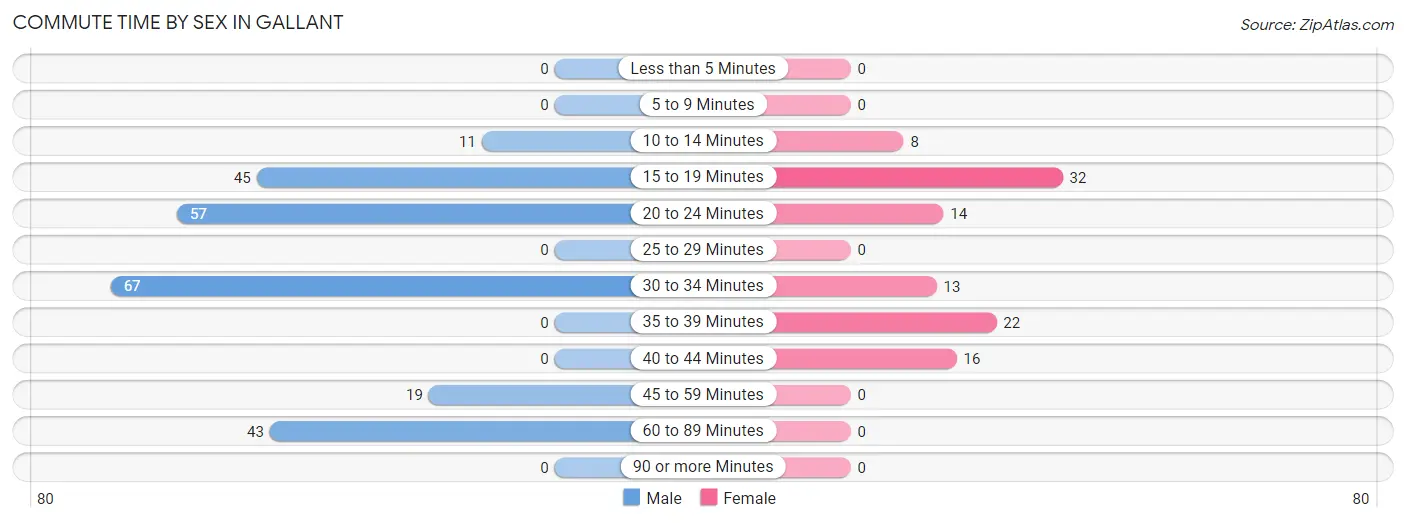
| Commute Time | Male | Female |
| Less than 5 Minutes | 0 (0.0%) | 0 (0.0%) |
| 5 to 9 Minutes | 0 (0.0%) | 0 (0.0%) |
| 10 to 14 Minutes | 11 (4.5%) | 8 (7.6%) |
| 15 to 19 Minutes | 45 (18.6%) | 32 (30.5%) |
| 20 to 24 Minutes | 57 (23.5%) | 14 (13.3%) |
| 25 to 29 Minutes | 0 (0.0%) | 0 (0.0%) |
| 30 to 34 Minutes | 67 (27.7%) | 13 (12.4%) |
| 35 to 39 Minutes | 0 (0.0%) | 22 (20.9%) |
| 40 to 44 Minutes | 0 (0.0%) | 16 (15.2%) |
| 45 to 59 Minutes | 19 (7.9%) | 0 (0.0%) |
| 60 to 89 Minutes | 43 (17.8%) | 0 (0.0%) |
| 90 or more Minutes | 0 (0.0%) | 0 (0.0%) |
Time of Departure to Work by Sex in Gallant
The most frequent times of departure to work in Gallant are 6:00 AM to 6:29 AM (62, 25.6%) for males and 7:30 AM to 7:59 AM (32, 30.5%) for females.
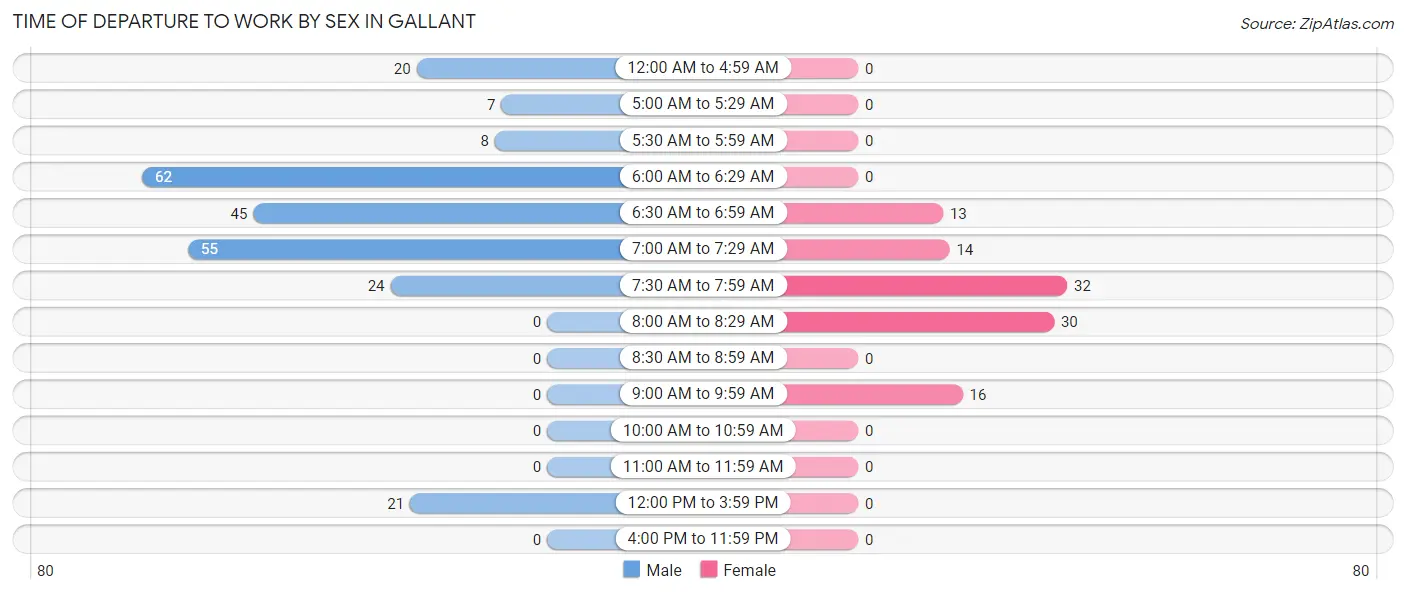
| Time of Departure | Male | Female |
| 12:00 AM to 4:59 AM | 20 (8.3%) | 0 (0.0%) |
| 5:00 AM to 5:29 AM | 7 (2.9%) | 0 (0.0%) |
| 5:30 AM to 5:59 AM | 8 (3.3%) | 0 (0.0%) |
| 6:00 AM to 6:29 AM | 62 (25.6%) | 0 (0.0%) |
| 6:30 AM to 6:59 AM | 45 (18.6%) | 13 (12.4%) |
| 7:00 AM to 7:29 AM | 55 (22.7%) | 14 (13.3%) |
| 7:30 AM to 7:59 AM | 24 (9.9%) | 32 (30.5%) |
| 8:00 AM to 8:29 AM | 0 (0.0%) | 30 (28.6%) |
| 8:30 AM to 8:59 AM | 0 (0.0%) | 0 (0.0%) |
| 9:00 AM to 9:59 AM | 0 (0.0%) | 16 (15.2%) |
| 10:00 AM to 10:59 AM | 0 (0.0%) | 0 (0.0%) |
| 11:00 AM to 11:59 AM | 0 (0.0%) | 0 (0.0%) |
| 12:00 PM to 3:59 PM | 21 (8.7%) | 0 (0.0%) |
| 4:00 PM to 11:59 PM | 0 (0.0%) | 0 (0.0%) |
| Total | 242 (100.0%) | 105 (100.0%) |
Housing Occupancy in Gallant
Occupancy by Ownership in Gallant
Of the total 433 dwellings in Gallant, owner-occupied units account for 409 (94.5%), while renter-occupied units make up 24 (5.5%).
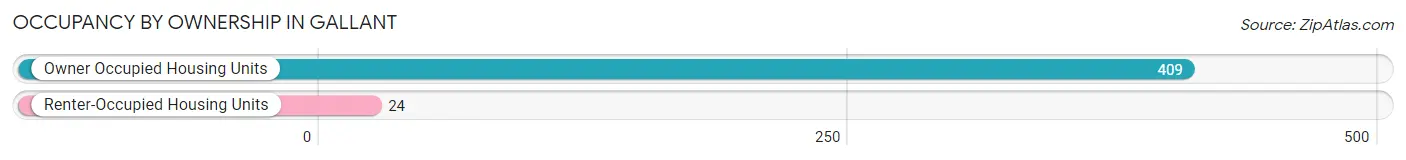
| Occupancy | # Housing Units | % Housing Units |
| Owner Occupied Housing Units | 409 | 94.5% |
| Renter-Occupied Housing Units | 24 | 5.5% |
| Total Occupied Housing Units | 433 | 100.0% |
Occupancy by Household Size in Gallant
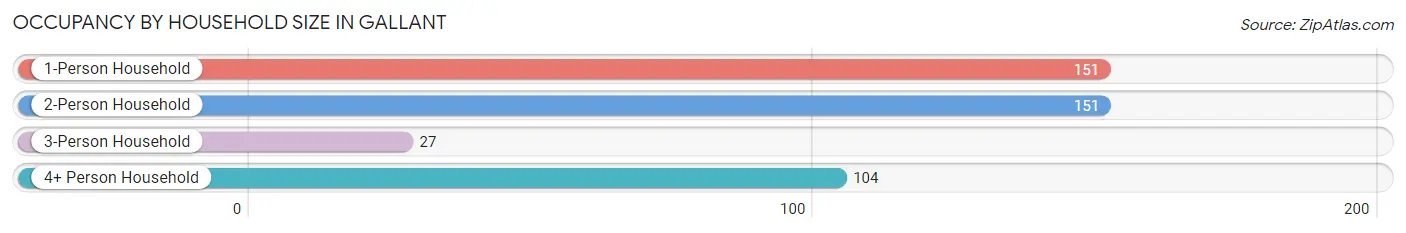
| Household Size | # Housing Units | % Housing Units |
| 1-Person Household | 151 | 34.9% |
| 2-Person Household | 151 | 34.9% |
| 3-Person Household | 27 | 6.2% |
| 4+ Person Household | 104 | 24.0% |
| Total Housing Units | 433 | 100.0% |
Occupancy by Ownership by Household Size in Gallant
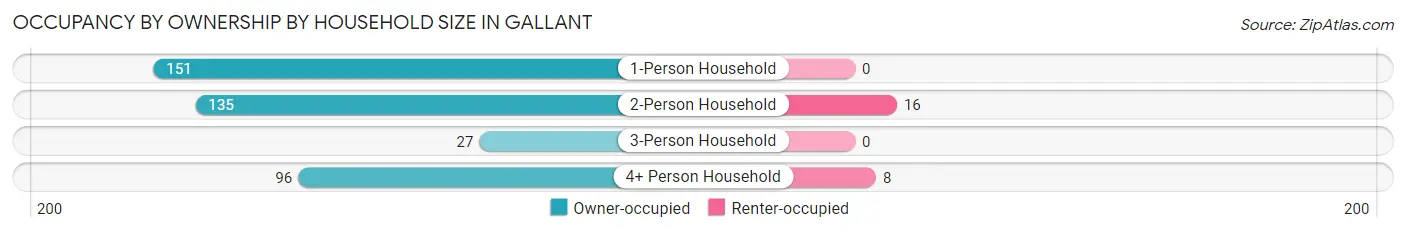
| Household Size | Owner-occupied | Renter-occupied |
| 1-Person Household | 151 (100.0%) | 0 (0.0%) |
| 2-Person Household | 135 (89.4%) | 16 (10.6%) |
| 3-Person Household | 27 (100.0%) | 0 (0.0%) |
| 4+ Person Household | 96 (92.3%) | 8 (7.7%) |
| Total Housing Units | 409 (94.5%) | 24 (5.5%) |
Occupancy by Educational Attainment in Gallant
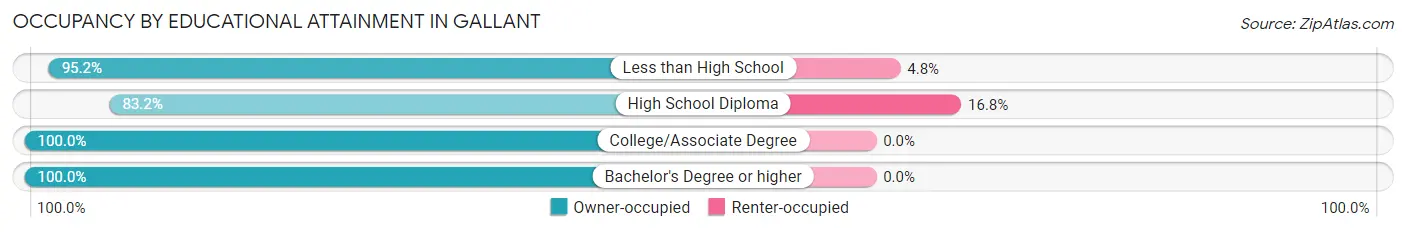
| Household Size | Owner-occupied | Renter-occupied |
| Less than High School | 159 (95.2%) | 8 (4.8%) |
| High School Diploma | 79 (83.2%) | 16 (16.8%) |
| College/Associate Degree | 128 (100.0%) | 0 (0.0%) |
| Bachelor's Degree or higher | 43 (100.0%) | 0 (0.0%) |
Occupancy by Age of Householder in Gallant
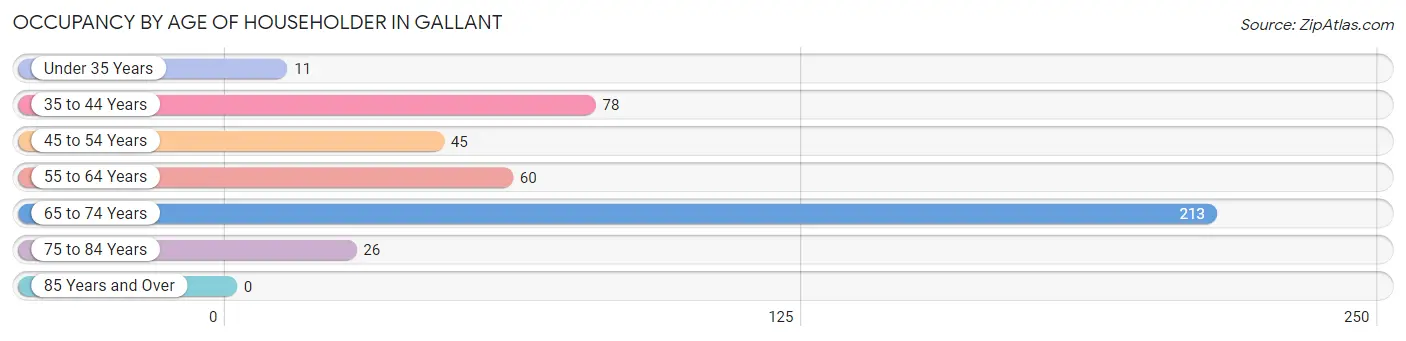
| Age Bracket | # Households | % Households |
| Under 35 Years | 11 | 2.5% |
| 35 to 44 Years | 78 | 18.0% |
| 45 to 54 Years | 45 | 10.4% |
| 55 to 64 Years | 60 | 13.9% |
| 65 to 74 Years | 213 | 49.2% |
| 75 to 84 Years | 26 | 6.0% |
| 85 Years and Over | 0 | 0.0% |
| Total | 433 | 100.0% |
Housing Finances in Gallant
Median Income by Occupancy in Gallant
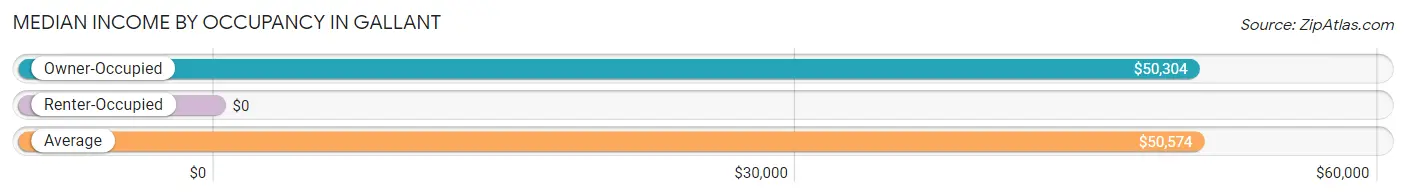
| Occupancy Type | # Households | Median Income |
| Owner-Occupied | 409 (94.5%) | $50,304 |
| Renter-Occupied | 24 (5.5%) | $0 |
| Average | 433 (100.0%) | $50,574 |
Occupancy by Householder Income Bracket in Gallant
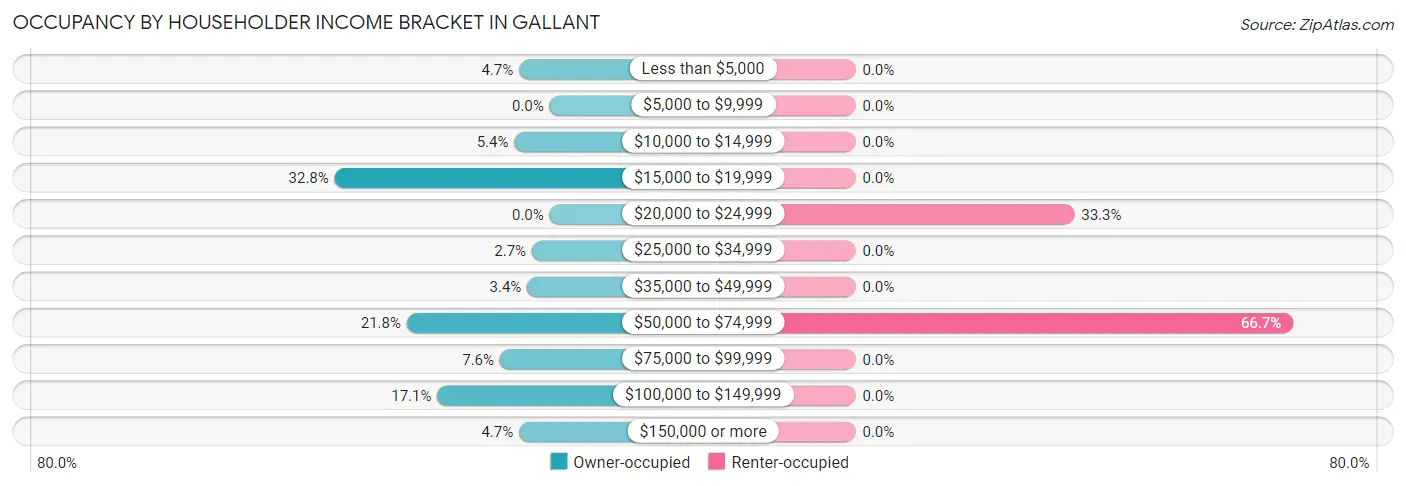
| Income Bracket | Owner-occupied | Renter-occupied |
| Less than $5,000 | 19 (4.6%) | 0 (0.0%) |
| $5,000 to $9,999 | 0 (0.0%) | 0 (0.0%) |
| $10,000 to $14,999 | 22 (5.4%) | 0 (0.0%) |
| $15,000 to $19,999 | 134 (32.8%) | 0 (0.0%) |
| $20,000 to $24,999 | 0 (0.0%) | 8 (33.3%) |
| $25,000 to $34,999 | 11 (2.7%) | 0 (0.0%) |
| $35,000 to $49,999 | 14 (3.4%) | 0 (0.0%) |
| $50,000 to $74,999 | 89 (21.8%) | 16 (66.7%) |
| $75,000 to $99,999 | 31 (7.6%) | 0 (0.0%) |
| $100,000 to $149,999 | 70 (17.1%) | 0 (0.0%) |
| $150,000 or more | 19 (4.6%) | 0 (0.0%) |
| Total | 409 (100.0%) | 24 (100.0%) |
Monthly Housing Cost Tiers in Gallant
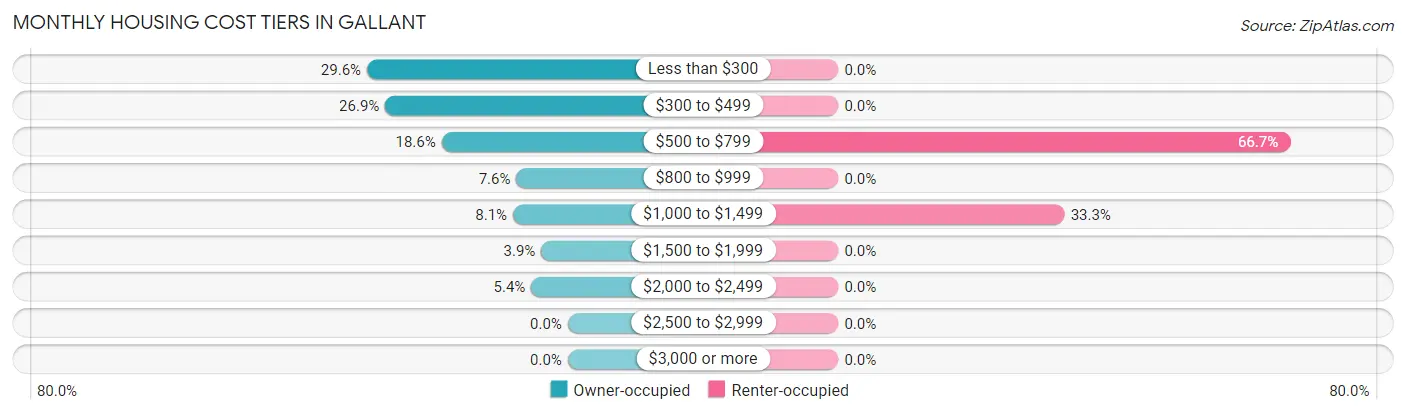
| Monthly Cost | Owner-occupied | Renter-occupied |
| Less than $300 | 121 (29.6%) | 0 (0.0%) |
| $300 to $499 | 110 (26.9%) | 0 (0.0%) |
| $500 to $799 | 76 (18.6%) | 16 (66.7%) |
| $800 to $999 | 31 (7.6%) | 0 (0.0%) |
| $1,000 to $1,499 | 33 (8.1%) | 8 (33.3%) |
| $1,500 to $1,999 | 16 (3.9%) | 0 (0.0%) |
| $2,000 to $2,499 | 22 (5.4%) | 0 (0.0%) |
| $2,500 to $2,999 | 0 (0.0%) | 0 (0.0%) |
| $3,000 or more | 0 (0.0%) | 0 (0.0%) |
| Total | 409 (100.0%) | 24 (100.0%) |
Physical Housing Characteristics in Gallant
Housing Structures in Gallant
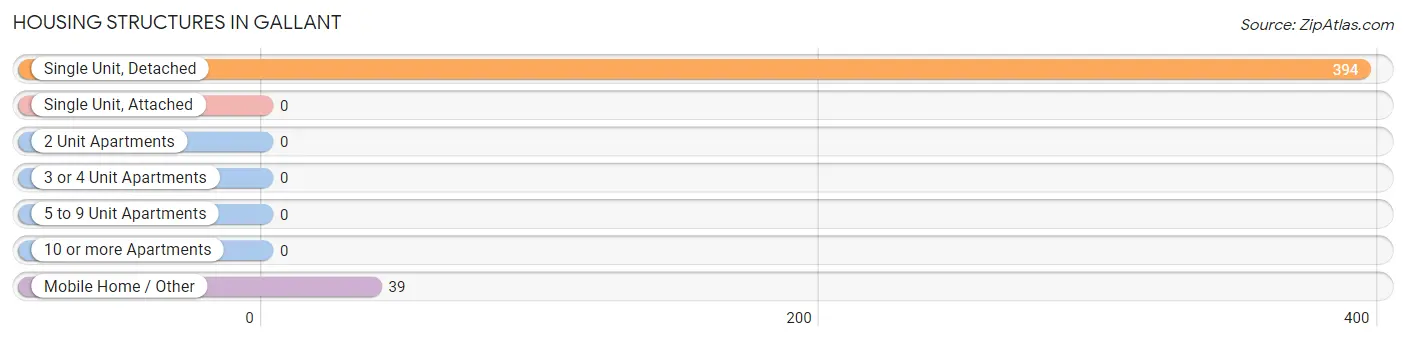
| Structure Type | # Housing Units | % Housing Units |
| Single Unit, Detached | 394 | 91.0% |
| Single Unit, Attached | 0 | 0.0% |
| 2 Unit Apartments | 0 | 0.0% |
| 3 or 4 Unit Apartments | 0 | 0.0% |
| 5 to 9 Unit Apartments | 0 | 0.0% |
| 10 or more Apartments | 0 | 0.0% |
| Mobile Home / Other | 39 | 9.0% |
| Total | 433 | 100.0% |
Housing Structures by Occupancy in Gallant
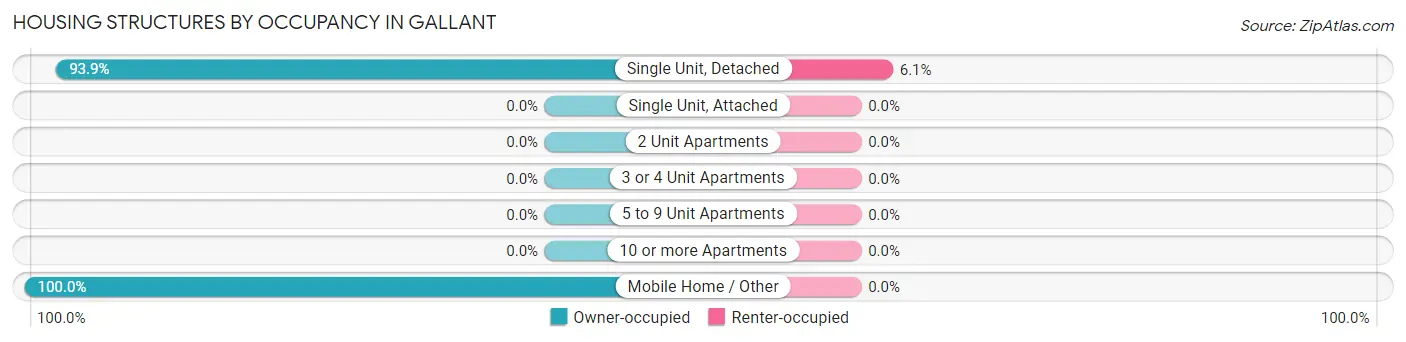
| Structure Type | Owner-occupied | Renter-occupied |
| Single Unit, Detached | 370 (93.9%) | 24 (6.1%) |
| Single Unit, Attached | 0 (0.0%) | 0 (0.0%) |
| 2 Unit Apartments | 0 (0.0%) | 0 (0.0%) |
| 3 or 4 Unit Apartments | 0 (0.0%) | 0 (0.0%) |
| 5 to 9 Unit Apartments | 0 (0.0%) | 0 (0.0%) |
| 10 or more Apartments | 0 (0.0%) | 0 (0.0%) |
| Mobile Home / Other | 39 (100.0%) | 0 (0.0%) |
| Total | 409 (94.5%) | 24 (5.5%) |
Housing Structures by Number of Rooms in Gallant
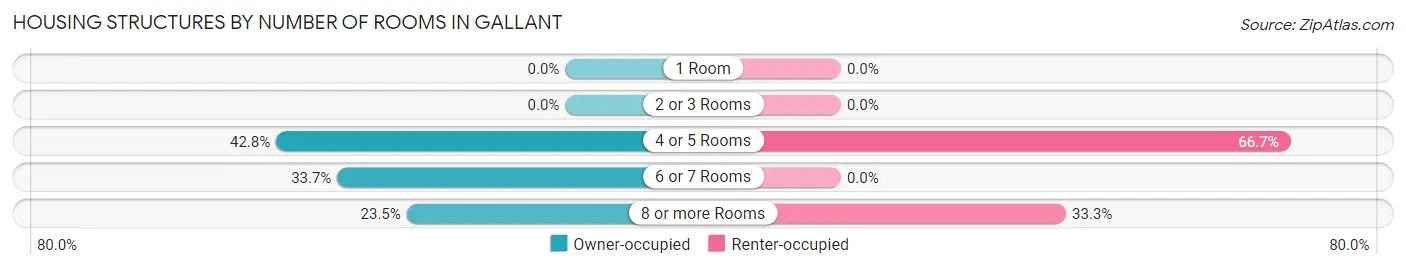
| Number of Rooms | Owner-occupied | Renter-occupied |
| 1 Room | 0 (0.0%) | 0 (0.0%) |
| 2 or 3 Rooms | 0 (0.0%) | 0 (0.0%) |
| 4 or 5 Rooms | 175 (42.8%) | 16 (66.7%) |
| 6 or 7 Rooms | 138 (33.7%) | 0 (0.0%) |
| 8 or more Rooms | 96 (23.5%) | 8 (33.3%) |
| Total | 409 (100.0%) | 24 (100.0%) |
Housing Structure by Heating Type in Gallant
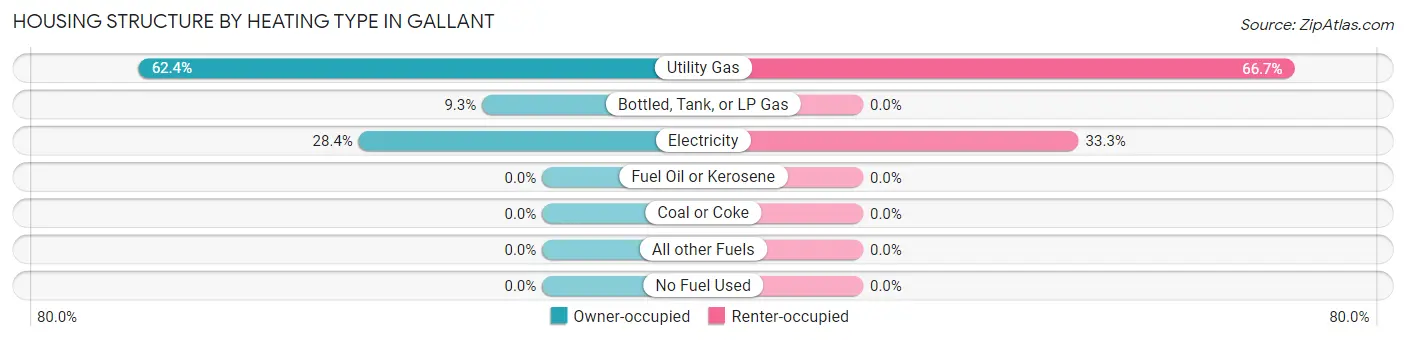
| Heating Type | Owner-occupied | Renter-occupied |
| Utility Gas | 255 (62.4%) | 16 (66.7%) |
| Bottled, Tank, or LP Gas | 38 (9.3%) | 0 (0.0%) |
| Electricity | 116 (28.4%) | 8 (33.3%) |
| Fuel Oil or Kerosene | 0 (0.0%) | 0 (0.0%) |
| Coal or Coke | 0 (0.0%) | 0 (0.0%) |
| All other Fuels | 0 (0.0%) | 0 (0.0%) |
| No Fuel Used | 0 (0.0%) | 0 (0.0%) |
| Total | 409 (100.0%) | 24 (100.0%) |
Household Vehicle Usage in Gallant
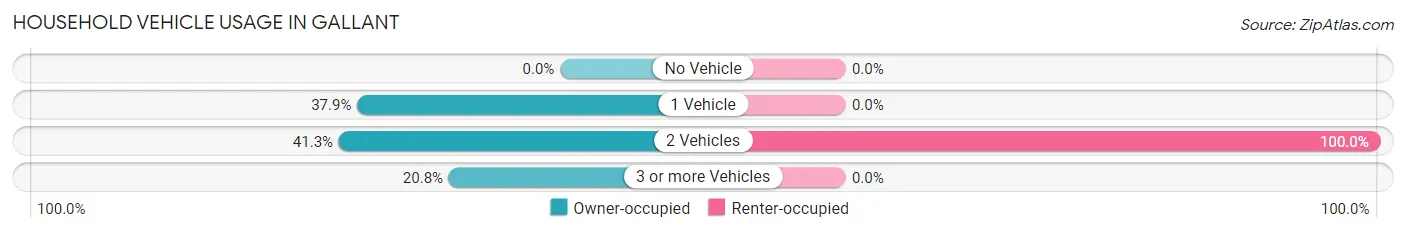
| Vehicles per Household | Owner-occupied | Renter-occupied |
| No Vehicle | 0 (0.0%) | 0 (0.0%) |
| 1 Vehicle | 155 (37.9%) | 0 (0.0%) |
| 2 Vehicles | 169 (41.3%) | 24 (100.0%) |
| 3 or more Vehicles | 85 (20.8%) | 0 (0.0%) |
| Total | 409 (100.0%) | 24 (100.0%) |
Real Estate & Mortgages in Gallant
Real Estate and Mortgage Overview in Gallant
| Characteristic | Without Mortgage | With Mortgage |
| Housing Units | 307 | 102 |
| Median Property Value | $86,700 | $164,300 |
| Median Household Income | - | - |
| Monthly Housing Costs | $362 | $0 |
| Real Estate Taxes | $437 | $11 |
Property Value by Mortgage Status in Gallant
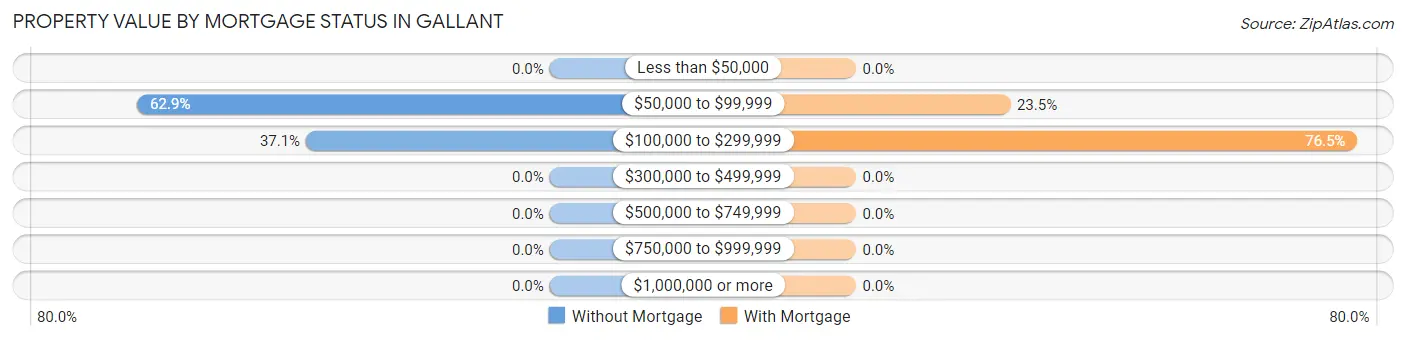
| Property Value | Without Mortgage | With Mortgage |
| Less than $50,000 | 0 (0.0%) | 0 (0.0%) |
| $50,000 to $99,999 | 193 (62.9%) | 24 (23.5%) |
| $100,000 to $299,999 | 114 (37.1%) | 78 (76.5%) |
| $300,000 to $499,999 | 0 (0.0%) | 0 (0.0%) |
| $500,000 to $749,999 | 0 (0.0%) | 0 (0.0%) |
| $750,000 to $999,999 | 0 (0.0%) | 0 (0.0%) |
| $1,000,000 or more | 0 (0.0%) | 0 (0.0%) |
| Total | 307 (100.0%) | 102 (100.0%) |
Household Income by Mortgage Status in Gallant
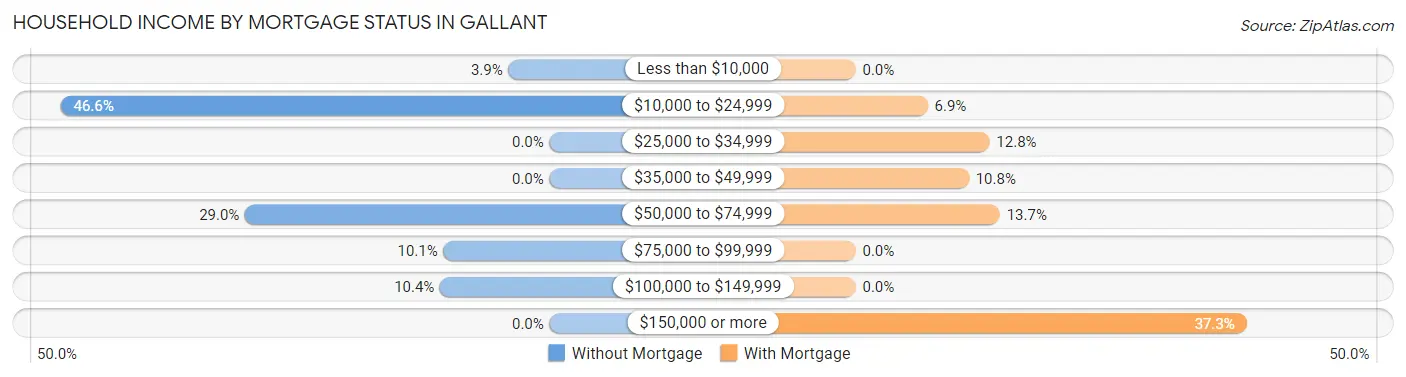
| Household Income | Without Mortgage | With Mortgage |
| Less than $10,000 | 12 (3.9%) | 0 (0.0%) |
| $10,000 to $24,999 | 143 (46.6%) | 7 (6.9%) |
| $25,000 to $34,999 | 0 (0.0%) | 13 (12.8%) |
| $35,000 to $49,999 | 0 (0.0%) | 11 (10.8%) |
| $50,000 to $74,999 | 89 (29.0%) | 14 (13.7%) |
| $75,000 to $99,999 | 31 (10.1%) | 0 (0.0%) |
| $100,000 to $149,999 | 32 (10.4%) | 0 (0.0%) |
| $150,000 or more | 0 (0.0%) | 38 (37.2%) |
| Total | 307 (100.0%) | 102 (100.0%) |
Property Value to Household Income Ratio in Gallant
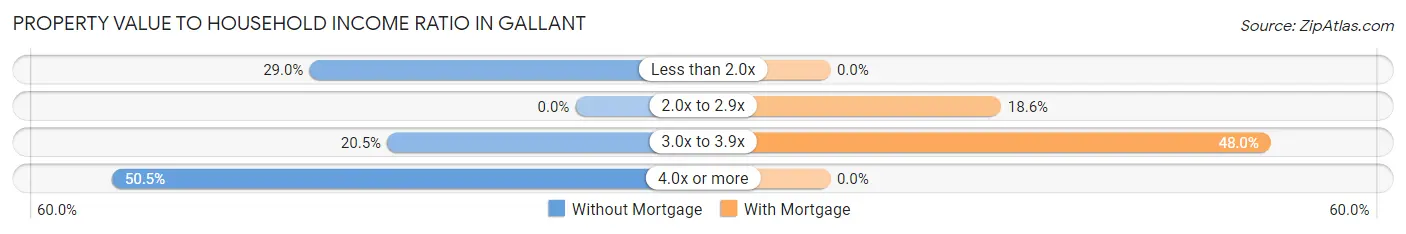
| Value-to-Income Ratio | Without Mortgage | With Mortgage |
| Less than 2.0x | 89 (29.0%) | 0 (0.0%) |
| 2.0x to 2.9x | 0 (0.0%) | 19 (18.6%) |
| 3.0x to 3.9x | 63 (20.5%) | 49 (48.0%) |
| 4.0x or more | 155 (50.5%) | 0 (0.0%) |
| Total | 307 (100.0%) | 102 (100.0%) |
Real Estate Taxes by Mortgage Status in Gallant
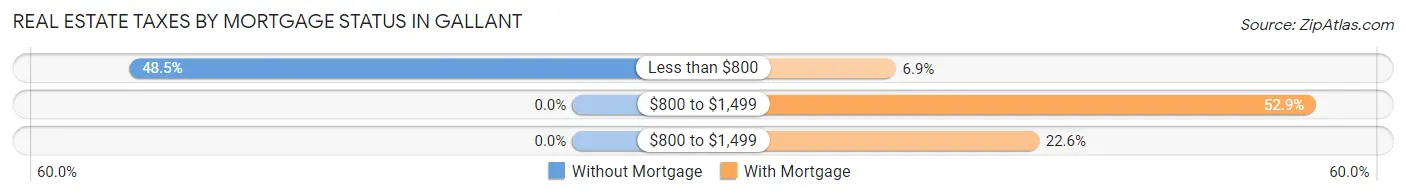
| Property Taxes | Without Mortgage | With Mortgage |
| Less than $800 | 149 (48.5%) | 7 (6.9%) |
| $800 to $1,499 | 0 (0.0%) | 54 (52.9%) |
| $800 to $1,499 | 0 (0.0%) | 23 (22.6%) |
| Total | 307 (100.0%) | 102 (100.0%) |
Health & Disability in Gallant
Health Insurance Coverage by Age in Gallant
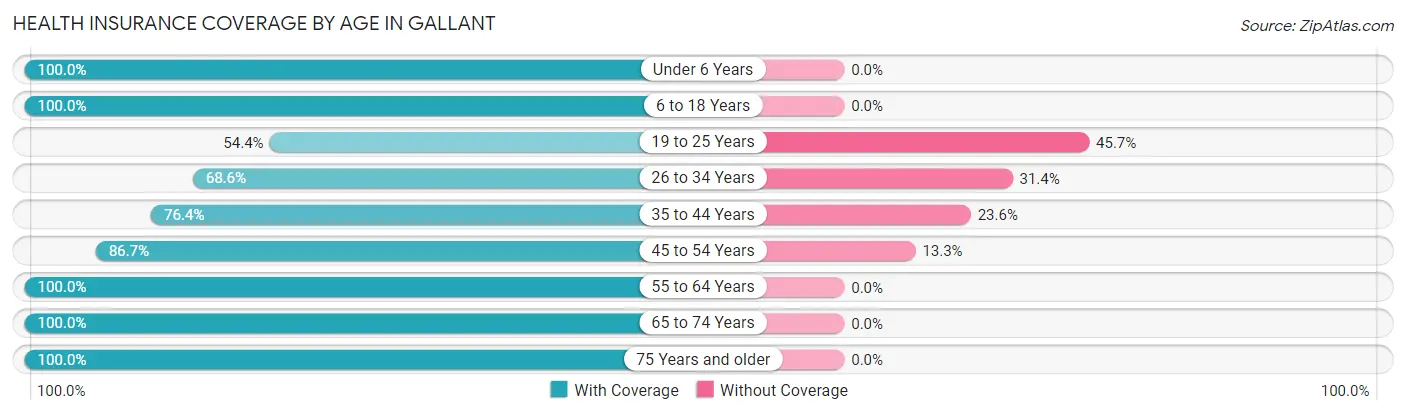
| Age Bracket | With Coverage | Without Coverage |
| Under 6 Years | 106 (100.0%) | 0 (0.0%) |
| 6 to 18 Years | 229 (100.0%) | 0 (0.0%) |
| 19 to 25 Years | 25 (54.3%) | 21 (45.7%) |
| 26 to 34 Years | 35 (68.6%) | 16 (31.4%) |
| 35 to 44 Years | 94 (76.4%) | 29 (23.6%) |
| 45 to 54 Years | 98 (86.7%) | 15 (13.3%) |
| 55 to 64 Years | 142 (100.0%) | 0 (0.0%) |
| 65 to 74 Years | 262 (100.0%) | 0 (0.0%) |
| 75 Years and older | 39 (100.0%) | 0 (0.0%) |
| Total | 1,030 (92.7%) | 81 (7.3%) |
Health Insurance Coverage by Citizenship Status in Gallant
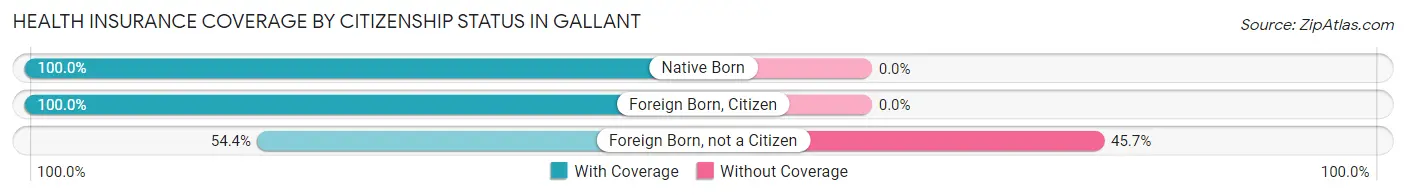
| Citizenship Status | With Coverage | Without Coverage |
| Native Born | 106 (100.0%) | 0 (0.0%) |
| Foreign Born, Citizen | 229 (100.0%) | 0 (0.0%) |
| Foreign Born, not a Citizen | 25 (54.3%) | 21 (45.7%) |
Health Insurance Coverage by Household Income in Gallant
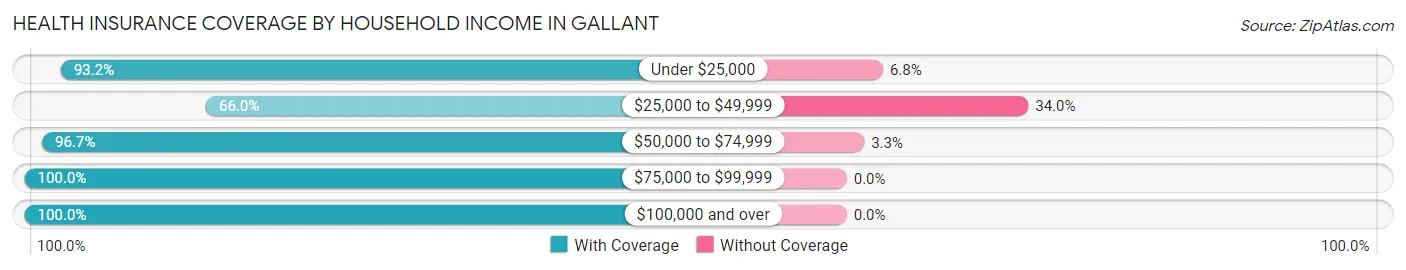
| Household Income | With Coverage | Without Coverage |
| Under $25,000 | 316 (93.2%) | 23 (6.8%) |
| $25,000 to $49,999 | 97 (66.0%) | 50 (34.0%) |
| $50,000 to $74,999 | 237 (96.7%) | 8 (3.3%) |
| $75,000 to $99,999 | 146 (100.0%) | 0 (0.0%) |
| $100,000 and over | 234 (100.0%) | 0 (0.0%) |
Public vs Private Health Insurance Coverage by Age in Gallant
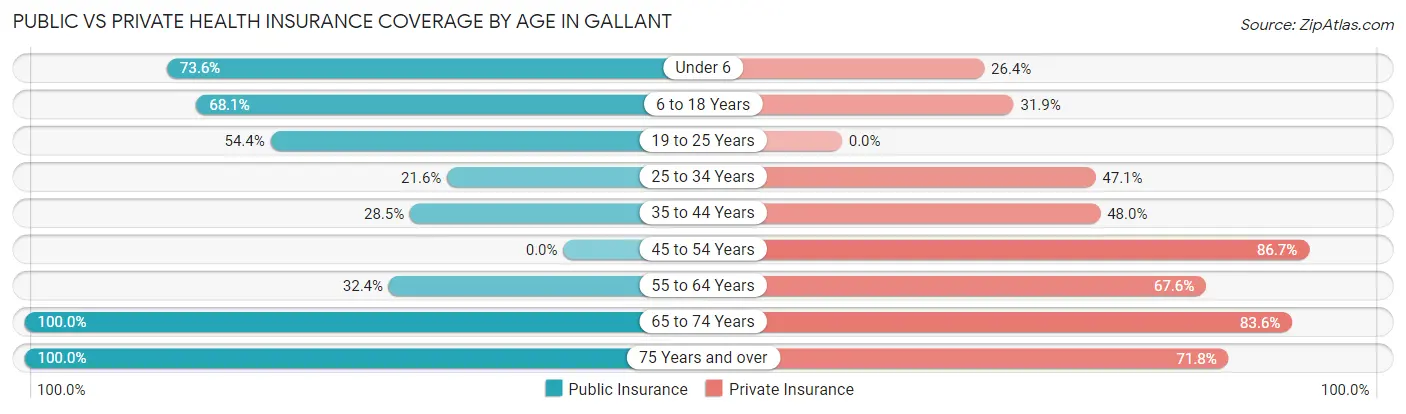
| Age Bracket | Public Insurance | Private Insurance |
| Under 6 | 78 (73.6%) | 28 (26.4%) |
| 6 to 18 Years | 156 (68.1%) | 73 (31.9%) |
| 19 to 25 Years | 25 (54.3%) | 0 (0.0%) |
| 25 to 34 Years | 11 (21.6%) | 24 (47.1%) |
| 35 to 44 Years | 35 (28.5%) | 59 (48.0%) |
| 45 to 54 Years | 0 (0.0%) | 98 (86.7%) |
| 55 to 64 Years | 46 (32.4%) | 96 (67.6%) |
| 65 to 74 Years | 262 (100.0%) | 219 (83.6%) |
| 75 Years and over | 39 (100.0%) | 28 (71.8%) |
| Total | 652 (58.7%) | 625 (56.3%) |
Disability Status by Sex by Age in Gallant
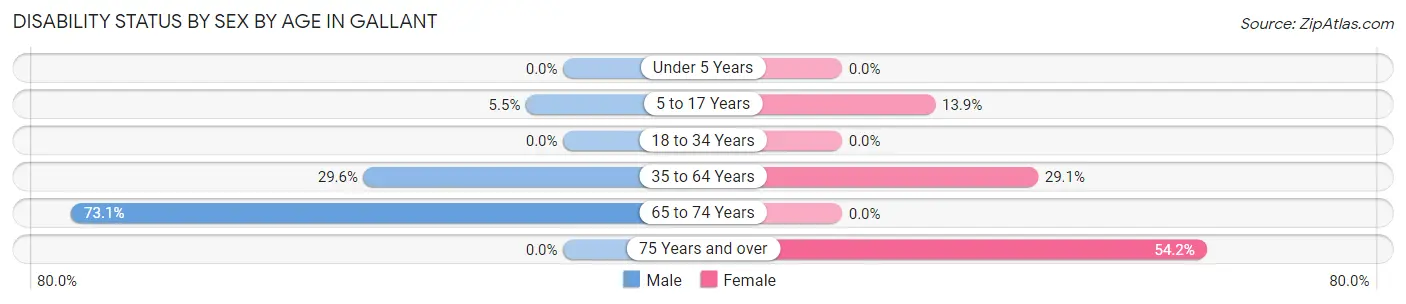
| Age Bracket | Male | Female |
| Under 5 Years | 0 (0.0%) | 0 (0.0%) |
| 5 to 17 Years | 7 (5.5%) | 18 (13.9%) |
| 18 to 34 Years | 0 (0.0%) | 0 (0.0%) |
| 35 to 64 Years | 56 (29.6%) | 55 (29.1%) |
| 65 to 74 Years | 133 (73.1%) | 0 (0.0%) |
| 75 Years and over | 0 (0.0%) | 13 (54.2%) |
Disability Class by Sex by Age in Gallant
Disability Class: Hearing Difficulty
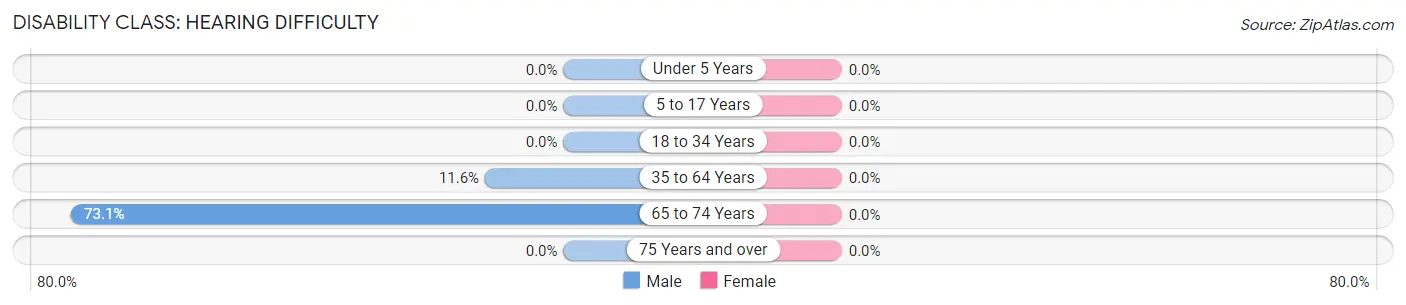
| Age Bracket | Male | Female |
| Under 5 Years | 0 (0.0%) | 0 (0.0%) |
| 5 to 17 Years | 0 (0.0%) | 0 (0.0%) |
| 18 to 34 Years | 0 (0.0%) | 0 (0.0%) |
| 35 to 64 Years | 22 (11.6%) | 0 (0.0%) |
| 65 to 74 Years | 133 (73.1%) | 0 (0.0%) |
| 75 Years and over | 0 (0.0%) | 0 (0.0%) |
Disability Class: Vision Difficulty
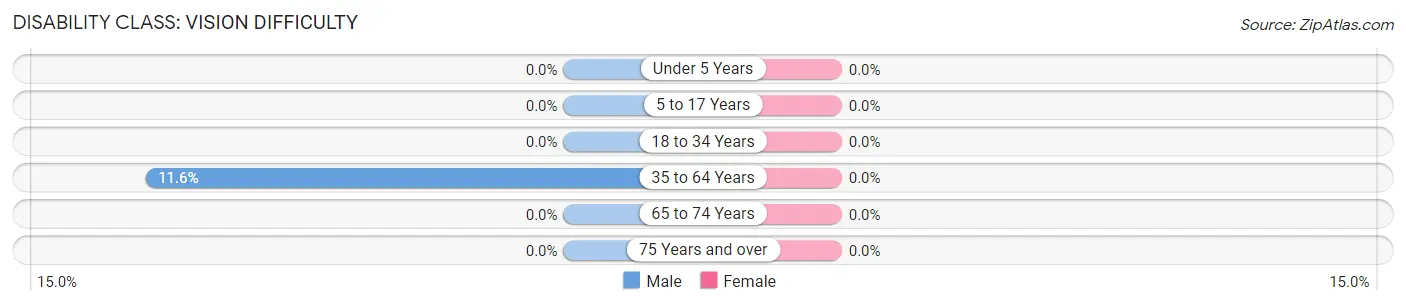
| Age Bracket | Male | Female |
| Under 5 Years | 0 (0.0%) | 0 (0.0%) |
| 5 to 17 Years | 0 (0.0%) | 0 (0.0%) |
| 18 to 34 Years | 0 (0.0%) | 0 (0.0%) |
| 35 to 64 Years | 22 (11.6%) | 0 (0.0%) |
| 65 to 74 Years | 0 (0.0%) | 0 (0.0%) |
| 75 Years and over | 0 (0.0%) | 0 (0.0%) |
Disability Class: Cognitive Difficulty
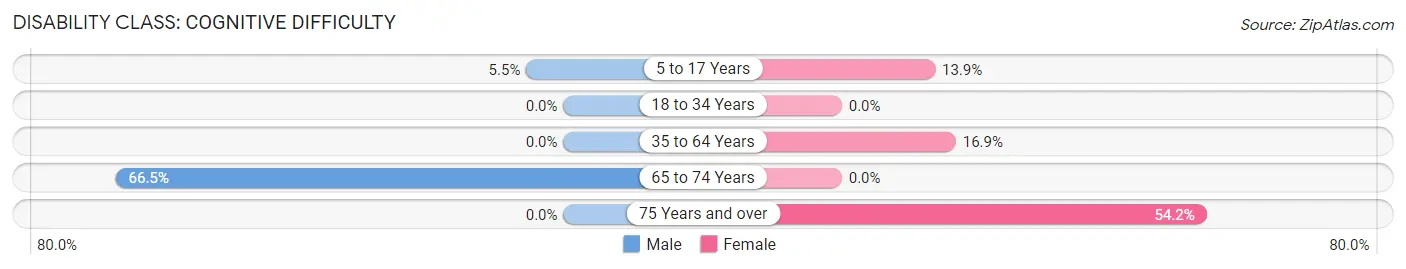
| Age Bracket | Male | Female |
| 5 to 17 Years | 7 (5.5%) | 18 (13.9%) |
| 18 to 34 Years | 0 (0.0%) | 0 (0.0%) |
| 35 to 64 Years | 0 (0.0%) | 32 (16.9%) |
| 65 to 74 Years | 121 (66.5%) | 0 (0.0%) |
| 75 Years and over | 0 (0.0%) | 13 (54.2%) |
Disability Class: Ambulatory Difficulty
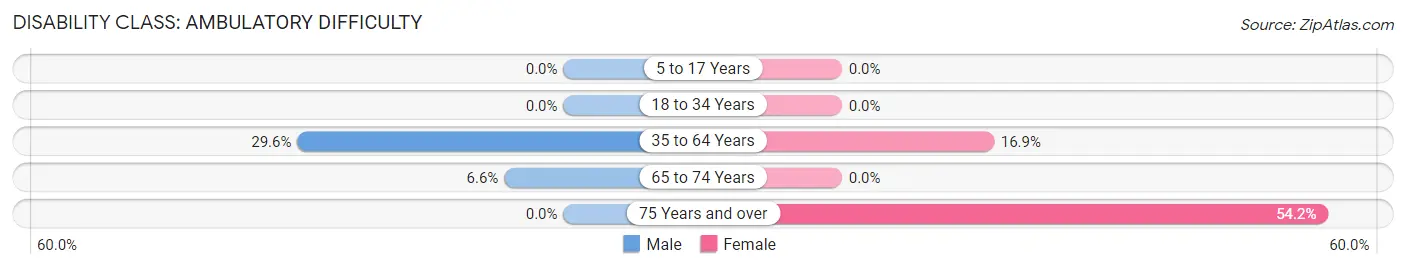
| Age Bracket | Male | Female |
| 5 to 17 Years | 0 (0.0%) | 0 (0.0%) |
| 18 to 34 Years | 0 (0.0%) | 0 (0.0%) |
| 35 to 64 Years | 56 (29.6%) | 32 (16.9%) |
| 65 to 74 Years | 12 (6.6%) | 0 (0.0%) |
| 75 Years and over | 0 (0.0%) | 13 (54.2%) |
Disability Class: Self-Care Difficulty
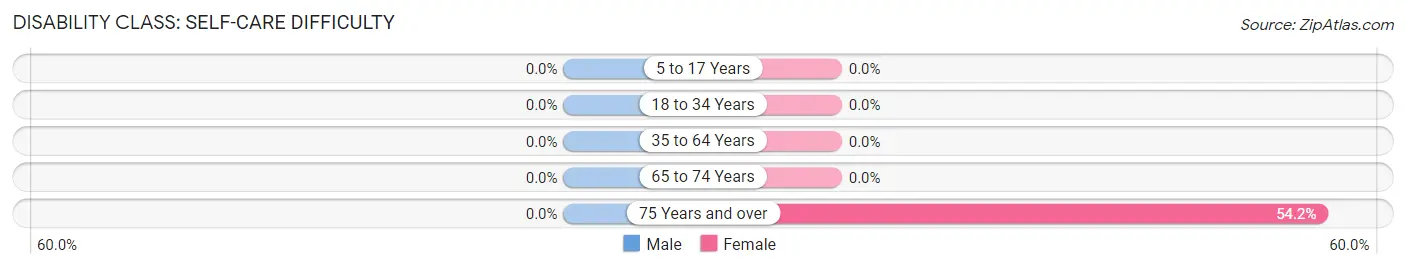
| Age Bracket | Male | Female |
| 5 to 17 Years | 0 (0.0%) | 0 (0.0%) |
| 18 to 34 Years | 0 (0.0%) | 0 (0.0%) |
| 35 to 64 Years | 0 (0.0%) | 0 (0.0%) |
| 65 to 74 Years | 0 (0.0%) | 0 (0.0%) |
| 75 Years and over | 0 (0.0%) | 13 (54.2%) |
Technology Access in Gallant
Computing Device Access in Gallant
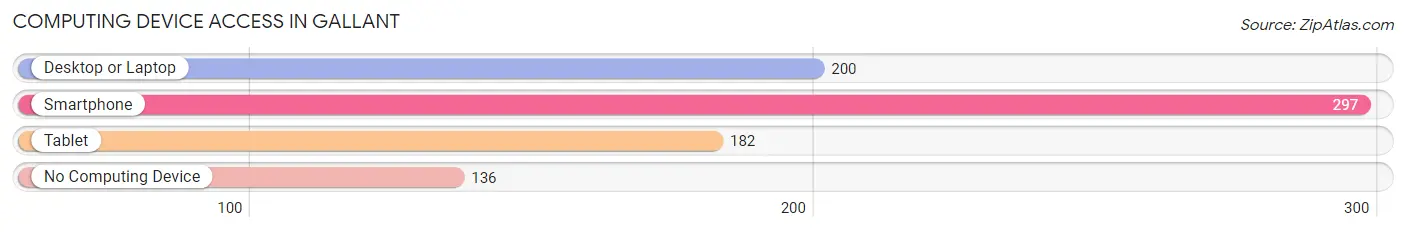
| Device Type | # Households | % Households |
| Desktop or Laptop | 200 | 46.2% |
| Smartphone | 297 | 68.6% |
| Tablet | 182 | 42.0% |
| No Computing Device | 136 | 31.4% |
| Total | 433 | 100.0% |
Internet Access in Gallant
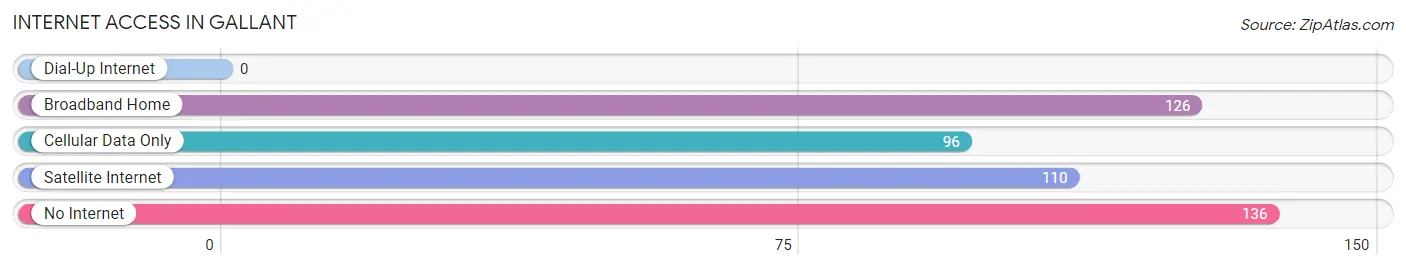
| Internet Type | # Households | % Households |
| Dial-Up Internet | 0 | 0.0% |
| Broadband Home | 126 | 29.1% |
| Cellular Data Only | 96 | 22.2% |
| Satellite Internet | 110 | 25.4% |
| No Internet | 136 | 31.4% |
| Total | 433 | 100.0% |
Gallant Summary
History
The small town of Gallant, Alabama is located in the northeastern part of the state, in Etowah County. It is situated on the banks of the Coosa River, and is part of the Gadsden Metropolitan Statistical Area. The town was founded in 1836 by a group of settlers from Georgia, and was originally known as “Gallant’s Station”. The name was changed to Gallant in 1845, and the town was incorporated in 1887.
Gallant has a rich history, and was an important stop on the stagecoach route between Rome, Georgia and Huntsville, Alabama. The town was also a major stop on the Alabama and Chattanooga Railroad, which was built in the late 1800s. The railroad was a major factor in the growth of the town, and it was the site of a major battle during the Civil War.
Geography
Gallant is located in the northeastern part of Alabama, in Etowah County. It is situated on the banks of the Coosa River, and is part of the Gadsden Metropolitan Statistical Area. The town is located at an elevation of 645 feet above sea level, and has a total area of 1.3 square miles. The climate in Gallant is humid subtropical, with hot, humid summers and mild winters.
Economy
The economy of Gallant is largely based on agriculture and manufacturing. The town is home to several small businesses, including a feed mill, a sawmill, and a furniture factory. The town also has a number of retail stores, including a grocery store, a hardware store, and a clothing store.
Demographics
As of the 2010 census, the population of Gallant was 1,845. The racial makeup of the town was 95.3% White, 2.2% African American, 0.3% Native American, 0.2% Asian, 0.1% Pacific Islander, 0.7% from other races, and 1.4% from two or more races. The median household income in Gallant was $31,250, and the median family income was $37,500. The per capita income in the town was $17,845.
Conclusion
Gallant, Alabama is a small town with a rich history and a diverse economy. The town is situated on the banks of the Coosa River, and is part of the Gadsden Metropolitan Statistical Area. The town has a population of 1,845, and the median household income is $31,250. The town is home to several small businesses, and is an important stop on the stagecoach route between Rome, Georgia and Huntsville, Alabama.
Common Questions
What is the Total Population of Gallant?
Total Population of Gallant is 1,111.
What is the Total Male Population of Gallant?
Total Male Population of Gallant is 603.
What is the Total Female Population of Gallant?
Total Female Population of Gallant is 508.
What is the Ratio of Males per 100 Females in Gallant?
There are 118.70 Males per 100 Females in Gallant.
What is the Ratio of Females per 100 Males in Gallant?
There are 84.25 Females per 100 Males in Gallant.
What is the Median Population Age in Gallant?
Median Population Age in Gallant is 46.0 Years.
What is the Average Family Size in Gallant
Average Family Size in Gallant is 3.4 People.
What is the Average Household Size in Gallant
Average Household Size in Gallant is 2.6 People.
What is Per Capita Income in Gallant?
Per Capita income in Gallant is $23,190.
What is the Median Family Income in Gallant?
Median Family Income in Gallant is $64,667.
What is the Median Household income in Gallant?
Median Household Income in Gallant is $50,574.
What is Inequality or Gini Index in Gallant?
Inequality or Gini Index in Gallant is 0.44.
How Large is the Labor Force in Gallant?
There are 362 People in the Labor Forcein in Gallant.
What is the Percentage of People in the Labor Force in Gallant?
44.0% of People are in the Labor Force in Gallant.
What is the Unemployment Rate in Gallant?
Unemployment Rate in Gallant is 4.1%.