County Line, AL
County Line Map
County Line Overview
278
TOTAL POPULATION
179
MALE POPULATION
99
FEMALE POPULATION
180.81
MALES / 100 FEMALES
55.31
FEMALES / 100 MALES
25.9
MEDIAN AGE
3.1
AVG FAMILY SIZE
3.0
AVG HOUSEHOLD SIZE
$34,749
PER CAPITA INCOME
$52,188
AVG FAMILY INCOME
$85,625
AVG HOUSEHOLD INCOME
52.1%
WAGE / INCOME GAP [ % ]
47.9¢/ $1
WAGE / INCOME GAP [ $ ]
0.28
INEQUALITY / GINI INDEX
161
LABOR FORCE [ PEOPLE ]
67.4%
PERCENT IN LABOR FORCE
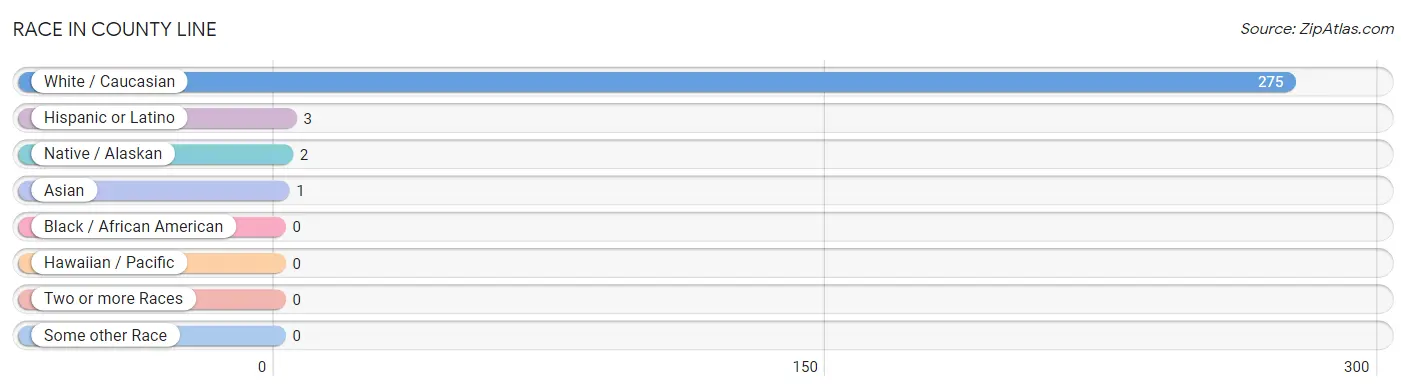
Race in County Line
The most populous races in County Line are White / Caucasian (275 | 98.9%), Hispanic or Latino (3 | 1.1%), and Native / Alaskan (2 | 0.7%).
| Race | # Population | % Population |
| Asian | 1 | 0.4% |
| Black / African American | 0 | 0.0% |
| Hawaiian / Pacific | 0 | 0.0% |
| Hispanic or Latino | 3 | 1.1% |
| Native / Alaskan | 2 | 0.7% |
| White / Caucasian | 275 | 98.9% |
| Two or more Races | 0 | 0.0% |
| Some other Race | 0 | 0.0% |
| Total | 278 | 100.0% |
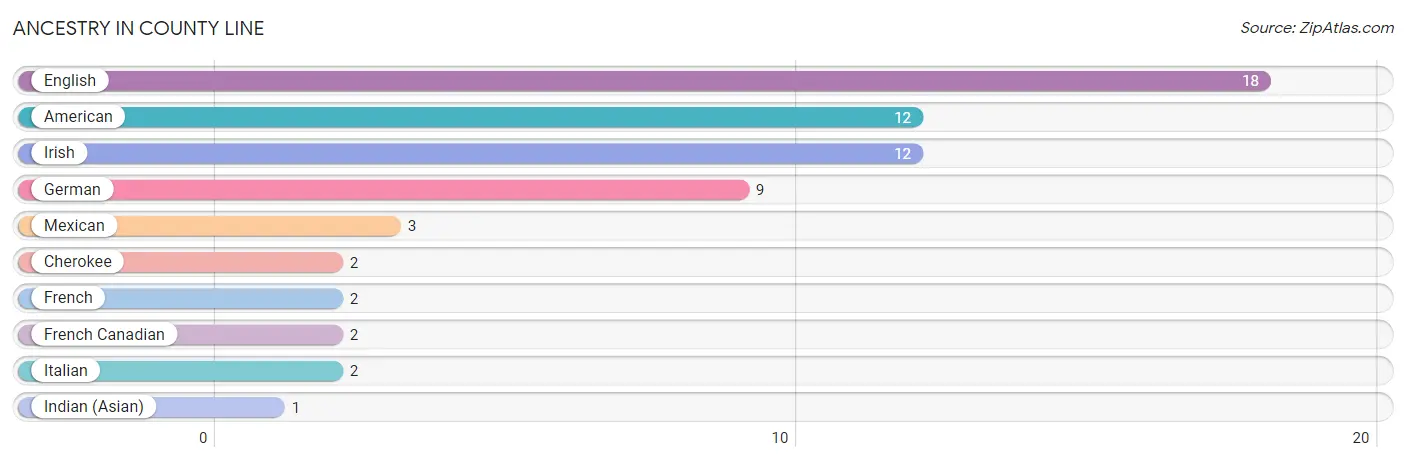
Ancestry in County Line
The most populous ancestries reported in County Line are English (18 | 6.5%), American (12 | 4.3%), Irish (12 | 4.3%), German (9 | 3.2%), and Mexican (3 | 1.1%), together accounting for 19.4% of all County Line residents.
| Ancestry | # Population | % Population |
| American | 12 | 4.3% |
| Cherokee | 2 | 0.7% |
| English | 18 | 6.5% |
| French | 2 | 0.7% |
| French Canadian | 2 | 0.7% |
| German | 9 | 3.2% |
| Indian (Asian) | 1 | 0.4% |
| Irish | 12 | 4.3% |
| Italian | 2 | 0.7% |
| Mexican | 3 | 1.1% | View All 10 Rows |
Immigrants in County Line
The most numerous immigrant groups reported in County Line came from , and Canada (2 | 0.7%), together accounting for 0.7% of all County Line residents.

| Immigration Origin | # Population | % Population |
| Canada | 2 | 0.7% | View All 1 Rows |
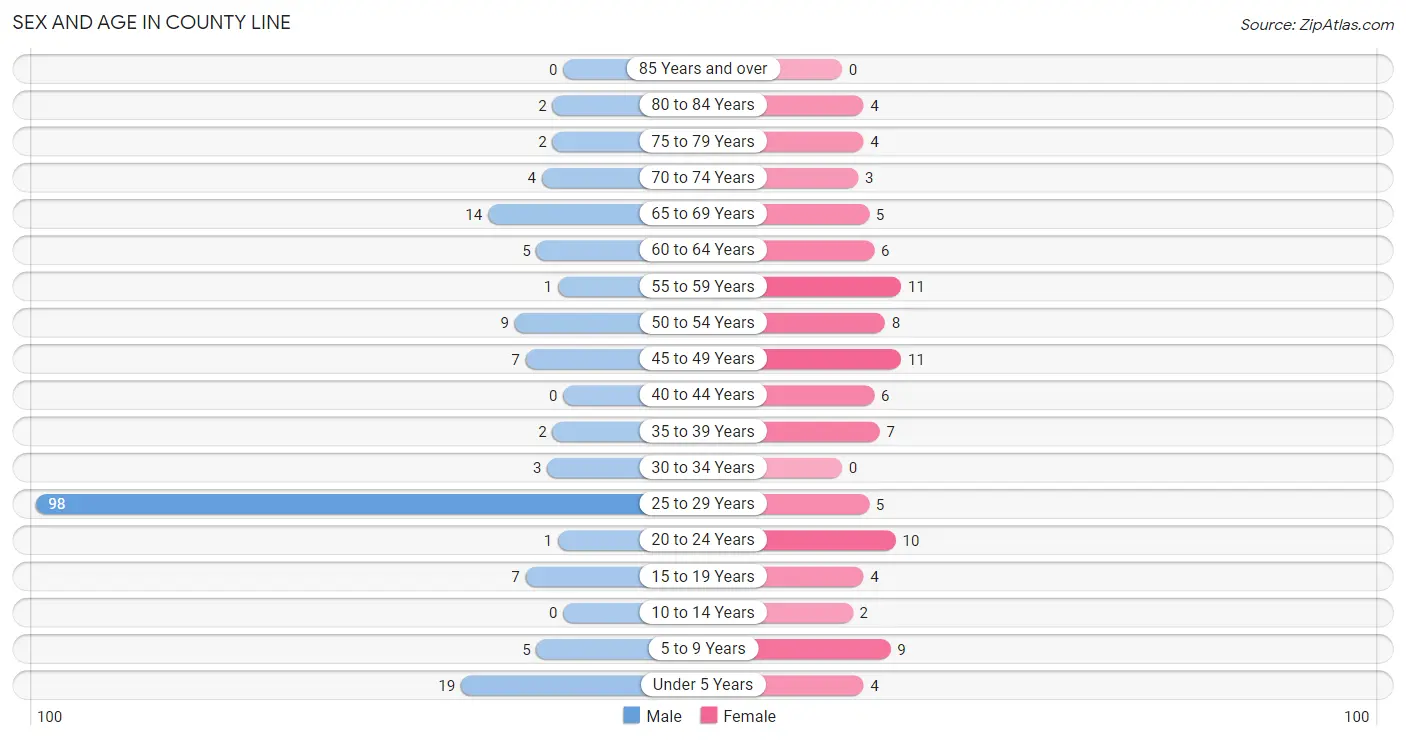
Sex and Age in County Line
Sex and Age in County Line
The most populous age groups in County Line are 25 to 29 Years (98 | 54.7%) for men and 45 to 49 Years (11 | 11.1%) for women.
| Age Bracket | Male | Female |
| Under 5 Years | 19 (10.6%) | 4 (4.0%) |
| 5 to 9 Years | 5 (2.8%) | 9 (9.1%) |
| 10 to 14 Years | 0 (0.0%) | 2 (2.0%) |
| 15 to 19 Years | 7 (3.9%) | 4 (4.0%) |
| 20 to 24 Years | 1 (0.6%) | 10 (10.1%) |
| 25 to 29 Years | 98 (54.7%) | 5 (5.1%) |
| 30 to 34 Years | 3 (1.7%) | 0 (0.0%) |
| 35 to 39 Years | 2 (1.1%) | 7 (7.1%) |
| 40 to 44 Years | 0 (0.0%) | 6 (6.1%) |
| 45 to 49 Years | 7 (3.9%) | 11 (11.1%) |
| 50 to 54 Years | 9 (5.0%) | 8 (8.1%) |
| 55 to 59 Years | 1 (0.6%) | 11 (11.1%) |
| 60 to 64 Years | 5 (2.8%) | 6 (6.1%) |
| 65 to 69 Years | 14 (7.8%) | 5 (5.1%) |
| 70 to 74 Years | 4 (2.2%) | 3 (3.0%) |
| 75 to 79 Years | 2 (1.1%) | 4 (4.0%) |
| 80 to 84 Years | 2 (1.1%) | 4 (4.0%) |
| 85 Years and over | 0 (0.0%) | 0 (0.0%) |
| Total | 179 (100.0%) | 99 (100.0%) |
Families and Households in County Line
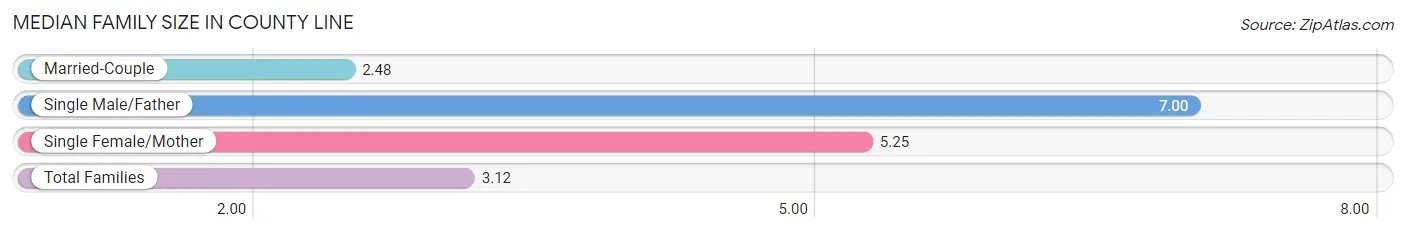
Median Family Size in County Line
The median family size in County Line is 3.12 persons per family, with single male/father families (1 | 1.7%) accounting for the largest median family size of 7 persons per family. On the other hand, married-couple families (46 | 78.0%) represent the smallest median family size with 2.48 persons per family.
| Family Type | # Families | Family Size |
| Married-Couple | 46 (78.0%) | 2.48 |
| Single Male/Father | 1 (1.7%) | 7.00 |
| Single Female/Mother | 12 (20.3%) | 5.25 |
| Total Families | 59 (100.0%) | 3.12 |
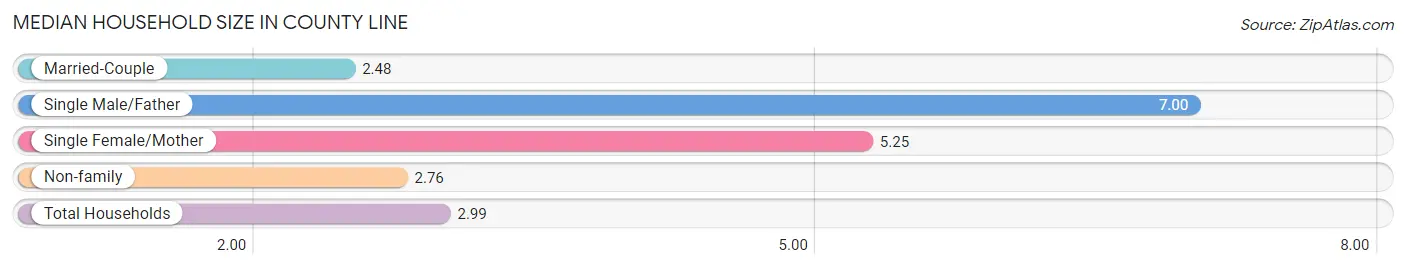
Median Household Size in County Line
The median household size in County Line is 2.99 persons per household, with single male/father households (1 | 1.1%) accounting for the largest median household size of 7 persons per household. married-couple households (46 | 49.5%) represent the smallest median household size with 2.48 persons per household.
| Household Type | # Households | Household Size |
| Married-Couple | 46 (49.5%) | 2.48 |
| Single Male/Father | 1 (1.1%) | 7.00 |
| Single Female/Mother | 12 (12.9%) | 5.25 |
| Non-family | 34 (36.6%) | 2.76 |
| Total Households | 93 (100.0%) | 2.99 |
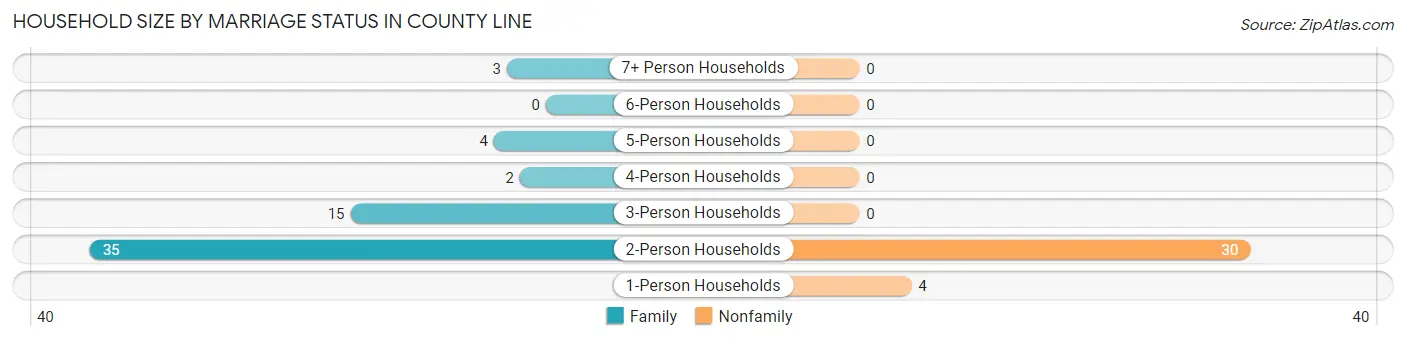
Household Size by Marriage Status in County Line
Out of a total of 93 households in County Line, 59 (63.4%) are family households, while 34 (36.6%) are nonfamily households. The most numerous type of family households are 2-person households, comprising 35, and the most common type of nonfamily households are 2-person households, comprising 30.
| Household Size | Family Households | Nonfamily Households |
| 1-Person Households | - | 4 (4.3%) |
| 2-Person Households | 35 (37.6%) | 30 (32.3%) |
| 3-Person Households | 15 (16.1%) | 0 (0.0%) |
| 4-Person Households | 2 (2.1%) | 0 (0.0%) |
| 5-Person Households | 4 (4.3%) | 0 (0.0%) |
| 6-Person Households | 0 (0.0%) | 0 (0.0%) |
| 7+ Person Households | 3 (3.2%) | 0 (0.0%) |
| Total | 59 (63.4%) | 34 (36.6%) |
Female Fertility in County Line
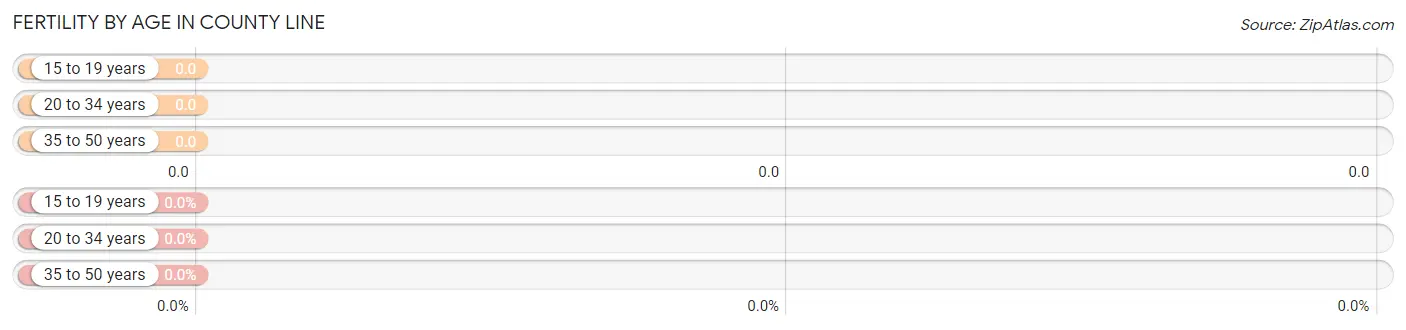
Fertility by Age in County Line
| Age Bracket | Women with Births | Births / 1,000 Women |
| 15 to 19 years | 0 (0.0%) | 0.0 |
| 20 to 34 years | 0 (0.0%) | 0.0 |
| 35 to 50 years | 0 (0.0%) | 0.0 |
| Total | 0 (0.0%) | 0.0 |
Fertility by Age by Marriage Status in County Line
| Age Bracket | Married | Unmarried |
| 15 to 19 years | 0 (0.0%) | 0 (0.0%) |
| 20 to 34 years | 0 (0.0%) | 0 (0.0%) |
| 35 to 50 years | 0 (0.0%) | 0 (0.0%) |
| Total | 0 (0.0%) | 0 (0.0%) |
Fertility by Education in County Line
| Educational Attainment | Women with Births | Births / 1,000 Women |
| Less than High School | 0 (0.0%) | 0.0 |
| High School Diploma | 0 (0.0%) | 0.0 |
| College or Associate's Degree | 0 (0.0%) | 0.0 |
| Bachelor's Degree | 0 (0.0%) | 0.0 |
| Graduate Degree | 0 (0.0%) | 0.0 |
| Total | 0 (0.0%) | 0.0 |
Fertility by Education by Marriage Status in County Line
| Educational Attainment | Married | Unmarried |
| Less than High School | 0 (0.0%) | 0 (0.0%) |
| High School Diploma | 0 (0.0%) | 0 (0.0%) |
| College or Associate's Degree | 0 (0.0%) | 0 (0.0%) |
| Bachelor's Degree | 0 (0.0%) | 0 (0.0%) |
| Graduate Degree | 0 (0.0%) | 0 (0.0%) |
| Total | 0 (0.0%) | 0 (0.0%) |
Income in County Line
Income Overview in County Line
Per Capita Income in County Line is $34,749, while median incomes of families and households are $52,188 and $85,625 respectively.
| Characteristic | Number | Measure |
| Per Capita Income | 278 | $34,749 |
| Median Family Income | 59 | $52,188 |
| Mean Family Income | 59 | $71,851 |
| Median Household Income | 93 | $85,625 |
| Mean Household Income | 93 | $79,769 |
| Income Deficit | 59 | $0 |
| Wage / Income Gap (%) | 278 | 52.13% |
| Wage / Income Gap ($) | 278 | 47.87¢ per $1 |
| Gini / Inequality Index | 278 | 0.28 |
Earnings by Sex in County Line
Average Earnings in County Line are $49,464, $58,750 for men and $28,125 for women, a difference of 52.1%.
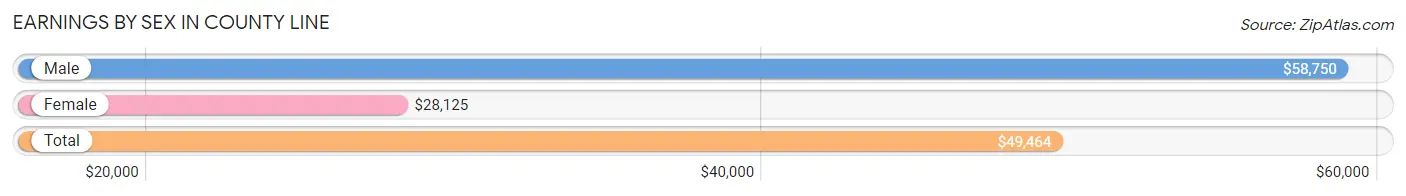
| Sex | Number | Average Earnings |
| Male | 132 (80.0%) | $58,750 |
| Female | 33 (20.0%) | $28,125 |
| Total | 165 (100.0%) | $49,464 |
Earnings by Sex by Income Bracket in County Line
The most common earnings brackets in County Line are $65,000 to $74,999 for men (63 | 47.7%) and $25,000 to $29,999 for women (8 | 24.2%).
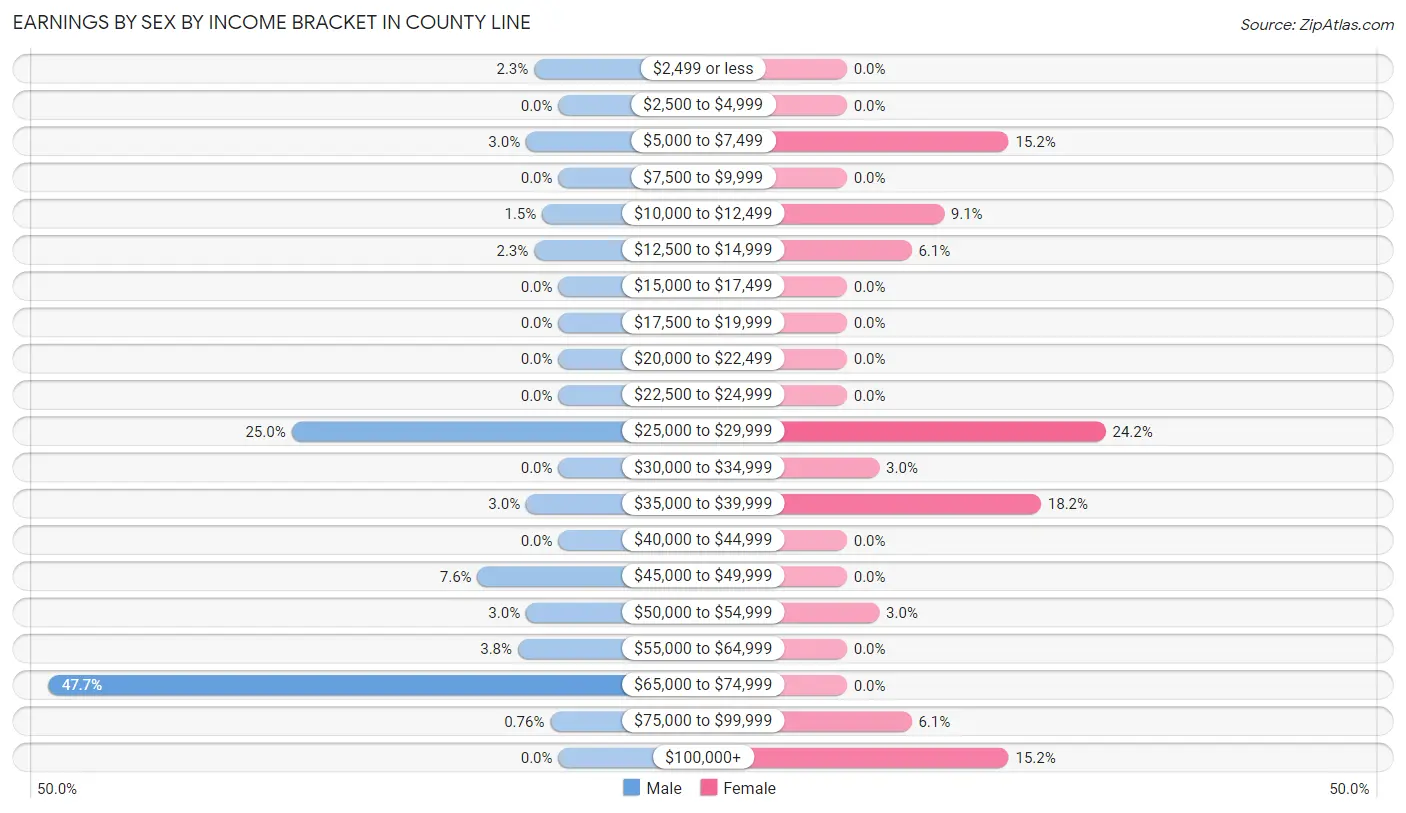
| Income | Male | Female |
| $2,499 or less | 3 (2.3%) | 0 (0.0%) |
| $2,500 to $4,999 | 0 (0.0%) | 0 (0.0%) |
| $5,000 to $7,499 | 4 (3.0%) | 5 (15.1%) |
| $7,500 to $9,999 | 0 (0.0%) | 0 (0.0%) |
| $10,000 to $12,499 | 2 (1.5%) | 3 (9.1%) |
| $12,500 to $14,999 | 3 (2.3%) | 2 (6.1%) |
| $15,000 to $17,499 | 0 (0.0%) | 0 (0.0%) |
| $17,500 to $19,999 | 0 (0.0%) | 0 (0.0%) |
| $20,000 to $22,499 | 0 (0.0%) | 0 (0.0%) |
| $22,500 to $24,999 | 0 (0.0%) | 0 (0.0%) |
| $25,000 to $29,999 | 33 (25.0%) | 8 (24.2%) |
| $30,000 to $34,999 | 0 (0.0%) | 1 (3.0%) |
| $35,000 to $39,999 | 4 (3.0%) | 6 (18.2%) |
| $40,000 to $44,999 | 0 (0.0%) | 0 (0.0%) |
| $45,000 to $49,999 | 10 (7.6%) | 0 (0.0%) |
| $50,000 to $54,999 | 4 (3.0%) | 1 (3.0%) |
| $55,000 to $64,999 | 5 (3.8%) | 0 (0.0%) |
| $65,000 to $74,999 | 63 (47.7%) | 0 (0.0%) |
| $75,000 to $99,999 | 1 (0.8%) | 2 (6.1%) |
| $100,000+ | 0 (0.0%) | 5 (15.1%) |
| Total | 132 (100.0%) | 33 (100.0%) |
Earnings by Sex by Educational Attainment in County Line
Average earnings in County Line are $69,167 for men and $35,750 for women, a difference of 48.3%. Men with an educational attainment of high school diploma enjoy the highest average annual earnings of $72,646, while those with high school diploma education earn the least with $72,646. Women with an educational attainment of college or associate's degree earn the most with the average annual earnings of $35,500, while those with college or associate's degree education have the smallest earnings of $35,500.
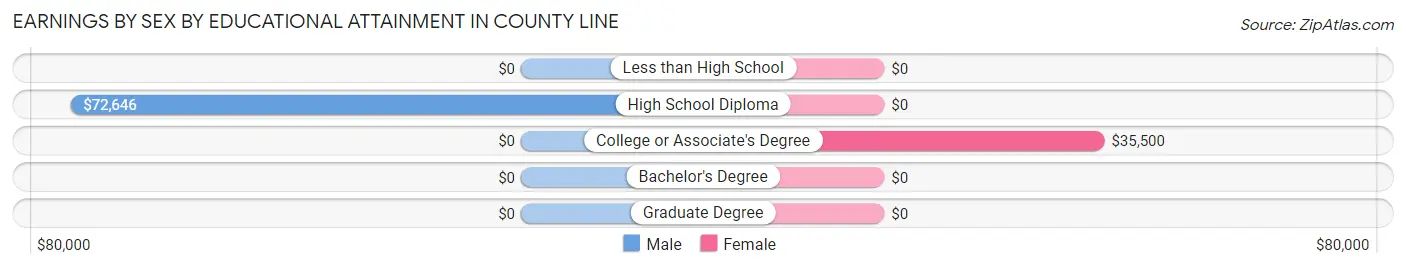
| Educational Attainment | Male Income | Female Income |
| Less than High School | - | - |
| High School Diploma | $72,646 | $0 |
| College or Associate's Degree | - | - |
| Bachelor's Degree | - | - |
| Graduate Degree | - | - |
| Total | $69,167 | $35,750 |
Family Income in County Line
Family Income Brackets in County Line
According to the County Line family income data, there are 17 families falling into the $35,000 to $49,999 income range, which is the most common income bracket and makes up 28.8% of all families.
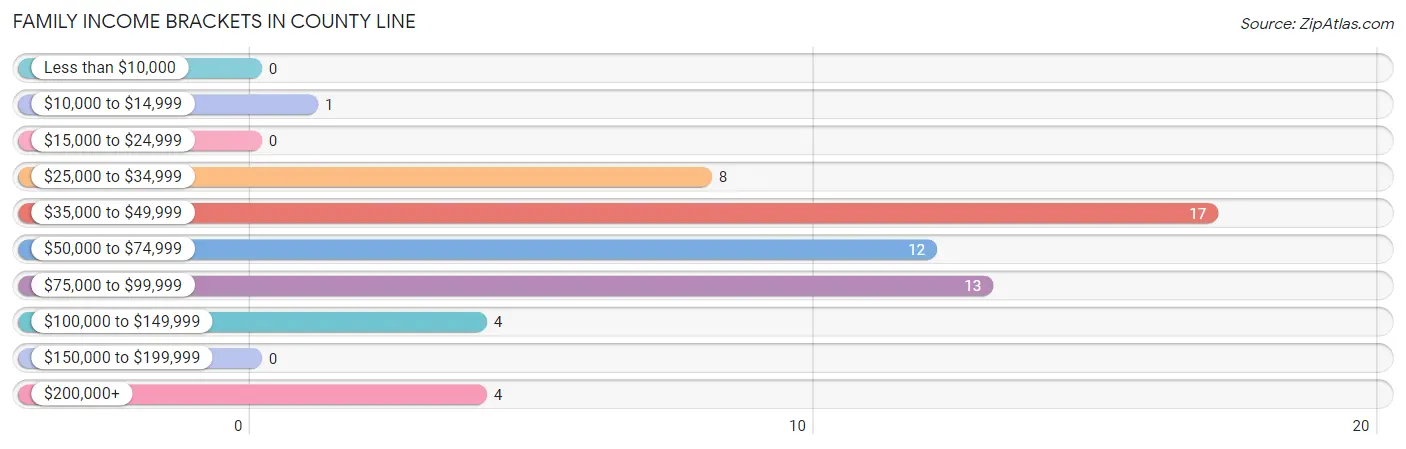
| Income Bracket | # Families | % Families |
| Less than $10,000 | 0 | 0.0% |
| $10,000 to $14,999 | 1 | 1.7% |
| $15,000 to $24,999 | 0 | 0.0% |
| $25,000 to $34,999 | 8 | 13.6% |
| $35,000 to $49,999 | 17 | 28.8% |
| $50,000 to $74,999 | 12 | 20.3% |
| $75,000 to $99,999 | 13 | 22.0% |
| $100,000 to $149,999 | 4 | 6.8% |
| $150,000 to $199,999 | 0 | 0.0% |
| $200,000+ | 4 | 6.8% |
Family Income by Famaliy Size in County Line
2-person families (35 | 59.3%) account for the highest median family income in County Line with $48,542 per family, while 2-person families (35 | 59.3%) have the highest median income of $24,271 per family member.
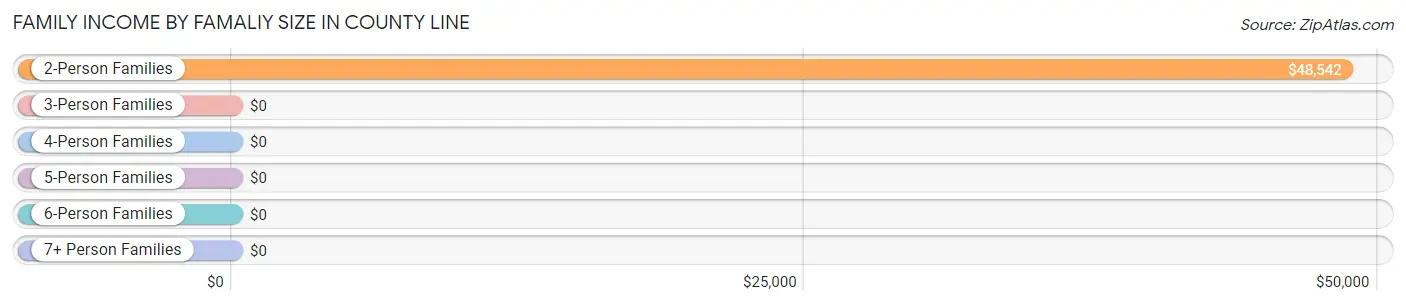
| Income Bracket | # Families | Median Income |
| 2-Person Families | 35 (59.3%) | $48,542 |
| 3-Person Families | 15 (25.4%) | $0 |
| 4-Person Families | 2 (3.4%) | $0 |
| 5-Person Families | 4 (6.8%) | $0 |
| 6-Person Families | 0 (0.0%) | $0 |
| 7+ Person Families | 3 (5.1%) | $0 |
| Total | 59 (100.0%) | $52,188 |
Family Income by Number of Earners in County Line
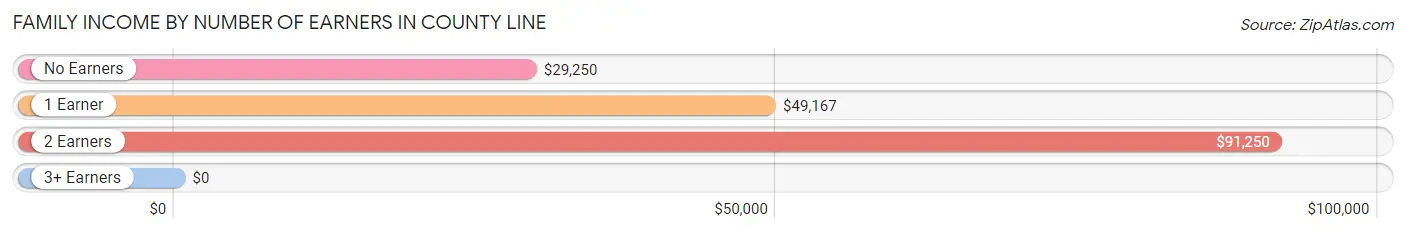
| Number of Earners | # Families | Median Income |
| No Earners | 9 (15.2%) | $29,250 |
| 1 Earner | 34 (57.6%) | $49,167 |
| 2 Earners | 12 (20.3%) | $91,250 |
| 3+ Earners | 4 (6.8%) | $0 |
| Total | 59 (100.0%) | $52,188 |
Household Income in County Line
Household Income Brackets in County Line
With 34 households falling in the category, the $100,000 to $149,999 income range is the most frequent in County Line, accounting for 36.6% of all households.
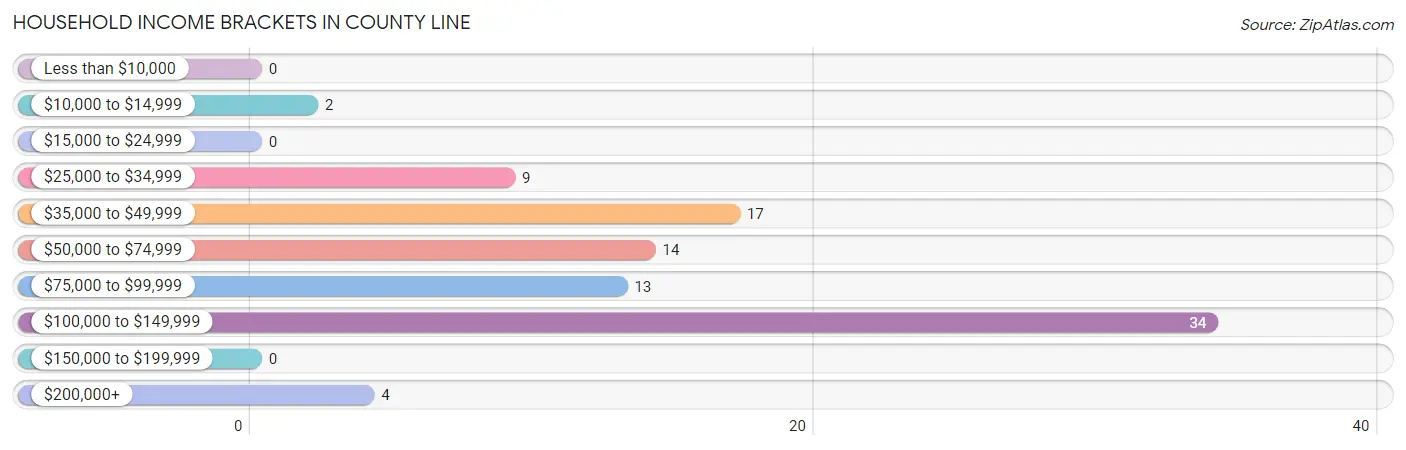
| Income Bracket | # Households | % Households |
| Less than $10,000 | 0 | 0.0% |
| $10,000 to $14,999 | 2 | 2.2% |
| $15,000 to $24,999 | 0 | 0.0% |
| $25,000 to $34,999 | 9 | 9.7% |
| $35,000 to $49,999 | 17 | 18.3% |
| $50,000 to $74,999 | 14 | 15.1% |
| $75,000 to $99,999 | 13 | 14.0% |
| $100,000 to $149,999 | 34 | 36.6% |
| $150,000 to $199,999 | 0 | 0.0% |
| $200,000+ | 4 | 4.3% |
Household Income by Householder Age in County Line
The median household income in County Line is $85,625, with the highest median household income of $100,833 found in the 25 to 44 years age bracket for the primary householder. A total of 44 households (47.3%) fall into this category. Meanwhile, the 15 to 24 years age bracket for the primary householder has the lowest median household income of $0, with 1 households (1.1%) in this group.
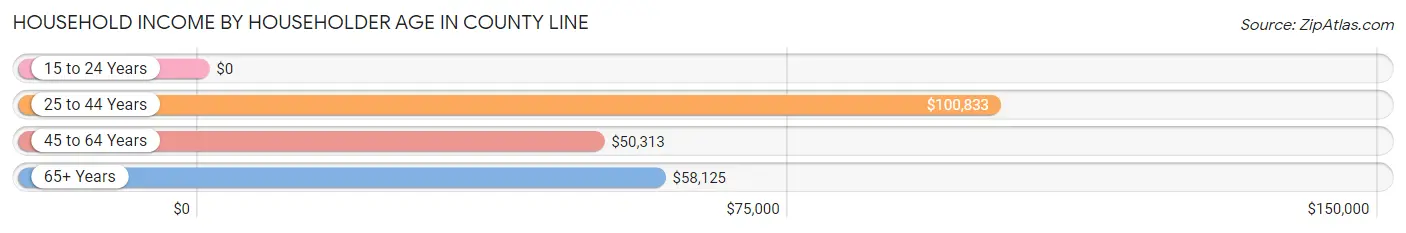
| Income Bracket | # Households | Median Income |
| 15 to 24 Years | 1 (1.1%) | $0 |
| 25 to 44 Years | 44 (47.3%) | $100,833 |
| 45 to 64 Years | 25 (26.9%) | $50,313 |
| 65+ Years | 23 (24.7%) | $58,125 |
| Total | 93 (100.0%) | $85,625 |
Poverty in County Line
Income Below Poverty by Sex and Age in County Line
With 11.2% poverty level for males and 19.2% for females among the residents of County Line, 16 and 17 year old males and 35 to 44 year old females are the most vulnerable to poverty, with 4 males (57.1%) and 5 females (38.5%) in their respective age groups living below the poverty level.
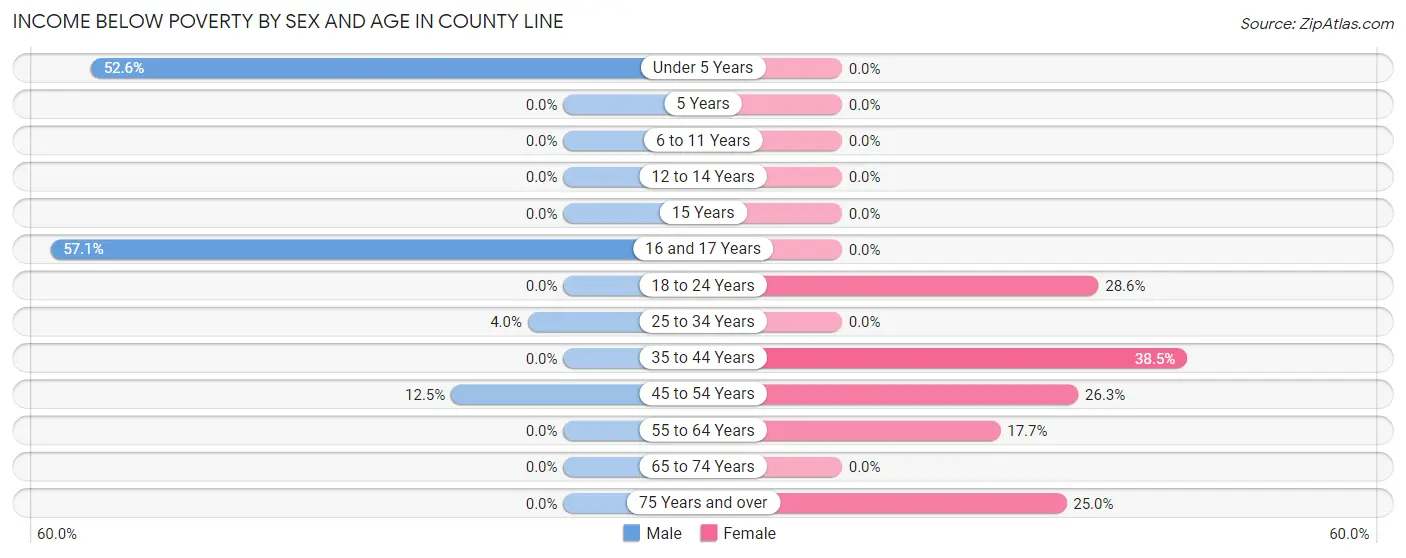
| Age Bracket | Male | Female |
| Under 5 Years | 10 (52.6%) | 0 (0.0%) |
| 5 Years | 0 (0.0%) | 0 (0.0%) |
| 6 to 11 Years | 0 (0.0%) | 0 (0.0%) |
| 12 to 14 Years | 0 (0.0%) | 0 (0.0%) |
| 15 Years | 0 (0.0%) | 0 (0.0%) |
| 16 and 17 Years | 4 (57.1%) | 0 (0.0%) |
| 18 to 24 Years | 0 (0.0%) | 4 (28.6%) |
| 25 to 34 Years | 4 (4.0%) | 0 (0.0%) |
| 35 to 44 Years | 0 (0.0%) | 5 (38.5%) |
| 45 to 54 Years | 2 (12.5%) | 5 (26.3%) |
| 55 to 64 Years | 0 (0.0%) | 3 (17.6%) |
| 65 to 74 Years | 0 (0.0%) | 0 (0.0%) |
| 75 Years and over | 0 (0.0%) | 2 (25.0%) |
| Total | 20 (11.2%) | 19 (19.2%) |
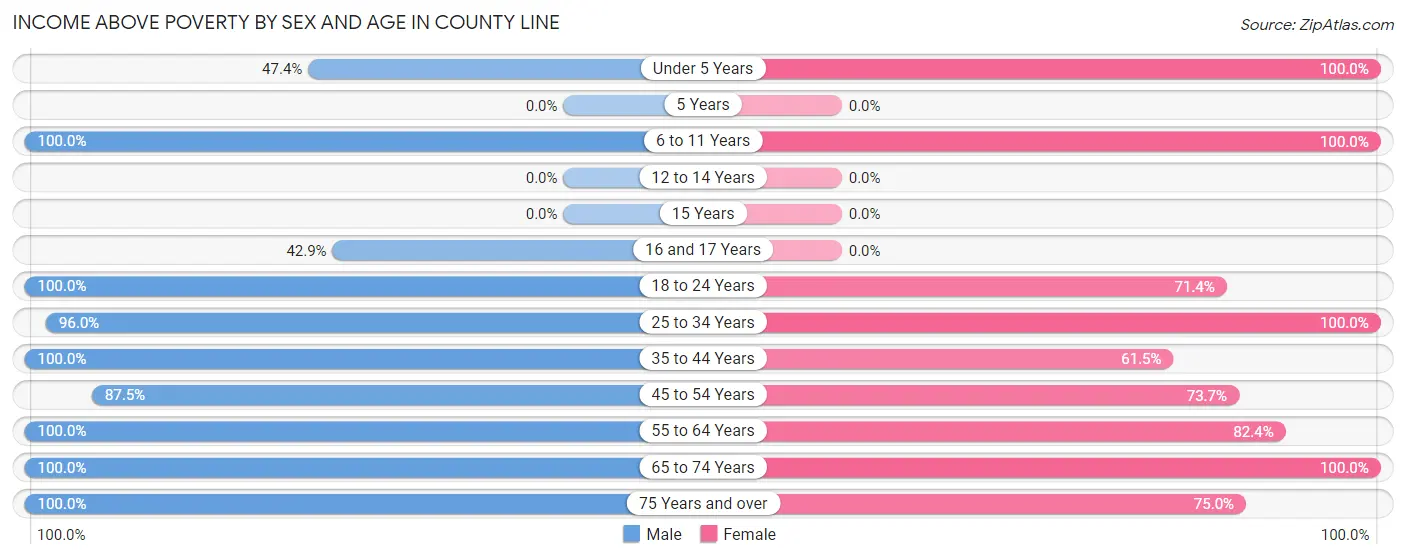
Income Above Poverty by Sex and Age in County Line
According to the poverty statistics in County Line, males aged 6 to 11 years and females aged under 5 years are the age groups that are most secure financially, with 100.0% of males and 100.0% of females in these age groups living above the poverty line.
| Age Bracket | Male | Female |
| Under 5 Years | 9 (47.4%) | 4 (100.0%) |
| 5 Years | 0 (0.0%) | 0 (0.0%) |
| 6 to 11 Years | 5 (100.0%) | 11 (100.0%) |
| 12 to 14 Years | 0 (0.0%) | 0 (0.0%) |
| 15 Years | 0 (0.0%) | 0 (0.0%) |
| 16 and 17 Years | 3 (42.9%) | 0 (0.0%) |
| 18 to 24 Years | 1 (100.0%) | 10 (71.4%) |
| 25 to 34 Years | 97 (96.0%) | 5 (100.0%) |
| 35 to 44 Years | 2 (100.0%) | 8 (61.5%) |
| 45 to 54 Years | 14 (87.5%) | 14 (73.7%) |
| 55 to 64 Years | 6 (100.0%) | 14 (82.4%) |
| 65 to 74 Years | 18 (100.0%) | 8 (100.0%) |
| 75 Years and over | 4 (100.0%) | 6 (75.0%) |
| Total | 159 (88.8%) | 80 (80.8%) |
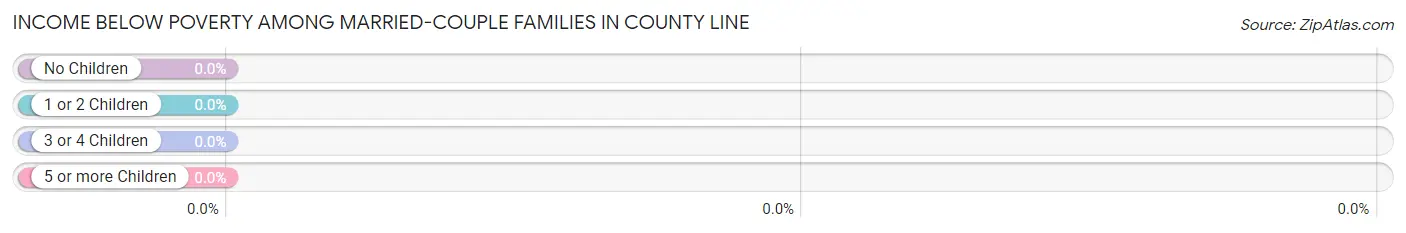
Income Below Poverty Among Married-Couple Families in County Line
| Children | Above Poverty | Below Poverty |
| No Children | 39 (100.0%) | 0 (0.0%) |
| 1 or 2 Children | 3 (100.0%) | 0 (0.0%) |
| 3 or 4 Children | 4 (100.0%) | 0 (0.0%) |
| 5 or more Children | 0 (0.0%) | 0 (0.0%) |
| Total | 46 (100.0%) | 0 (0.0%) |
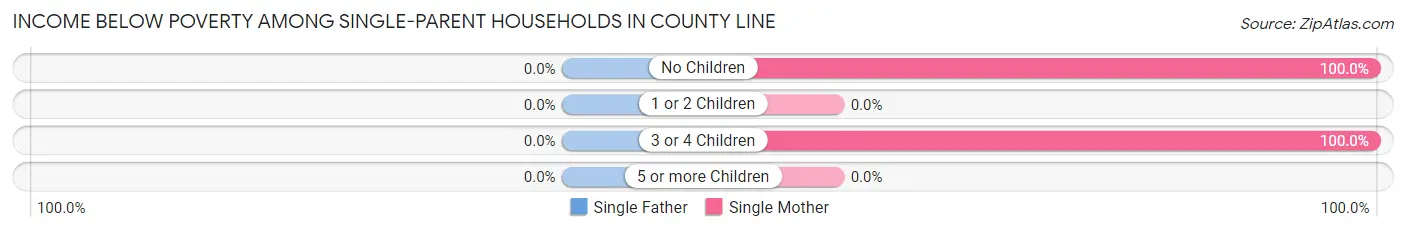
Income Below Poverty Among Single-Parent Households in County Line
| Children | Single Father | Single Mother |
| No Children | 0 (0.0%) | 1 (100.0%) |
| 1 or 2 Children | 0 (0.0%) | 0 (0.0%) |
| 3 or 4 Children | 0 (0.0%) | 3 (100.0%) |
| 5 or more Children | 0 (0.0%) | 0 (0.0%) |
| Total | 0 (0.0%) | 4 (33.3%) |
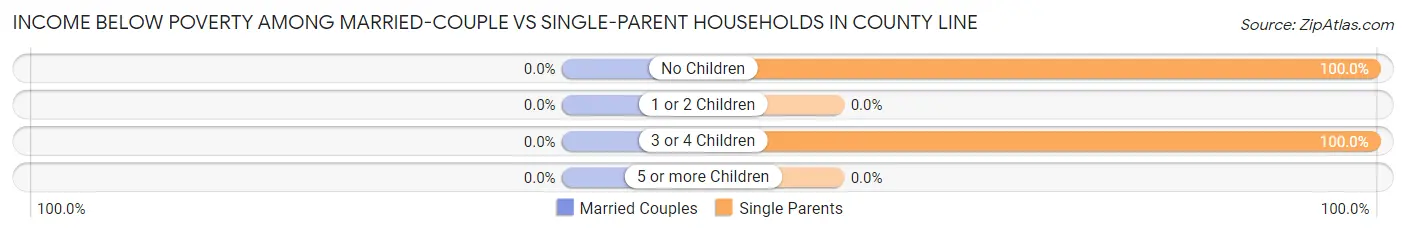
Income Below Poverty Among Married-Couple vs Single-Parent Households in County Line
| Children | Married-Couple Families | Single-Parent Households |
| No Children | 0 (0.0%) | 1 (100.0%) |
| 1 or 2 Children | 0 (0.0%) | 0 (0.0%) |
| 3 or 4 Children | 0 (0.0%) | 3 (100.0%) |
| 5 or more Children | 0 (0.0%) | 0 (0.0%) |
| Total | 0 (0.0%) | 4 (30.8%) |
Employment Characteristics in County Line
Employment by Class of Employer in County Line
Among the 161 employed individuals in County Line, private company employees (144 | 89.4%), not-for-profit organizations (5 | 3.1%), and federal government employees (4 | 2.5%) make up the most common classes of employment.
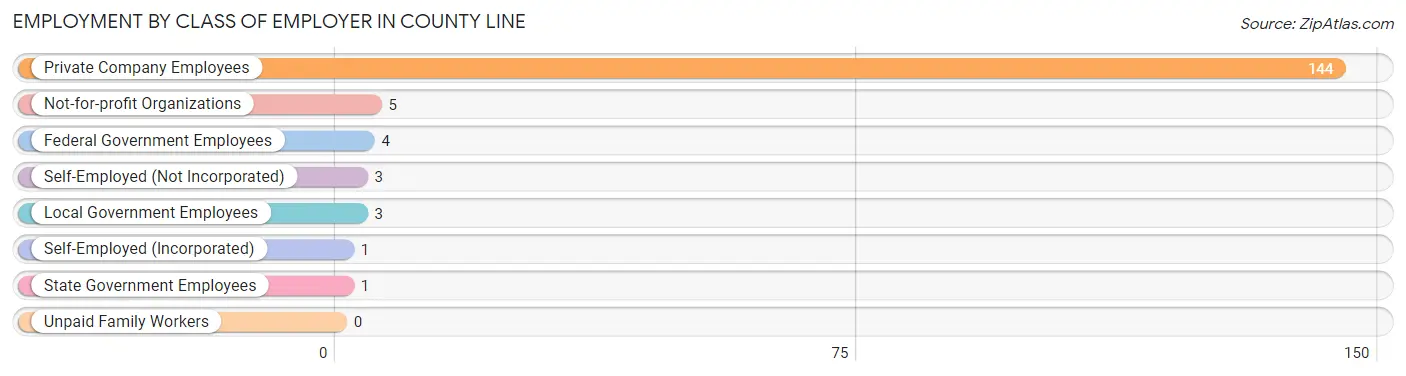
| Employer Class | # Employees | % Employees |
| Private Company Employees | 144 | 89.4% |
| Self-Employed (Incorporated) | 1 | 0.6% |
| Self-Employed (Not Incorporated) | 3 | 1.9% |
| Not-for-profit Organizations | 5 | 3.1% |
| Local Government Employees | 3 | 1.9% |
| State Government Employees | 1 | 0.6% |
| Federal Government Employees | 4 | 2.5% |
| Unpaid Family Workers | 0 | 0.0% |
| Total | 161 | 100.0% |
Employment Status by Age in County Line
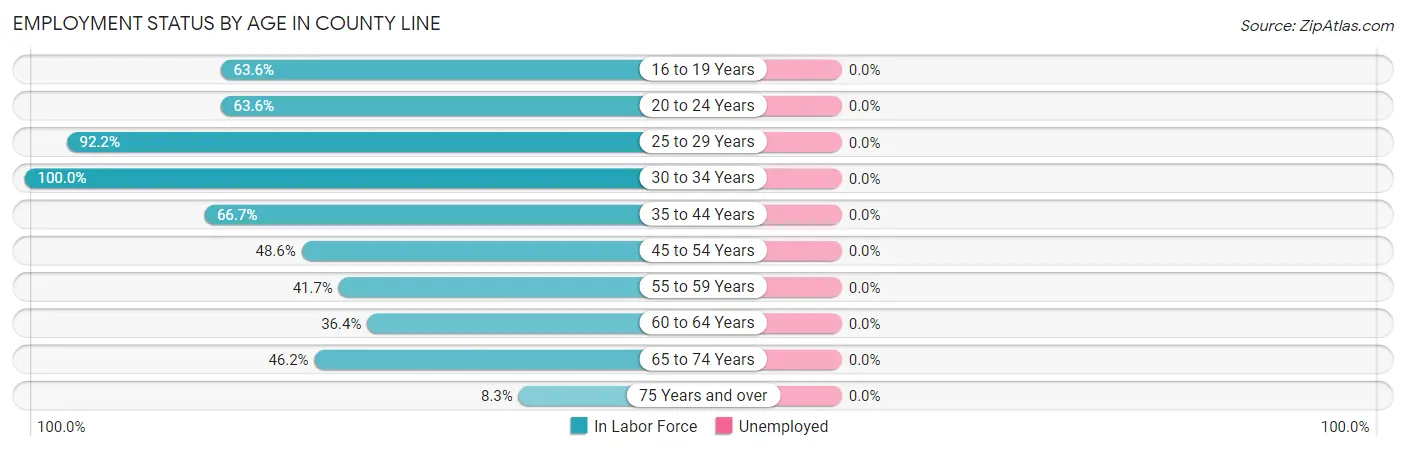
| Age Bracket | In Labor Force | Unemployed |
| 16 to 19 Years | 7 (63.6%) | 0 (0.0%) |
| 20 to 24 Years | 7 (63.6%) | 0 (0.0%) |
| 25 to 29 Years | 95 (92.2%) | 0 (0.0%) |
| 30 to 34 Years | 3 (100.0%) | 0 (0.0%) |
| 35 to 44 Years | 10 (66.7%) | 0 (0.0%) |
| 45 to 54 Years | 17 (48.6%) | 0 (0.0%) |
| 55 to 59 Years | 5 (41.7%) | 0 (0.0%) |
| 60 to 64 Years | 4 (36.4%) | 0 (0.0%) |
| 65 to 74 Years | 12 (46.2%) | 0 (0.0%) |
| 75 Years and over | 1 (8.3%) | 0 (0.0%) |
| Total | 161 (67.4%) | 0 (0.0%) |
Employment Status by Educational Attainment in County Line
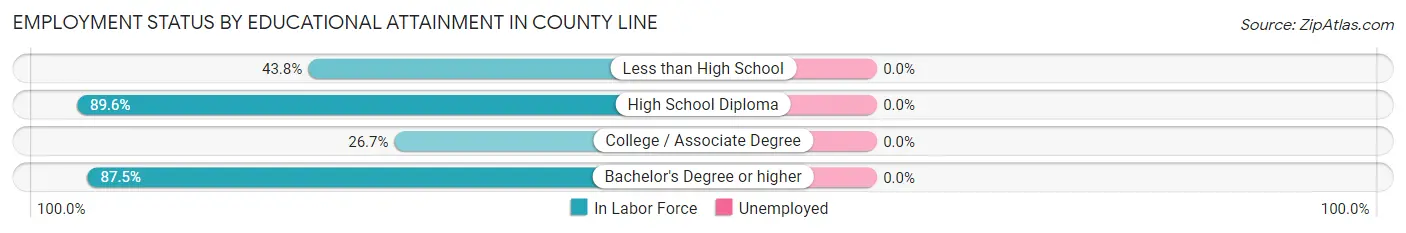
| Educational Attainment | In Labor Force | Unemployed |
| Less than High School | 7 (43.8%) | 0 (0.0%) |
| High School Diploma | 112 (89.6%) | 0 (0.0%) |
| College / Associate Degree | 8 (26.7%) | 0 (0.0%) |
| Bachelor's Degree or higher | 7 (87.5%) | 0 (0.0%) |
| Total | 134 (74.9%) | 0 (0.0%) |
Employment Occupations by Sex in County Line
Management, Business, Science and Arts Occupations
The most common Management, Business, Science and Arts occupations in County Line are Health Diagnosing & Treating (6 | 3.7%), Management (4 | 2.5%), Business & Financial (4 | 2.5%), Community & Social Service (4 | 2.5%), and Arts, Media & Entertainment (3 | 1.9%).
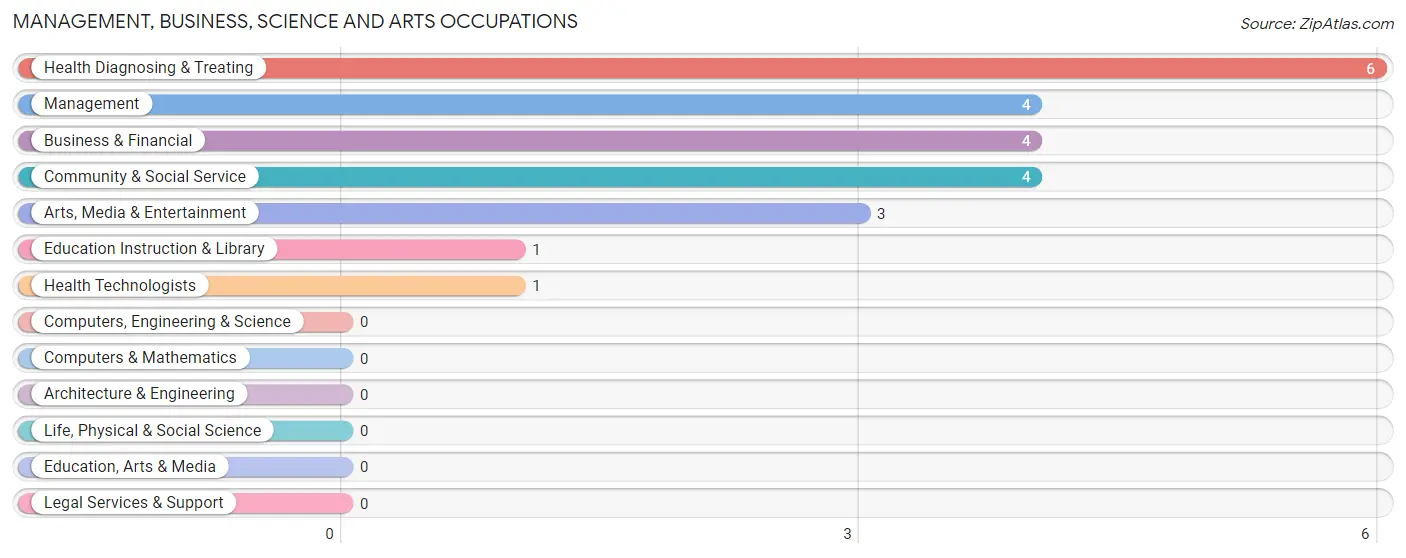
Management, Business, Science and Arts Occupations by Sex
Within the Management, Business, Science and Arts occupations in County Line, the most male-oriented occupations are Education Instruction & Library (100.0%), Business & Financial (75.0%), and Community & Social Service (50.0%), while the most female-oriented occupations are Health Diagnosing & Treating (100.0%), Health Technologists (100.0%), and Management (75.0%).
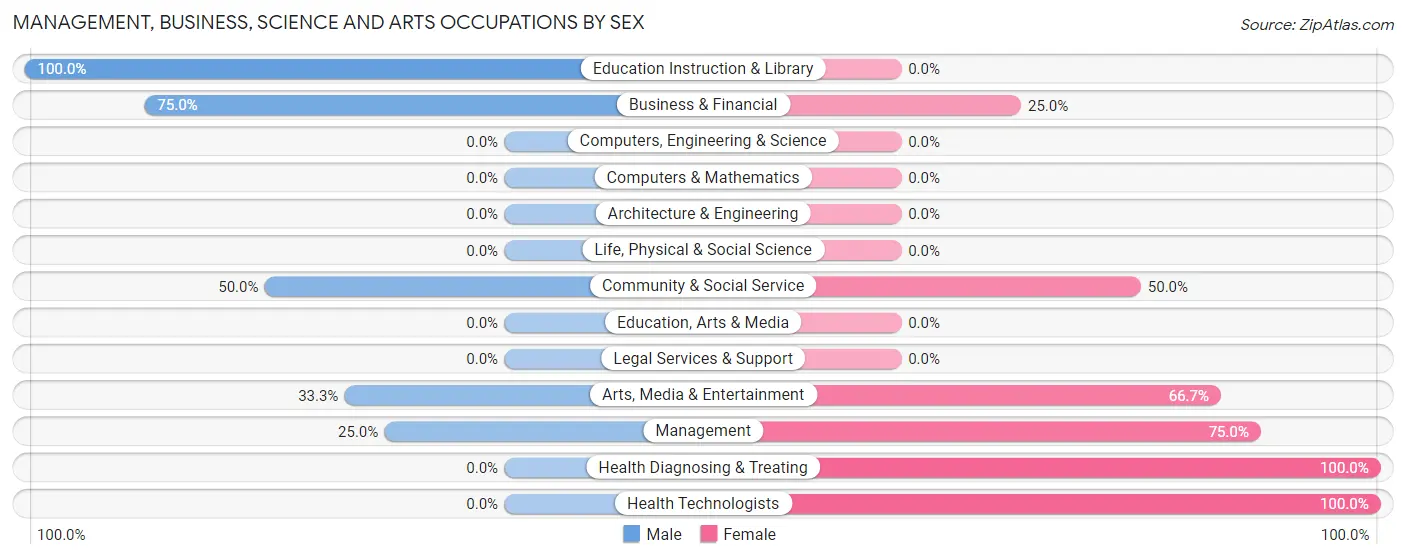
| Occupation | Male | Female |
| Management | 1 (25.0%) | 3 (75.0%) |
| Business & Financial | 3 (75.0%) | 1 (25.0%) |
| Computers, Engineering & Science | 0 (0.0%) | 0 (0.0%) |
| Computers & Mathematics | 0 (0.0%) | 0 (0.0%) |
| Architecture & Engineering | 0 (0.0%) | 0 (0.0%) |
| Life, Physical & Social Science | 0 (0.0%) | 0 (0.0%) |
| Community & Social Service | 2 (50.0%) | 2 (50.0%) |
| Education, Arts & Media | 0 (0.0%) | 0 (0.0%) |
| Legal Services & Support | 0 (0.0%) | 0 (0.0%) |
| Education Instruction & Library | 1 (100.0%) | 0 (0.0%) |
| Arts, Media & Entertainment | 1 (33.3%) | 2 (66.7%) |
| Health Diagnosing & Treating | 0 (0.0%) | 6 (100.0%) |
| Health Technologists | 0 (0.0%) | 1 (100.0%) |
| Total (Category) | 6 (33.3%) | 12 (66.7%) |
| Total (Overall) | 132 (82.0%) | 29 (18.0%) |
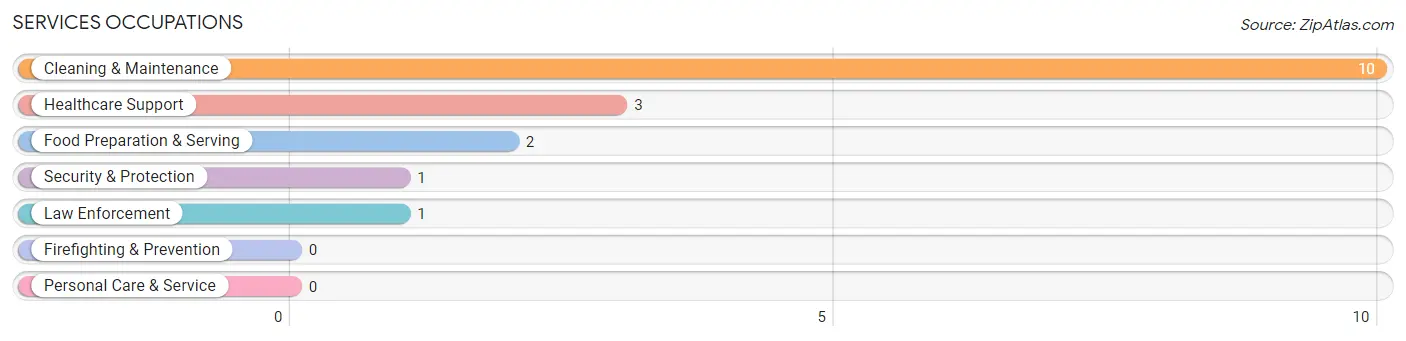
Services Occupations
The most common Services occupations in County Line are Cleaning & Maintenance (10 | 6.2%), Healthcare Support (3 | 1.9%), Food Preparation & Serving (2 | 1.2%), Security & Protection (1 | 0.6%), and Law Enforcement (1 | 0.6%).
Services Occupations by Sex
Within the Services occupations in County Line, the most male-oriented occupations are Security & Protection (100.0%), Law Enforcement (100.0%), and Cleaning & Maintenance (80.0%), while the most female-oriented occupations are Healthcare Support (100.0%), Food Preparation & Serving (100.0%), and Cleaning & Maintenance (20.0%).
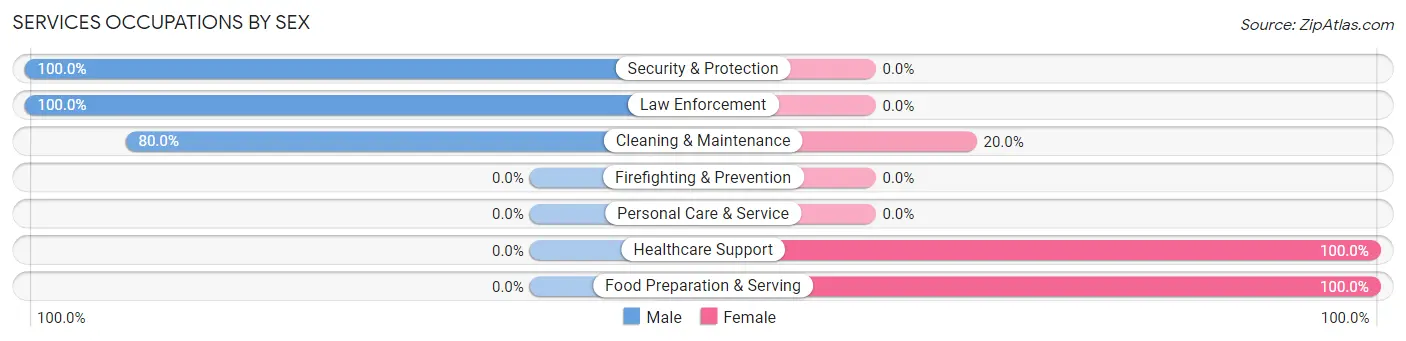
| Occupation | Male | Female |
| Healthcare Support | 0 (0.0%) | 3 (100.0%) |
| Security & Protection | 1 (100.0%) | 0 (0.0%) |
| Firefighting & Prevention | 0 (0.0%) | 0 (0.0%) |
| Law Enforcement | 1 (100.0%) | 0 (0.0%) |
| Food Preparation & Serving | 0 (0.0%) | 2 (100.0%) |
| Cleaning & Maintenance | 8 (80.0%) | 2 (20.0%) |
| Personal Care & Service | 0 (0.0%) | 0 (0.0%) |
| Total (Category) | 9 (56.2%) | 7 (43.8%) |
| Total (Overall) | 132 (82.0%) | 29 (18.0%) |
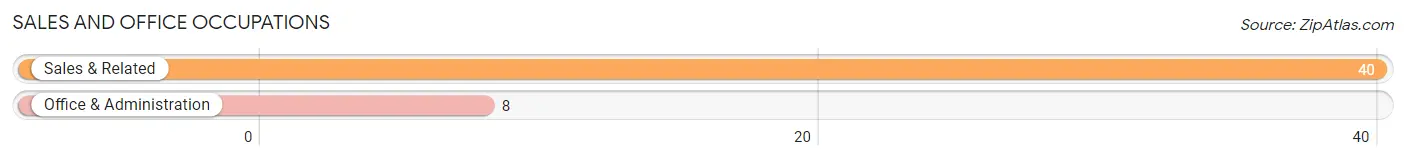
Sales and Office Occupations
The most common Sales and Office occupations in County Line are Sales & Related (40 | 24.8%), and Office & Administration (8 | 5.0%).
Sales and Office Occupations by Sex
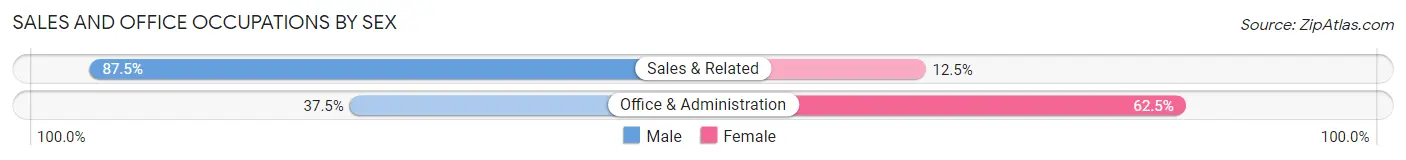
| Occupation | Male | Female |
| Sales & Related | 35 (87.5%) | 5 (12.5%) |
| Office & Administration | 3 (37.5%) | 5 (62.5%) |
| Total (Category) | 38 (79.2%) | 10 (20.8%) |
| Total (Overall) | 132 (82.0%) | 29 (18.0%) |
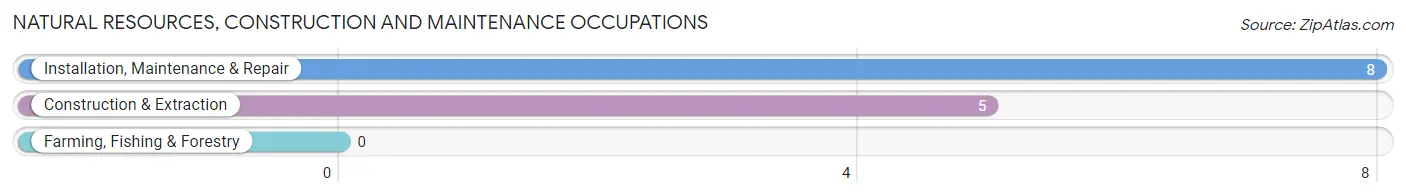
Natural Resources, Construction and Maintenance Occupations
The most common Natural Resources, Construction and Maintenance occupations in County Line are Installation, Maintenance & Repair (8 | 5.0%), and Construction & Extraction (5 | 3.1%).
Natural Resources, Construction and Maintenance Occupations by Sex
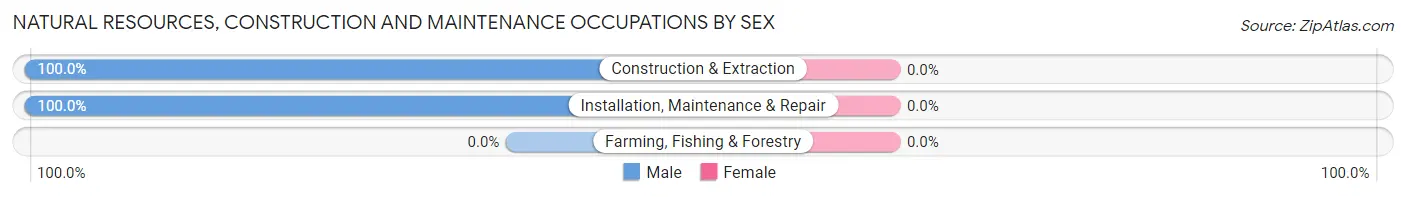
| Occupation | Male | Female |
| Farming, Fishing & Forestry | 0 (0.0%) | 0 (0.0%) |
| Construction & Extraction | 5 (100.0%) | 0 (0.0%) |
| Installation, Maintenance & Repair | 8 (100.0%) | 0 (0.0%) |
| Total (Category) | 13 (100.0%) | 0 (0.0%) |
| Total (Overall) | 132 (82.0%) | 29 (18.0%) |
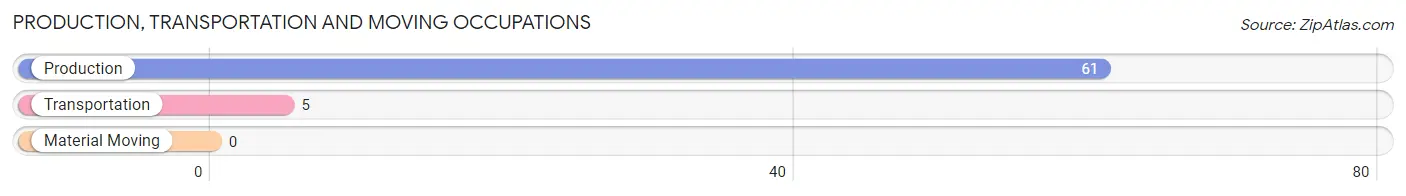
Production, Transportation and Moving Occupations
The most common Production, Transportation and Moving occupations in County Line are Production (61 | 37.9%), and Transportation (5 | 3.1%).
Production, Transportation and Moving Occupations by Sex
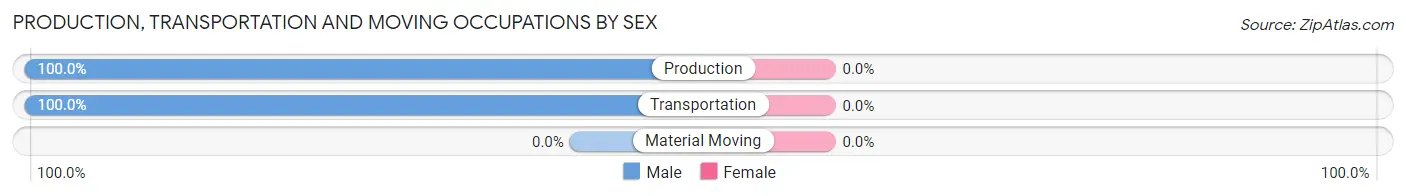
| Occupation | Male | Female |
| Production | 61 (100.0%) | 0 (0.0%) |
| Transportation | 5 (100.0%) | 0 (0.0%) |
| Material Moving | 0 (0.0%) | 0 (0.0%) |
| Total (Category) | 66 (100.0%) | 0 (0.0%) |
| Total (Overall) | 132 (82.0%) | 29 (18.0%) |
Employment Industries by Sex in County Line
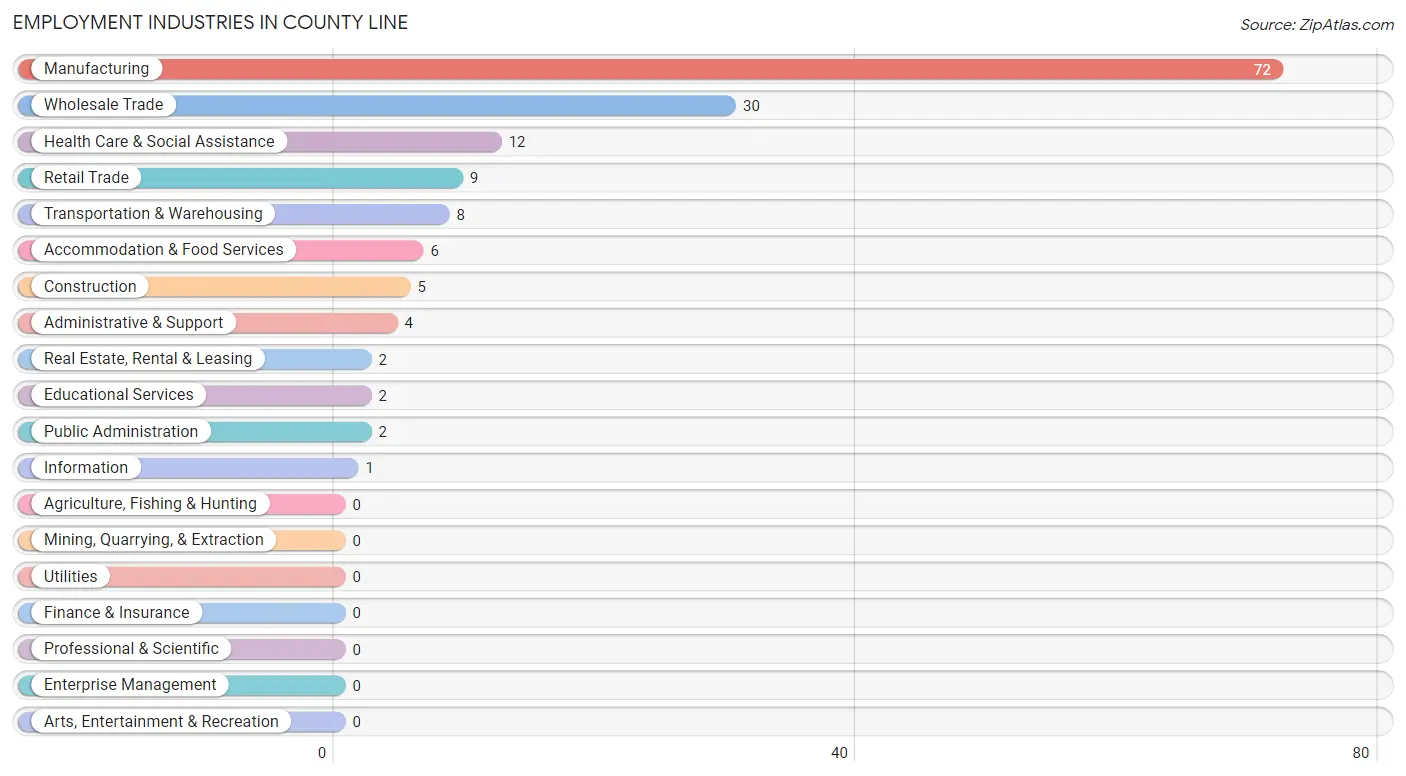
Employment Industries in County Line
The major employment industries in County Line include Manufacturing (72 | 44.7%), Wholesale Trade (30 | 18.6%), Health Care & Social Assistance (12 | 7.4%), Retail Trade (9 | 5.6%), and Transportation & Warehousing (8 | 5.0%).
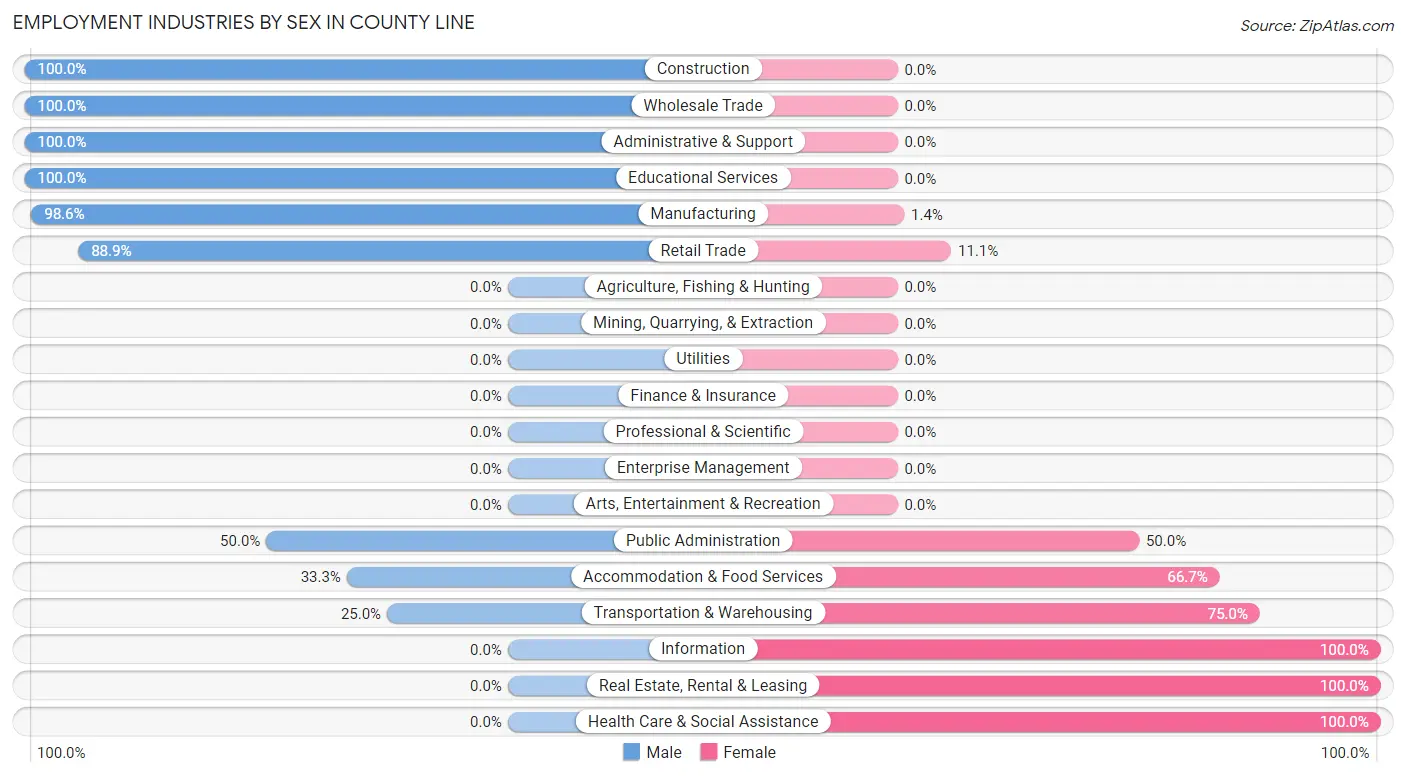
Employment Industries by Sex in County Line
The County Line industries that see more men than women are Construction (100.0%), Wholesale Trade (100.0%), and Administrative & Support (100.0%), whereas the industries that tend to have a higher number of women are Information (100.0%), Real Estate, Rental & Leasing (100.0%), and Health Care & Social Assistance (100.0%).
| Industry | Male | Female |
| Agriculture, Fishing & Hunting | 0 (0.0%) | 0 (0.0%) |
| Mining, Quarrying, & Extraction | 0 (0.0%) | 0 (0.0%) |
| Construction | 5 (100.0%) | 0 (0.0%) |
| Manufacturing | 71 (98.6%) | 1 (1.4%) |
| Wholesale Trade | 30 (100.0%) | 0 (0.0%) |
| Retail Trade | 8 (88.9%) | 1 (11.1%) |
| Transportation & Warehousing | 2 (25.0%) | 6 (75.0%) |
| Utilities | 0 (0.0%) | 0 (0.0%) |
| Information | 0 (0.0%) | 1 (100.0%) |
| Finance & Insurance | 0 (0.0%) | 0 (0.0%) |
| Real Estate, Rental & Leasing | 0 (0.0%) | 2 (100.0%) |
| Professional & Scientific | 0 (0.0%) | 0 (0.0%) |
| Enterprise Management | 0 (0.0%) | 0 (0.0%) |
| Administrative & Support | 4 (100.0%) | 0 (0.0%) |
| Educational Services | 2 (100.0%) | 0 (0.0%) |
| Health Care & Social Assistance | 0 (0.0%) | 12 (100.0%) |
| Arts, Entertainment & Recreation | 0 (0.0%) | 0 (0.0%) |
| Accommodation & Food Services | 2 (33.3%) | 4 (66.7%) |
| Public Administration | 1 (50.0%) | 1 (50.0%) |
| Total | 132 (82.0%) | 29 (18.0%) |
Education in County Line
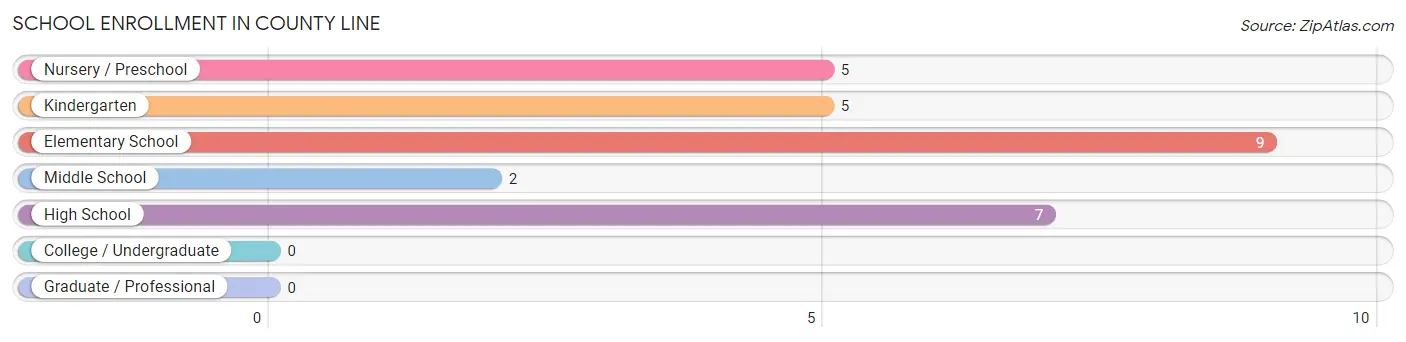
School Enrollment in County Line
The most common levels of schooling among the 28 students in County Line are elementary school (9 | 32.1%), high school (7 | 25.0%), and nursery / preschool (5 | 17.9%).
| School Level | # Students | % Students |
| Nursery / Preschool | 5 | 17.9% |
| Kindergarten | 5 | 17.9% |
| Elementary School | 9 | 32.1% |
| Middle School | 2 | 7.1% |
| High School | 7 | 25.0% |
| College / Undergraduate | 0 | 0.0% |
| Graduate / Professional | 0 | 0.0% |
| Total | 28 | 100.0% |
School Enrollment by Age by Funding Source in County Line
Out of a total of 28 students who are enrolled in schools in County Line, 7 (25.0%) attend a private institution, while the remaining 21 (75.0%) are enrolled in public schools. The age group of 3 to 4 year olds has the highest likelihood of being enrolled in private schools, with 5 (100.0% in the age bracket) enrolled. Conversely, the age group of 5 to 9 year old has the lowest likelihood of being enrolled in a private school, with 14 (100.0% in the age bracket) attending a public institution.
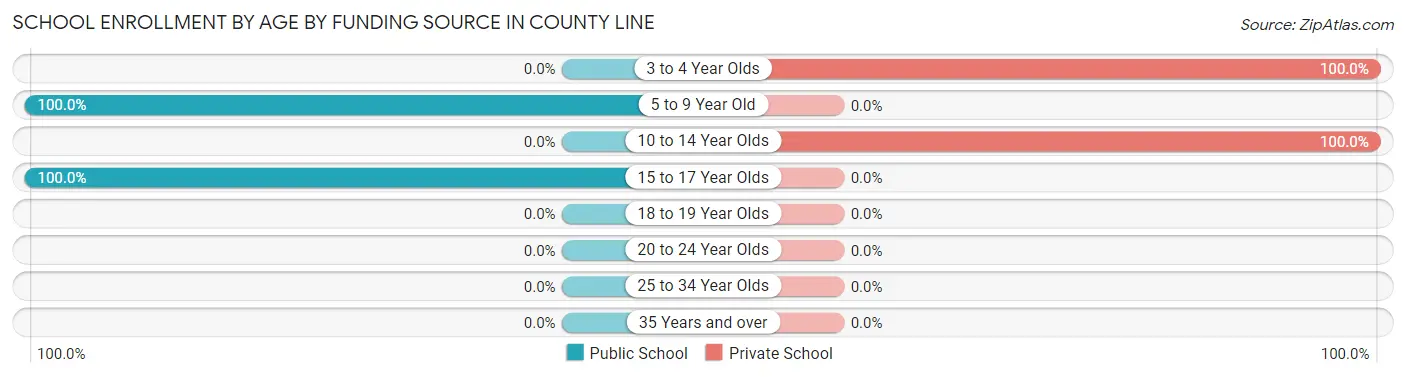
| Age Bracket | Public School | Private School |
| 3 to 4 Year Olds | 0 (0.0%) | 5 (100.0%) |
| 5 to 9 Year Old | 14 (100.0%) | 0 (0.0%) |
| 10 to 14 Year Olds | 0 (0.0%) | 2 (100.0%) |
| 15 to 17 Year Olds | 7 (100.0%) | 0 (0.0%) |
| 18 to 19 Year Olds | 0 (0.0%) | 0 (0.0%) |
| 20 to 24 Year Olds | 0 (0.0%) | 0 (0.0%) |
| 25 to 34 Year Olds | 0 (0.0%) | 0 (0.0%) |
| 35 Years and over | 0 (0.0%) | 0 (0.0%) |
| Total | 21 (75.0%) | 7 (25.0%) |
Educational Attainment by Field of Study in County Line
Business (3 | 27.3%), education (3 | 27.3%), communications (3 | 27.3%), liberal arts & history (1 | 9.1%), and visual & performing arts (1 | 9.1%) are the most common fields of study among 11 individuals in County Line who have obtained a bachelor's degree or higher.
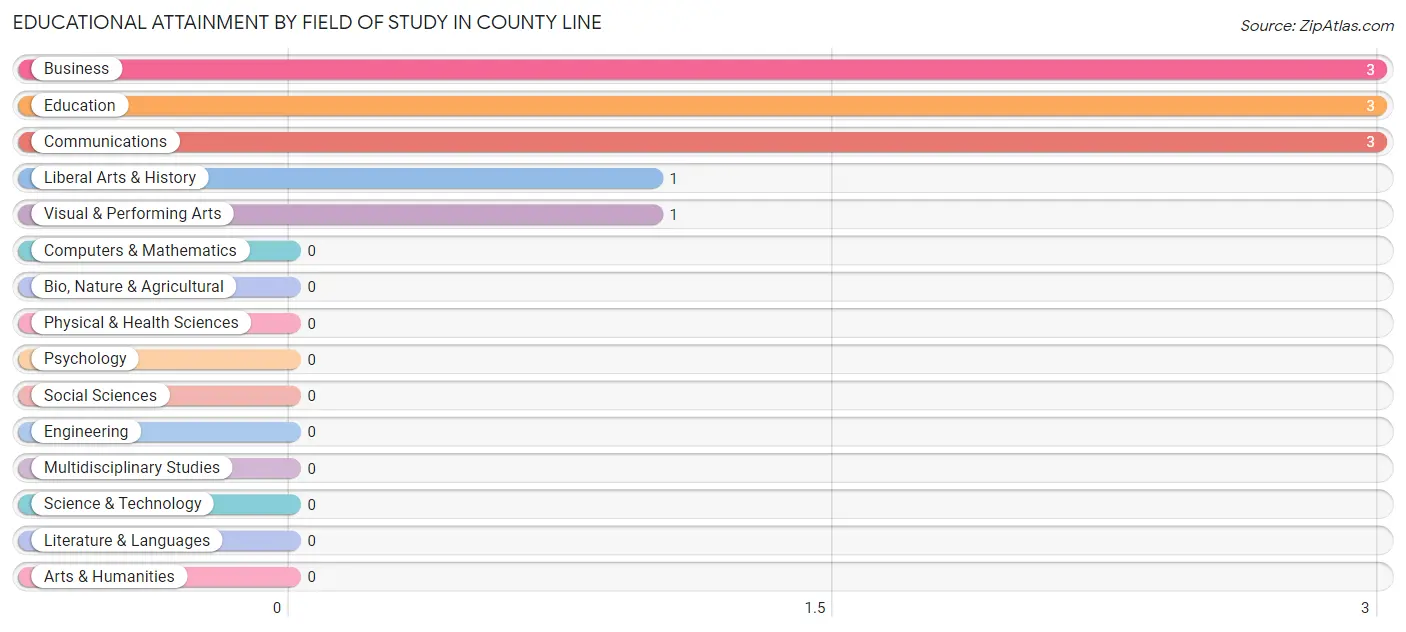
| Field of Study | # Graduates | % Graduates |
| Computers & Mathematics | 0 | 0.0% |
| Bio, Nature & Agricultural | 0 | 0.0% |
| Physical & Health Sciences | 0 | 0.0% |
| Psychology | 0 | 0.0% |
| Social Sciences | 0 | 0.0% |
| Engineering | 0 | 0.0% |
| Multidisciplinary Studies | 0 | 0.0% |
| Science & Technology | 0 | 0.0% |
| Business | 3 | 27.3% |
| Education | 3 | 27.3% |
| Literature & Languages | 0 | 0.0% |
| Liberal Arts & History | 1 | 9.1% |
| Visual & Performing Arts | 1 | 9.1% |
| Communications | 3 | 27.3% |
| Arts & Humanities | 0 | 0.0% |
| Total | 11 | 100.0% |
Transportation & Commute in County Line
Vehicle Availability by Sex in County Line
The most prevalent vehicle ownership categories in County Line are males with 2 vehicles (106, accounting for 80.3%) and females with 2 vehicles (6, making up 365.5%).
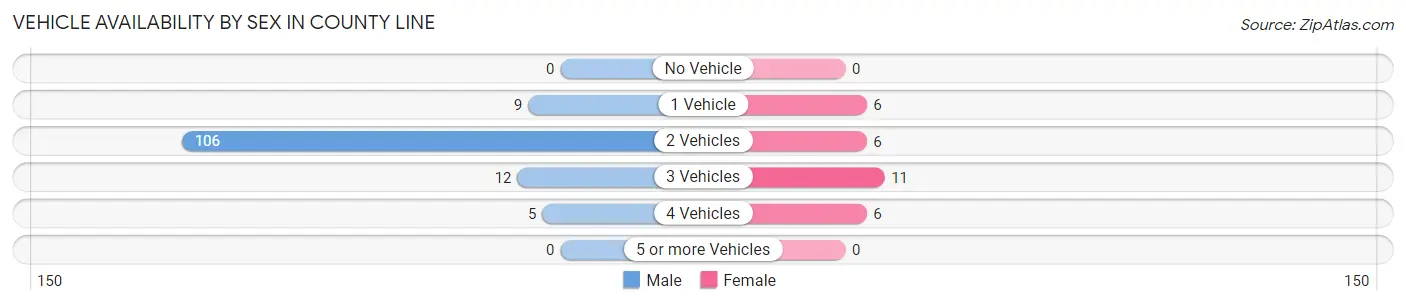
| Vehicles Available | Male | Female |
| No Vehicle | 0 (0.0%) | 0 (0.0%) |
| 1 Vehicle | 9 (6.8%) | 6 (20.7%) |
| 2 Vehicles | 106 (80.3%) | 6 (20.7%) |
| 3 Vehicles | 12 (9.1%) | 11 (37.9%) |
| 4 Vehicles | 5 (3.8%) | 6 (20.7%) |
| 5 or more Vehicles | 0 (0.0%) | 0 (0.0%) |
| Total | 132 (100.0%) | 29 (100.0%) |
Commute Time in County Line
The most frequently occuring commute durations in County Line are 20 to 24 minutes (60 commuters, 48.4%), 25 to 29 minutes (14 commuters, 11.3%), and 30 to 34 minutes (14 commuters, 11.3%).
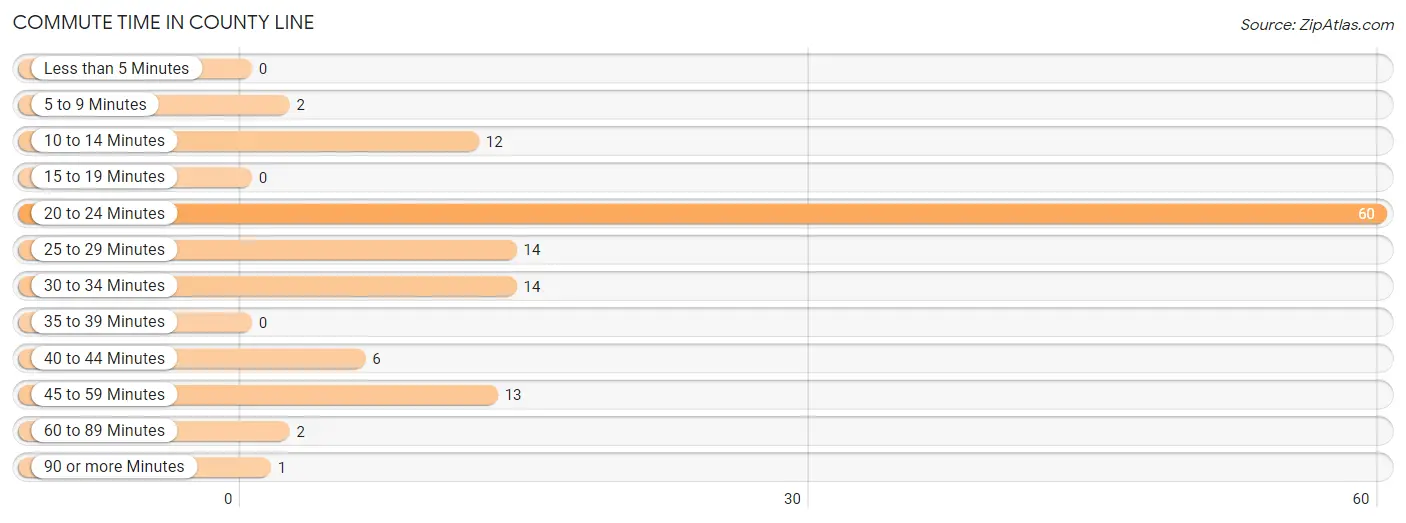
| Commute Time | # Commuters | % Commuters |
| Less than 5 Minutes | 0 | 0.0% |
| 5 to 9 Minutes | 2 | 1.6% |
| 10 to 14 Minutes | 12 | 9.7% |
| 15 to 19 Minutes | 0 | 0.0% |
| 20 to 24 Minutes | 60 | 48.4% |
| 25 to 29 Minutes | 14 | 11.3% |
| 30 to 34 Minutes | 14 | 11.3% |
| 35 to 39 Minutes | 0 | 0.0% |
| 40 to 44 Minutes | 6 | 4.8% |
| 45 to 59 Minutes | 13 | 10.5% |
| 60 to 89 Minutes | 2 | 1.6% |
| 90 or more Minutes | 1 | 0.8% |
Commute Time by Sex in County Line
The most common commute times in County Line are 20 to 24 minutes (60 commuters, 58.8%) for males and 30 to 34 minutes (8 commuters, 36.4%) for females.
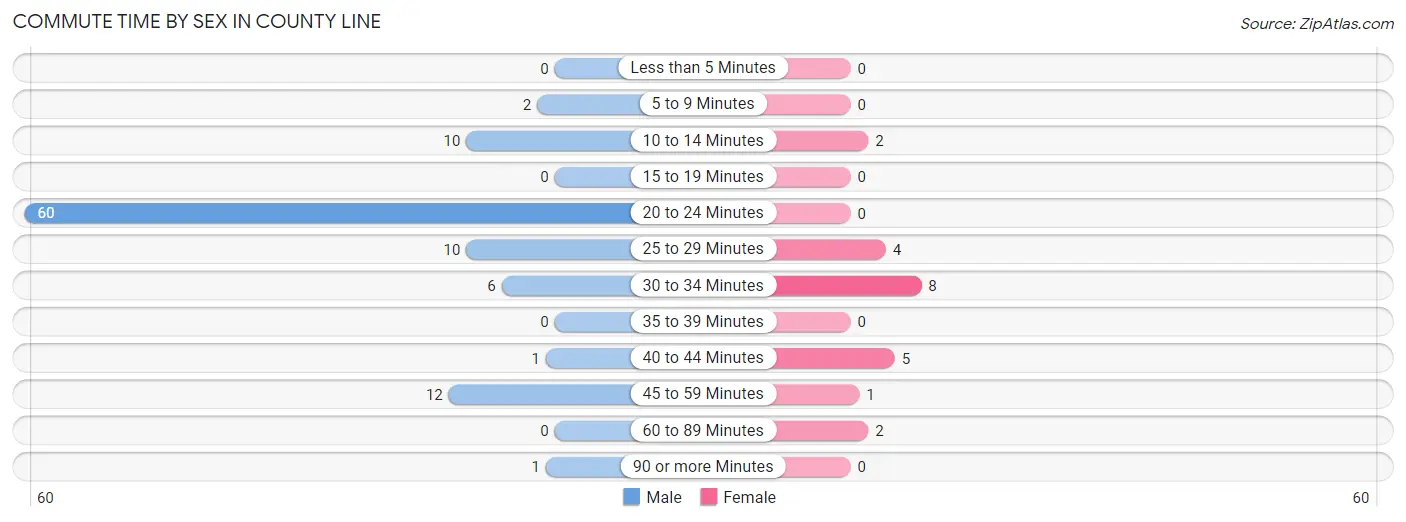
| Commute Time | Male | Female |
| Less than 5 Minutes | 0 (0.0%) | 0 (0.0%) |
| 5 to 9 Minutes | 2 (2.0%) | 0 (0.0%) |
| 10 to 14 Minutes | 10 (9.8%) | 2 (9.1%) |
| 15 to 19 Minutes | 0 (0.0%) | 0 (0.0%) |
| 20 to 24 Minutes | 60 (58.8%) | 0 (0.0%) |
| 25 to 29 Minutes | 10 (9.8%) | 4 (18.2%) |
| 30 to 34 Minutes | 6 (5.9%) | 8 (36.4%) |
| 35 to 39 Minutes | 0 (0.0%) | 0 (0.0%) |
| 40 to 44 Minutes | 1 (1.0%) | 5 (22.7%) |
| 45 to 59 Minutes | 12 (11.8%) | 1 (4.5%) |
| 60 to 89 Minutes | 0 (0.0%) | 2 (9.1%) |
| 90 or more Minutes | 1 (1.0%) | 0 (0.0%) |
Time of Departure to Work by Sex in County Line
The most frequent times of departure to work in County Line are 5:00 AM to 5:29 AM (65, 63.7%) for males and 4:00 PM to 11:59 PM (7, 31.8%) for females.
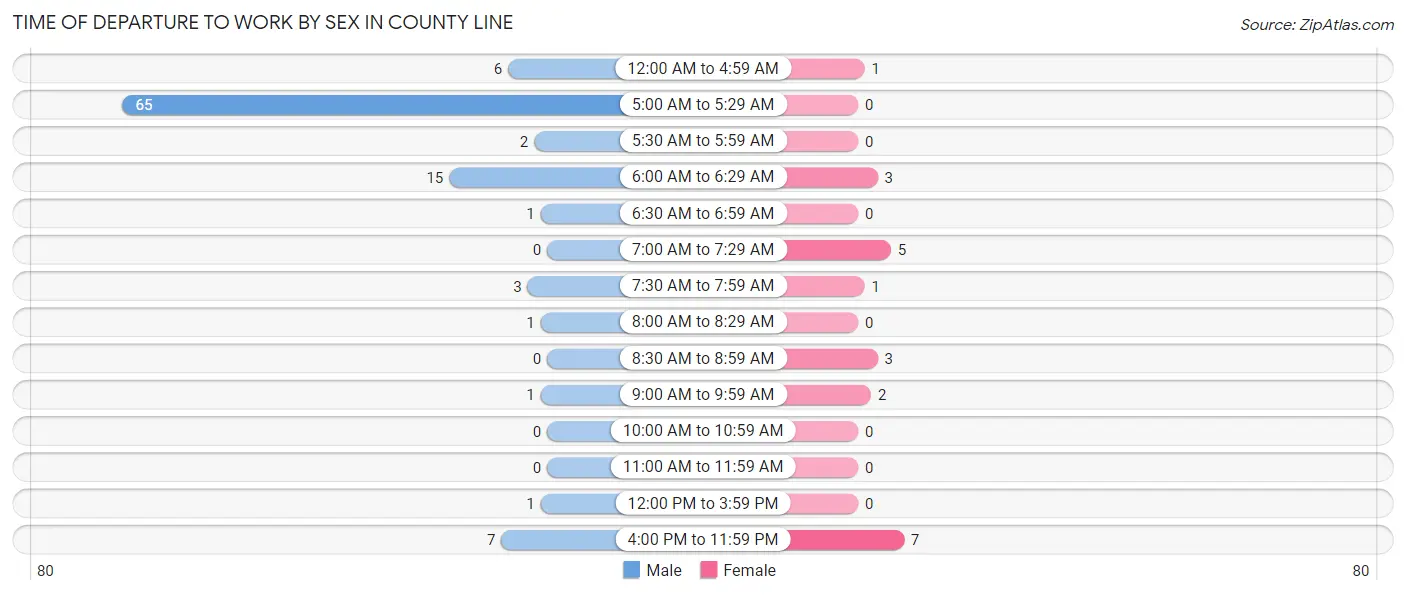
| Time of Departure | Male | Female |
| 12:00 AM to 4:59 AM | 6 (5.9%) | 1 (4.5%) |
| 5:00 AM to 5:29 AM | 65 (63.7%) | 0 (0.0%) |
| 5:30 AM to 5:59 AM | 2 (2.0%) | 0 (0.0%) |
| 6:00 AM to 6:29 AM | 15 (14.7%) | 3 (13.6%) |
| 6:30 AM to 6:59 AM | 1 (1.0%) | 0 (0.0%) |
| 7:00 AM to 7:29 AM | 0 (0.0%) | 5 (22.7%) |
| 7:30 AM to 7:59 AM | 3 (2.9%) | 1 (4.5%) |
| 8:00 AM to 8:29 AM | 1 (1.0%) | 0 (0.0%) |
| 8:30 AM to 8:59 AM | 0 (0.0%) | 3 (13.6%) |
| 9:00 AM to 9:59 AM | 1 (1.0%) | 2 (9.1%) |
| 10:00 AM to 10:59 AM | 0 (0.0%) | 0 (0.0%) |
| 11:00 AM to 11:59 AM | 0 (0.0%) | 0 (0.0%) |
| 12:00 PM to 3:59 PM | 1 (1.0%) | 0 (0.0%) |
| 4:00 PM to 11:59 PM | 7 (6.9%) | 7 (31.8%) |
| Total | 102 (100.0%) | 22 (100.0%) |
Housing Occupancy in County Line
Occupancy by Ownership in County Line
Of the total 93 dwellings in County Line, owner-occupied units account for 88 (94.6%), while renter-occupied units make up 5 (5.4%).
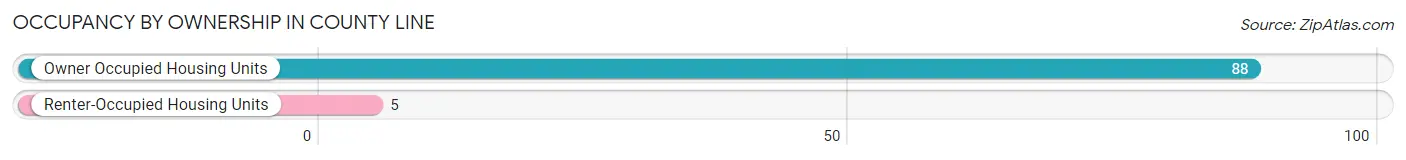
| Occupancy | # Housing Units | % Housing Units |
| Owner Occupied Housing Units | 88 | 94.6% |
| Renter-Occupied Housing Units | 5 | 5.4% |
| Total Occupied Housing Units | 93 | 100.0% |
Occupancy by Household Size in County Line
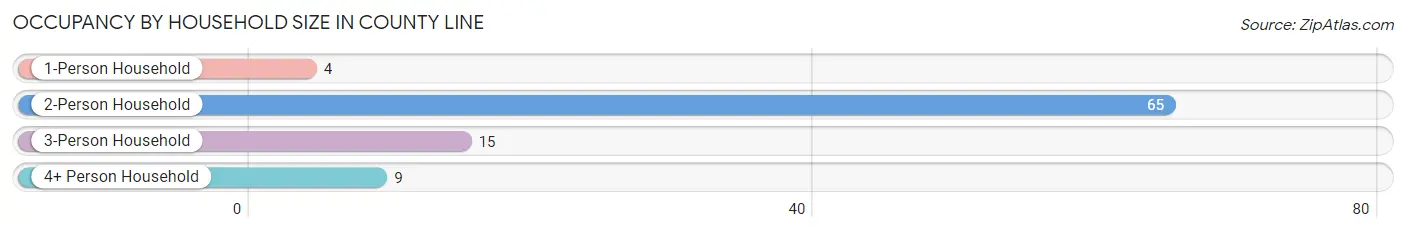
| Household Size | # Housing Units | % Housing Units |
| 1-Person Household | 4 | 4.3% |
| 2-Person Household | 65 | 69.9% |
| 3-Person Household | 15 | 16.1% |
| 4+ Person Household | 9 | 9.7% |
| Total Housing Units | 93 | 100.0% |
Occupancy by Ownership by Household Size in County Line
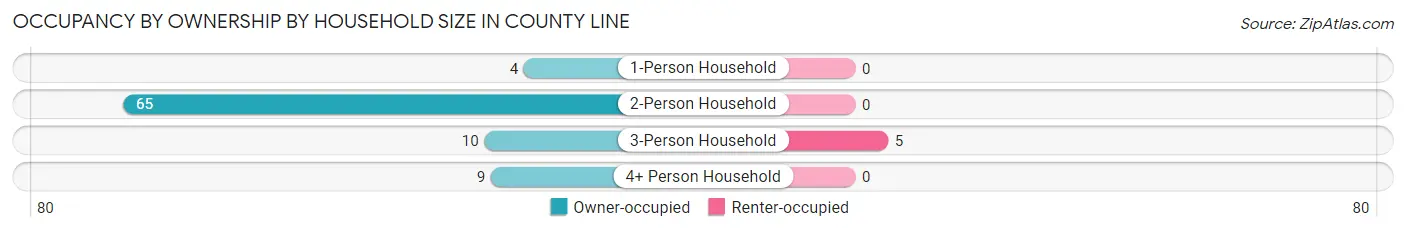
| Household Size | Owner-occupied | Renter-occupied |
| 1-Person Household | 4 (100.0%) | 0 (0.0%) |
| 2-Person Household | 65 (100.0%) | 0 (0.0%) |
| 3-Person Household | 10 (66.7%) | 5 (33.3%) |
| 4+ Person Household | 9 (100.0%) | 0 (0.0%) |
| Total Housing Units | 88 (94.6%) | 5 (5.4%) |
Occupancy by Educational Attainment in County Line
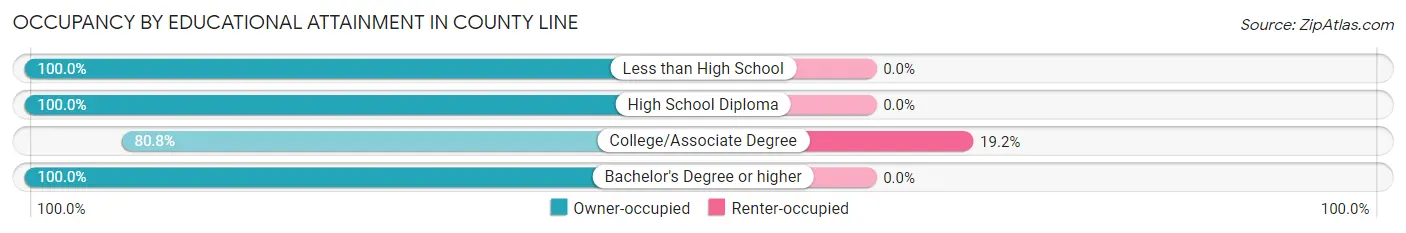
| Household Size | Owner-occupied | Renter-occupied |
| Less than High School | 10 (100.0%) | 0 (0.0%) |
| High School Diploma | 49 (100.0%) | 0 (0.0%) |
| College/Associate Degree | 21 (80.8%) | 5 (19.2%) |
| Bachelor's Degree or higher | 8 (100.0%) | 0 (0.0%) |
Occupancy by Age of Householder in County Line
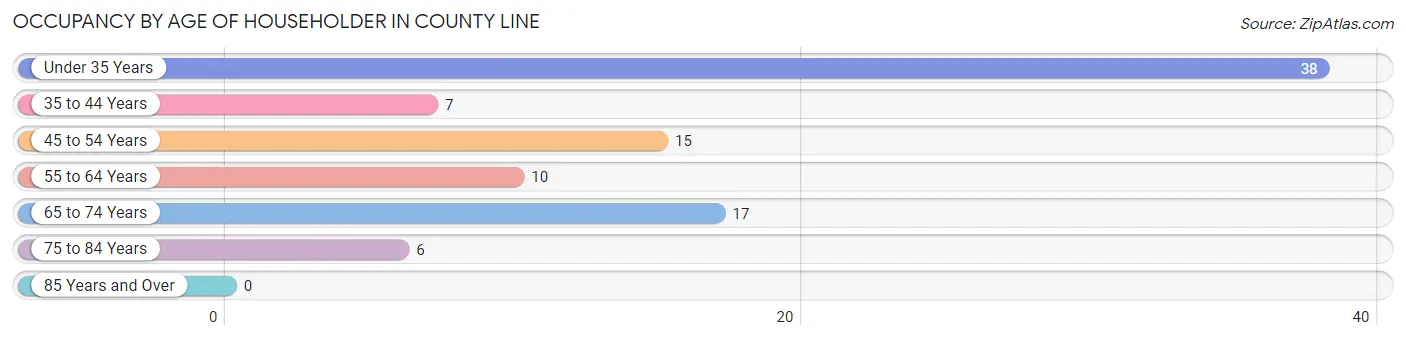
| Age Bracket | # Households | % Households |
| Under 35 Years | 38 | 40.9% |
| 35 to 44 Years | 7 | 7.5% |
| 45 to 54 Years | 15 | 16.1% |
| 55 to 64 Years | 10 | 10.7% |
| 65 to 74 Years | 17 | 18.3% |
| 75 to 84 Years | 6 | 6.5% |
| 85 Years and Over | 0 | 0.0% |
| Total | 93 | 100.0% |
Housing Finances in County Line
Median Income by Occupancy in County Line
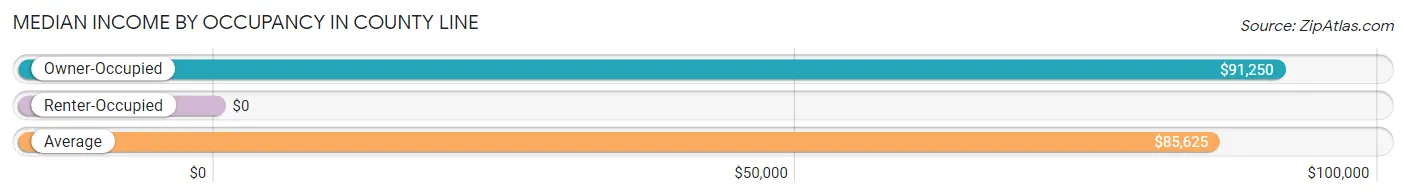
| Occupancy Type | # Households | Median Income |
| Owner-Occupied | 88 (94.6%) | $91,250 |
| Renter-Occupied | 5 (5.4%) | $0 |
| Average | 93 (100.0%) | $85,625 |
Occupancy by Householder Income Bracket in County Line
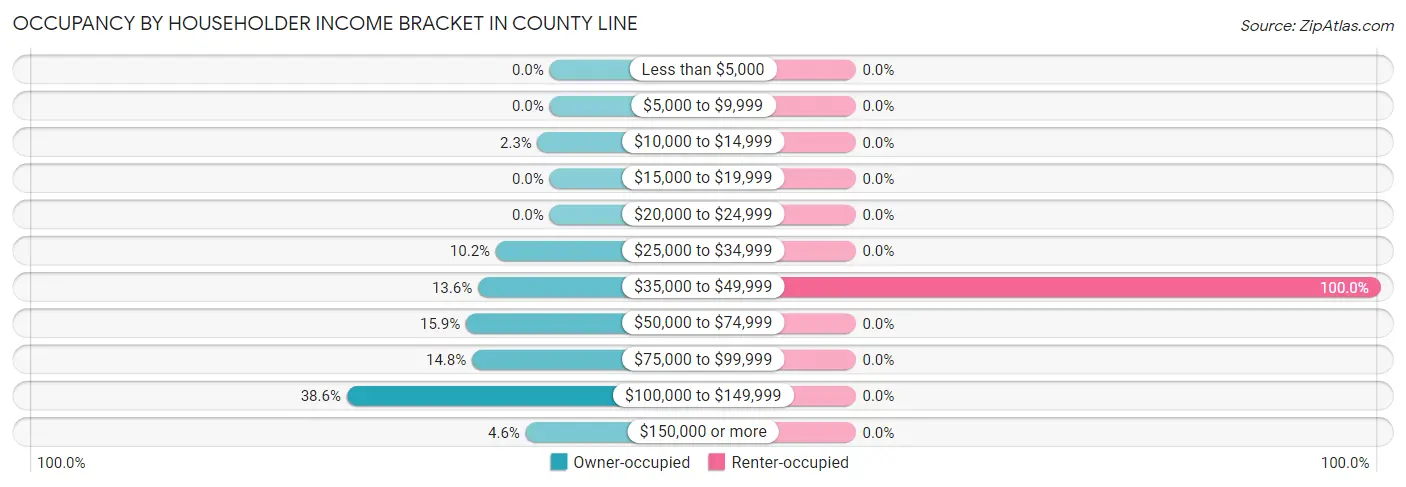
| Income Bracket | Owner-occupied | Renter-occupied |
| Less than $5,000 | 0 (0.0%) | 0 (0.0%) |
| $5,000 to $9,999 | 0 (0.0%) | 0 (0.0%) |
| $10,000 to $14,999 | 2 (2.3%) | 0 (0.0%) |
| $15,000 to $19,999 | 0 (0.0%) | 0 (0.0%) |
| $20,000 to $24,999 | 0 (0.0%) | 0 (0.0%) |
| $25,000 to $34,999 | 9 (10.2%) | 0 (0.0%) |
| $35,000 to $49,999 | 12 (13.6%) | 5 (100.0%) |
| $50,000 to $74,999 | 14 (15.9%) | 0 (0.0%) |
| $75,000 to $99,999 | 13 (14.8%) | 0 (0.0%) |
| $100,000 to $149,999 | 34 (38.6%) | 0 (0.0%) |
| $150,000 or more | 4 (4.5%) | 0 (0.0%) |
| Total | 88 (100.0%) | 5 (100.0%) |
Monthly Housing Cost Tiers in County Line
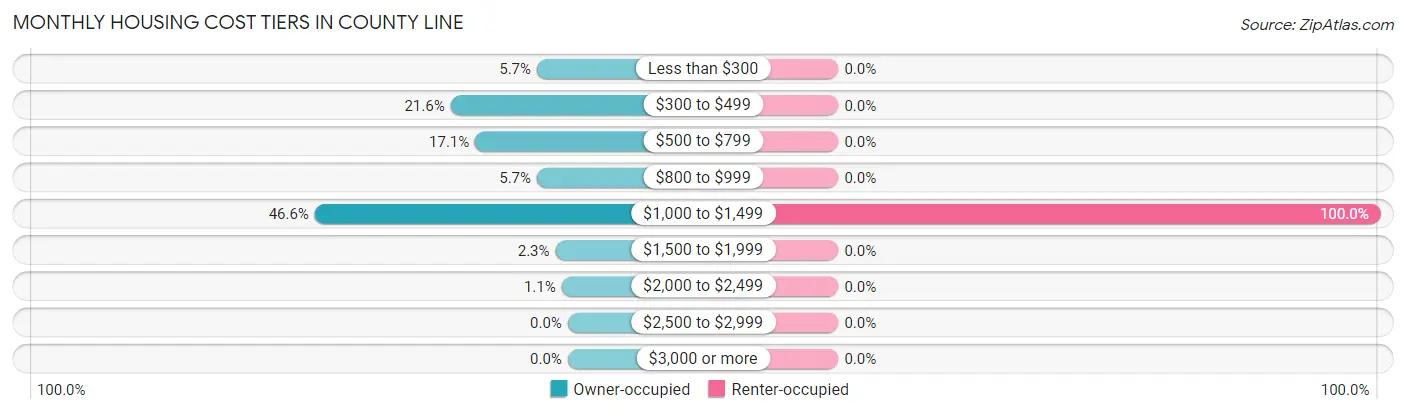
| Monthly Cost | Owner-occupied | Renter-occupied |
| Less than $300 | 5 (5.7%) | 0 (0.0%) |
| $300 to $499 | 19 (21.6%) | 0 (0.0%) |
| $500 to $799 | 15 (17.1%) | 0 (0.0%) |
| $800 to $999 | 5 (5.7%) | 0 (0.0%) |
| $1,000 to $1,499 | 41 (46.6%) | 5 (100.0%) |
| $1,500 to $1,999 | 2 (2.3%) | 0 (0.0%) |
| $2,000 to $2,499 | 1 (1.1%) | 0 (0.0%) |
| $2,500 to $2,999 | 0 (0.0%) | 0 (0.0%) |
| $3,000 or more | 0 (0.0%) | 0 (0.0%) |
| Total | 88 (100.0%) | 5 (100.0%) |
Physical Housing Characteristics in County Line
Housing Structures in County Line
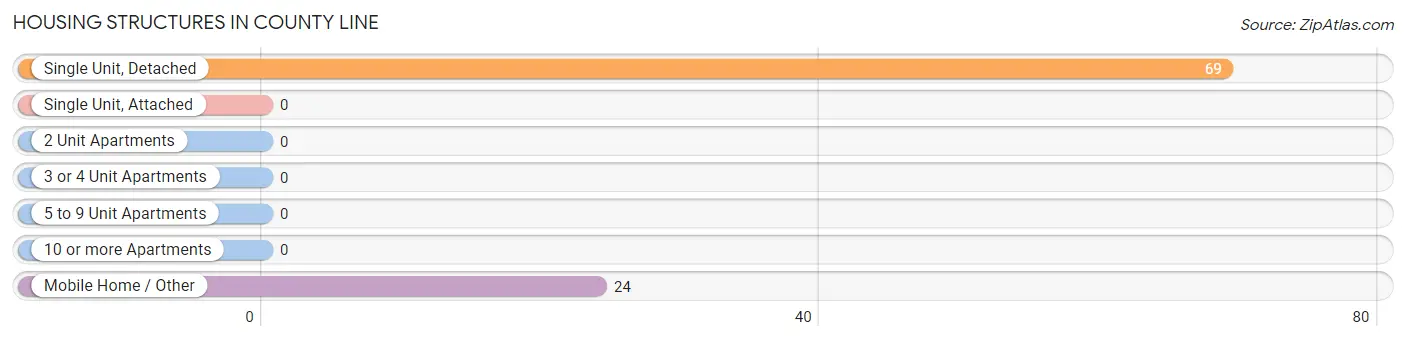
| Structure Type | # Housing Units | % Housing Units |
| Single Unit, Detached | 69 | 74.2% |
| Single Unit, Attached | 0 | 0.0% |
| 2 Unit Apartments | 0 | 0.0% |
| 3 or 4 Unit Apartments | 0 | 0.0% |
| 5 to 9 Unit Apartments | 0 | 0.0% |
| 10 or more Apartments | 0 | 0.0% |
| Mobile Home / Other | 24 | 25.8% |
| Total | 93 | 100.0% |
Housing Structures by Occupancy in County Line
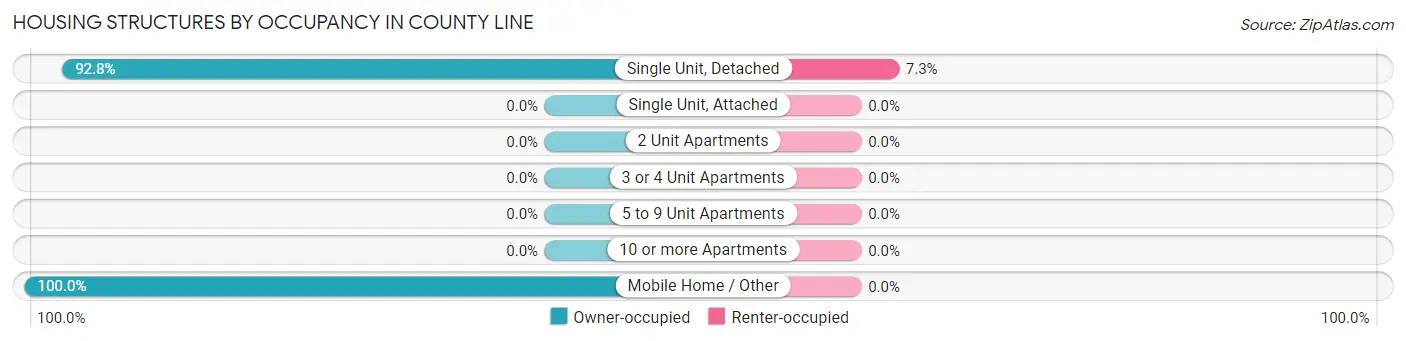
| Structure Type | Owner-occupied | Renter-occupied |
| Single Unit, Detached | 64 (92.7%) | 5 (7.2%) |
| Single Unit, Attached | 0 (0.0%) | 0 (0.0%) |
| 2 Unit Apartments | 0 (0.0%) | 0 (0.0%) |
| 3 or 4 Unit Apartments | 0 (0.0%) | 0 (0.0%) |
| 5 to 9 Unit Apartments | 0 (0.0%) | 0 (0.0%) |
| 10 or more Apartments | 0 (0.0%) | 0 (0.0%) |
| Mobile Home / Other | 24 (100.0%) | 0 (0.0%) |
| Total | 88 (94.6%) | 5 (5.4%) |
Housing Structures by Number of Rooms in County Line
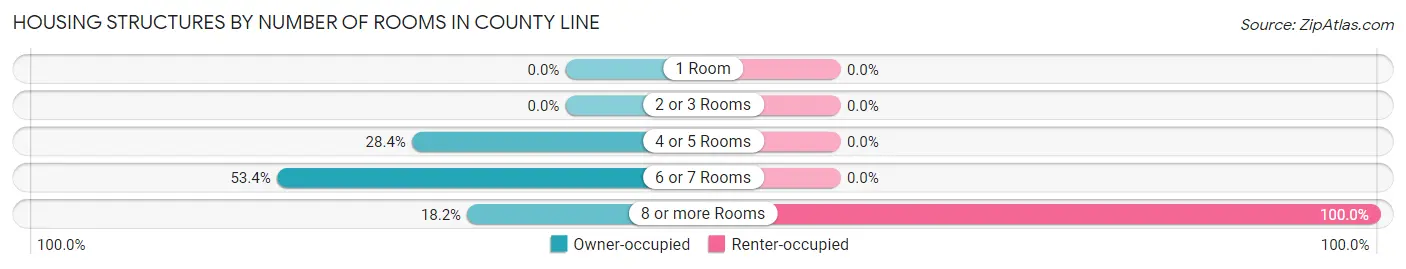
| Number of Rooms | Owner-occupied | Renter-occupied |
| 1 Room | 0 (0.0%) | 0 (0.0%) |
| 2 or 3 Rooms | 0 (0.0%) | 0 (0.0%) |
| 4 or 5 Rooms | 25 (28.4%) | 0 (0.0%) |
| 6 or 7 Rooms | 47 (53.4%) | 0 (0.0%) |
| 8 or more Rooms | 16 (18.2%) | 5 (100.0%) |
| Total | 88 (100.0%) | 5 (100.0%) |
Housing Structure by Heating Type in County Line
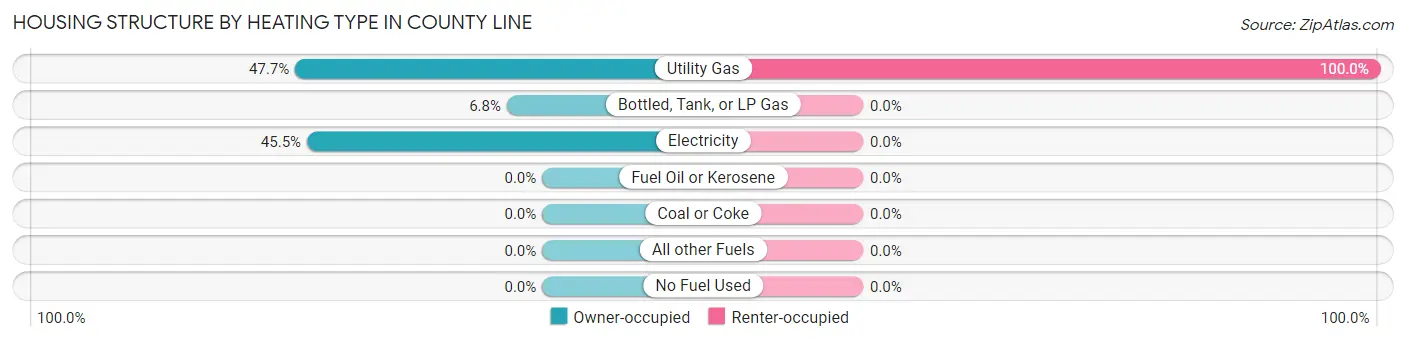
| Heating Type | Owner-occupied | Renter-occupied |
| Utility Gas | 42 (47.7%) | 5 (100.0%) |
| Bottled, Tank, or LP Gas | 6 (6.8%) | 0 (0.0%) |
| Electricity | 40 (45.5%) | 0 (0.0%) |
| Fuel Oil or Kerosene | 0 (0.0%) | 0 (0.0%) |
| Coal or Coke | 0 (0.0%) | 0 (0.0%) |
| All other Fuels | 0 (0.0%) | 0 (0.0%) |
| No Fuel Used | 0 (0.0%) | 0 (0.0%) |
| Total | 88 (100.0%) | 5 (100.0%) |
Household Vehicle Usage in County Line
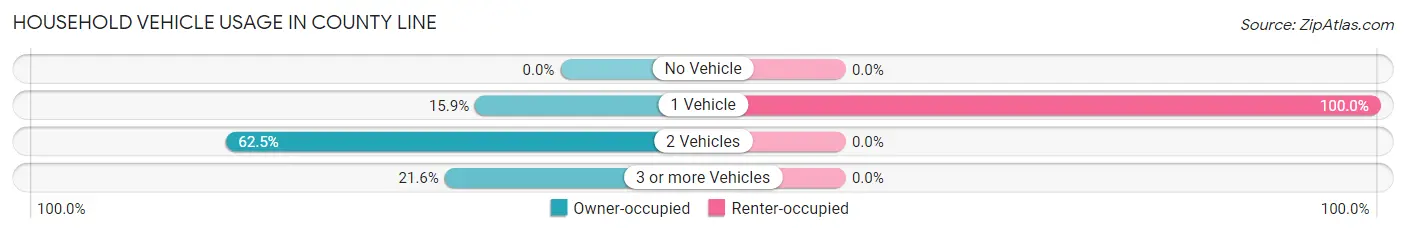
| Vehicles per Household | Owner-occupied | Renter-occupied |
| No Vehicle | 0 (0.0%) | 0 (0.0%) |
| 1 Vehicle | 14 (15.9%) | 5 (100.0%) |
| 2 Vehicles | 55 (62.5%) | 0 (0.0%) |
| 3 or more Vehicles | 19 (21.6%) | 0 (0.0%) |
| Total | 88 (100.0%) | 5 (100.0%) |
Real Estate & Mortgages in County Line
Real Estate and Mortgage Overview in County Line
| Characteristic | Without Mortgage | With Mortgage |
| Housing Units | 34 | 54 |
| Median Property Value | $102,500 | $77,700 |
| Median Household Income | $49,167 | $1 |
| Monthly Housing Costs | $414 | $0 |
| Real Estate Taxes | $325 | $4 |
Property Value by Mortgage Status in County Line
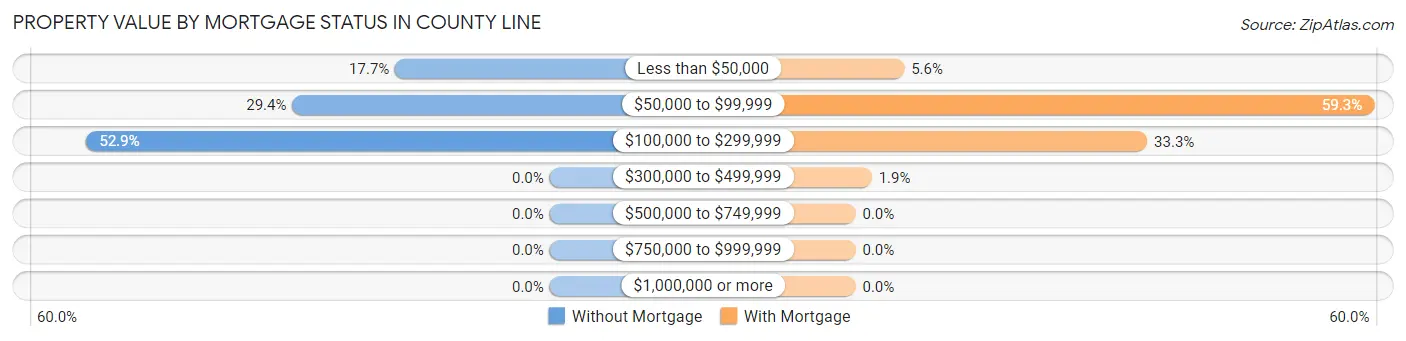
| Property Value | Without Mortgage | With Mortgage |
| Less than $50,000 | 6 (17.6%) | 3 (5.6%) |
| $50,000 to $99,999 | 10 (29.4%) | 32 (59.3%) |
| $100,000 to $299,999 | 18 (52.9%) | 18 (33.3%) |
| $300,000 to $499,999 | 0 (0.0%) | 1 (1.8%) |
| $500,000 to $749,999 | 0 (0.0%) | 0 (0.0%) |
| $750,000 to $999,999 | 0 (0.0%) | 0 (0.0%) |
| $1,000,000 or more | 0 (0.0%) | 0 (0.0%) |
| Total | 34 (100.0%) | 54 (100.0%) |
Household Income by Mortgage Status in County Line
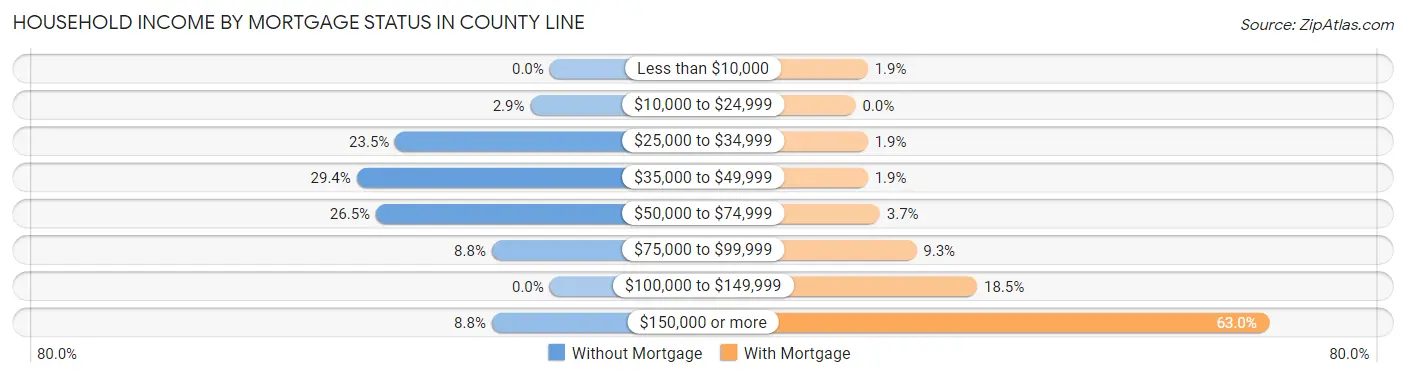
| Household Income | Without Mortgage | With Mortgage |
| Less than $10,000 | 0 (0.0%) | 1 (1.8%) |
| $10,000 to $24,999 | 1 (2.9%) | 0 (0.0%) |
| $25,000 to $34,999 | 8 (23.5%) | 1 (1.8%) |
| $35,000 to $49,999 | 10 (29.4%) | 1 (1.8%) |
| $50,000 to $74,999 | 9 (26.5%) | 2 (3.7%) |
| $75,000 to $99,999 | 3 (8.8%) | 5 (9.3%) |
| $100,000 to $149,999 | 0 (0.0%) | 10 (18.5%) |
| $150,000 or more | 3 (8.8%) | 34 (63.0%) |
| Total | 34 (100.0%) | 54 (100.0%) |
Property Value to Household Income Ratio in County Line
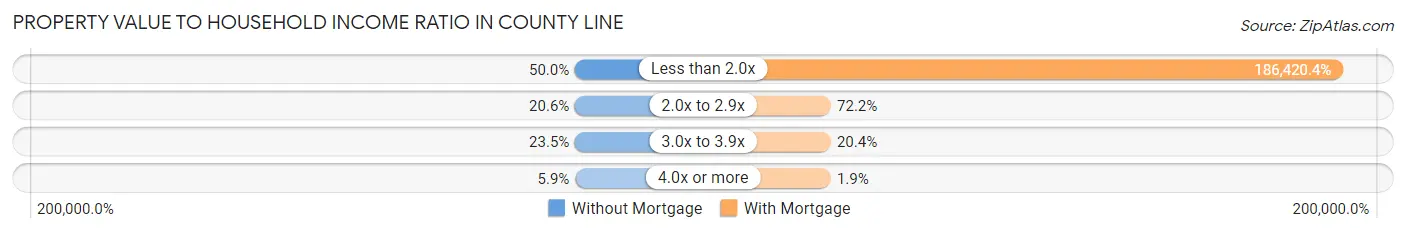
| Value-to-Income Ratio | Without Mortgage | With Mortgage |
| Less than 2.0x | 17 (50.0%) | 100,667 (186,420.4%) |
| 2.0x to 2.9x | 7 (20.6%) | 39 (72.2%) |
| 3.0x to 3.9x | 8 (23.5%) | 11 (20.4%) |
| 4.0x or more | 2 (5.9%) | 1 (1.8%) |
| Total | 34 (100.0%) | 54 (100.0%) |
Real Estate Taxes by Mortgage Status in County Line
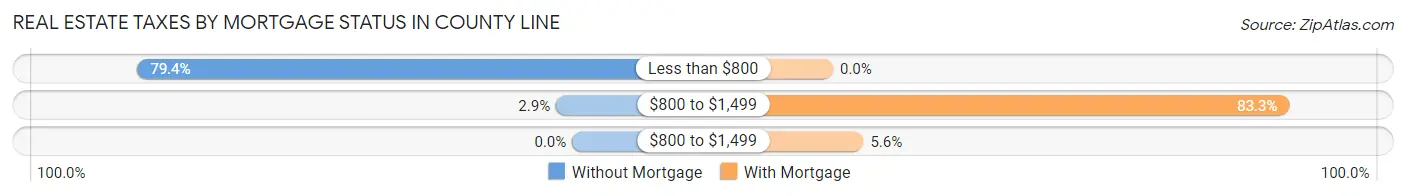
| Property Taxes | Without Mortgage | With Mortgage |
| Less than $800 | 27 (79.4%) | 0 (0.0%) |
| $800 to $1,499 | 1 (2.9%) | 45 (83.3%) |
| $800 to $1,499 | 0 (0.0%) | 3 (5.6%) |
| Total | 34 (100.0%) | 54 (100.0%) |
Health & Disability in County Line
Health Insurance Coverage by Age in County Line
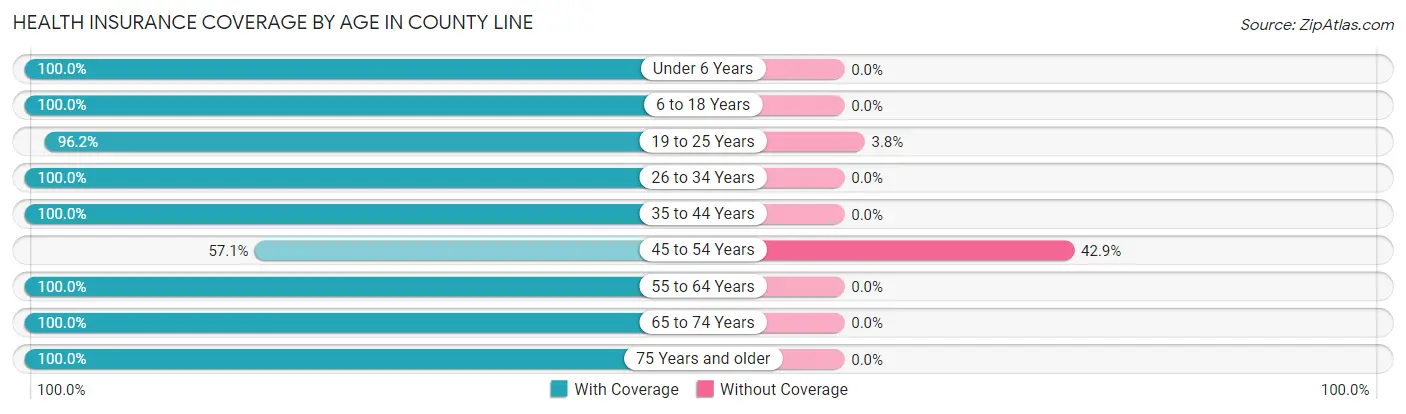
| Age Bracket | With Coverage | Without Coverage |
| Under 6 Years | 23 (100.0%) | 0 (0.0%) |
| 6 to 18 Years | 23 (100.0%) | 0 (0.0%) |
| 19 to 25 Years | 102 (96.2%) | 4 (3.8%) |
| 26 to 34 Years | 15 (100.0%) | 0 (0.0%) |
| 35 to 44 Years | 15 (100.0%) | 0 (0.0%) |
| 45 to 54 Years | 20 (57.1%) | 15 (42.9%) |
| 55 to 64 Years | 23 (100.0%) | 0 (0.0%) |
| 65 to 74 Years | 26 (100.0%) | 0 (0.0%) |
| 75 Years and older | 12 (100.0%) | 0 (0.0%) |
| Total | 259 (93.2%) | 19 (6.8%) |
Health Insurance Coverage by Citizenship Status in County Line
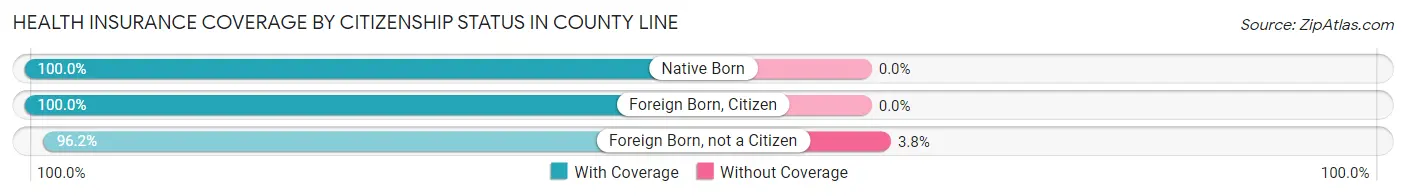
| Citizenship Status | With Coverage | Without Coverage |
| Native Born | 23 (100.0%) | 0 (0.0%) |
| Foreign Born, Citizen | 23 (100.0%) | 0 (0.0%) |
| Foreign Born, not a Citizen | 102 (96.2%) | 4 (3.8%) |
Health Insurance Coverage by Household Income in County Line
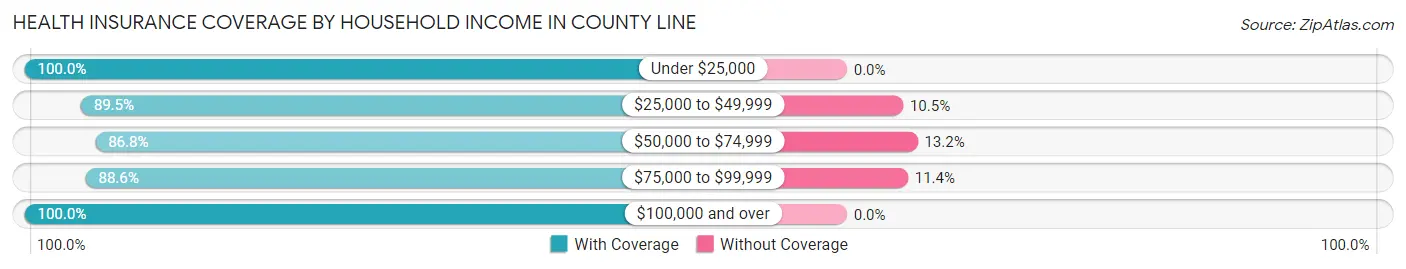
| Household Income | With Coverage | Without Coverage |
| Under $25,000 | 4 (100.0%) | 0 (0.0%) |
| $25,000 to $49,999 | 51 (89.5%) | 6 (10.5%) |
| $50,000 to $74,999 | 59 (86.8%) | 9 (13.2%) |
| $75,000 to $99,999 | 31 (88.6%) | 4 (11.4%) |
| $100,000 and over | 114 (100.0%) | 0 (0.0%) |
Public vs Private Health Insurance Coverage by Age in County Line
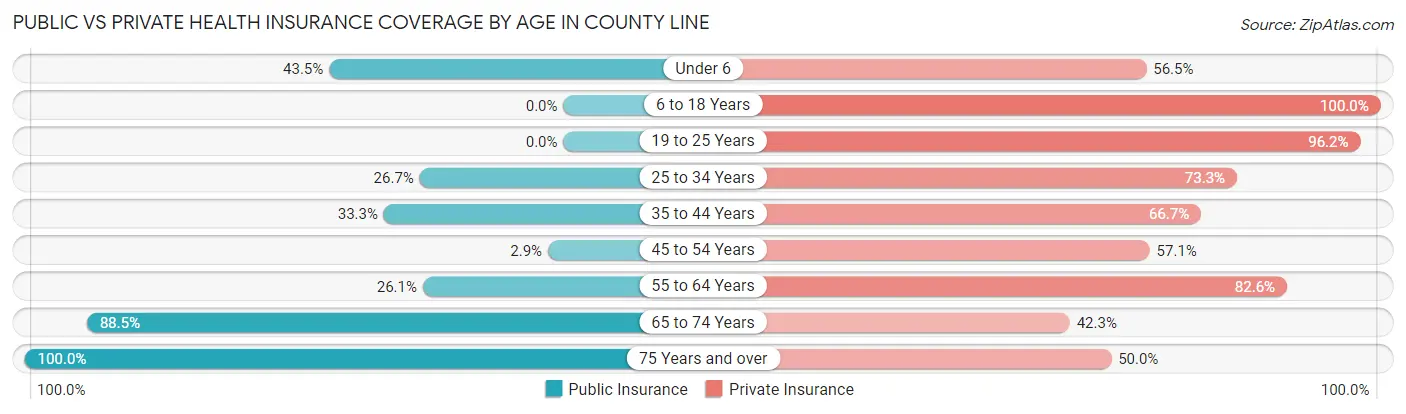
| Age Bracket | Public Insurance | Private Insurance |
| Under 6 | 10 (43.5%) | 13 (56.5%) |
| 6 to 18 Years | 0 (0.0%) | 23 (100.0%) |
| 19 to 25 Years | 0 (0.0%) | 102 (96.2%) |
| 25 to 34 Years | 4 (26.7%) | 11 (73.3%) |
| 35 to 44 Years | 5 (33.3%) | 10 (66.7%) |
| 45 to 54 Years | 1 (2.9%) | 20 (57.1%) |
| 55 to 64 Years | 6 (26.1%) | 19 (82.6%) |
| 65 to 74 Years | 23 (88.5%) | 11 (42.3%) |
| 75 Years and over | 12 (100.0%) | 6 (50.0%) |
| Total | 61 (21.9%) | 215 (77.3%) |
Disability Status by Sex by Age in County Line
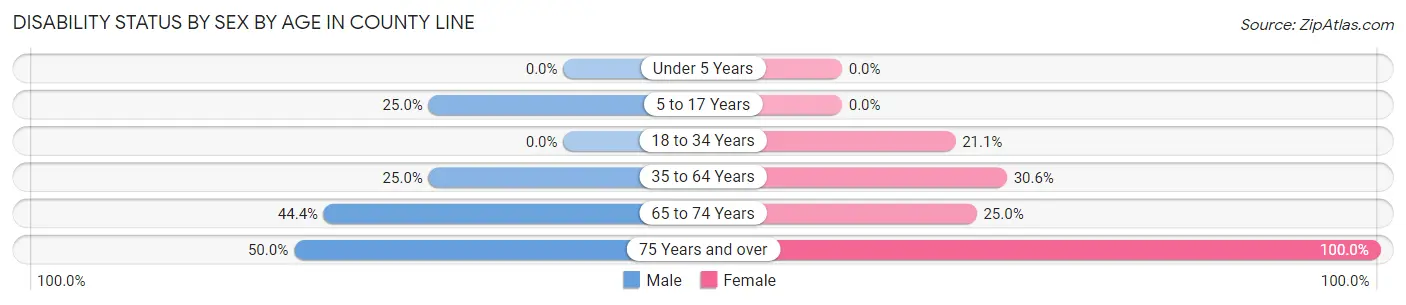
| Age Bracket | Male | Female |
| Under 5 Years | 0 (0.0%) | 0 (0.0%) |
| 5 to 17 Years | 3 (25.0%) | 0 (0.0%) |
| 18 to 34 Years | 0 (0.0%) | 4 (21.0%) |
| 35 to 64 Years | 6 (25.0%) | 15 (30.6%) |
| 65 to 74 Years | 8 (44.4%) | 2 (25.0%) |
| 75 Years and over | 2 (50.0%) | 8 (100.0%) |
Disability Class by Sex by Age in County Line
Disability Class: Hearing Difficulty
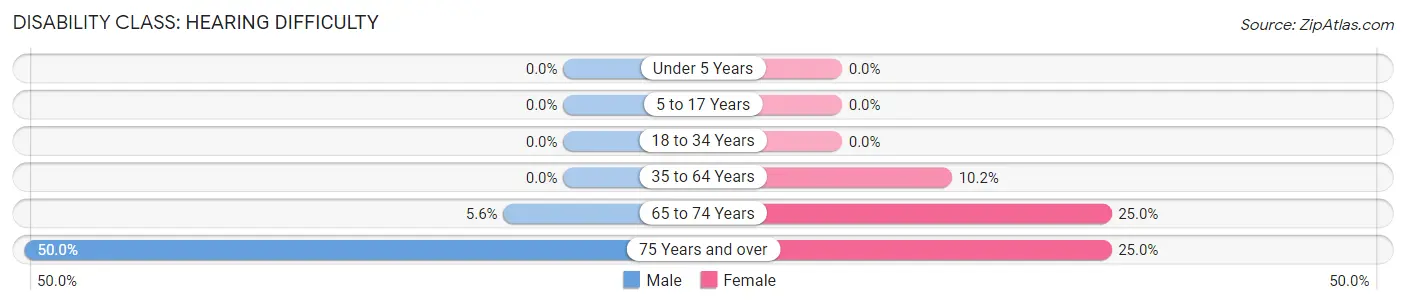
| Age Bracket | Male | Female |
| Under 5 Years | 0 (0.0%) | 0 (0.0%) |
| 5 to 17 Years | 0 (0.0%) | 0 (0.0%) |
| 18 to 34 Years | 0 (0.0%) | 0 (0.0%) |
| 35 to 64 Years | 0 (0.0%) | 5 (10.2%) |
| 65 to 74 Years | 1 (5.6%) | 2 (25.0%) |
| 75 Years and over | 2 (50.0%) | 2 (25.0%) |
Disability Class: Vision Difficulty
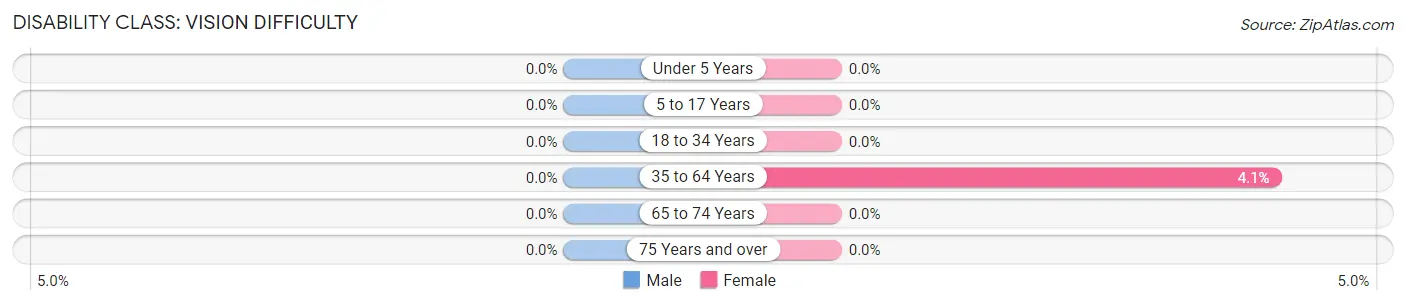
| Age Bracket | Male | Female |
| Under 5 Years | 0 (0.0%) | 0 (0.0%) |
| 5 to 17 Years | 0 (0.0%) | 0 (0.0%) |
| 18 to 34 Years | 0 (0.0%) | 0 (0.0%) |
| 35 to 64 Years | 0 (0.0%) | 2 (4.1%) |
| 65 to 74 Years | 0 (0.0%) | 0 (0.0%) |
| 75 Years and over | 0 (0.0%) | 0 (0.0%) |
Disability Class: Cognitive Difficulty
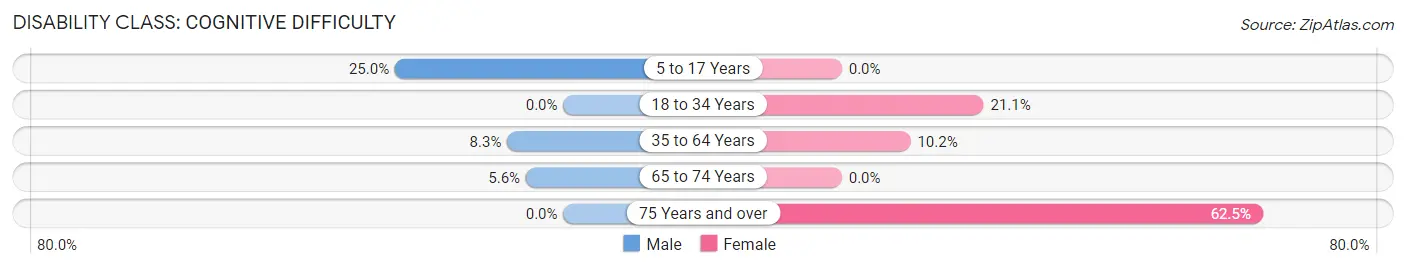
| Age Bracket | Male | Female |
| 5 to 17 Years | 3 (25.0%) | 0 (0.0%) |
| 18 to 34 Years | 0 (0.0%) | 4 (21.0%) |
| 35 to 64 Years | 2 (8.3%) | 5 (10.2%) |
| 65 to 74 Years | 1 (5.6%) | 0 (0.0%) |
| 75 Years and over | 0 (0.0%) | 5 (62.5%) |
Disability Class: Ambulatory Difficulty
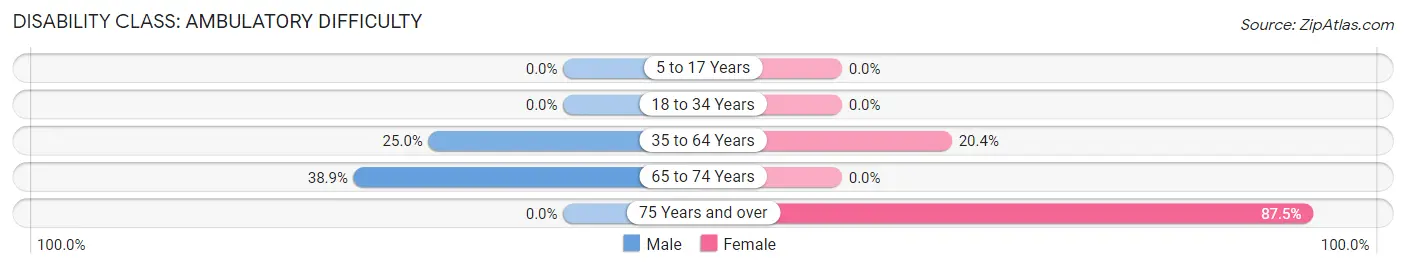
| Age Bracket | Male | Female |
| 5 to 17 Years | 0 (0.0%) | 0 (0.0%) |
| 18 to 34 Years | 0 (0.0%) | 0 (0.0%) |
| 35 to 64 Years | 6 (25.0%) | 10 (20.4%) |
| 65 to 74 Years | 7 (38.9%) | 0 (0.0%) |
| 75 Years and over | 0 (0.0%) | 7 (87.5%) |
Disability Class: Self-Care Difficulty
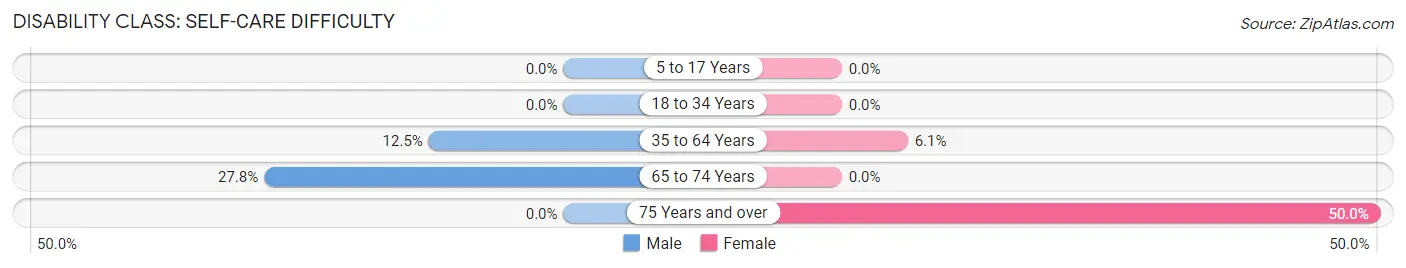
| Age Bracket | Male | Female |
| 5 to 17 Years | 0 (0.0%) | 0 (0.0%) |
| 18 to 34 Years | 0 (0.0%) | 0 (0.0%) |
| 35 to 64 Years | 3 (12.5%) | 3 (6.1%) |
| 65 to 74 Years | 5 (27.8%) | 0 (0.0%) |
| 75 Years and over | 0 (0.0%) | 4 (50.0%) |
Technology Access in County Line
Computing Device Access in County Line
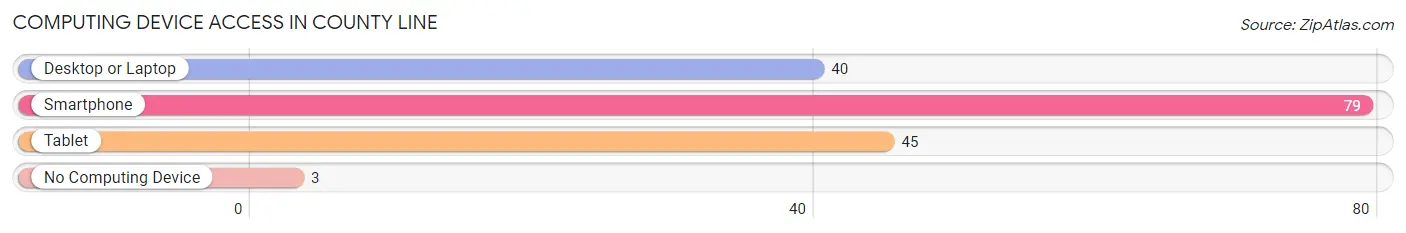
| Device Type | # Households | % Households |
| Desktop or Laptop | 40 | 43.0% |
| Smartphone | 79 | 85.0% |
| Tablet | 45 | 48.4% |
| No Computing Device | 3 | 3.2% |
| Total | 93 | 100.0% |
Internet Access in County Line
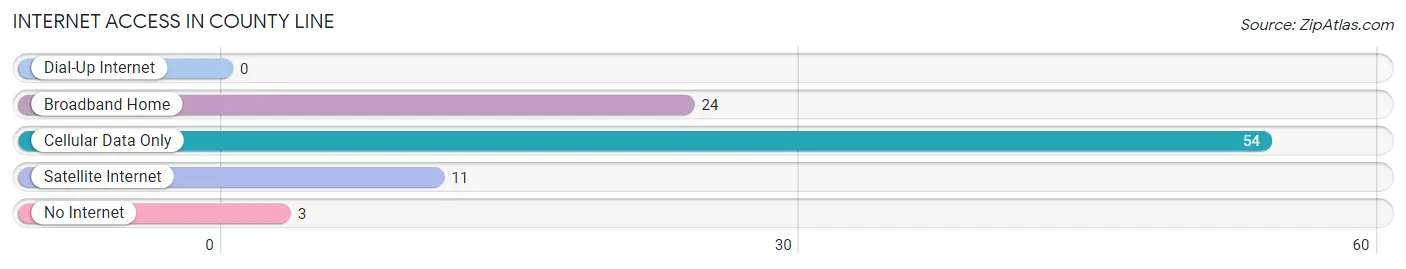
| Internet Type | # Households | % Households |
| Dial-Up Internet | 0 | 0.0% |
| Broadband Home | 24 | 25.8% |
| Cellular Data Only | 54 | 58.1% |
| Satellite Internet | 11 | 11.8% |
| No Internet | 3 | 3.2% |
| Total | 93 | 100.0% |
County Line Summary
County Line is an unincorporated community located in the northwest corner of Madison County, Alabama. It is situated along the Tennessee River, just south of the Tennessee state line. The community is part of the Huntsville-Decatur Combined Statistical Area.
History
The area that is now County Line was first settled in the early 1800s by settlers from Tennessee. The community was originally known as "Crossroads" due to its location at the intersection of two major roads. In 1818, the area was officially recognized as a post office and the name was changed to County Line.
The community was a popular stop for travelers and traders, and it soon became a thriving center of commerce. In 1820, the first store was opened in County Line and the first school was established in 1825. The community continued to grow and by the mid-1800s, it had become a major hub for the cotton and tobacco industries.
Geography
County Line is located in the northwest corner of Madison County, Alabama. It is situated along the Tennessee River, just south of the Tennessee state line. The community is part of the Huntsville-Decatur Combined Statistical Area.
The area is mostly rural, with rolling hills and wooded areas. The terrain is mostly flat, with some areas of higher elevation. The climate is mild, with hot summers and mild winters.
Economy
The economy of County Line is largely based on agriculture. The area is known for its production of cotton, tobacco, and other crops. Livestock production is also important to the local economy.
In addition to agriculture, County Line is home to several small businesses, including restaurants, convenience stores, and auto repair shops. The community is also home to a number of manufacturing companies, including a furniture factory and a plastics plant.
Demographics
As of the 2010 census, the population of County Line was 1,845. The racial makeup of the community was 97.3% White, 0.7% African American, 0.3% Native American, 0.2% Asian, and 1.5% from other races.
The median household income in County Line was $37,917, and the median family income was $45,938. The per capita income was $19,945. About 11.3% of families and 14.2% of the population were below the poverty line.
Conclusion
County Line is a small, rural community located in the northwest corner of Madison County, Alabama. It is situated along the Tennessee River, just south of the Tennessee state line. The community is part of the Huntsville-Decatur Combined Statistical Area. The economy of County Line is largely based on agriculture, with some small businesses and manufacturing companies. The population of County Line was 1,845 as of the 2010 census, with a median household income of $37,917.
Common Questions
What is the Total Population of County Line?
Total Population of County Line is 278.
What is the Total Male Population of County Line?
Total Male Population of County Line is 179.
What is the Total Female Population of County Line?
Total Female Population of County Line is 99.
What is the Ratio of Males per 100 Females in County Line?
There are 180.81 Males per 100 Females in County Line.
What is the Ratio of Females per 100 Males in County Line?
There are 55.31 Females per 100 Males in County Line.
What is the Median Population Age in County Line?
Median Population Age in County Line is 25.9 Years.
What is the Average Family Size in County Line
Average Family Size in County Line is 3.1 People.
What is the Average Household Size in County Line
Average Household Size in County Line is 3.0 People.
What is Per Capita Income in County Line?
Per Capita income in County Line is $34,749.
What is the Median Family Income in County Line?
Median Family Income in County Line is $52,188.
What is the Median Household income in County Line?
Median Household Income in County Line is $85,625.
What is Income or Wage Gap in County Line?
Income or Wage Gap in County Line is 52.1%.
Women in County Line earn 47.9 cents for every dollar earned by a man.
What is Inequality or Gini Index in County Line?
Inequality or Gini Index in County Line is 0.28.
How Large is the Labor Force in County Line?
There are 161 People in the Labor Forcein in County Line.
What is the Percentage of People in the Labor Force in County Line?
67.4% of People are in the Labor Force in County Line.