Chickasaw, AL
Chickasaw Map
Chickasaw Overview
6,398
TOTAL POPULATION
3,177
MALE POPULATION
3,221
FEMALE POPULATION
98.63
MALES / 100 FEMALES
101.38
FEMALES / 100 MALES
33.3
MEDIAN AGE
3.5
AVG FAMILY SIZE
2.7
AVG HOUSEHOLD SIZE
$21,426
PER CAPITA INCOME
$49,189
AVG FAMILY INCOME
$38,985
AVG HOUSEHOLD INCOME
24.0%
WAGE / INCOME GAP [ % ]
76.0¢/ $1
WAGE / INCOME GAP [ $ ]
0.48
INEQUALITY / GINI INDEX
2,865
LABOR FORCE [ PEOPLE ]
59.2%
PERCENT IN LABOR FORCE
4.7%
UNEMPLOYMENT RATE
Chickasaw Area Codes
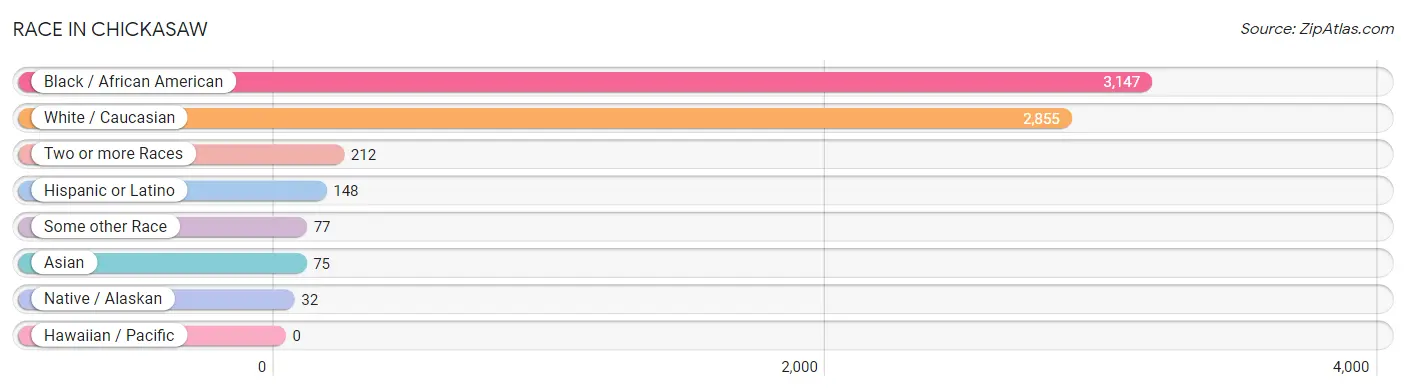
Race in Chickasaw
The most populous races in Chickasaw are Black / African American (3,147 | 49.2%), White / Caucasian (2,855 | 44.6%), and Two or more Races (212 | 3.3%).
| Race | # Population | % Population |
| Asian | 75 | 1.2% |
| Black / African American | 3,147 | 49.2% |
| Hawaiian / Pacific | 0 | 0.0% |
| Hispanic or Latino | 148 | 2.3% |
| Native / Alaskan | 32 | 0.5% |
| White / Caucasian | 2,855 | 44.6% |
| Two or more Races | 212 | 3.3% |
| Some other Race | 77 | 1.2% |
| Total | 6,398 | 100.0% |
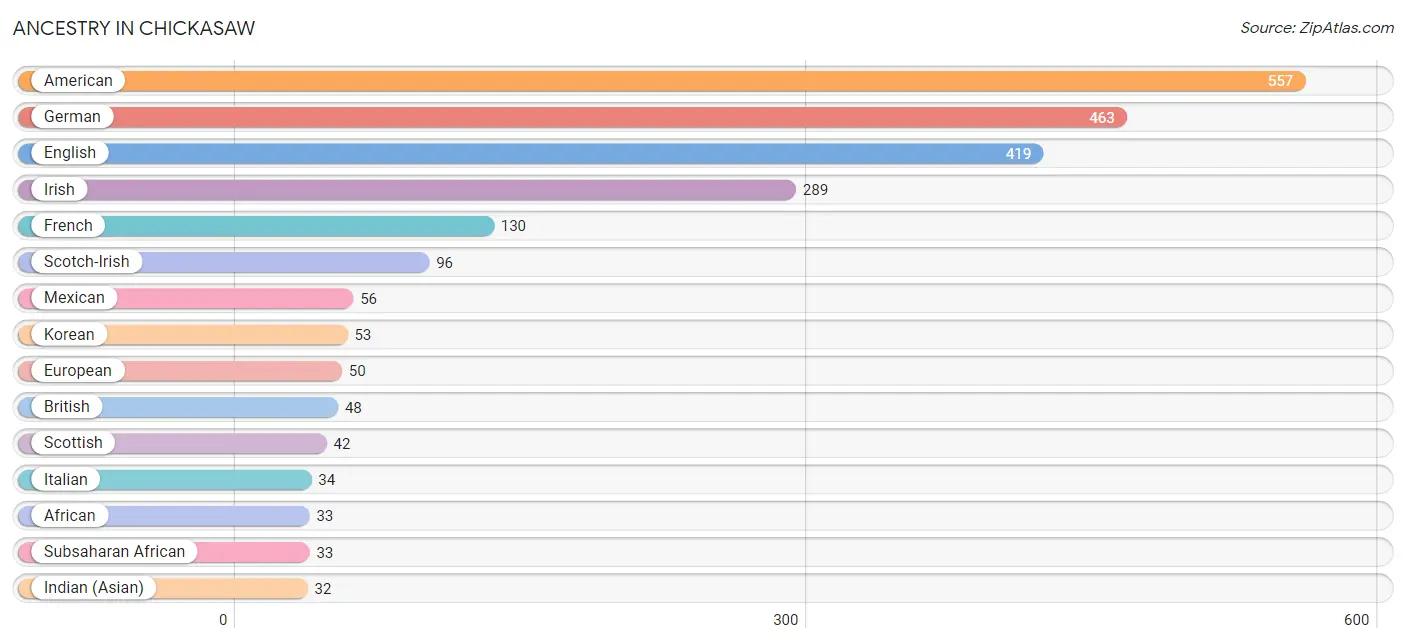
Ancestry in Chickasaw
The most populous ancestries reported in Chickasaw are American (557 | 8.7%), German (463 | 7.2%), English (419 | 6.6%), Irish (289 | 4.5%), and French (130 | 2.0%), together accounting for 29.0% of all Chickasaw residents.
| Ancestry | # Population | % Population |
| African | 33 | 0.5% |
| American | 557 | 8.7% |
| Austrian | 20 | 0.3% |
| Blackfeet | 20 | 0.3% |
| British | 48 | 0.7% |
| Canadian | 6 | 0.1% |
| Central American | 30 | 0.5% |
| Cherokee | 4 | 0.1% |
| Choctaw | 25 | 0.4% |
| Creek | 13 | 0.2% |
| Danish | 5 | 0.1% |
| Dutch | 14 | 0.2% |
| Ecuadorian | 7 | 0.1% |
| English | 419 | 6.6% |
| European | 50 | 0.8% |
| French | 130 | 2.0% |
| German | 463 | 7.2% |
| Greek | 20 | 0.3% |
| Guatemalan | 30 | 0.5% |
| Hungarian | 22 | 0.3% |
| Indian (Asian) | 32 | 0.5% |
| Irish | 289 | 4.5% |
| Italian | 34 | 0.5% |
| Jamaican | 11 | 0.2% |
| Korean | 53 | 0.8% |
| Mexican | 56 | 0.9% |
| Nigerian | 4 | 0.1% |
| Polish | 16 | 0.3% |
| Puerto Rican | 14 | 0.2% |
| Romanian | 7 | 0.1% |
| Scandinavian | 2 | 0.0% |
| Scotch-Irish | 96 | 1.5% |
| Scottish | 42 | 0.7% |
| South American | 7 | 0.1% |
| Subsaharan African | 33 | 0.5% |
| Swedish | 8 | 0.1% |
| Welsh | 6 | 0.1% |
| Yugoslavian | 6 | 0.1% | View All 38 Rows |
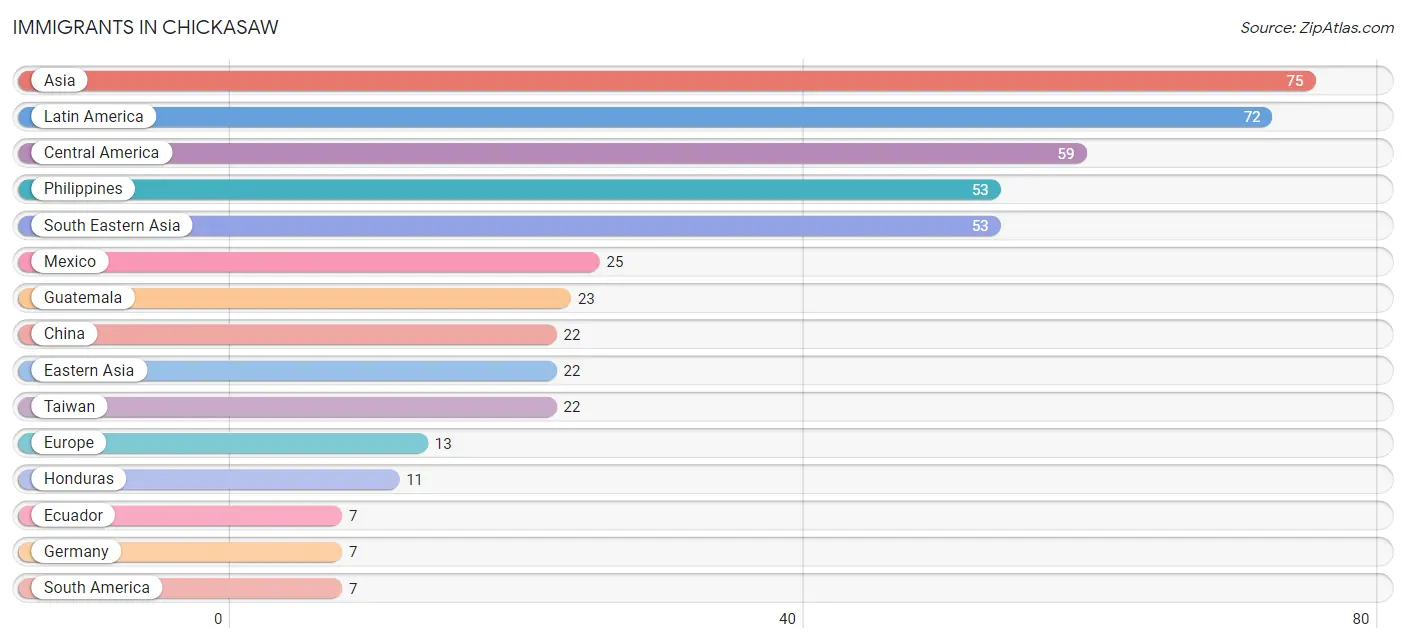
Immigrants in Chickasaw
The most numerous immigrant groups reported in Chickasaw came from Asia (75 | 1.2%), Latin America (72 | 1.1%), Central America (59 | 0.9%), Philippines (53 | 0.8%), and South Eastern Asia (53 | 0.8%), together accounting for 4.9% of all Chickasaw residents.
| Immigration Origin | # Population | % Population |
| Asia | 75 | 1.2% |
| Bosnia and Herzegovina | 6 | 0.1% |
| Canada | 6 | 0.1% |
| Caribbean | 6 | 0.1% |
| Central America | 59 | 0.9% |
| China | 22 | 0.3% |
| Eastern Asia | 22 | 0.3% |
| Eastern Europe | 6 | 0.1% |
| Ecuador | 7 | 0.1% |
| Europe | 13 | 0.2% |
| Germany | 7 | 0.1% |
| Guatemala | 23 | 0.4% |
| Honduras | 11 | 0.2% |
| Jamaica | 6 | 0.1% |
| Latin America | 72 | 1.1% |
| Mexico | 25 | 0.4% |
| Philippines | 53 | 0.8% |
| South America | 7 | 0.1% |
| South Eastern Asia | 53 | 0.8% |
| Taiwan | 22 | 0.3% |
| Western Europe | 7 | 0.1% | View All 21 Rows |
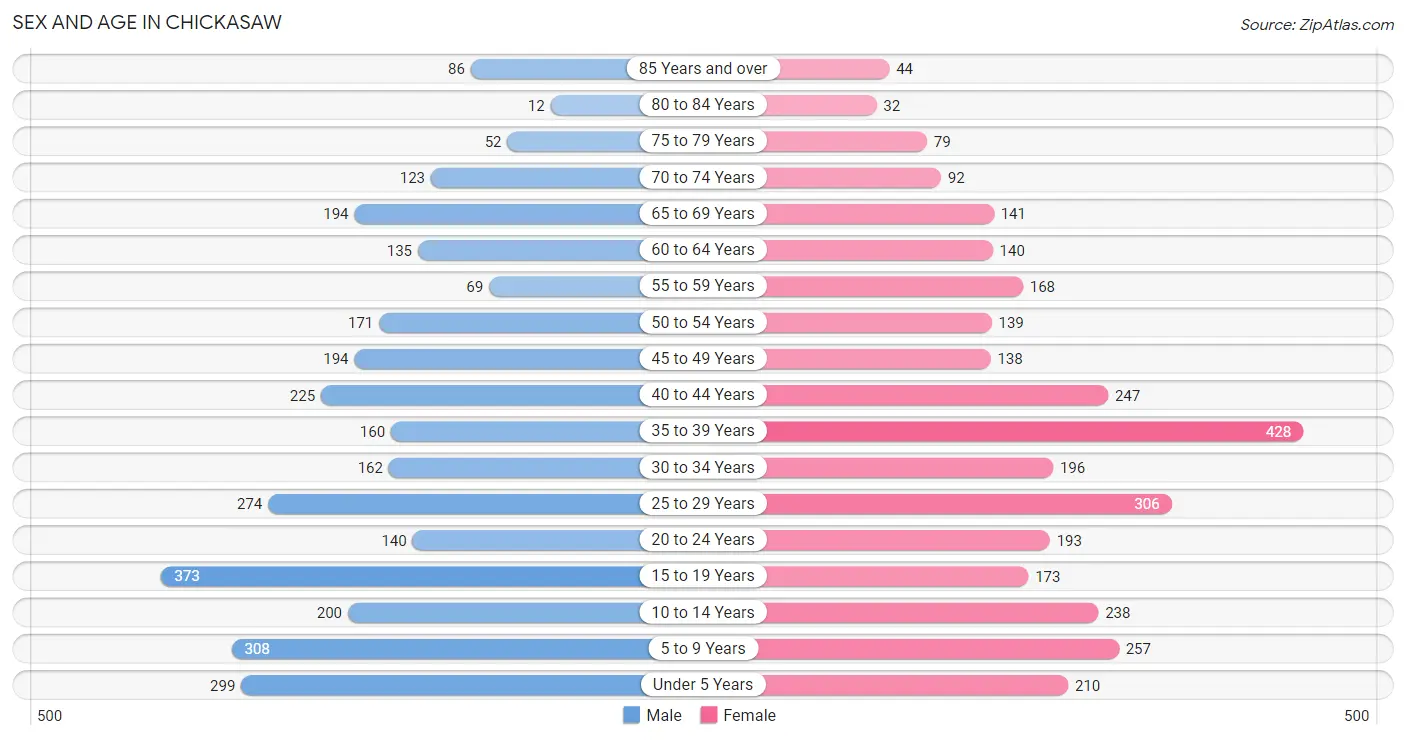
Sex and Age in Chickasaw
Sex and Age in Chickasaw
The most populous age groups in Chickasaw are 15 to 19 Years (373 | 11.7%) for men and 35 to 39 Years (428 | 13.3%) for women.
| Age Bracket | Male | Female |
| Under 5 Years | 299 (9.4%) | 210 (6.5%) |
| 5 to 9 Years | 308 (9.7%) | 257 (8.0%) |
| 10 to 14 Years | 200 (6.3%) | 238 (7.4%) |
| 15 to 19 Years | 373 (11.7%) | 173 (5.4%) |
| 20 to 24 Years | 140 (4.4%) | 193 (6.0%) |
| 25 to 29 Years | 274 (8.6%) | 306 (9.5%) |
| 30 to 34 Years | 162 (5.1%) | 196 (6.1%) |
| 35 to 39 Years | 160 (5.0%) | 428 (13.3%) |
| 40 to 44 Years | 225 (7.1%) | 247 (7.7%) |
| 45 to 49 Years | 194 (6.1%) | 138 (4.3%) |
| 50 to 54 Years | 171 (5.4%) | 139 (4.3%) |
| 55 to 59 Years | 69 (2.2%) | 168 (5.2%) |
| 60 to 64 Years | 135 (4.3%) | 140 (4.3%) |
| 65 to 69 Years | 194 (6.1%) | 141 (4.4%) |
| 70 to 74 Years | 123 (3.9%) | 92 (2.9%) |
| 75 to 79 Years | 52 (1.6%) | 79 (2.5%) |
| 80 to 84 Years | 12 (0.4%) | 32 (1.0%) |
| 85 Years and over | 86 (2.7%) | 44 (1.4%) |
| Total | 3,177 (100.0%) | 3,221 (100.0%) |
Families and Households in Chickasaw
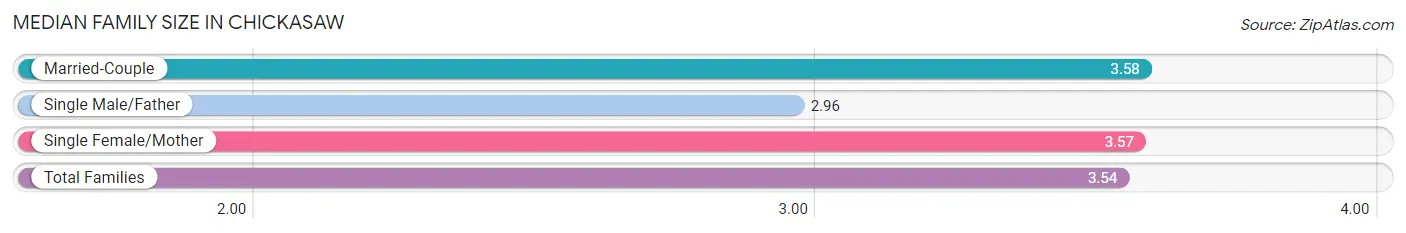
Median Family Size in Chickasaw
The median family size in Chickasaw is 3.54 persons per family, with married-couple families (744 | 53.4%) accounting for the largest median family size of 3.58 persons per family. On the other hand, single male/father families (93 | 6.7%) represent the smallest median family size with 2.96 persons per family.
| Family Type | # Families | Family Size |
| Married-Couple | 744 (53.4%) | 3.58 |
| Single Male/Father | 93 (6.7%) | 2.96 |
| Single Female/Mother | 557 (40.0%) | 3.57 |
| Total Families | 1,394 (100.0%) | 3.54 |
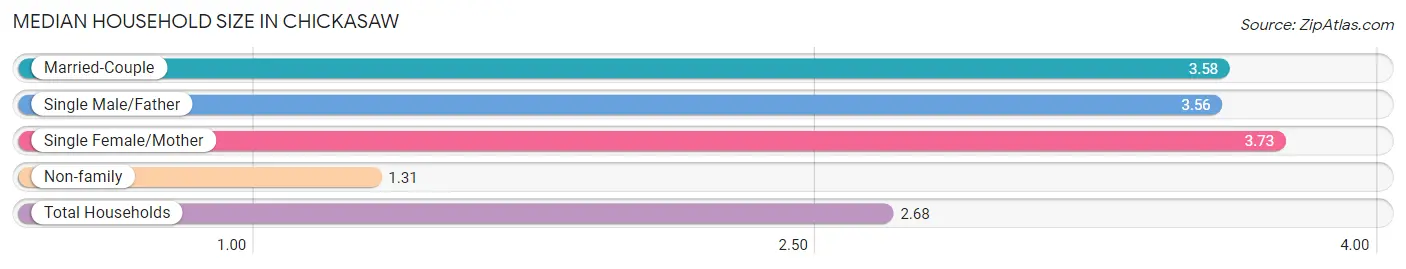
Median Household Size in Chickasaw
The median household size in Chickasaw is 2.68 persons per household, with single female/mother households (557 | 23.4%) accounting for the largest median household size of 3.73 persons per household. non-family households (985 | 41.4%) represent the smallest median household size with 1.31 persons per household.
| Household Type | # Households | Household Size |
| Married-Couple | 744 (31.3%) | 3.58 |
| Single Male/Father | 93 (3.9%) | 3.56 |
| Single Female/Mother | 557 (23.4%) | 3.73 |
| Non-family | 985 (41.4%) | 1.31 |
| Total Households | 2,379 (100.0%) | 2.68 |
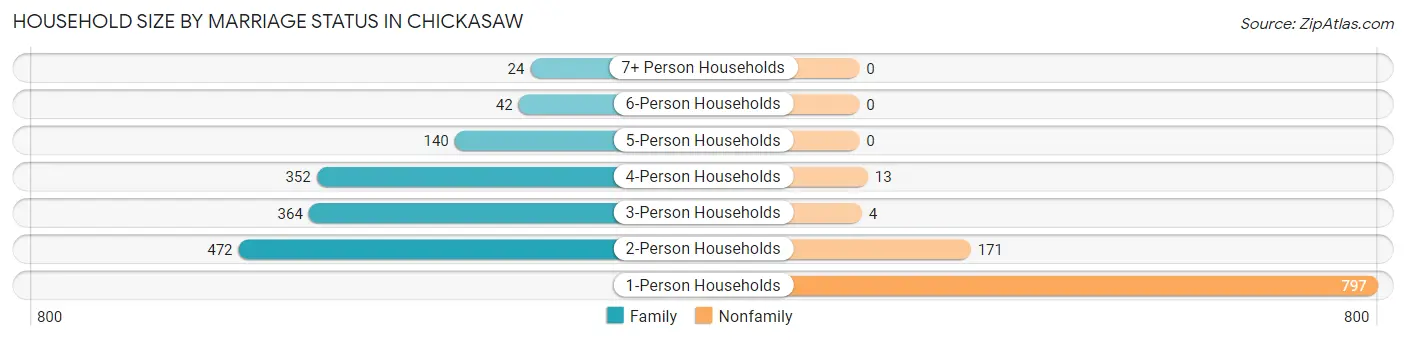
Household Size by Marriage Status in Chickasaw
Out of a total of 2,379 households in Chickasaw, 1,394 (58.6%) are family households, while 985 (41.4%) are nonfamily households. The most numerous type of family households are 2-person households, comprising 472, and the most common type of nonfamily households are 1-person households, comprising 797.
| Household Size | Family Households | Nonfamily Households |
| 1-Person Households | - | 797 (33.5%) |
| 2-Person Households | 472 (19.8%) | 171 (7.2%) |
| 3-Person Households | 364 (15.3%) | 4 (0.2%) |
| 4-Person Households | 352 (14.8%) | 13 (0.5%) |
| 5-Person Households | 140 (5.9%) | 0 (0.0%) |
| 6-Person Households | 42 (1.8%) | 0 (0.0%) |
| 7+ Person Households | 24 (1.0%) | 0 (0.0%) |
| Total | 1,394 (58.6%) | 985 (41.4%) |
Female Fertility in Chickasaw
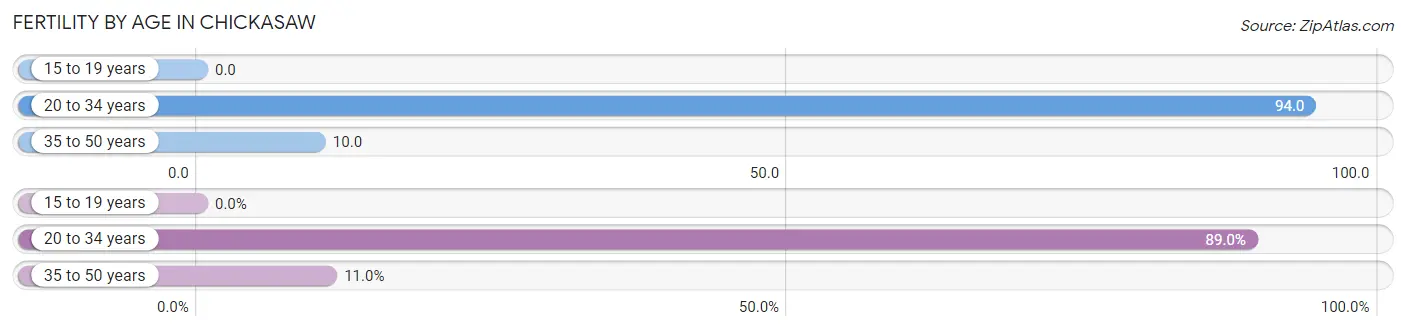
Fertility by Age in Chickasaw
Average fertility rate in Chickasaw is 43.0 births per 1,000 women. Women in the age bracket of 20 to 34 years have the highest fertility rate with 94.0 births per 1,000 women. Women in the age bracket of 20 to 34 years acount for 89.0% of all women with births.
| Age Bracket | Women with Births | Births / 1,000 Women |
| 15 to 19 years | 0 (0.0%) | 0.0 |
| 20 to 34 years | 65 (89.0%) | 94.0 |
| 35 to 50 years | 8 (11.0%) | 10.0 |
| Total | 73 (100.0%) | 43.0 |
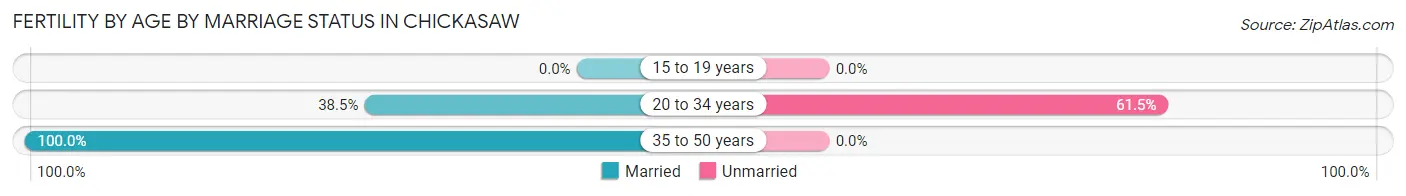
Fertility by Age by Marriage Status in Chickasaw
45.2% of women with births (73) in Chickasaw are married. The highest percentage of unmarried women with births falls into 20 to 34 years age bracket with 61.5% of them unmarried at the time of birth, while the lowest percentage of unmarried women with births belong to 35 to 50 years age bracket with 0.0% of them unmarried.
| Age Bracket | Married | Unmarried |
| 15 to 19 years | 0 (0.0%) | 0 (0.0%) |
| 20 to 34 years | 25 (38.5%) | 40 (61.5%) |
| 35 to 50 years | 8 (100.0%) | 0 (0.0%) |
| Total | 33 (45.2%) | 40 (54.8%) |
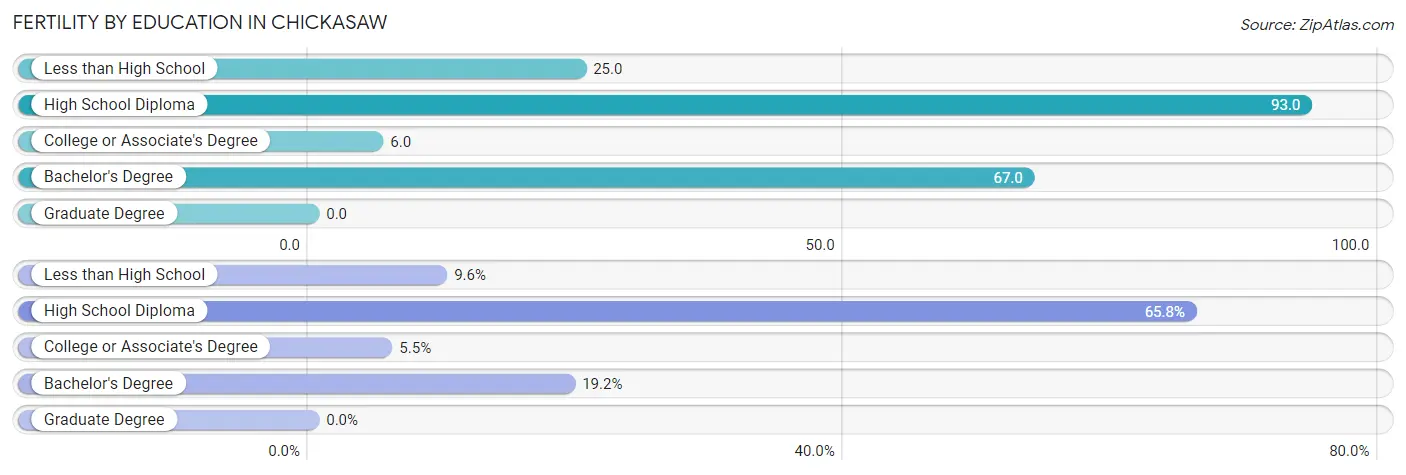
Fertility by Education in Chickasaw
| Educational Attainment | Women with Births | Births / 1,000 Women |
| Less than High School | 7 (9.6%) | 25.0 |
| High School Diploma | 48 (65.7%) | 93.0 |
| College or Associate's Degree | 4 (5.5%) | 6.0 |
| Bachelor's Degree | 14 (19.2%) | 67.0 |
| Graduate Degree | 0 (0.0%) | 0.0 |
| Total | 73 (100.0%) | 43.0 |
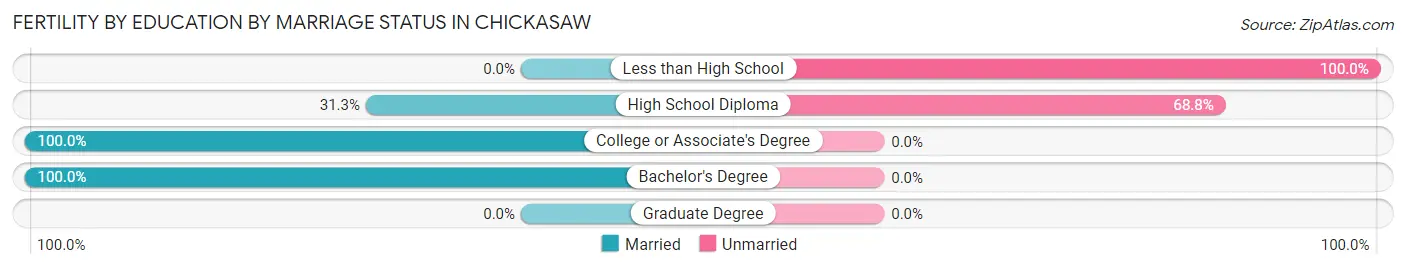
Fertility by Education by Marriage Status in Chickasaw
54.8% of women with births in Chickasaw are unmarried. Women with the educational attainment of college or associate's degree are most likely to be married with 100.0% of them married at childbirth, while women with the educational attainment of less than high school are least likely to be married with 100.0% of them unmarried at childbirth.
| Educational Attainment | Married | Unmarried |
| Less than High School | 0 (0.0%) | 7 (100.0%) |
| High School Diploma | 15 (31.2%) | 33 (68.8%) |
| College or Associate's Degree | 4 (100.0%) | 0 (0.0%) |
| Bachelor's Degree | 14 (100.0%) | 0 (0.0%) |
| Graduate Degree | 0 (0.0%) | 0 (0.0%) |
| Total | 33 (45.2%) | 40 (54.8%) |
Income in Chickasaw
Income Overview in Chickasaw
Per Capita Income in Chickasaw is $21,426, while median incomes of families and households are $49,189 and $38,985 respectively.
| Characteristic | Number | Measure |
| Per Capita Income | 6,398 | $21,426 |
| Median Family Income | 1,394 | $49,189 |
| Mean Family Income | 1,394 | $63,958 |
| Median Household Income | 2,379 | $38,985 |
| Mean Household Income | 2,379 | $52,844 |
| Income Deficit | 1,394 | $0 |
| Wage / Income Gap (%) | 6,398 | 24.01% |
| Wage / Income Gap ($) | 6,398 | 75.99¢ per $1 |
| Gini / Inequality Index | 6,398 | 0.48 |
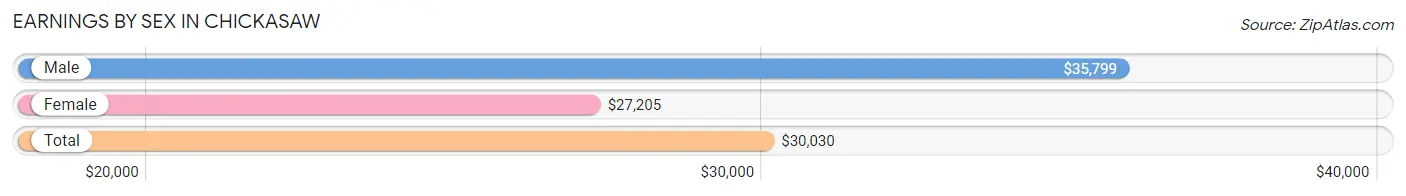
Earnings by Sex in Chickasaw
Average Earnings in Chickasaw are $30,030, $35,799 for men and $27,205 for women, a difference of 24.0%.
| Sex | Number | Average Earnings |
| Male | 1,388 (48.1%) | $35,799 |
| Female | 1,497 (51.9%) | $27,205 |
| Total | 2,885 (100.0%) | $30,030 |
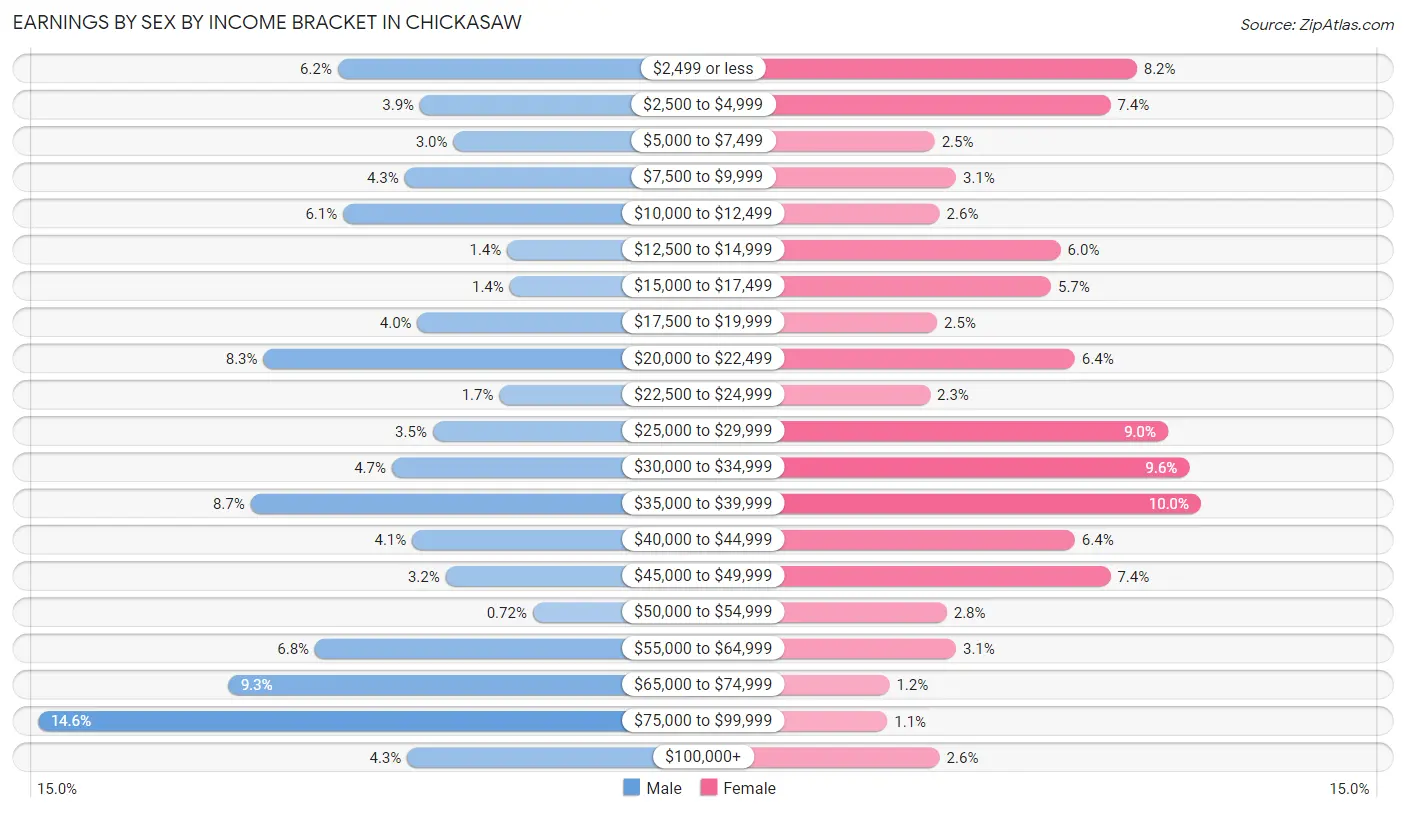
Earnings by Sex by Income Bracket in Chickasaw
The most common earnings brackets in Chickasaw are $75,000 to $99,999 for men (203 | 14.6%) and $35,000 to $39,999 for women (149 | 10.0%).
| Income | Male | Female |
| $2,499 or less | 86 (6.2%) | 122 (8.2%) |
| $2,500 to $4,999 | 54 (3.9%) | 111 (7.4%) |
| $5,000 to $7,499 | 41 (2.9%) | 37 (2.5%) |
| $7,500 to $9,999 | 60 (4.3%) | 46 (3.1%) |
| $10,000 to $12,499 | 84 (6.0%) | 39 (2.6%) |
| $12,500 to $14,999 | 20 (1.4%) | 90 (6.0%) |
| $15,000 to $17,499 | 19 (1.4%) | 86 (5.7%) |
| $17,500 to $19,999 | 55 (4.0%) | 38 (2.5%) |
| $20,000 to $22,499 | 115 (8.3%) | 96 (6.4%) |
| $22,500 to $24,999 | 23 (1.7%) | 35 (2.3%) |
| $25,000 to $29,999 | 49 (3.5%) | 135 (9.0%) |
| $30,000 to $34,999 | 65 (4.7%) | 144 (9.6%) |
| $35,000 to $39,999 | 120 (8.6%) | 149 (10.0%) |
| $40,000 to $44,999 | 57 (4.1%) | 96 (6.4%) |
| $45,000 to $49,999 | 44 (3.2%) | 111 (7.4%) |
| $50,000 to $54,999 | 10 (0.7%) | 42 (2.8%) |
| $55,000 to $64,999 | 95 (6.8%) | 46 (3.1%) |
| $65,000 to $74,999 | 129 (9.3%) | 18 (1.2%) |
| $75,000 to $99,999 | 203 (14.6%) | 17 (1.1%) |
| $100,000+ | 59 (4.3%) | 39 (2.6%) |
| Total | 1,388 (100.0%) | 1,497 (100.0%) |
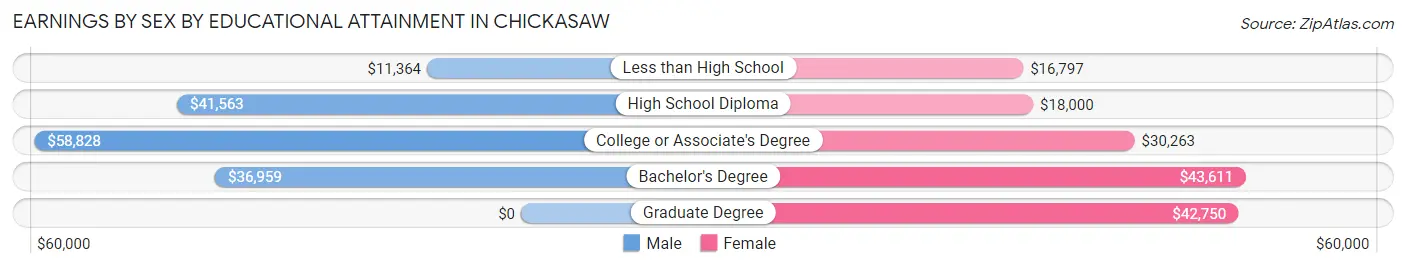
Earnings by Sex by Educational Attainment in Chickasaw
Average earnings in Chickasaw are $41,094 for men and $29,606 for women, a difference of 28.0%. Men with an educational attainment of college or associate's degree enjoy the highest average annual earnings of $58,828, while those with less than high school education earn the least with $11,364. Women with an educational attainment of bachelor's degree earn the most with the average annual earnings of $43,611, while those with less than high school education have the smallest earnings of $16,797.
| Educational Attainment | Male Income | Female Income |
| Less than High School | $11,364 | $16,797 |
| High School Diploma | $41,563 | $18,000 |
| College or Associate's Degree | $58,828 | $30,263 |
| Bachelor's Degree | $36,959 | $43,611 |
| Graduate Degree | - | - |
| Total | $41,094 | $29,606 |
Family Income in Chickasaw
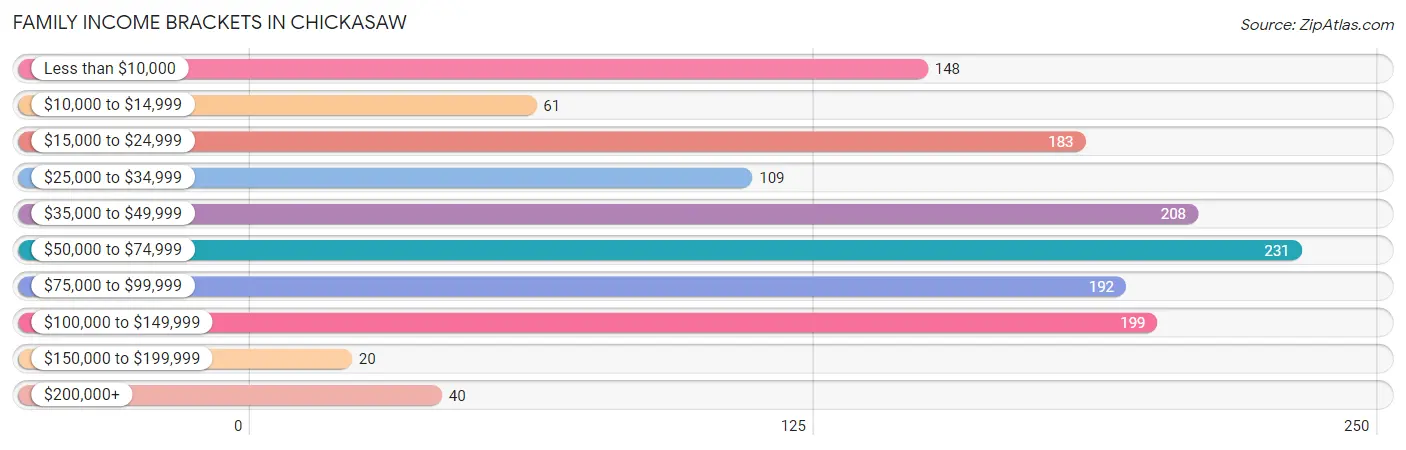
Family Income Brackets in Chickasaw
According to the Chickasaw family income data, there are 231 families falling into the $50,000 to $74,999 income range, which is the most common income bracket and makes up 16.6% of all families. Conversely, the $150,000 to $199,999 income bracket is the least frequent group with only 20 families (1.4%) belonging to this category.
| Income Bracket | # Families | % Families |
| Less than $10,000 | 148 | 10.6% |
| $10,000 to $14,999 | 61 | 4.4% |
| $15,000 to $24,999 | 183 | 13.1% |
| $25,000 to $34,999 | 109 | 7.8% |
| $35,000 to $49,999 | 208 | 14.9% |
| $50,000 to $74,999 | 231 | 16.6% |
| $75,000 to $99,999 | 192 | 13.8% |
| $100,000 to $149,999 | 199 | 14.3% |
| $150,000 to $199,999 | 20 | 1.4% |
| $200,000+ | 40 | 2.9% |
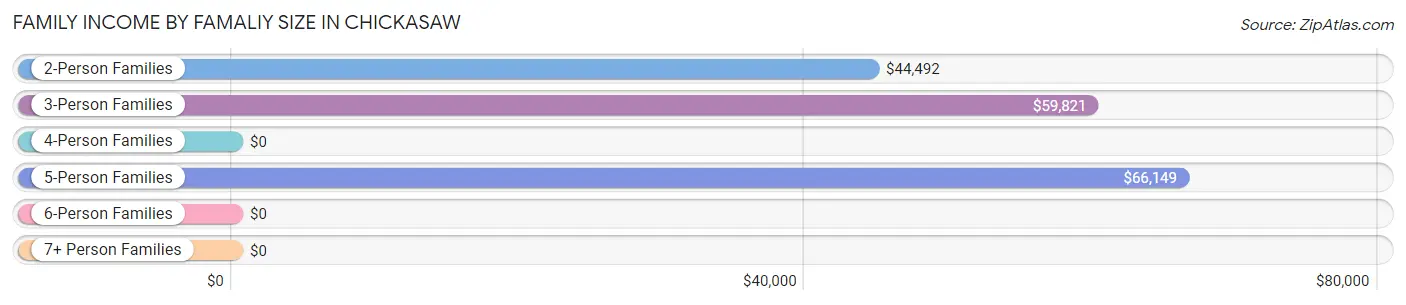
Family Income by Famaliy Size in Chickasaw
5-person families (116 | 8.3%) account for the highest median family income in Chickasaw with $66,149 per family, while 2-person families (503 | 36.1%) have the highest median income of $22,246 per family member.
| Income Bracket | # Families | Median Income |
| 2-Person Families | 503 (36.1%) | $44,492 |
| 3-Person Families | 395 (28.3%) | $59,821 |
| 4-Person Families | 314 (22.5%) | $0 |
| 5-Person Families | 116 (8.3%) | $66,149 |
| 6-Person Families | 42 (3.0%) | $0 |
| 7+ Person Families | 24 (1.7%) | $0 |
| Total | 1,394 (100.0%) | $49,189 |
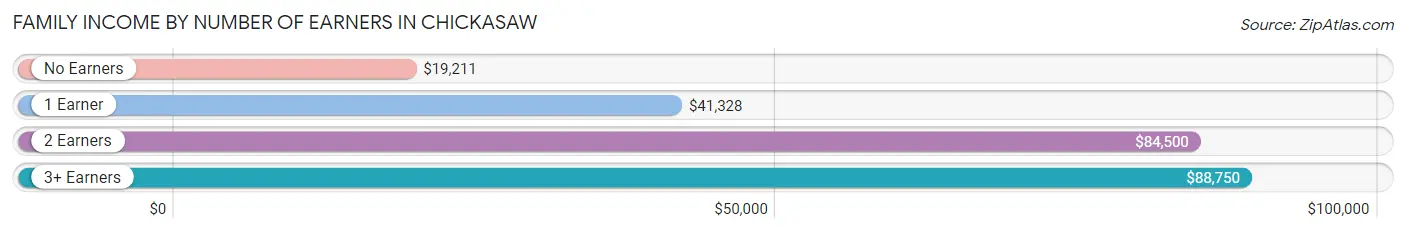
Family Income by Number of Earners in Chickasaw
The median family income in Chickasaw is $49,189, with families comprising 3+ earners (87) having the highest median family income of $88,750, while families with no earners (232) have the lowest median family income of $19,211, accounting for 6.2% and 16.6% of families, respectively.
| Number of Earners | # Families | Median Income |
| No Earners | 232 (16.6%) | $19,211 |
| 1 Earner | 593 (42.5%) | $41,328 |
| 2 Earners | 482 (34.6%) | $84,500 |
| 3+ Earners | 87 (6.2%) | $88,750 |
| Total | 1,394 (100.0%) | $49,189 |
Household Income in Chickasaw
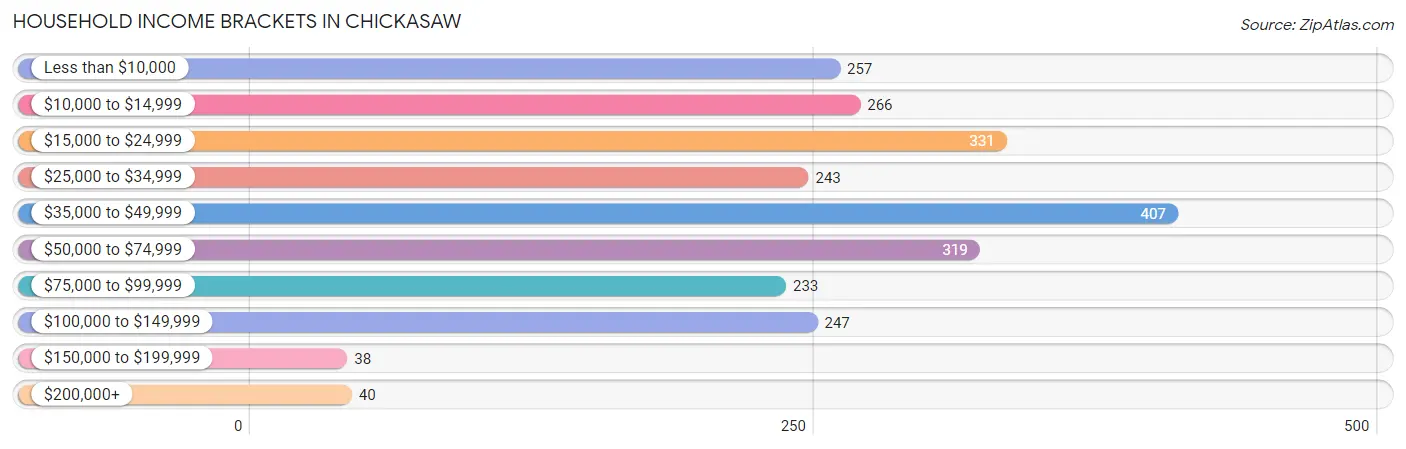
Household Income Brackets in Chickasaw
With 407 households falling in the category, the $35,000 to $49,999 income range is the most frequent in Chickasaw, accounting for 17.1% of all households. In contrast, only 38 households (1.6%) fall into the $150,000 to $199,999 income bracket, making it the least populous group.
| Income Bracket | # Households | % Households |
| Less than $10,000 | 257 | 10.8% |
| $10,000 to $14,999 | 266 | 11.2% |
| $15,000 to $24,999 | 331 | 13.9% |
| $25,000 to $34,999 | 243 | 10.2% |
| $35,000 to $49,999 | 407 | 17.1% |
| $50,000 to $74,999 | 319 | 13.4% |
| $75,000 to $99,999 | 233 | 9.8% |
| $100,000 to $149,999 | 247 | 10.4% |
| $150,000 to $199,999 | 38 | 1.6% |
| $200,000+ | 40 | 1.7% |
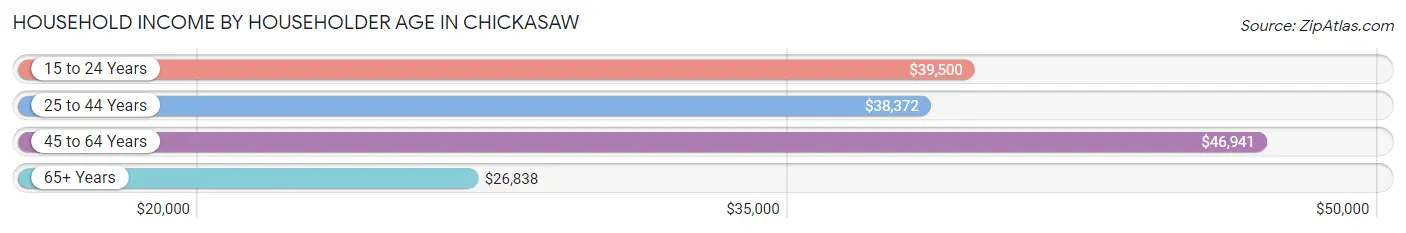
Household Income by Householder Age in Chickasaw
The median household income in Chickasaw is $38,985, with the highest median household income of $46,941 found in the 45 to 64 years age bracket for the primary householder. A total of 743 households (31.2%) fall into this category. Meanwhile, the 65+ years age bracket for the primary householder has the lowest median household income of $26,838, with 540 households (22.7%) in this group.
| Income Bracket | # Households | Median Income |
| 15 to 24 Years | 122 (5.1%) | $39,500 |
| 25 to 44 Years | 974 (40.9%) | $38,372 |
| 45 to 64 Years | 743 (31.2%) | $46,941 |
| 65+ Years | 540 (22.7%) | $26,838 |
| Total | 2,379 (100.0%) | $38,985 |
Poverty in Chickasaw
Income Below Poverty by Sex and Age in Chickasaw
With 30.1% poverty level for males and 32.9% for females among the residents of Chickasaw, 5 year old males and under 5 year old females are the most vulnerable to poverty, with 41 males (83.7%) and 128 females (61.0%) in their respective age groups living below the poverty level.
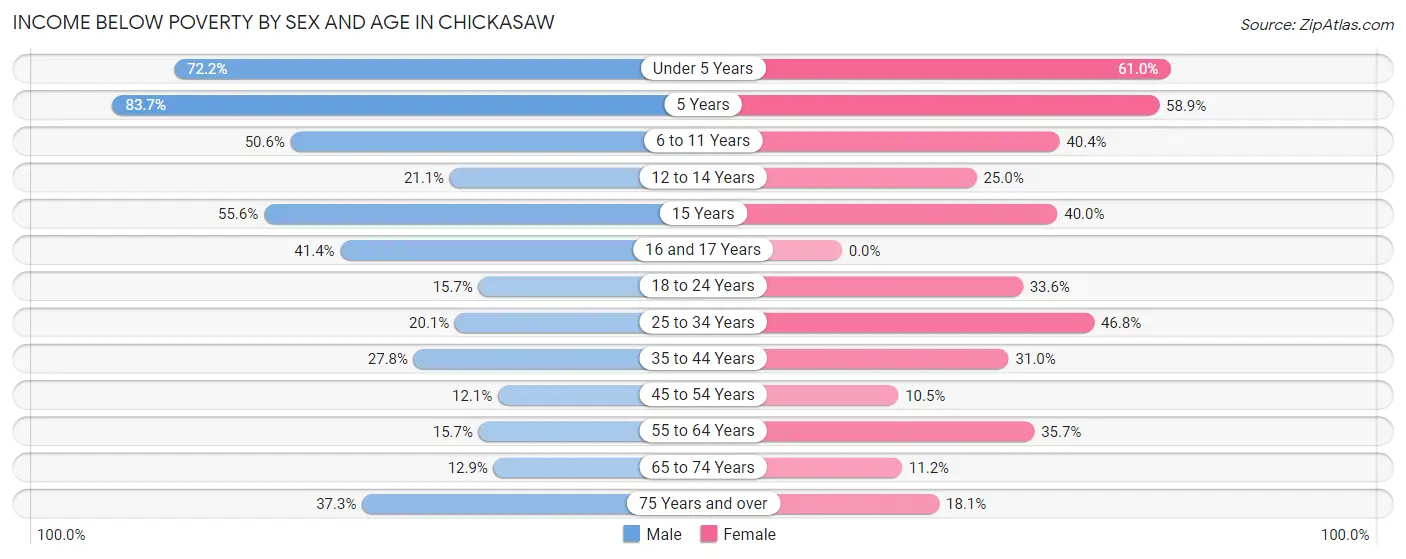
| Age Bracket | Male | Female |
| Under 5 Years | 216 (72.2%) | 128 (61.0%) |
| 5 Years | 41 (83.7%) | 43 (58.9%) |
| 6 to 11 Years | 165 (50.6%) | 122 (40.4%) |
| 12 to 14 Years | 28 (21.0%) | 28 (25.0%) |
| 15 Years | 15 (55.6%) | 8 (40.0%) |
| 16 and 17 Years | 72 (41.4%) | 0 (0.0%) |
| 18 to 24 Years | 49 (15.7%) | 92 (33.6%) |
| 25 to 34 Years | 85 (20.1%) | 235 (46.8%) |
| 35 to 44 Years | 106 (27.8%) | 209 (31.0%) |
| 45 to 54 Years | 44 (12.1%) | 29 (10.5%) |
| 55 to 64 Years | 32 (15.7%) | 110 (35.7%) |
| 65 to 74 Years | 41 (12.9%) | 26 (11.2%) |
| 75 Years and over | 56 (37.3%) | 28 (18.1%) |
| Total | 950 (30.1%) | 1,058 (32.9%) |
Income Above Poverty by Sex and Age in Chickasaw
According to the poverty statistics in Chickasaw, males aged 45 to 54 years and females aged 16 and 17 years are the age groups that are most secure financially, with 87.9% of males and 100.0% of females in these age groups living above the poverty line.
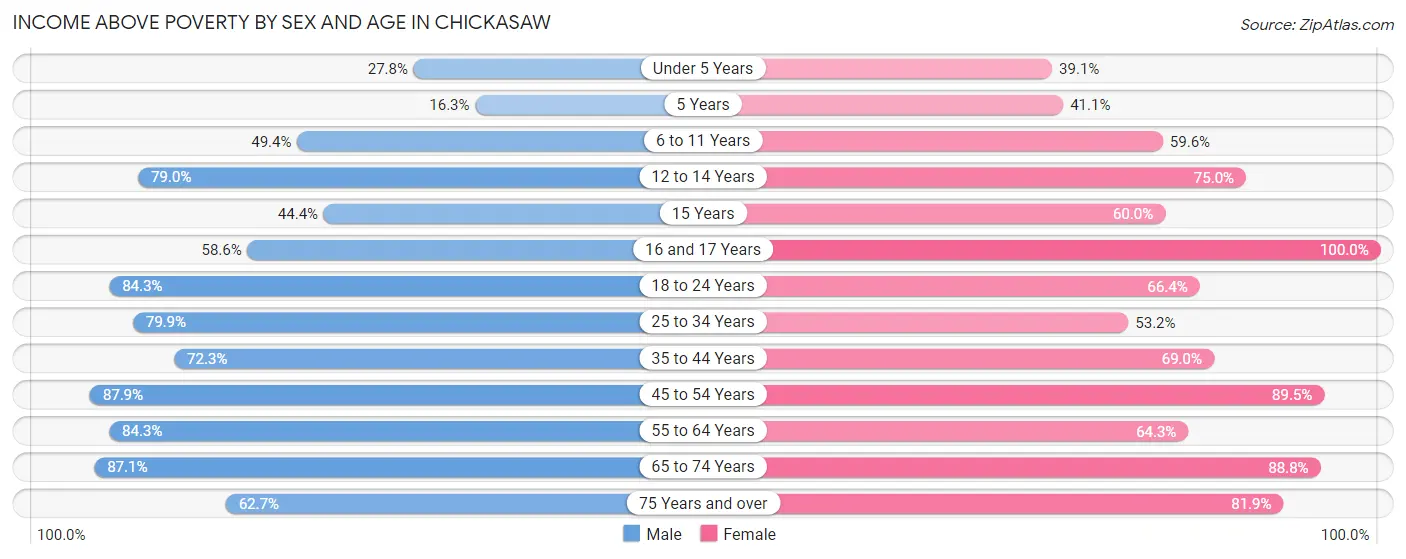
| Age Bracket | Male | Female |
| Under 5 Years | 83 (27.8%) | 82 (39.1%) |
| 5 Years | 8 (16.3%) | 30 (41.1%) |
| 6 to 11 Years | 161 (49.4%) | 180 (59.6%) |
| 12 to 14 Years | 105 (78.9%) | 84 (75.0%) |
| 15 Years | 12 (44.4%) | 12 (60.0%) |
| 16 and 17 Years | 102 (58.6%) | 72 (100.0%) |
| 18 to 24 Years | 263 (84.3%) | 182 (66.4%) |
| 25 to 34 Years | 338 (79.9%) | 267 (53.2%) |
| 35 to 44 Years | 276 (72.3%) | 466 (69.0%) |
| 45 to 54 Years | 319 (87.9%) | 248 (89.5%) |
| 55 to 64 Years | 172 (84.3%) | 198 (64.3%) |
| 65 to 74 Years | 276 (87.1%) | 207 (88.8%) |
| 75 Years and over | 94 (62.7%) | 127 (81.9%) |
| Total | 2,209 (69.9%) | 2,155 (67.1%) |
Income Below Poverty Among Married-Couple Families in Chickasaw
The poverty statistics for married-couple families in Chickasaw show that 12.1% or 90 of the total 744 families live below the poverty line. Families with 5 or more children have the highest poverty rate of 75.0%, comprising of 15 families. On the other hand, families with 1 or 2 children have the lowest poverty rate of 3.4%, which includes 13 families.
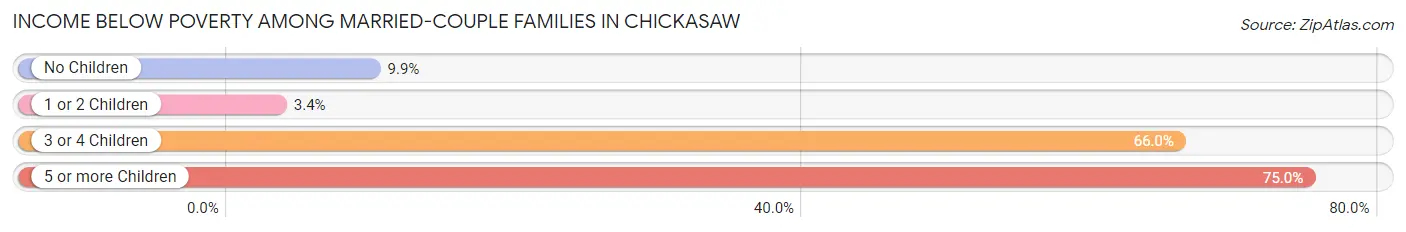
| Children | Above Poverty | Below Poverty |
| No Children | 263 (90.1%) | 29 (9.9%) |
| 1 or 2 Children | 369 (96.6%) | 13 (3.4%) |
| 3 or 4 Children | 17 (34.0%) | 33 (66.0%) |
| 5 or more Children | 5 (25.0%) | 15 (75.0%) |
| Total | 654 (87.9%) | 90 (12.1%) |
Income Below Poverty Among Single-Parent Households in Chickasaw
According to the poverty data in Chickasaw, 29.0% or 27 single-father households and 44.2% or 246 single-mother households are living below the poverty line. Among single-father households, those with 1 or 2 children have the highest poverty rate, with 27 households (69.2%) experiencing poverty. Likewise, among single-mother households, those with 5 or more children have the highest poverty rate, with 6 households (100.0%) falling below the poverty line.
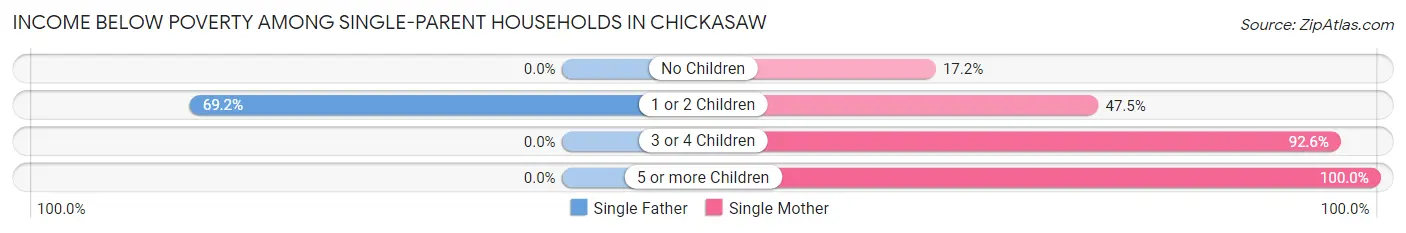
| Children | Single Father | Single Mother |
| No Children | 0 (0.0%) | 33 (17.2%) |
| 1 or 2 Children | 27 (69.2%) | 132 (47.5%) |
| 3 or 4 Children | 0 (0.0%) | 75 (92.6%) |
| 5 or more Children | 0 (0.0%) | 6 (100.0%) |
| Total | 27 (29.0%) | 246 (44.2%) |
Income Below Poverty Among Married-Couple vs Single-Parent Households in Chickasaw
The poverty data for Chickasaw shows that 90 of the married-couple family households (12.1%) and 273 of the single-parent households (42.0%) are living below the poverty level. Within the married-couple family households, those with 5 or more children have the highest poverty rate, with 15 households (75.0%) falling below the poverty line. Among the single-parent households, those with 5 or more children have the highest poverty rate, with 6 household (100.0%) living below poverty.
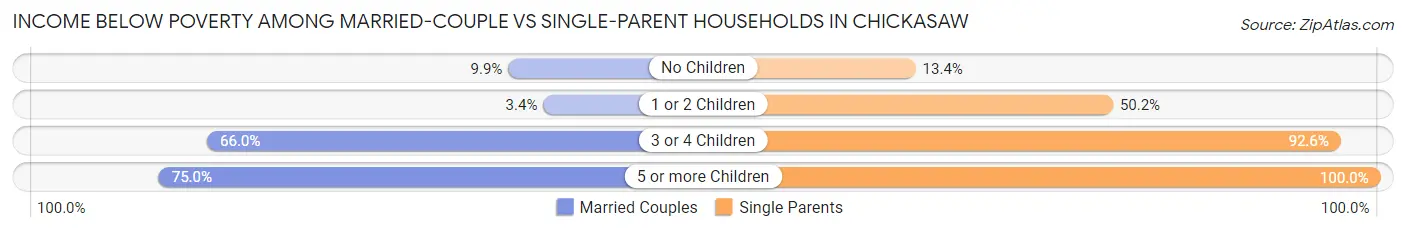
| Children | Married-Couple Families | Single-Parent Households |
| No Children | 29 (9.9%) | 33 (13.4%) |
| 1 or 2 Children | 13 (3.4%) | 159 (50.2%) |
| 3 or 4 Children | 33 (66.0%) | 75 (92.6%) |
| 5 or more Children | 15 (75.0%) | 6 (100.0%) |
| Total | 90 (12.1%) | 273 (42.0%) |
Employment Characteristics in Chickasaw
Employment by Class of Employer in Chickasaw
Among the 2,698 employed individuals in Chickasaw, private company employees (2,048 | 75.9%), state government employees (219 | 8.1%), and self-employed (not incorporated) (129 | 4.8%) make up the most common classes of employment.
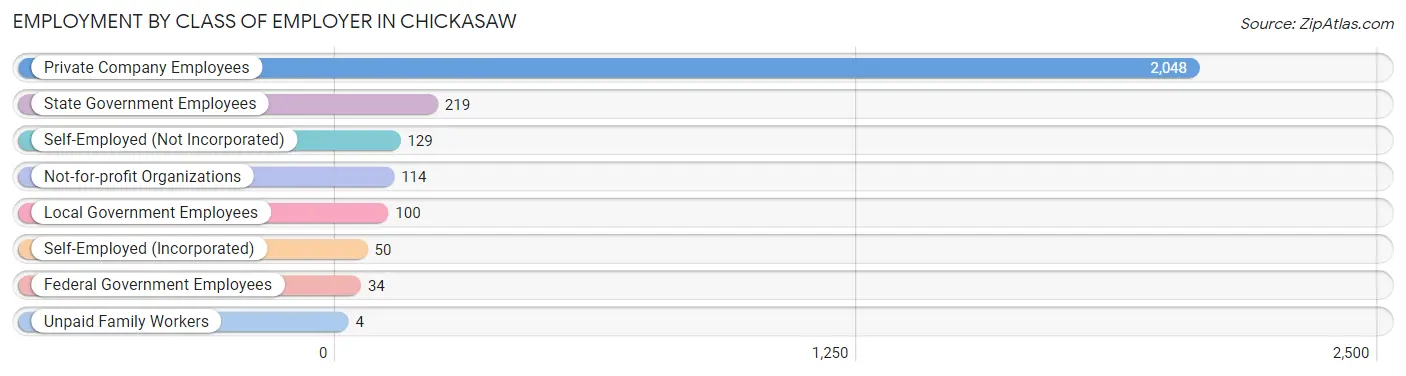
| Employer Class | # Employees | % Employees |
| Private Company Employees | 2,048 | 75.9% |
| Self-Employed (Incorporated) | 50 | 1.8% |
| Self-Employed (Not Incorporated) | 129 | 4.8% |
| Not-for-profit Organizations | 114 | 4.2% |
| Local Government Employees | 100 | 3.7% |
| State Government Employees | 219 | 8.1% |
| Federal Government Employees | 34 | 1.3% |
| Unpaid Family Workers | 4 | 0.2% |
| Total | 2,698 | 100.0% |
Employment Status by Age in Chickasaw
According to the labor force statistics for Chickasaw, out of the total population over 16 years of age (4,839), 59.2% or 2,865 individuals are in the labor force, with 4.7% or 135 of them unemployed. The age group with the highest labor force participation rate is 25 to 29 years, with 82.8% or 480 individuals in the labor force. Within the labor force, the 25 to 29 years age range has the highest percentage of unemployed individuals, with 8.5% or 41 of them being unemployed.
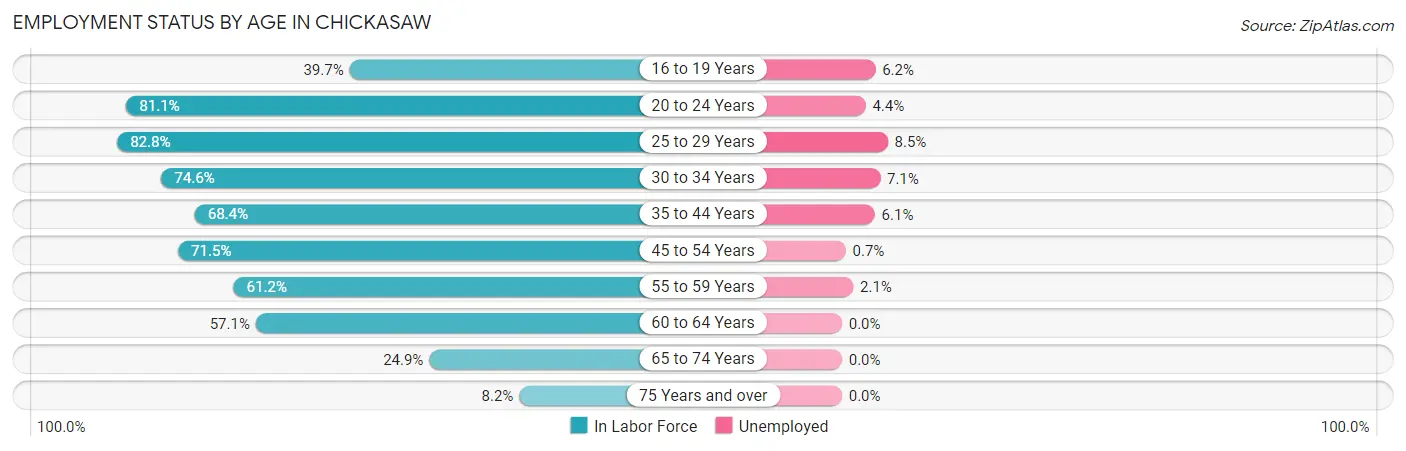
| Age Bracket | In Labor Force | Unemployed |
| 16 to 19 Years | 198 (39.7%) | 12 (6.2%) |
| 20 to 24 Years | 270 (81.1%) | 12 (4.4%) |
| 25 to 29 Years | 480 (82.8%) | 41 (8.5%) |
| 30 to 34 Years | 267 (74.6%) | 19 (7.1%) |
| 35 to 44 Years | 725 (68.4%) | 44 (6.1%) |
| 45 to 54 Years | 459 (71.5%) | 3 (0.7%) |
| 55 to 59 Years | 145 (61.2%) | 3 (2.1%) |
| 60 to 64 Years | 157 (57.1%) | 0 (0.0%) |
| 65 to 74 Years | 137 (24.9%) | 0 (0.0%) |
| 75 Years and over | 25 (8.2%) | 0 (0.0%) |
| Total | 2,865 (59.2%) | 135 (4.7%) |
Employment Status by Educational Attainment in Chickasaw
According to labor force statistics for Chickasaw, 70.8% of individuals (2,232) out of the total population between 25 and 64 years of age (3,152) are in the labor force, with 4.9% or 109 of them being unemployed. The group with the highest labor force participation rate are those with the educational attainment of bachelor's degree or higher, with 91.0% or 402 individuals in the labor force. Within the labor force, individuals with less than high school education have the highest percentage of unemployment, with 8.6% or 13 of them being unemployed.
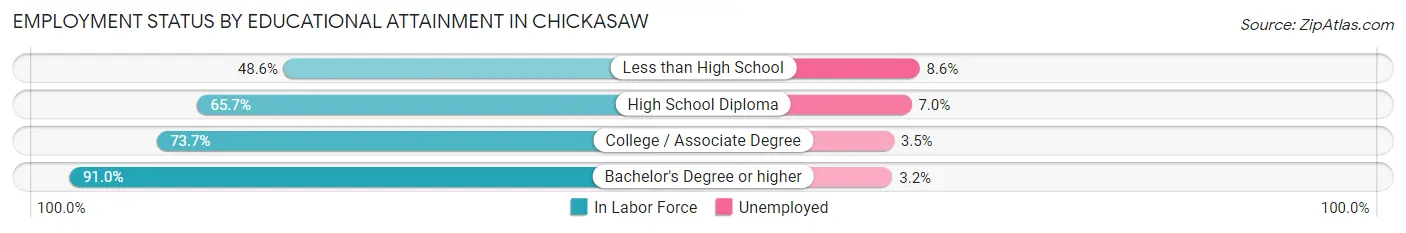
| Educational Attainment | In Labor Force | Unemployed |
| Less than High School | 152 (48.6%) | 27 (8.6%) |
| High School Diploma | 714 (65.7%) | 76 (7.0%) |
| College / Associate Degree | 966 (73.7%) | 46 (3.5%) |
| Bachelor's Degree or higher | 402 (91.0%) | 14 (3.2%) |
| Total | 2,232 (70.8%) | 154 (4.9%) |
Employment Occupations by Sex in Chickasaw
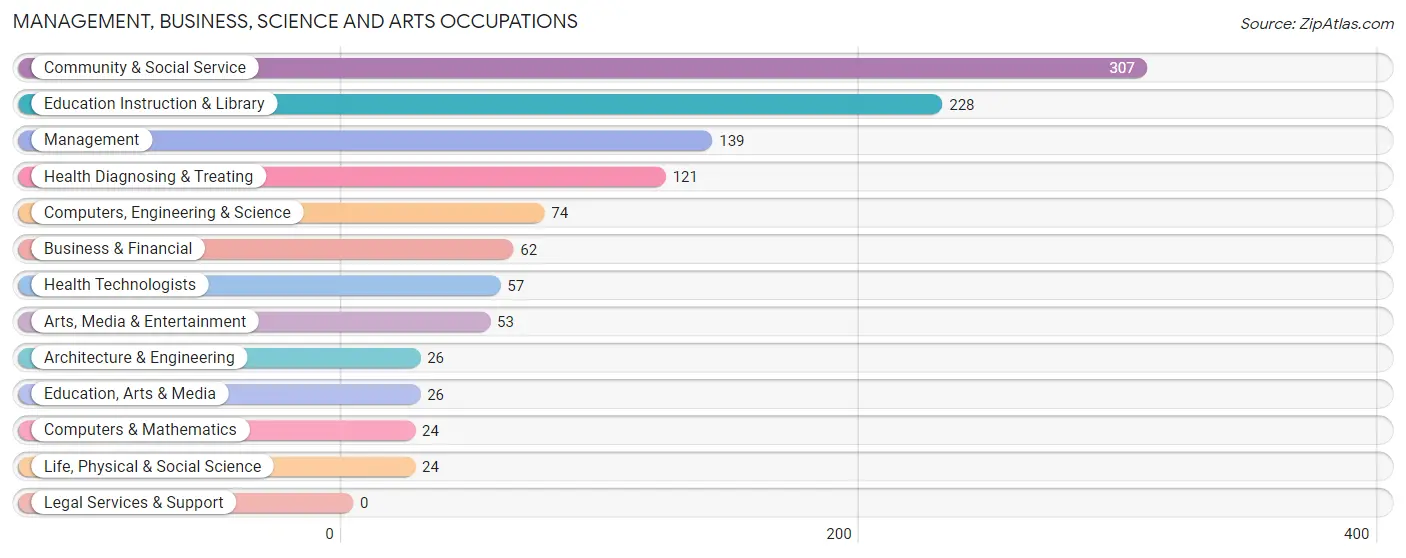
Management, Business, Science and Arts Occupations
The most common Management, Business, Science and Arts occupations in Chickasaw are Community & Social Service (307 | 11.3%), Education Instruction & Library (228 | 8.4%), Management (139 | 5.1%), Health Diagnosing & Treating (121 | 4.4%), and Computers, Engineering & Science (74 | 2.7%).
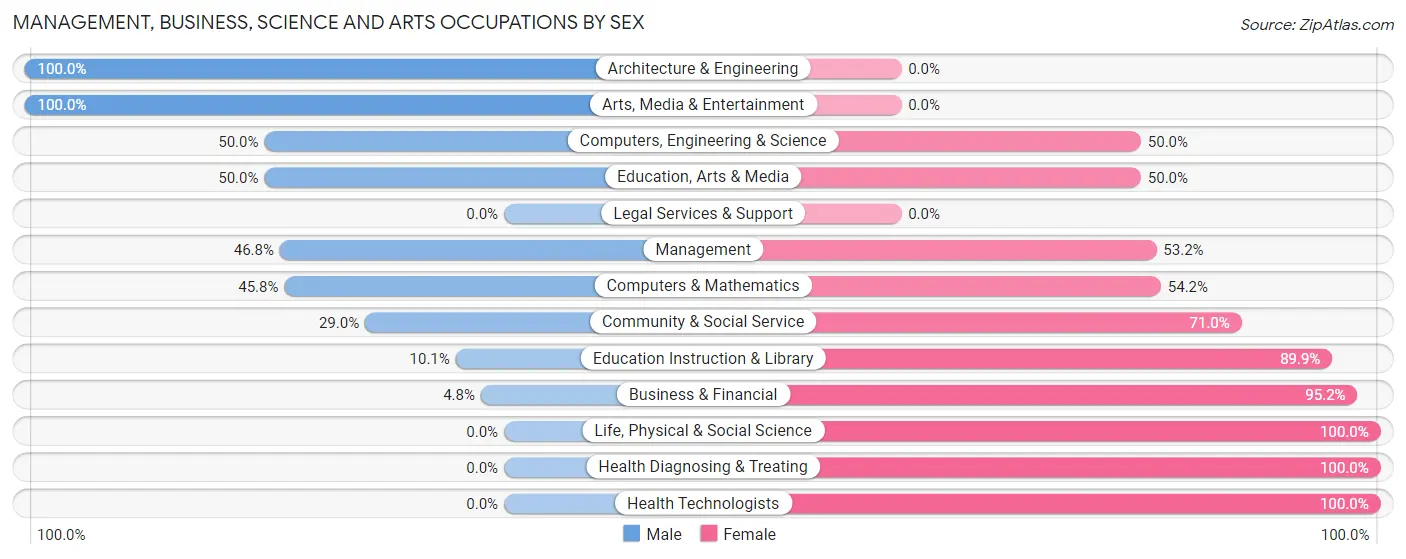
Management, Business, Science and Arts Occupations by Sex
Within the Management, Business, Science and Arts occupations in Chickasaw, the most male-oriented occupations are Architecture & Engineering (100.0%), Arts, Media & Entertainment (100.0%), and Computers, Engineering & Science (50.0%), while the most female-oriented occupations are Life, Physical & Social Science (100.0%), Health Diagnosing & Treating (100.0%), and Health Technologists (100.0%).
| Occupation | Male | Female |
| Management | 65 (46.8%) | 74 (53.2%) |
| Business & Financial | 3 (4.8%) | 59 (95.2%) |
| Computers, Engineering & Science | 37 (50.0%) | 37 (50.0%) |
| Computers & Mathematics | 11 (45.8%) | 13 (54.2%) |
| Architecture & Engineering | 26 (100.0%) | 0 (0.0%) |
| Life, Physical & Social Science | 0 (0.0%) | 24 (100.0%) |
| Community & Social Service | 89 (29.0%) | 218 (71.0%) |
| Education, Arts & Media | 13 (50.0%) | 13 (50.0%) |
| Legal Services & Support | 0 (0.0%) | 0 (0.0%) |
| Education Instruction & Library | 23 (10.1%) | 205 (89.9%) |
| Arts, Media & Entertainment | 53 (100.0%) | 0 (0.0%) |
| Health Diagnosing & Treating | 0 (0.0%) | 121 (100.0%) |
| Health Technologists | 0 (0.0%) | 57 (100.0%) |
| Total (Category) | 194 (27.6%) | 509 (72.4%) |
| Total (Overall) | 1,340 (49.2%) | 1,386 (50.8%) |
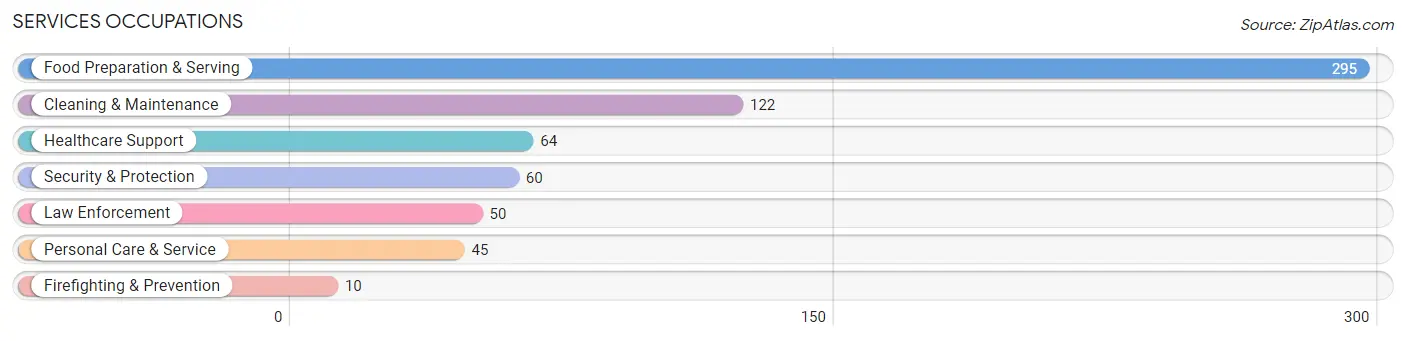
Services Occupations
The most common Services occupations in Chickasaw are Food Preparation & Serving (295 | 10.8%), Cleaning & Maintenance (122 | 4.5%), Healthcare Support (64 | 2.4%), Security & Protection (60 | 2.2%), and Law Enforcement (50 | 1.8%).
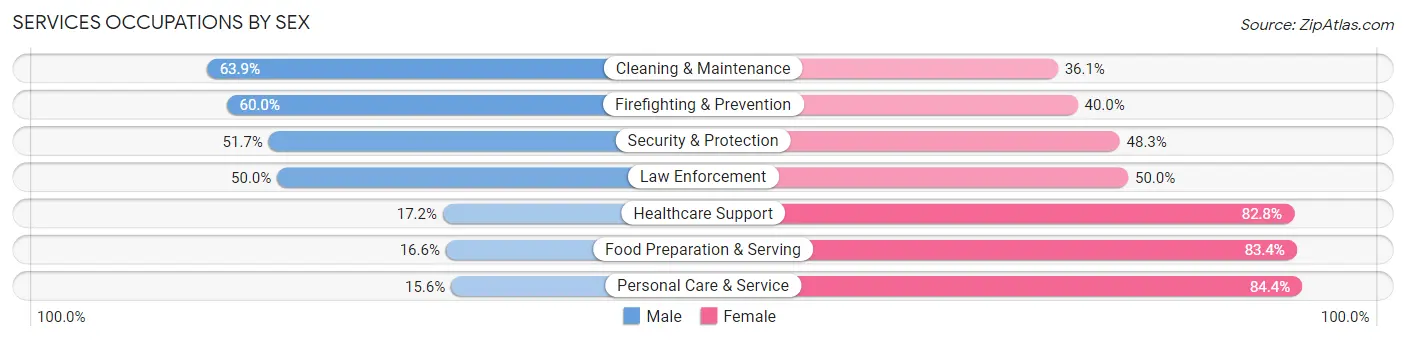
Services Occupations by Sex
Within the Services occupations in Chickasaw, the most male-oriented occupations are Cleaning & Maintenance (63.9%), Firefighting & Prevention (60.0%), and Security & Protection (51.7%), while the most female-oriented occupations are Personal Care & Service (84.4%), Food Preparation & Serving (83.4%), and Healthcare Support (82.8%).
| Occupation | Male | Female |
| Healthcare Support | 11 (17.2%) | 53 (82.8%) |
| Security & Protection | 31 (51.7%) | 29 (48.3%) |
| Firefighting & Prevention | 6 (60.0%) | 4 (40.0%) |
| Law Enforcement | 25 (50.0%) | 25 (50.0%) |
| Food Preparation & Serving | 49 (16.6%) | 246 (83.4%) |
| Cleaning & Maintenance | 78 (63.9%) | 44 (36.1%) |
| Personal Care & Service | 7 (15.6%) | 38 (84.4%) |
| Total (Category) | 176 (30.0%) | 410 (70.0%) |
| Total (Overall) | 1,340 (49.2%) | 1,386 (50.8%) |
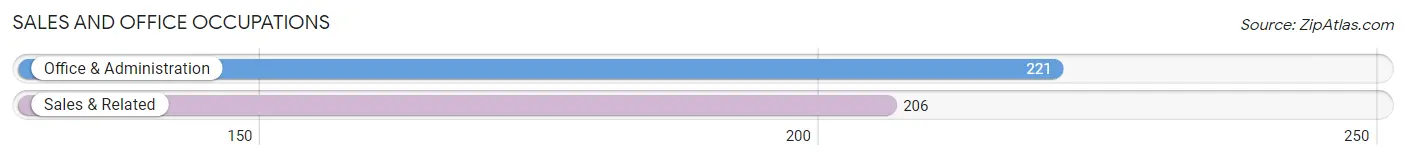
Sales and Office Occupations
The most common Sales and Office occupations in Chickasaw are Office & Administration (221 | 8.1%), and Sales & Related (206 | 7.6%).
Sales and Office Occupations by Sex
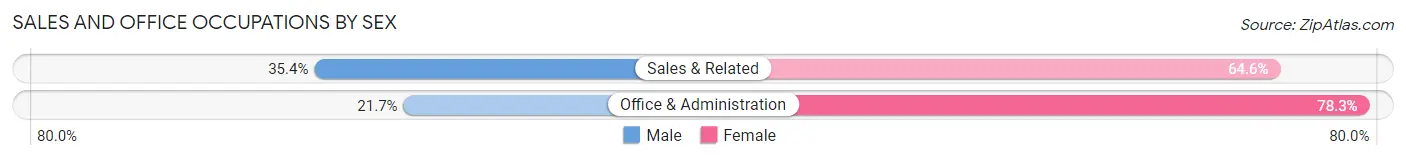
| Occupation | Male | Female |
| Sales & Related | 73 (35.4%) | 133 (64.6%) |
| Office & Administration | 48 (21.7%) | 173 (78.3%) |
| Total (Category) | 121 (28.3%) | 306 (71.7%) |
| Total (Overall) | 1,340 (49.2%) | 1,386 (50.8%) |
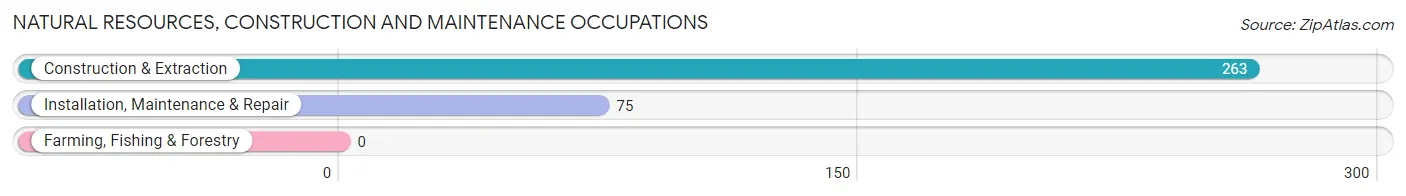
Natural Resources, Construction and Maintenance Occupations
The most common Natural Resources, Construction and Maintenance occupations in Chickasaw are Construction & Extraction (263 | 9.7%), and Installation, Maintenance & Repair (75 | 2.8%).
Natural Resources, Construction and Maintenance Occupations by Sex
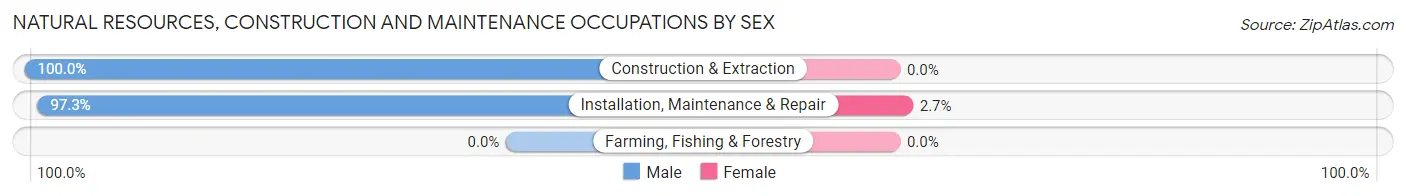
| Occupation | Male | Female |
| Farming, Fishing & Forestry | 0 (0.0%) | 0 (0.0%) |
| Construction & Extraction | 263 (100.0%) | 0 (0.0%) |
| Installation, Maintenance & Repair | 73 (97.3%) | 2 (2.7%) |
| Total (Category) | 336 (99.4%) | 2 (0.6%) |
| Total (Overall) | 1,340 (49.2%) | 1,386 (50.8%) |
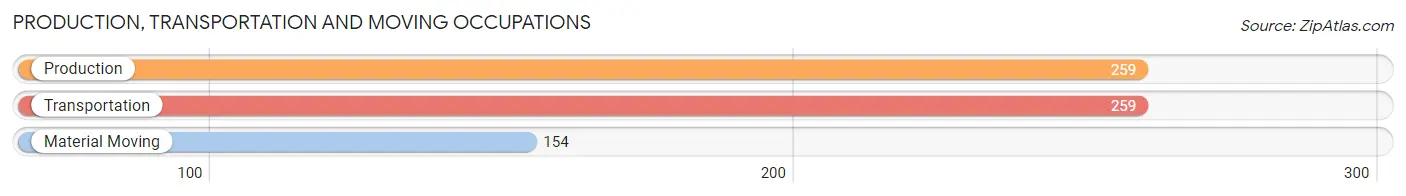
Production, Transportation and Moving Occupations
The most common Production, Transportation and Moving occupations in Chickasaw are Production (259 | 9.5%), Transportation (259 | 9.5%), and Material Moving (154 | 5.7%).
Production, Transportation and Moving Occupations by Sex
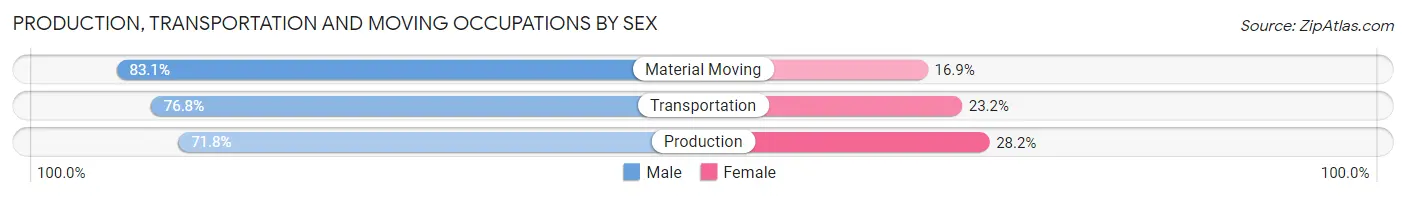
| Occupation | Male | Female |
| Production | 186 (71.8%) | 73 (28.2%) |
| Transportation | 199 (76.8%) | 60 (23.2%) |
| Material Moving | 128 (83.1%) | 26 (16.9%) |
| Total (Category) | 513 (76.3%) | 159 (23.7%) |
| Total (Overall) | 1,340 (49.2%) | 1,386 (50.8%) |
Employment Industries by Sex in Chickasaw
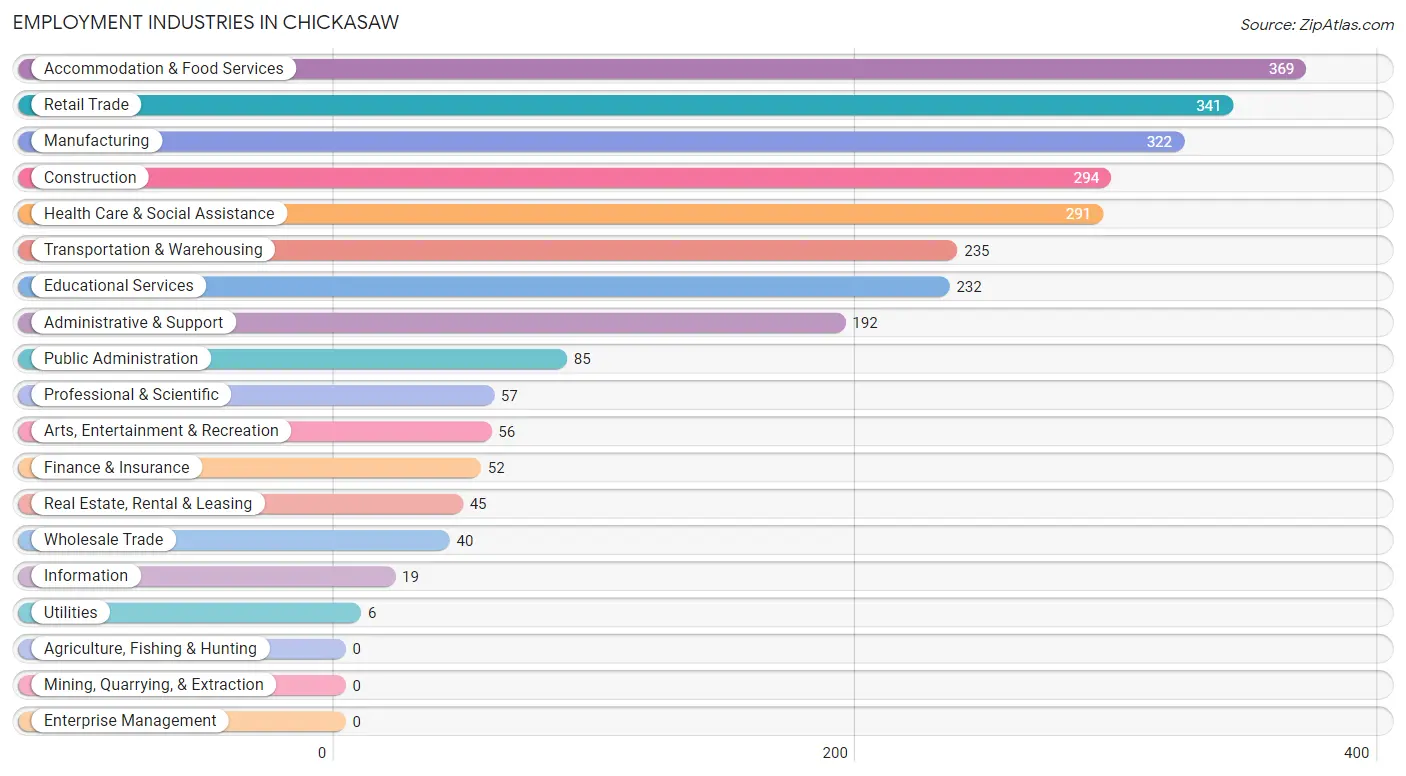
Employment Industries in Chickasaw
The major employment industries in Chickasaw include Accommodation & Food Services (369 | 13.5%), Retail Trade (341 | 12.5%), Manufacturing (322 | 11.8%), Construction (294 | 10.8%), and Health Care & Social Assistance (291 | 10.7%).
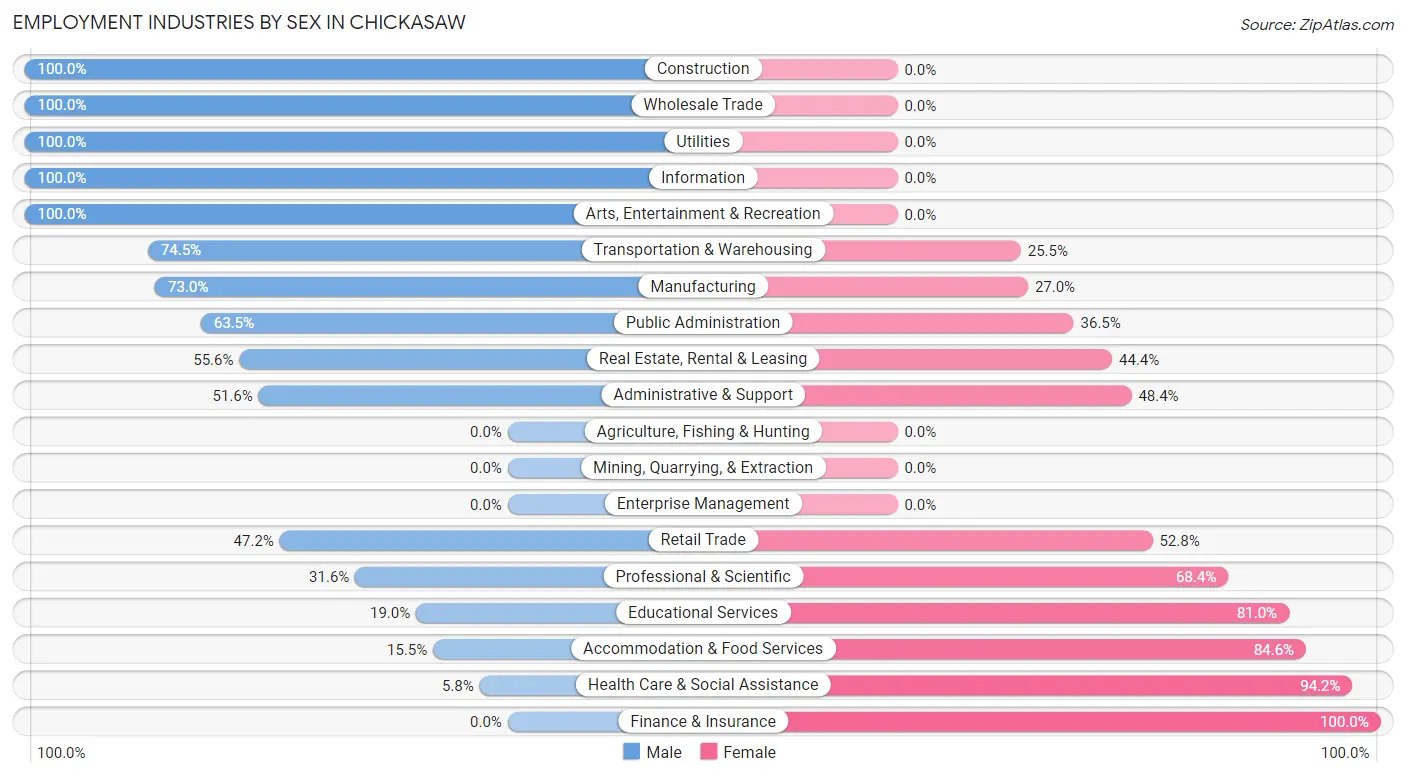
Employment Industries by Sex in Chickasaw
The Chickasaw industries that see more men than women are Construction (100.0%), Wholesale Trade (100.0%), and Utilities (100.0%), whereas the industries that tend to have a higher number of women are Finance & Insurance (100.0%), Health Care & Social Assistance (94.2%), and Accommodation & Food Services (84.6%).
| Industry | Male | Female |
| Agriculture, Fishing & Hunting | 0 (0.0%) | 0 (0.0%) |
| Mining, Quarrying, & Extraction | 0 (0.0%) | 0 (0.0%) |
| Construction | 294 (100.0%) | 0 (0.0%) |
| Manufacturing | 235 (73.0%) | 87 (27.0%) |
| Wholesale Trade | 40 (100.0%) | 0 (0.0%) |
| Retail Trade | 161 (47.2%) | 180 (52.8%) |
| Transportation & Warehousing | 175 (74.5%) | 60 (25.5%) |
| Utilities | 6 (100.0%) | 0 (0.0%) |
| Information | 19 (100.0%) | 0 (0.0%) |
| Finance & Insurance | 0 (0.0%) | 52 (100.0%) |
| Real Estate, Rental & Leasing | 25 (55.6%) | 20 (44.4%) |
| Professional & Scientific | 18 (31.6%) | 39 (68.4%) |
| Enterprise Management | 0 (0.0%) | 0 (0.0%) |
| Administrative & Support | 99 (51.6%) | 93 (48.4%) |
| Educational Services | 44 (19.0%) | 188 (81.0%) |
| Health Care & Social Assistance | 17 (5.8%) | 274 (94.2%) |
| Arts, Entertainment & Recreation | 56 (100.0%) | 0 (0.0%) |
| Accommodation & Food Services | 57 (15.4%) | 312 (84.6%) |
| Public Administration | 54 (63.5%) | 31 (36.5%) |
| Total | 1,340 (49.2%) | 1,386 (50.8%) |
Education in Chickasaw
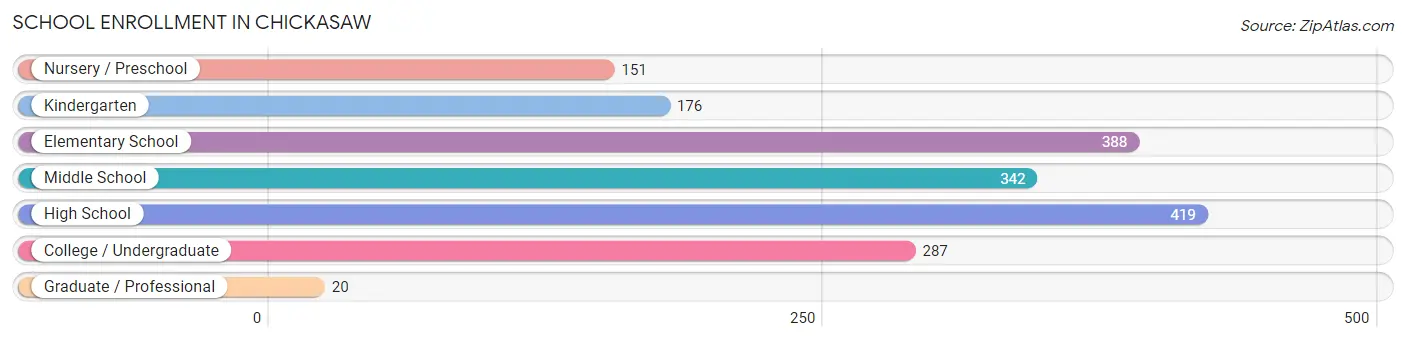
School Enrollment in Chickasaw
The most common levels of schooling among the 1,783 students in Chickasaw are high school (419 | 23.5%), elementary school (388 | 21.8%), and middle school (342 | 19.2%).
| School Level | # Students | % Students |
| Nursery / Preschool | 151 | 8.5% |
| Kindergarten | 176 | 9.9% |
| Elementary School | 388 | 21.8% |
| Middle School | 342 | 19.2% |
| High School | 419 | 23.5% |
| College / Undergraduate | 287 | 16.1% |
| Graduate / Professional | 20 | 1.1% |
| Total | 1,783 | 100.0% |
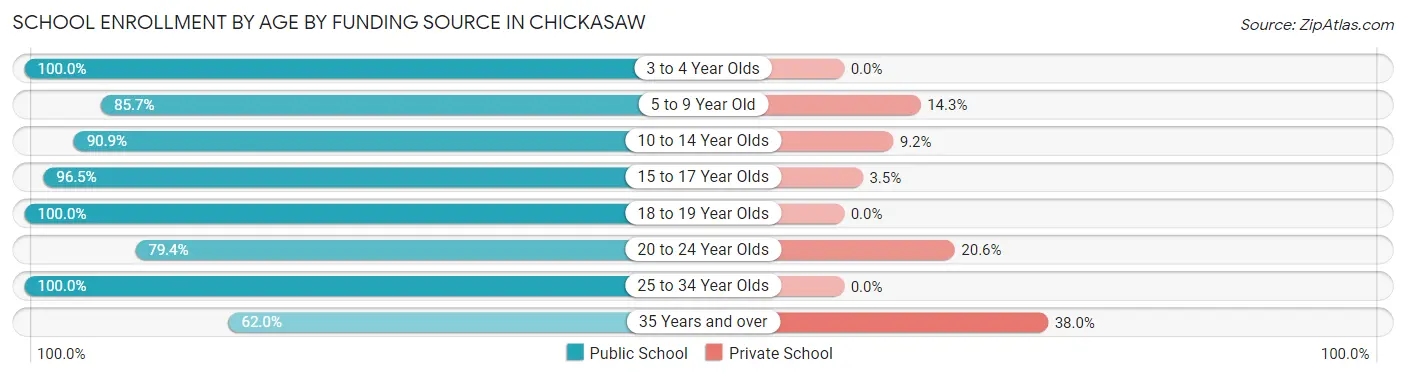
School Enrollment by Age by Funding Source in Chickasaw
Out of a total of 1,783 students who are enrolled in schools in Chickasaw, 166 (9.3%) attend a private institution, while the remaining 1,617 (90.7%) are enrolled in public schools. The age group of 35 years and over has the highest likelihood of being enrolled in private schools, with 19 (38.0% in the age bracket) enrolled. Conversely, the age group of 3 to 4 year olds has the lowest likelihood of being enrolled in a private school, with 129 (100.0% in the age bracket) attending a public institution.
| Age Bracket | Public School | Private School |
| 3 to 4 Year Olds | 129 (100.0%) | 0 (0.0%) |
| 5 to 9 Year Old | 469 (85.7%) | 78 (14.3%) |
| 10 to 14 Year Olds | 387 (90.8%) | 39 (9.1%) |
| 15 to 17 Year Olds | 276 (96.5%) | 10 (3.5%) |
| 18 to 19 Year Olds | 148 (100.0%) | 0 (0.0%) |
| 20 to 24 Year Olds | 77 (79.4%) | 20 (20.6%) |
| 25 to 34 Year Olds | 100 (100.0%) | 0 (0.0%) |
| 35 Years and over | 31 (62.0%) | 19 (38.0%) |
| Total | 1,617 (90.7%) | 166 (9.3%) |
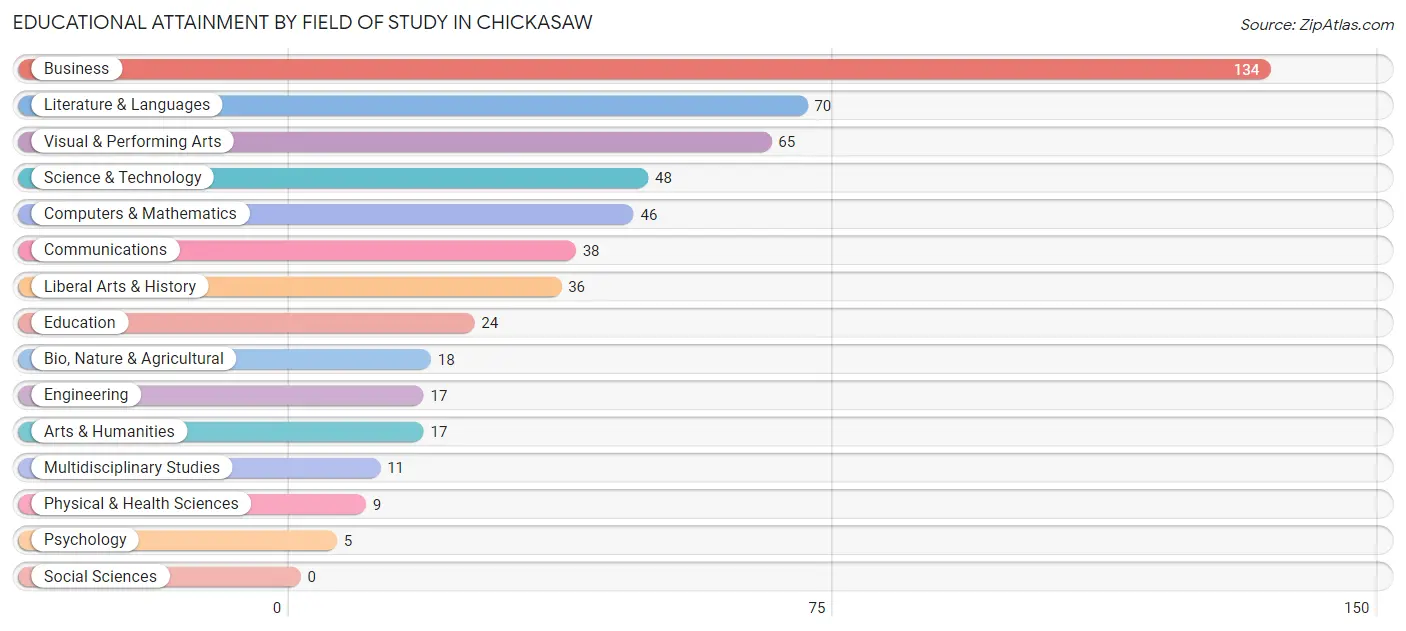
Educational Attainment by Field of Study in Chickasaw
Business (134 | 24.9%), literature & languages (70 | 13.0%), visual & performing arts (65 | 12.1%), science & technology (48 | 8.9%), and computers & mathematics (46 | 8.6%) are the most common fields of study among 538 individuals in Chickasaw who have obtained a bachelor's degree or higher.
| Field of Study | # Graduates | % Graduates |
| Computers & Mathematics | 46 | 8.6% |
| Bio, Nature & Agricultural | 18 | 3.4% |
| Physical & Health Sciences | 9 | 1.7% |
| Psychology | 5 | 0.9% |
| Social Sciences | 0 | 0.0% |
| Engineering | 17 | 3.2% |
| Multidisciplinary Studies | 11 | 2.0% |
| Science & Technology | 48 | 8.9% |
| Business | 134 | 24.9% |
| Education | 24 | 4.5% |
| Literature & Languages | 70 | 13.0% |
| Liberal Arts & History | 36 | 6.7% |
| Visual & Performing Arts | 65 | 12.1% |
| Communications | 38 | 7.1% |
| Arts & Humanities | 17 | 3.2% |
| Total | 538 | 100.0% |
Transportation & Commute in Chickasaw
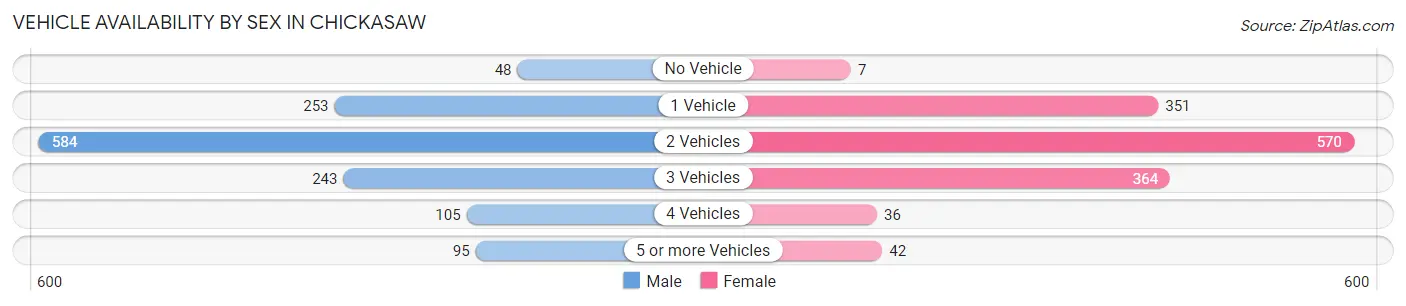
Vehicle Availability by Sex in Chickasaw
The most prevalent vehicle ownership categories in Chickasaw are males with 2 vehicles (584, accounting for 44.0%) and females with 2 vehicles (570, making up 42.6%).
| Vehicles Available | Male | Female |
| No Vehicle | 48 (3.6%) | 7 (0.5%) |
| 1 Vehicle | 253 (19.1%) | 351 (25.6%) |
| 2 Vehicles | 584 (44.0%) | 570 (41.6%) |
| 3 Vehicles | 243 (18.3%) | 364 (26.6%) |
| 4 Vehicles | 105 (7.9%) | 36 (2.6%) |
| 5 or more Vehicles | 95 (7.1%) | 42 (3.1%) |
| Total | 1,328 (100.0%) | 1,370 (100.0%) |
Commute Time in Chickasaw
The most frequently occuring commute durations in Chickasaw are 15 to 19 minutes (679 commuters, 26.2%), 20 to 24 minutes (514 commuters, 19.8%), and 30 to 34 minutes (376 commuters, 14.5%).
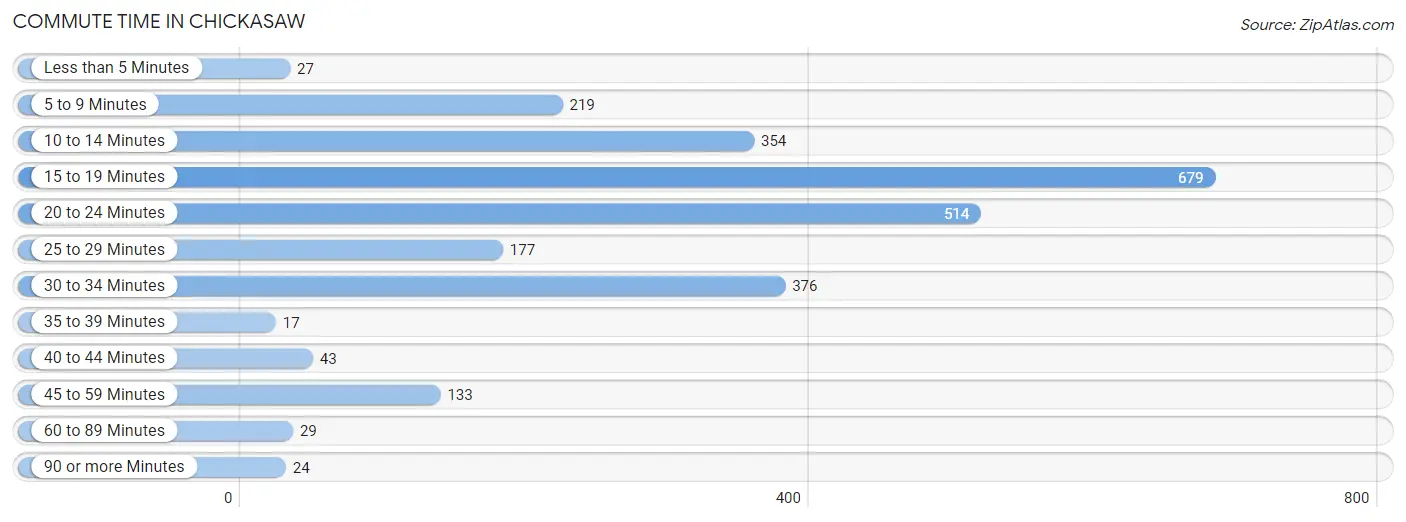
| Commute Time | # Commuters | % Commuters |
| Less than 5 Minutes | 27 | 1.0% |
| 5 to 9 Minutes | 219 | 8.5% |
| 10 to 14 Minutes | 354 | 13.7% |
| 15 to 19 Minutes | 679 | 26.2% |
| 20 to 24 Minutes | 514 | 19.8% |
| 25 to 29 Minutes | 177 | 6.8% |
| 30 to 34 Minutes | 376 | 14.5% |
| 35 to 39 Minutes | 17 | 0.7% |
| 40 to 44 Minutes | 43 | 1.7% |
| 45 to 59 Minutes | 133 | 5.1% |
| 60 to 89 Minutes | 29 | 1.1% |
| 90 or more Minutes | 24 | 0.9% |
Commute Time by Sex in Chickasaw
The most common commute times in Chickasaw are 15 to 19 minutes (250 commuters, 19.1%) for males and 15 to 19 minutes (429 commuters, 33.5%) for females.
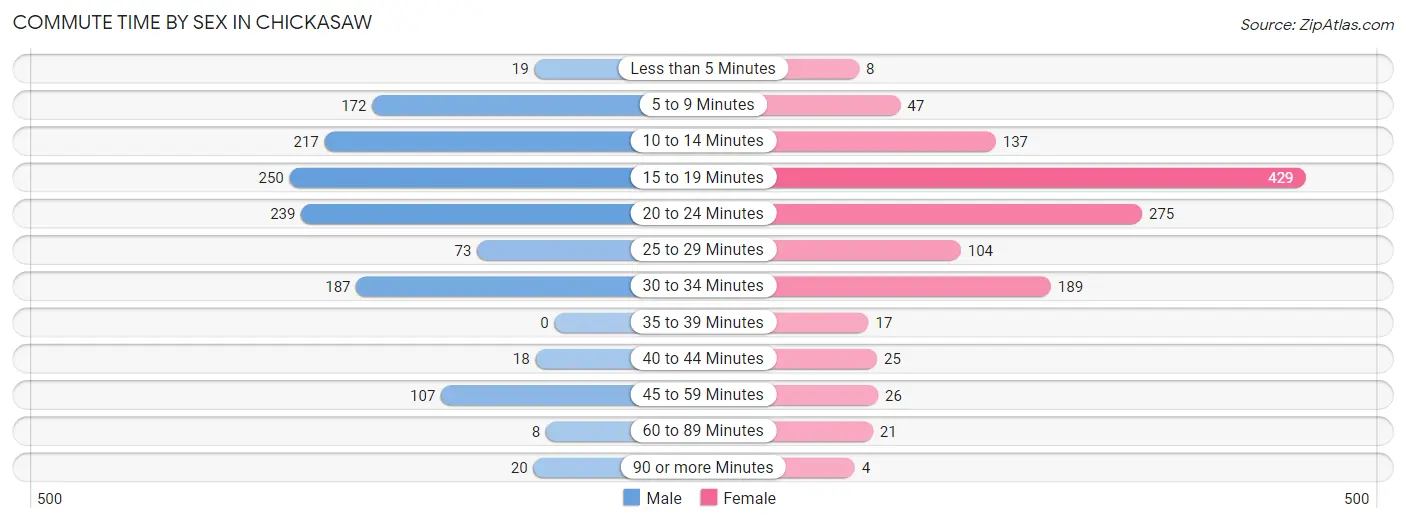
| Commute Time | Male | Female |
| Less than 5 Minutes | 19 (1.5%) | 8 (0.6%) |
| 5 to 9 Minutes | 172 (13.1%) | 47 (3.7%) |
| 10 to 14 Minutes | 217 (16.6%) | 137 (10.7%) |
| 15 to 19 Minutes | 250 (19.1%) | 429 (33.5%) |
| 20 to 24 Minutes | 239 (18.2%) | 275 (21.4%) |
| 25 to 29 Minutes | 73 (5.6%) | 104 (8.1%) |
| 30 to 34 Minutes | 187 (14.3%) | 189 (14.7%) |
| 35 to 39 Minutes | 0 (0.0%) | 17 (1.3%) |
| 40 to 44 Minutes | 18 (1.4%) | 25 (1.9%) |
| 45 to 59 Minutes | 107 (8.2%) | 26 (2.0%) |
| 60 to 89 Minutes | 8 (0.6%) | 21 (1.6%) |
| 90 or more Minutes | 20 (1.5%) | 4 (0.3%) |
Time of Departure to Work by Sex in Chickasaw
The most frequent times of departure to work in Chickasaw are 6:00 AM to 6:29 AM (315, 24.0%) for males and 7:30 AM to 7:59 AM (234, 18.2%) for females.
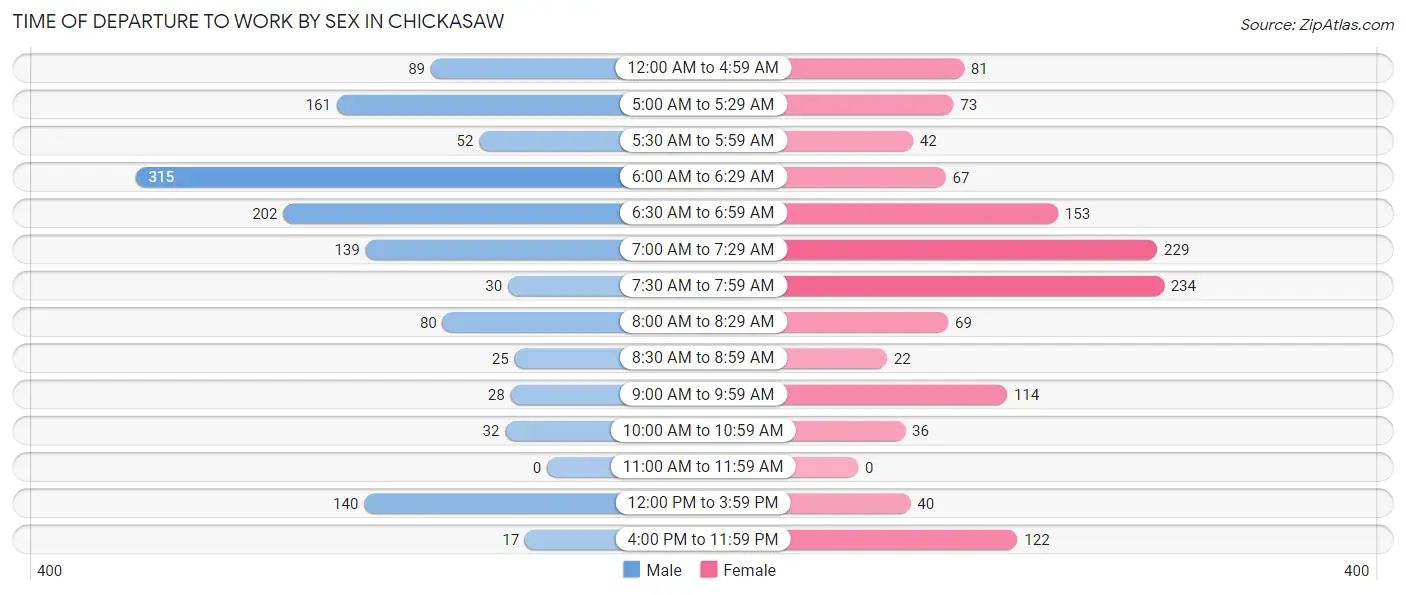
| Time of Departure | Male | Female |
| 12:00 AM to 4:59 AM | 89 (6.8%) | 81 (6.3%) |
| 5:00 AM to 5:29 AM | 161 (12.3%) | 73 (5.7%) |
| 5:30 AM to 5:59 AM | 52 (4.0%) | 42 (3.3%) |
| 6:00 AM to 6:29 AM | 315 (24.0%) | 67 (5.2%) |
| 6:30 AM to 6:59 AM | 202 (15.4%) | 153 (11.9%) |
| 7:00 AM to 7:29 AM | 139 (10.6%) | 229 (17.9%) |
| 7:30 AM to 7:59 AM | 30 (2.3%) | 234 (18.2%) |
| 8:00 AM to 8:29 AM | 80 (6.1%) | 69 (5.4%) |
| 8:30 AM to 8:59 AM | 25 (1.9%) | 22 (1.7%) |
| 9:00 AM to 9:59 AM | 28 (2.1%) | 114 (8.9%) |
| 10:00 AM to 10:59 AM | 32 (2.4%) | 36 (2.8%) |
| 11:00 AM to 11:59 AM | 0 (0.0%) | 0 (0.0%) |
| 12:00 PM to 3:59 PM | 140 (10.7%) | 40 (3.1%) |
| 4:00 PM to 11:59 PM | 17 (1.3%) | 122 (9.5%) |
| Total | 1,310 (100.0%) | 1,282 (100.0%) |
Housing Occupancy in Chickasaw
Occupancy by Ownership in Chickasaw
Of the total 2,379 dwellings in Chickasaw, owner-occupied units account for 1,134 (47.7%), while renter-occupied units make up 1,245 (52.3%).
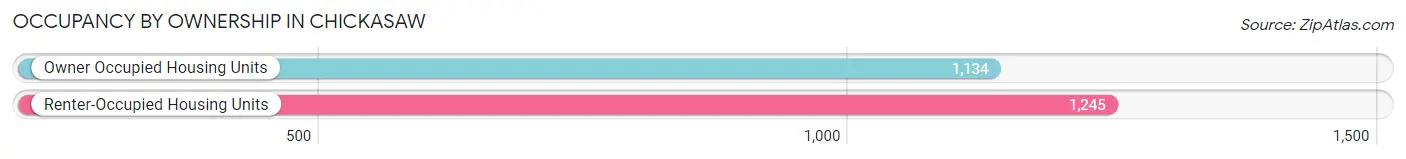
| Occupancy | # Housing Units | % Housing Units |
| Owner Occupied Housing Units | 1,134 | 47.7% |
| Renter-Occupied Housing Units | 1,245 | 52.3% |
| Total Occupied Housing Units | 2,379 | 100.0% |
Occupancy by Household Size in Chickasaw
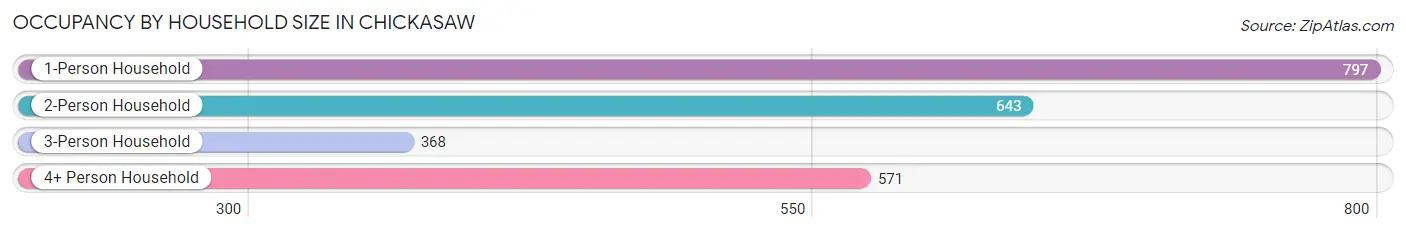
| Household Size | # Housing Units | % Housing Units |
| 1-Person Household | 797 | 33.5% |
| 2-Person Household | 643 | 27.0% |
| 3-Person Household | 368 | 15.5% |
| 4+ Person Household | 571 | 24.0% |
| Total Housing Units | 2,379 | 100.0% |
Occupancy by Ownership by Household Size in Chickasaw
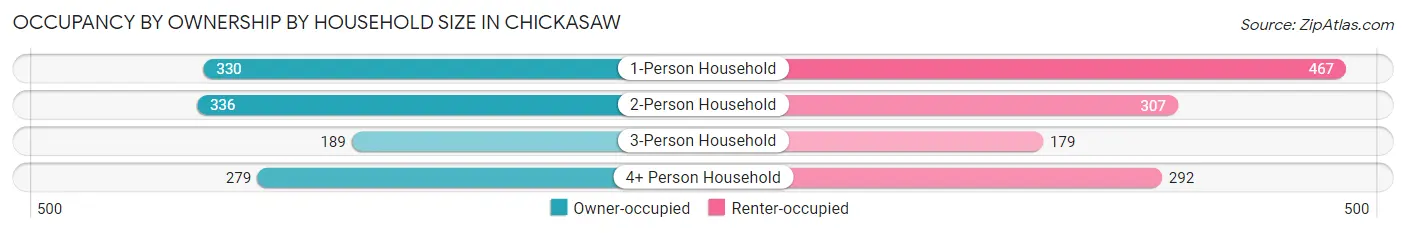
| Household Size | Owner-occupied | Renter-occupied |
| 1-Person Household | 330 (41.4%) | 467 (58.6%) |
| 2-Person Household | 336 (52.3%) | 307 (47.7%) |
| 3-Person Household | 189 (51.4%) | 179 (48.6%) |
| 4+ Person Household | 279 (48.9%) | 292 (51.1%) |
| Total Housing Units | 1,134 (47.7%) | 1,245 (52.3%) |
Occupancy by Educational Attainment in Chickasaw
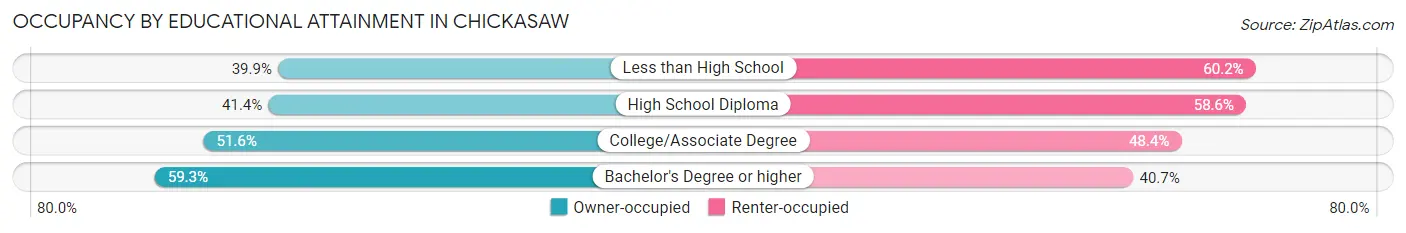
| Household Size | Owner-occupied | Renter-occupied |
| Less than High School | 108 (39.9%) | 163 (60.2%) |
| High School Diploma | 365 (41.4%) | 517 (58.6%) |
| College/Associate Degree | 445 (51.6%) | 417 (48.4%) |
| Bachelor's Degree or higher | 216 (59.3%) | 148 (40.7%) |
Occupancy by Age of Householder in Chickasaw
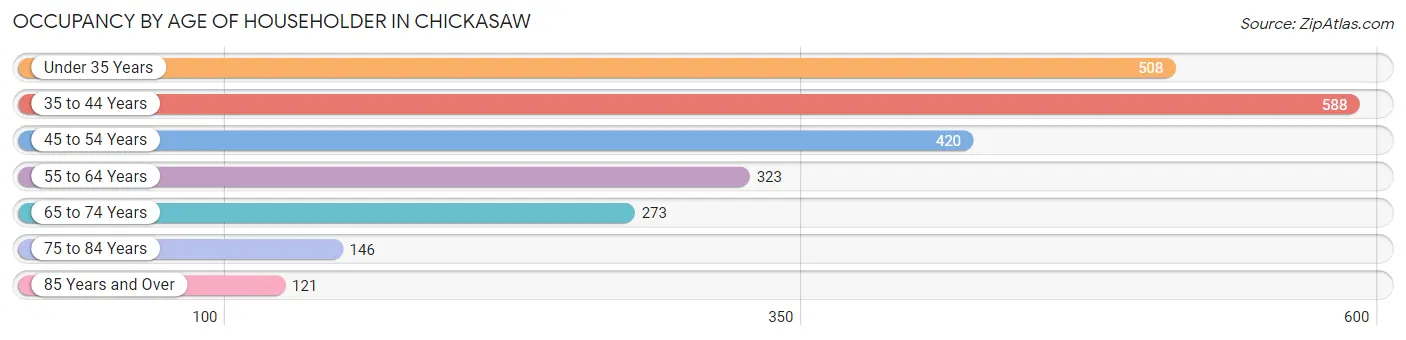
| Age Bracket | # Households | % Households |
| Under 35 Years | 508 | 21.3% |
| 35 to 44 Years | 588 | 24.7% |
| 45 to 54 Years | 420 | 17.6% |
| 55 to 64 Years | 323 | 13.6% |
| 65 to 74 Years | 273 | 11.5% |
| 75 to 84 Years | 146 | 6.1% |
| 85 Years and Over | 121 | 5.1% |
| Total | 2,379 | 100.0% |
Housing Finances in Chickasaw
Median Income by Occupancy in Chickasaw
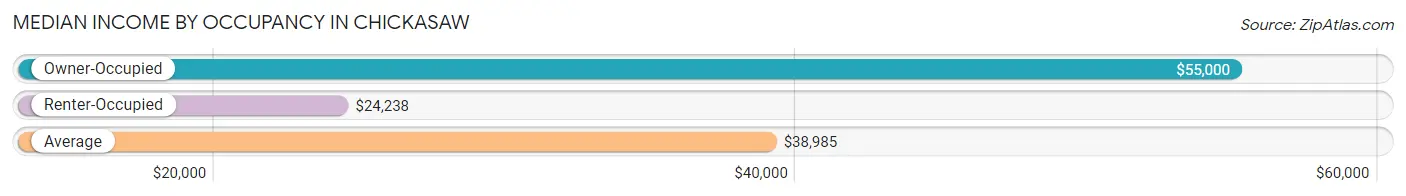
| Occupancy Type | # Households | Median Income |
| Owner-Occupied | 1,134 (47.7%) | $55,000 |
| Renter-Occupied | 1,245 (52.3%) | $24,238 |
| Average | 2,379 (100.0%) | $38,985 |
Occupancy by Householder Income Bracket in Chickasaw
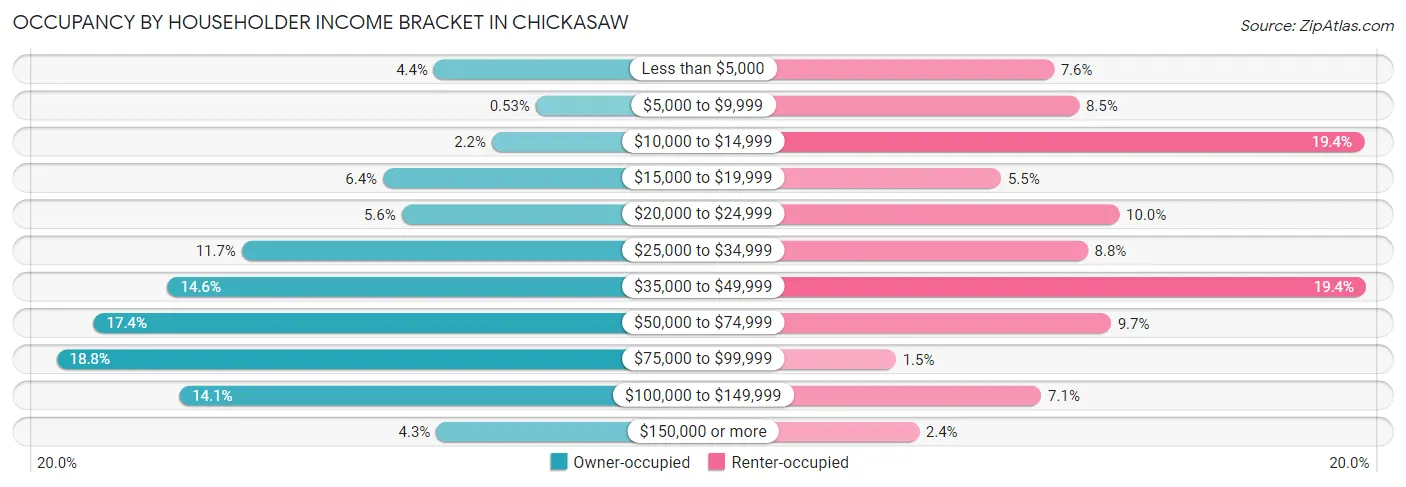
| Income Bracket | Owner-occupied | Renter-occupied |
| Less than $5,000 | 50 (4.4%) | 94 (7.5%) |
| $5,000 to $9,999 | 6 (0.5%) | 106 (8.5%) |
| $10,000 to $14,999 | 25 (2.2%) | 241 (19.4%) |
| $15,000 to $19,999 | 72 (6.4%) | 69 (5.5%) |
| $20,000 to $24,999 | 64 (5.6%) | 125 (10.0%) |
| $25,000 to $34,999 | 133 (11.7%) | 110 (8.8%) |
| $35,000 to $49,999 | 165 (14.5%) | 242 (19.4%) |
| $50,000 to $74,999 | 197 (17.4%) | 121 (9.7%) |
| $75,000 to $99,999 | 213 (18.8%) | 19 (1.5%) |
| $100,000 to $149,999 | 160 (14.1%) | 88 (7.1%) |
| $150,000 or more | 49 (4.3%) | 30 (2.4%) |
| Total | 1,134 (100.0%) | 1,245 (100.0%) |
Monthly Housing Cost Tiers in Chickasaw
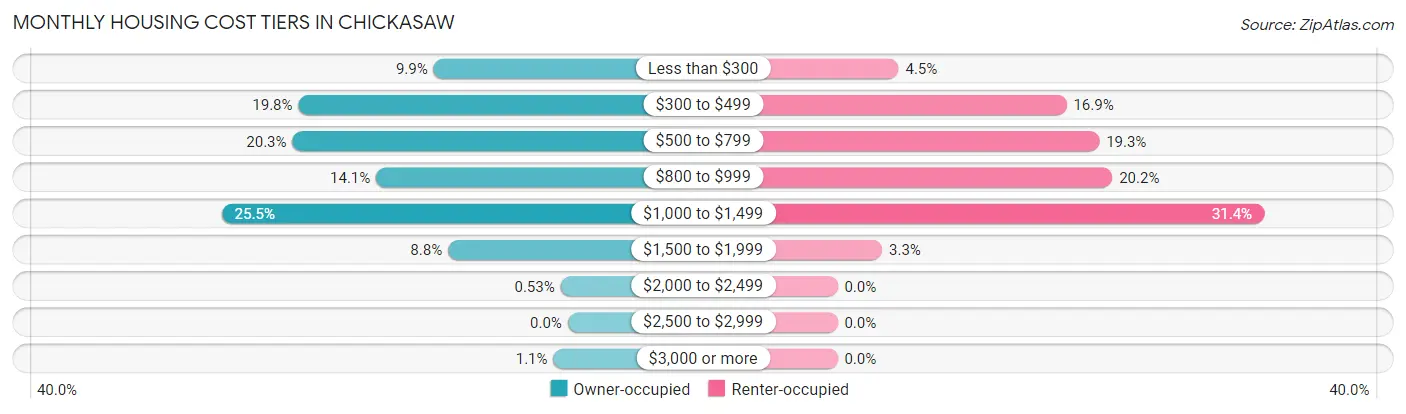
| Monthly Cost | Owner-occupied | Renter-occupied |
| Less than $300 | 112 (9.9%) | 56 (4.5%) |
| $300 to $499 | 225 (19.8%) | 210 (16.9%) |
| $500 to $799 | 230 (20.3%) | 240 (19.3%) |
| $800 to $999 | 160 (14.1%) | 252 (20.2%) |
| $1,000 to $1,499 | 289 (25.5%) | 391 (31.4%) |
| $1,500 to $1,999 | 100 (8.8%) | 41 (3.3%) |
| $2,000 to $2,499 | 6 (0.5%) | 0 (0.0%) |
| $2,500 to $2,999 | 0 (0.0%) | 0 (0.0%) |
| $3,000 or more | 12 (1.1%) | 0 (0.0%) |
| Total | 1,134 (100.0%) | 1,245 (100.0%) |
Physical Housing Characteristics in Chickasaw
Housing Structures in Chickasaw
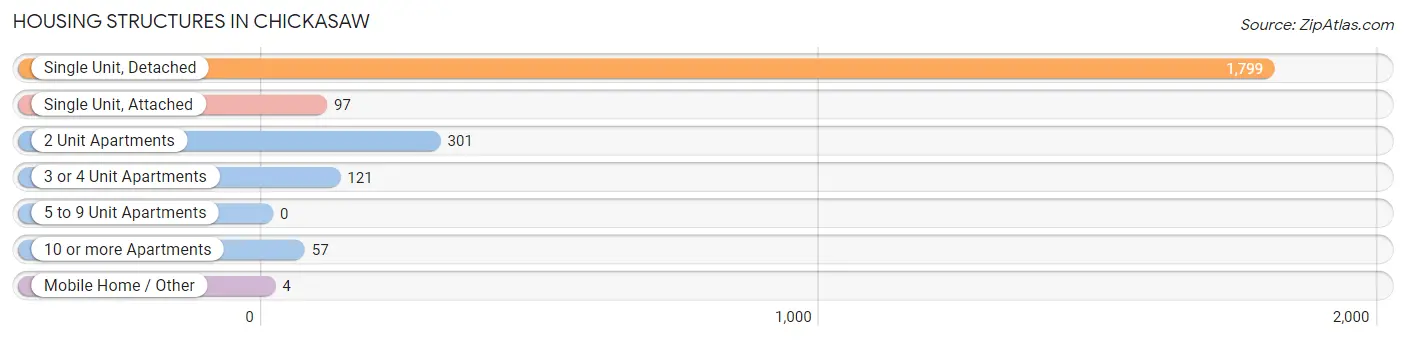
| Structure Type | # Housing Units | % Housing Units |
| Single Unit, Detached | 1,799 | 75.6% |
| Single Unit, Attached | 97 | 4.1% |
| 2 Unit Apartments | 301 | 12.7% |
| 3 or 4 Unit Apartments | 121 | 5.1% |
| 5 to 9 Unit Apartments | 0 | 0.0% |
| 10 or more Apartments | 57 | 2.4% |
| Mobile Home / Other | 4 | 0.2% |
| Total | 2,379 | 100.0% |
Housing Structures by Occupancy in Chickasaw
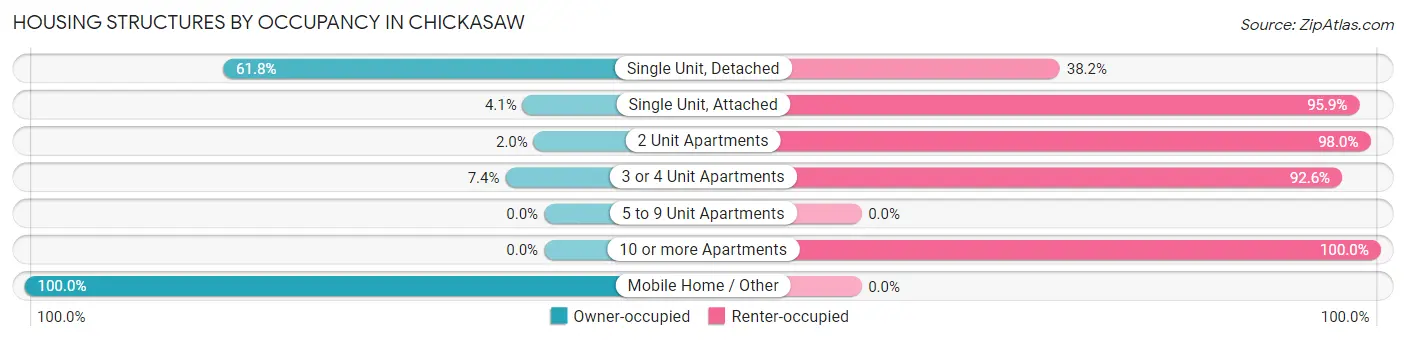
| Structure Type | Owner-occupied | Renter-occupied |
| Single Unit, Detached | 1,111 (61.8%) | 688 (38.2%) |
| Single Unit, Attached | 4 (4.1%) | 93 (95.9%) |
| 2 Unit Apartments | 6 (2.0%) | 295 (98.0%) |
| 3 or 4 Unit Apartments | 9 (7.4%) | 112 (92.6%) |
| 5 to 9 Unit Apartments | 0 (0.0%) | 0 (0.0%) |
| 10 or more Apartments | 0 (0.0%) | 57 (100.0%) |
| Mobile Home / Other | 4 (100.0%) | 0 (0.0%) |
| Total | 1,134 (47.7%) | 1,245 (52.3%) |
Housing Structures by Number of Rooms in Chickasaw
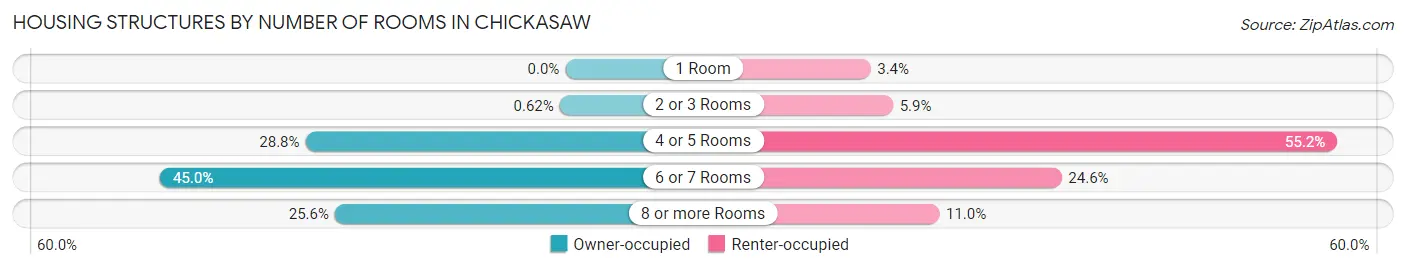
| Number of Rooms | Owner-occupied | Renter-occupied |
| 1 Room | 0 (0.0%) | 42 (3.4%) |
| 2 or 3 Rooms | 7 (0.6%) | 73 (5.9%) |
| 4 or 5 Rooms | 327 (28.8%) | 687 (55.2%) |
| 6 or 7 Rooms | 510 (45.0%) | 306 (24.6%) |
| 8 or more Rooms | 290 (25.6%) | 137 (11.0%) |
| Total | 1,134 (100.0%) | 1,245 (100.0%) |
Housing Structure by Heating Type in Chickasaw
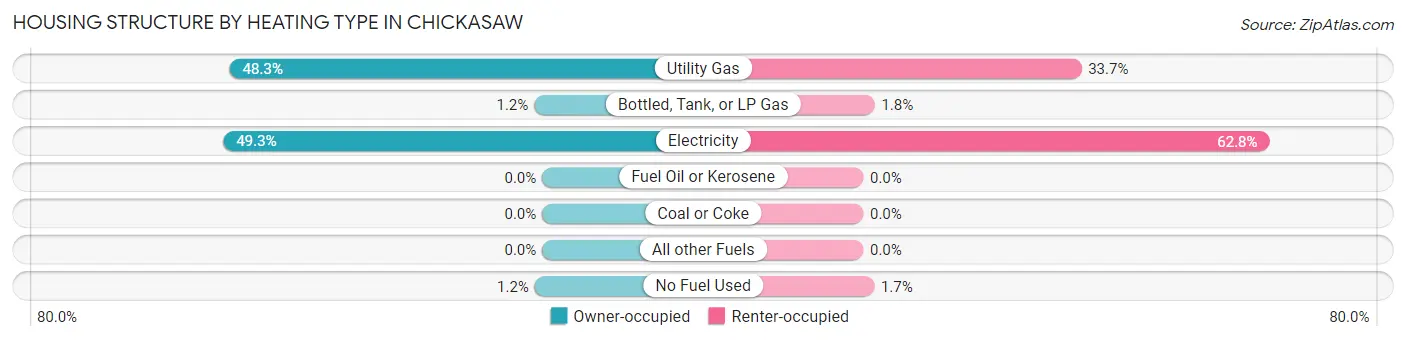
| Heating Type | Owner-occupied | Renter-occupied |
| Utility Gas | 548 (48.3%) | 420 (33.7%) |
| Bottled, Tank, or LP Gas | 14 (1.2%) | 22 (1.8%) |
| Electricity | 559 (49.3%) | 782 (62.8%) |
| Fuel Oil or Kerosene | 0 (0.0%) | 0 (0.0%) |
| Coal or Coke | 0 (0.0%) | 0 (0.0%) |
| All other Fuels | 0 (0.0%) | 0 (0.0%) |
| No Fuel Used | 13 (1.1%) | 21 (1.7%) |
| Total | 1,134 (100.0%) | 1,245 (100.0%) |
Household Vehicle Usage in Chickasaw
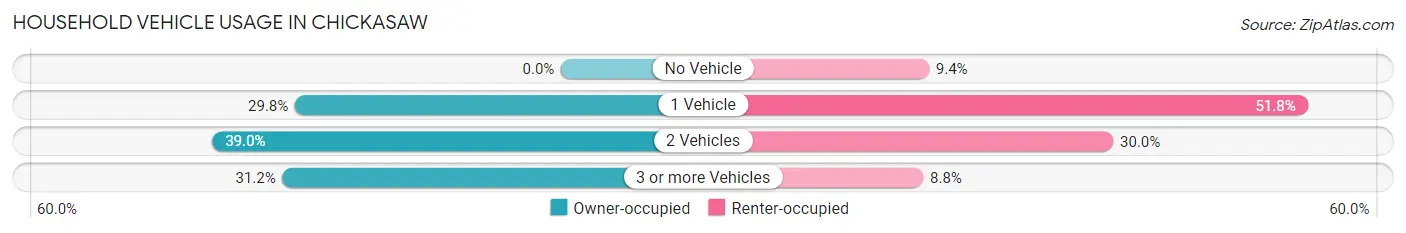
| Vehicles per Household | Owner-occupied | Renter-occupied |
| No Vehicle | 0 (0.0%) | 117 (9.4%) |
| 1 Vehicle | 338 (29.8%) | 645 (51.8%) |
| 2 Vehicles | 442 (39.0%) | 374 (30.0%) |
| 3 or more Vehicles | 354 (31.2%) | 109 (8.8%) |
| Total | 1,134 (100.0%) | 1,245 (100.0%) |
Real Estate & Mortgages in Chickasaw
Real Estate and Mortgage Overview in Chickasaw
| Characteristic | Without Mortgage | With Mortgage |
| Housing Units | 491 | 643 |
| Median Property Value | $80,900 | $95,100 |
| Median Household Income | $48,203 | $22 |
| Monthly Housing Costs | $440 | $12 |
| Real Estate Taxes | $363 | $57 |
Property Value by Mortgage Status in Chickasaw
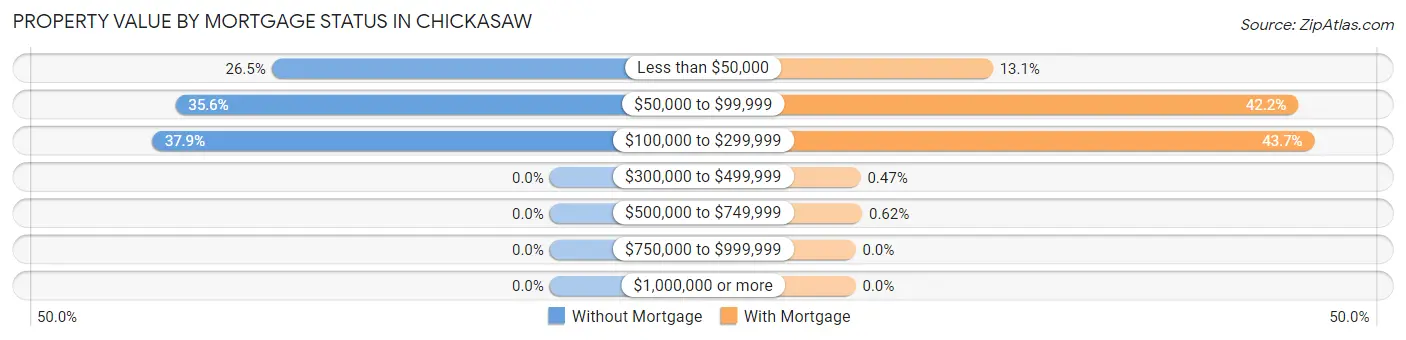
| Property Value | Without Mortgage | With Mortgage |
| Less than $50,000 | 130 (26.5%) | 84 (13.1%) |
| $50,000 to $99,999 | 175 (35.6%) | 271 (42.1%) |
| $100,000 to $299,999 | 186 (37.9%) | 281 (43.7%) |
| $300,000 to $499,999 | 0 (0.0%) | 3 (0.5%) |
| $500,000 to $749,999 | 0 (0.0%) | 4 (0.6%) |
| $750,000 to $999,999 | 0 (0.0%) | 0 (0.0%) |
| $1,000,000 or more | 0 (0.0%) | 0 (0.0%) |
| Total | 491 (100.0%) | 643 (100.0%) |
Household Income by Mortgage Status in Chickasaw
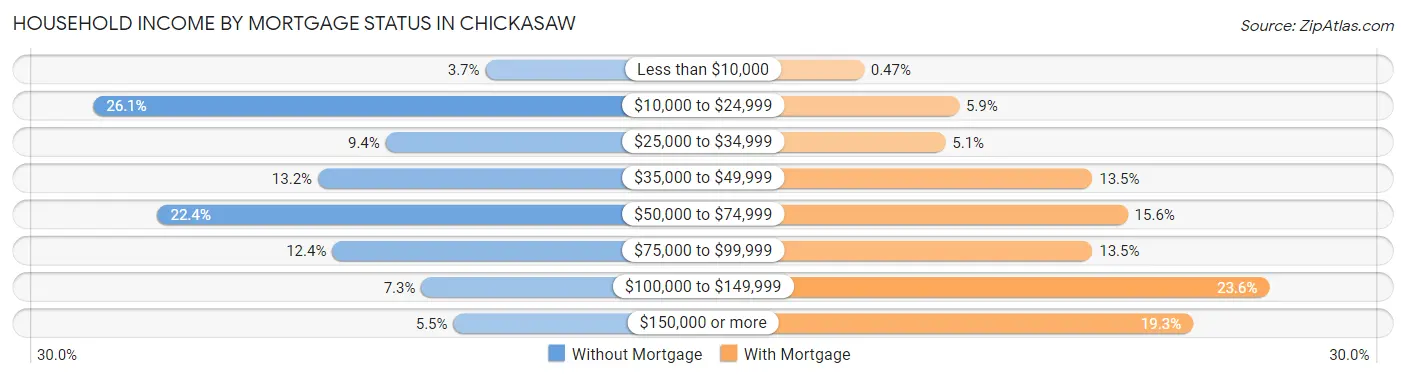
| Household Income | Without Mortgage | With Mortgage |
| Less than $10,000 | 18 (3.7%) | 3 (0.5%) |
| $10,000 to $24,999 | 128 (26.1%) | 38 (5.9%) |
| $25,000 to $34,999 | 46 (9.4%) | 33 (5.1%) |
| $35,000 to $49,999 | 65 (13.2%) | 87 (13.5%) |
| $50,000 to $74,999 | 110 (22.4%) | 100 (15.5%) |
| $75,000 to $99,999 | 61 (12.4%) | 87 (13.5%) |
| $100,000 to $149,999 | 36 (7.3%) | 152 (23.6%) |
| $150,000 or more | 27 (5.5%) | 124 (19.3%) |
| Total | 491 (100.0%) | 643 (100.0%) |
Property Value to Household Income Ratio in Chickasaw
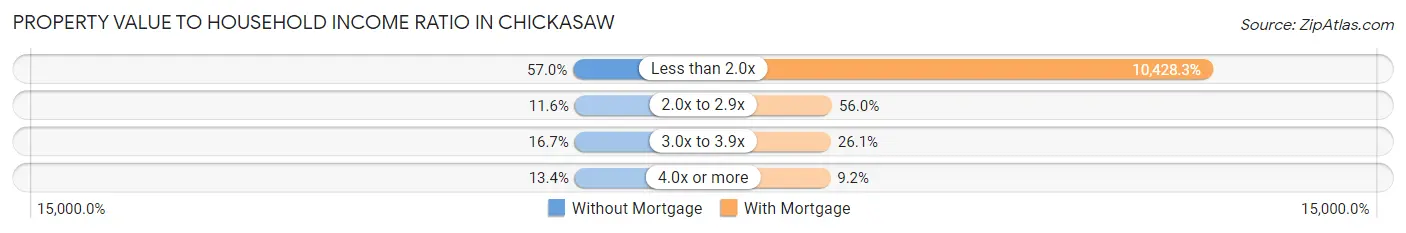
| Value-to-Income Ratio | Without Mortgage | With Mortgage |
| Less than 2.0x | 280 (57.0%) | 67,054 (10,428.3%) |
| 2.0x to 2.9x | 57 (11.6%) | 360 (56.0%) |
| 3.0x to 3.9x | 82 (16.7%) | 168 (26.1%) |
| 4.0x or more | 66 (13.4%) | 59 (9.2%) |
| Total | 491 (100.0%) | 643 (100.0%) |
Real Estate Taxes by Mortgage Status in Chickasaw
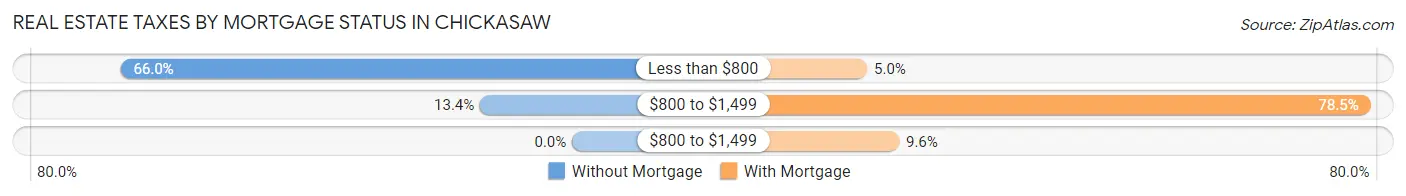
| Property Taxes | Without Mortgage | With Mortgage |
| Less than $800 | 324 (66.0%) | 32 (5.0%) |
| $800 to $1,499 | 66 (13.4%) | 505 (78.5%) |
| $800 to $1,499 | 0 (0.0%) | 62 (9.6%) |
| Total | 491 (100.0%) | 643 (100.0%) |
Health & Disability in Chickasaw
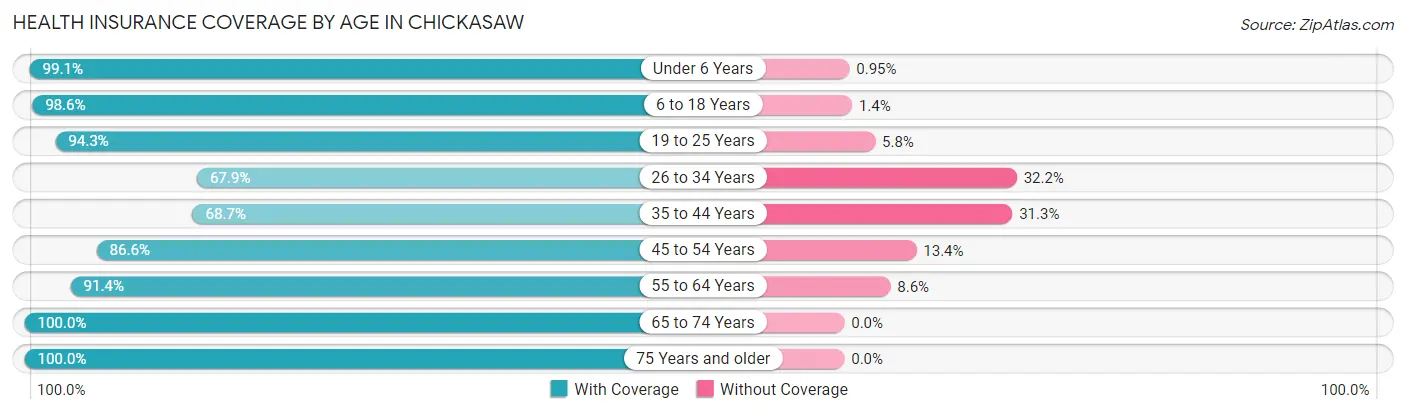
Health Insurance Coverage by Age in Chickasaw
| Age Bracket | With Coverage | Without Coverage |
| Under 6 Years | 625 (99.1%) | 6 (0.9%) |
| 6 to 18 Years | 1,314 (98.6%) | 19 (1.4%) |
| 19 to 25 Years | 606 (94.3%) | 37 (5.8%) |
| 26 to 34 Years | 479 (67.8%) | 227 (32.2%) |
| 35 to 44 Years | 726 (68.7%) | 331 (31.3%) |
| 45 to 54 Years | 554 (86.6%) | 86 (13.4%) |
| 55 to 64 Years | 468 (91.4%) | 44 (8.6%) |
| 65 to 74 Years | 550 (100.0%) | 0 (0.0%) |
| 75 Years and older | 305 (100.0%) | 0 (0.0%) |
| Total | 5,627 (88.2%) | 750 (11.8%) |
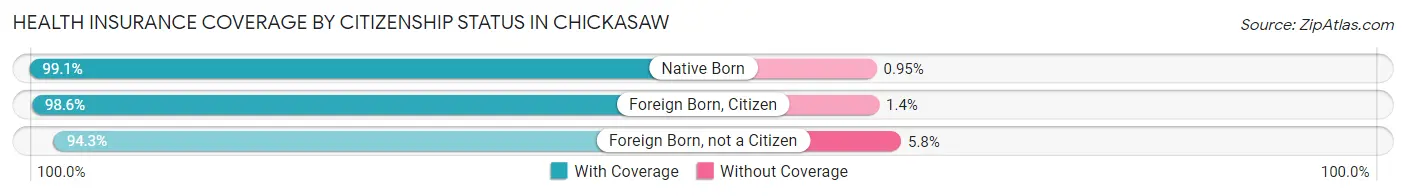
Health Insurance Coverage by Citizenship Status in Chickasaw
| Citizenship Status | With Coverage | Without Coverage |
| Native Born | 625 (99.1%) | 6 (0.9%) |
| Foreign Born, Citizen | 1,314 (98.6%) | 19 (1.4%) |
| Foreign Born, not a Citizen | 606 (94.3%) | 37 (5.8%) |
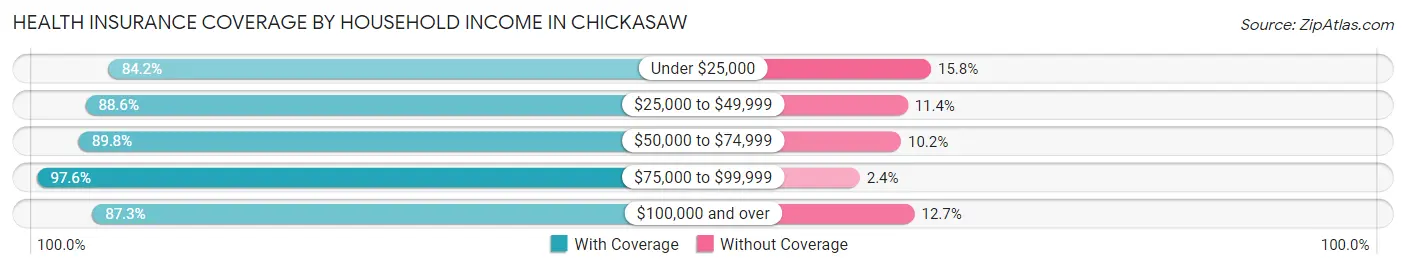
Health Insurance Coverage by Household Income in Chickasaw
| Household Income | With Coverage | Without Coverage |
| Under $25,000 | 1,590 (84.2%) | 298 (15.8%) |
| $25,000 to $49,999 | 1,367 (88.6%) | 176 (11.4%) |
| $50,000 to $74,999 | 963 (89.8%) | 109 (10.2%) |
| $75,000 to $99,999 | 723 (97.6%) | 18 (2.4%) |
| $100,000 and over | 977 (87.3%) | 142 (12.7%) |
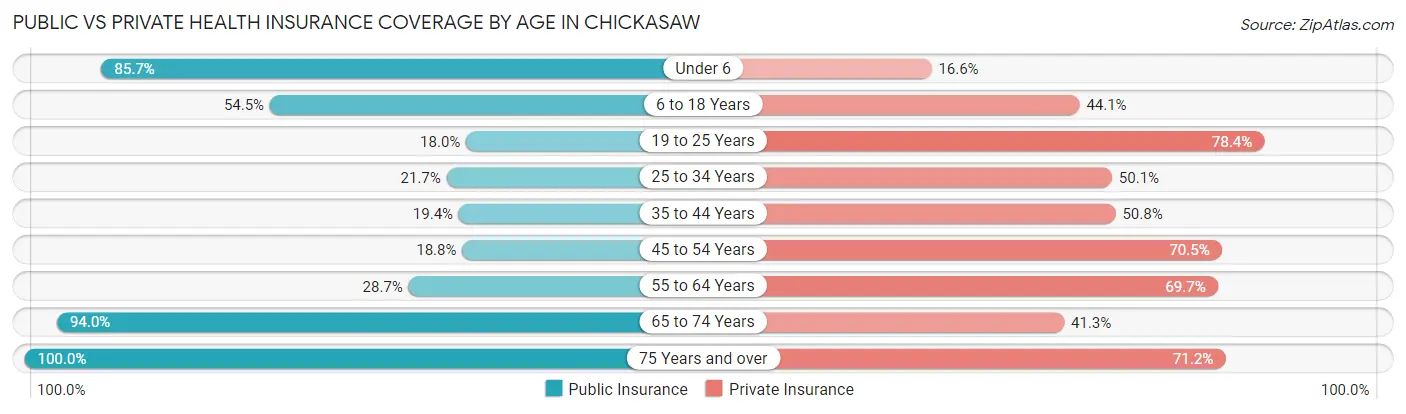
Public vs Private Health Insurance Coverage by Age in Chickasaw
| Age Bracket | Public Insurance | Private Insurance |
| Under 6 | 541 (85.7%) | 105 (16.6%) |
| 6 to 18 Years | 726 (54.5%) | 588 (44.1%) |
| 19 to 25 Years | 116 (18.0%) | 504 (78.4%) |
| 25 to 34 Years | 153 (21.7%) | 354 (50.1%) |
| 35 to 44 Years | 205 (19.4%) | 537 (50.8%) |
| 45 to 54 Years | 120 (18.8%) | 451 (70.5%) |
| 55 to 64 Years | 147 (28.7%) | 357 (69.7%) |
| 65 to 74 Years | 517 (94.0%) | 227 (41.3%) |
| 75 Years and over | 305 (100.0%) | 217 (71.2%) |
| Total | 2,830 (44.4%) | 3,340 (52.4%) |
Disability Status by Sex by Age in Chickasaw
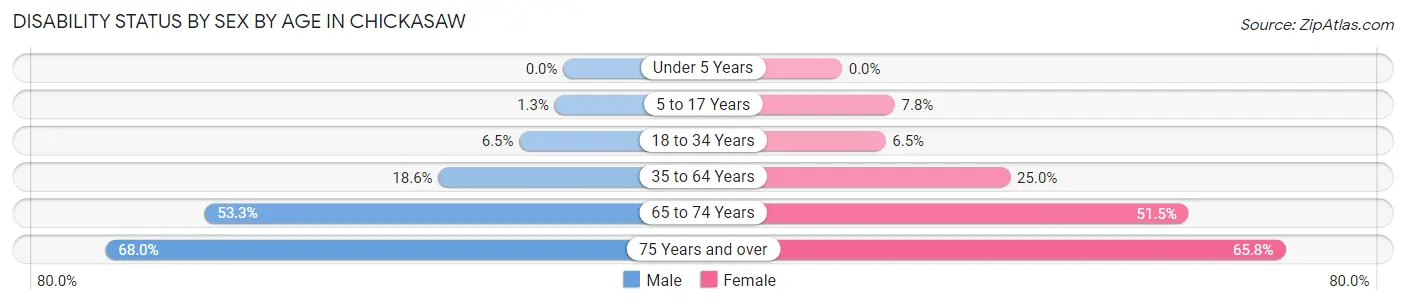
| Age Bracket | Male | Female |
| Under 5 Years | 0 (0.0%) | 0 (0.0%) |
| 5 to 17 Years | 9 (1.3%) | 46 (7.8%) |
| 18 to 34 Years | 48 (6.5%) | 50 (6.5%) |
| 35 to 64 Years | 176 (18.5%) | 315 (25.0%) |
| 65 to 74 Years | 169 (53.3%) | 120 (51.5%) |
| 75 Years and over | 102 (68.0%) | 102 (65.8%) |
Disability Class by Sex by Age in Chickasaw
Disability Class: Hearing Difficulty
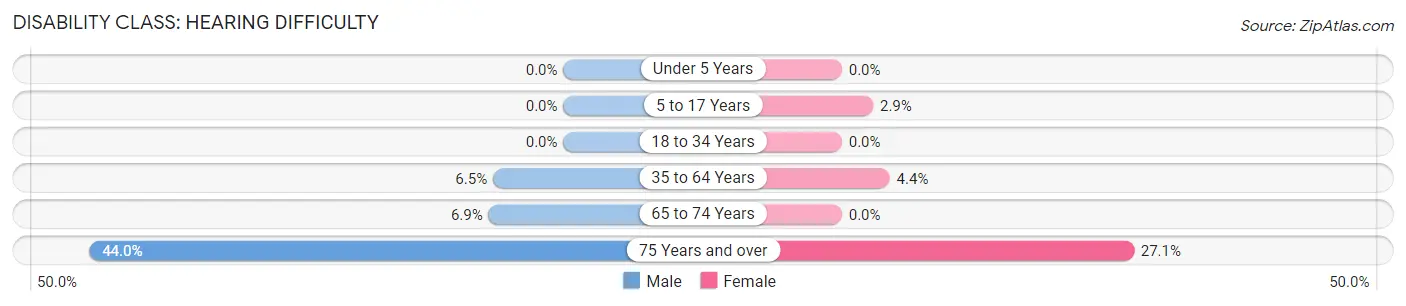
| Age Bracket | Male | Female |
| Under 5 Years | 0 (0.0%) | 0 (0.0%) |
| 5 to 17 Years | 0 (0.0%) | 17 (2.9%) |
| 18 to 34 Years | 0 (0.0%) | 0 (0.0%) |
| 35 to 64 Years | 62 (6.5%) | 56 (4.4%) |
| 65 to 74 Years | 22 (6.9%) | 0 (0.0%) |
| 75 Years and over | 66 (44.0%) | 42 (27.1%) |
Disability Class: Vision Difficulty
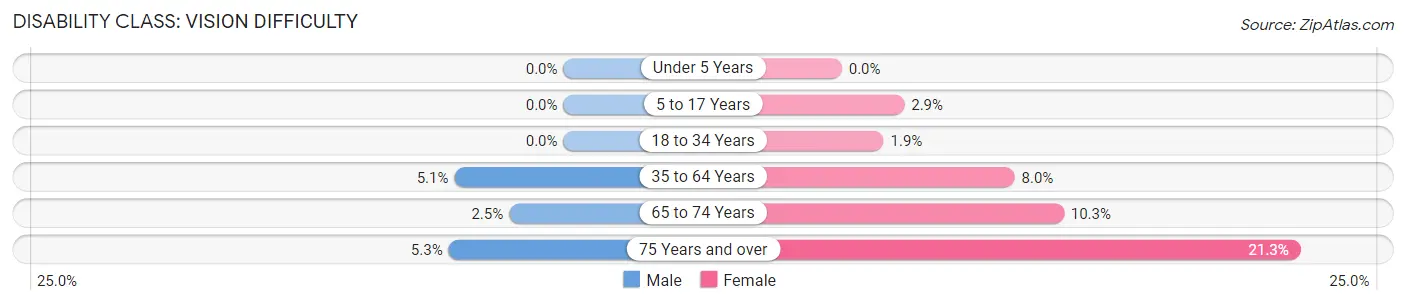
| Age Bracket | Male | Female |
| Under 5 Years | 0 (0.0%) | 0 (0.0%) |
| 5 to 17 Years | 0 (0.0%) | 17 (2.9%) |
| 18 to 34 Years | 0 (0.0%) | 15 (1.9%) |
| 35 to 64 Years | 48 (5.1%) | 101 (8.0%) |
| 65 to 74 Years | 8 (2.5%) | 24 (10.3%) |
| 75 Years and over | 8 (5.3%) | 33 (21.3%) |
Disability Class: Cognitive Difficulty
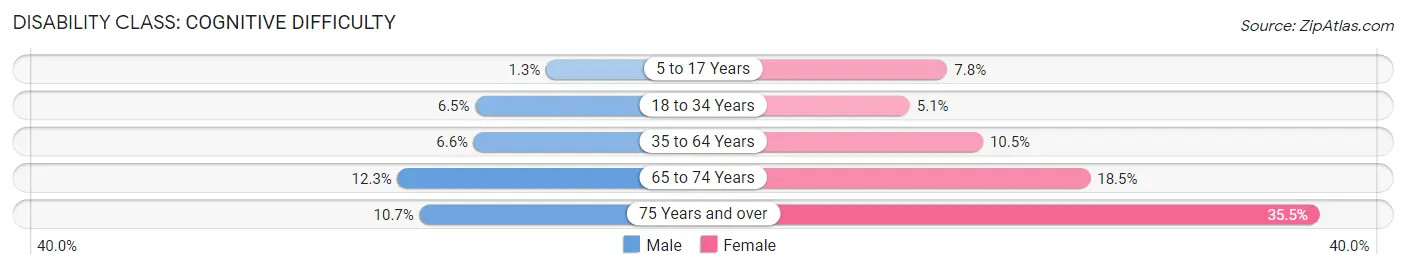
| Age Bracket | Male | Female |
| 5 to 17 Years | 9 (1.3%) | 46 (7.8%) |
| 18 to 34 Years | 48 (6.5%) | 39 (5.1%) |
| 35 to 64 Years | 63 (6.6%) | 132 (10.5%) |
| 65 to 74 Years | 39 (12.3%) | 43 (18.4%) |
| 75 Years and over | 16 (10.7%) | 55 (35.5%) |
Disability Class: Ambulatory Difficulty
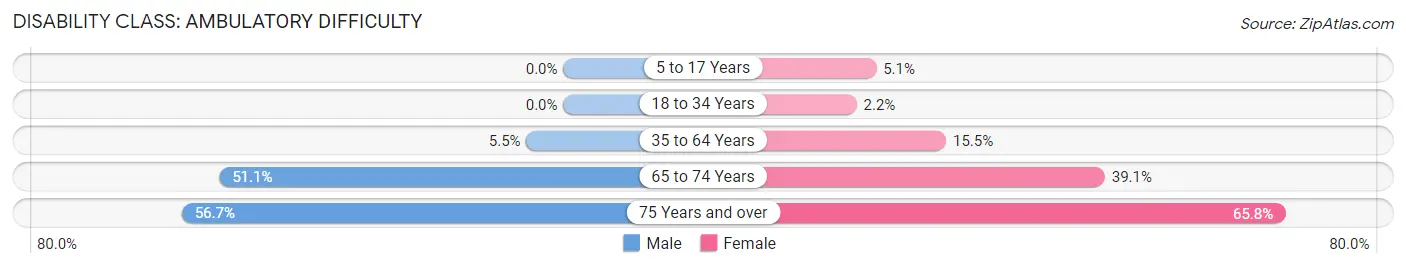
| Age Bracket | Male | Female |
| 5 to 17 Years | 0 (0.0%) | 30 (5.1%) |
| 18 to 34 Years | 0 (0.0%) | 17 (2.2%) |
| 35 to 64 Years | 52 (5.5%) | 195 (15.5%) |
| 65 to 74 Years | 162 (51.1%) | 91 (39.1%) |
| 75 Years and over | 85 (56.7%) | 102 (65.8%) |
Disability Class: Self-Care Difficulty
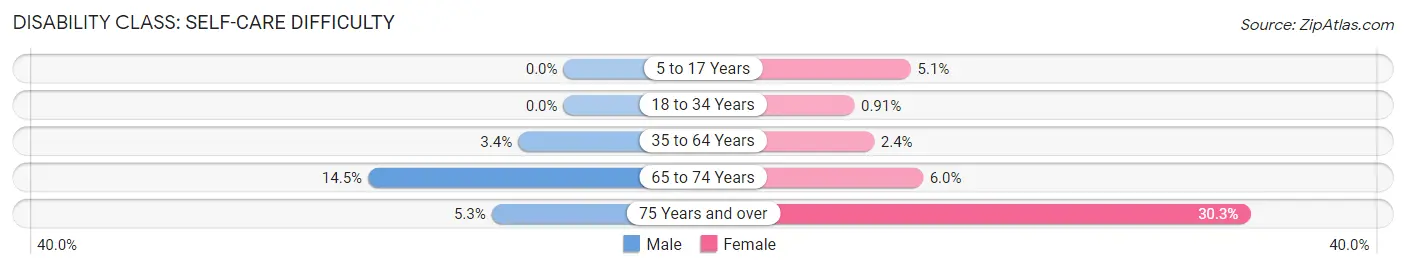
| Age Bracket | Male | Female |
| 5 to 17 Years | 0 (0.0%) | 30 (5.1%) |
| 18 to 34 Years | 0 (0.0%) | 7 (0.9%) |
| 35 to 64 Years | 32 (3.4%) | 30 (2.4%) |
| 65 to 74 Years | 46 (14.5%) | 14 (6.0%) |
| 75 Years and over | 8 (5.3%) | 47 (30.3%) |
Technology Access in Chickasaw
Computing Device Access in Chickasaw
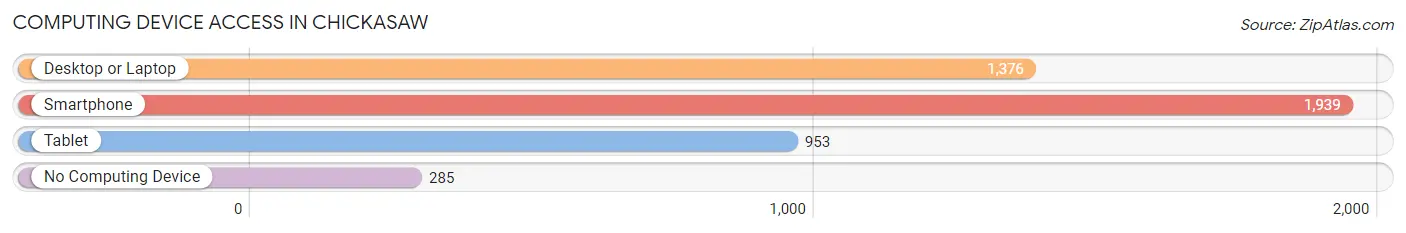
| Device Type | # Households | % Households |
| Desktop or Laptop | 1,376 | 57.8% |
| Smartphone | 1,939 | 81.5% |
| Tablet | 953 | 40.1% |
| No Computing Device | 285 | 12.0% |
| Total | 2,379 | 100.0% |
Internet Access in Chickasaw
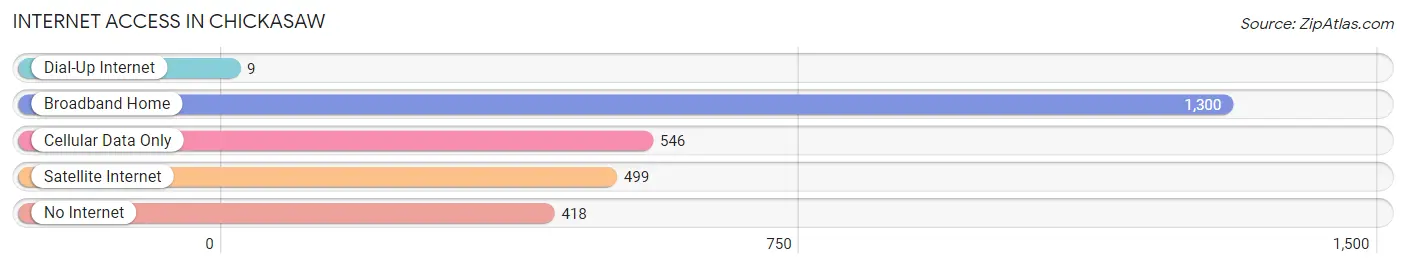
| Internet Type | # Households | % Households |
| Dial-Up Internet | 9 | 0.4% |
| Broadband Home | 1,300 | 54.6% |
| Cellular Data Only | 546 | 23.0% |
| Satellite Internet | 499 | 21.0% |
| No Internet | 418 | 17.6% |
| Total | 2,379 | 100.0% |
Chickasaw Summary
Chickasaw, Alabama is a small city located in Mobile County, Alabama. It is part of the Mobile metropolitan area and is located approximately 15 miles north of downtown Mobile. The city has a population of 8,113 as of the 2010 census.
History
Chickasaw was founded in 1822 and was originally known as "Chickasaw Bluff". The city was named after the Chickasaw Native American tribe, which had a settlement in the area. The city was incorporated in 1887 and was the first city in Mobile County to be incorporated.
The city was an important port during the 19th century and was a major shipping point for cotton and other goods. The city was also a major railroad hub and was the site of the first railroad bridge across the Mobile River.
Geography
Chickasaw is located at 30°45'25" North, 88°7'25" West (30.756944, -88.123611). The city is located on the Mobile River and is bordered by the cities of Mobile, Prichard, and Saraland.
The city has a total area of 8.2 square miles, of which 8.1 square miles is land and 0.1 square miles is water. The city is located in the Mobile-Tensaw Delta, which is a large wetland area.
Economy
The economy of Chickasaw is largely based on manufacturing and retail. The city is home to several large manufacturing plants, including a paper mill, a steel mill, and a chemical plant. The city is also home to several retail stores, including a Walmart Supercenter and a Lowe's Home Improvement store.
Demographics
As of the 2010 census, there were 8,113 people, 3,072 households, and 2,092 families residing in the city. The population density was 997.3 people per square mile. The racial makeup of the city was 68.2% White, 28.2% African American, 0.4% Native American, 0.7% Asian, 0.1% Pacific Islander, 0.7% from other races, and 1.7% from two or more races. Hispanic or Latino of any race were 2.2% of the population.
The median income for a household in the city was $37,917, and the median income for a family was $45,917. The per capita income for the city was $18,917. About 17.2% of families and 20.2% of the population were below the poverty line, including 28.2% of those under age 18 and 11.2% of those age 65 or over.
Conclusion
Chickasaw, Alabama is a small city located in Mobile County, Alabama. It is part of the Mobile metropolitan area and is located approximately 15 miles north of downtown Mobile. The city has a population of 8,113 as of the 2010 census. The city was founded in 1822 and was originally known as "Chickasaw Bluff". The city was named after the Chickasaw Native American tribe, which had a settlement in the area. The city was an important port during the 19th century and was a major shipping point for cotton and other goods. The economy of Chickasaw is largely based on manufacturing and retail. The city is home to several large manufacturing plants, including a paper mill, a steel mill, and a chemical plant. The city is also home to several retail stores, including a Walmart Supercenter and a Lowe's Home Improvement store. As of the 2010 census, there were 8,113 people, 3,072 households, and 2,092 families residing in the city. The median income for a household in the city was $37,917, and the median income for a family was $45,917. The per capita income for the city was $18,917. About 17.2% of families and 20.2% of the population were below the poverty line, including 28.2% of those under age 18 and 11.2% of those age 65 or over.
Common Questions
What is the Total Population of Chickasaw?
Total Population of Chickasaw is 6,398.
What is the Total Male Population of Chickasaw?
Total Male Population of Chickasaw is 3,177.
What is the Total Female Population of Chickasaw?
Total Female Population of Chickasaw is 3,221.
What is the Ratio of Males per 100 Females in Chickasaw?
There are 98.63 Males per 100 Females in Chickasaw.
What is the Ratio of Females per 100 Males in Chickasaw?
There are 101.38 Females per 100 Males in Chickasaw.
What is the Median Population Age in Chickasaw?
Median Population Age in Chickasaw is 33.3 Years.
What is the Average Family Size in Chickasaw
Average Family Size in Chickasaw is 3.5 People.
What is the Average Household Size in Chickasaw
Average Household Size in Chickasaw is 2.7 People.
What is Per Capita Income in Chickasaw?
Per Capita income in Chickasaw is $21,426.
What is the Median Family Income in Chickasaw?
Median Family Income in Chickasaw is $49,189.
What is the Median Household income in Chickasaw?
Median Household Income in Chickasaw is $38,985.
What is Income or Wage Gap in Chickasaw?
Income or Wage Gap in Chickasaw is 24.0%.
Women in Chickasaw earn 76.0 cents for every dollar earned by a man.
What is Inequality or Gini Index in Chickasaw?
Inequality or Gini Index in Chickasaw is 0.48.
How Large is the Labor Force in Chickasaw?
There are 2,865 People in the Labor Forcein in Chickasaw.
What is the Percentage of People in the Labor Force in Chickasaw?
59.2% of People are in the Labor Force in Chickasaw.
What is the Unemployment Rate in Chickasaw?
Unemployment Rate in Chickasaw is 4.7%.