Wilcox County, AL
Wilcox County Map
Wilcox County Overview
10,441
TOTAL POPULATION
4,892
MALE POPULATION
5,549
FEMALE POPULATION
88.16
MALES / 100 FEMALES
113.43
FEMALES / 100 MALES
41.1
MEDIAN AGE
3.8
AVG FAMILY SIZE
2.9
AVG HOUSEHOLD SIZE
$20,442
PER CAPITA INCOME
$46,269
AVG FAMILY INCOME
$38,208
AVG HOUSEHOLD INCOME
41.9%
WAGE / INCOME GAP [ % ]
58.1¢/ $1
WAGE / INCOME GAP [ $ ]
$9,657
FAMILY INCOME DEFICIT
0.46
INEQUALITY / GINI INDEX
3,748
LABOR FORCE [ PEOPLE ]
44.8%
PERCENT IN LABOR FORCE
10.7%
UNEMPLOYMENT RATE
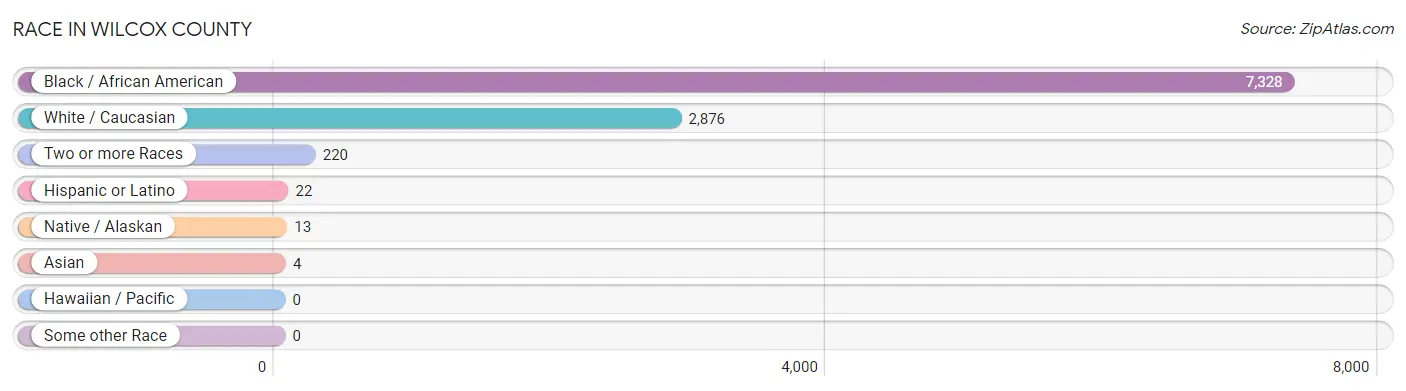
Race in Wilcox County
The most populous races in Wilcox County are Black / African American (7,328 | 70.2%), White / Caucasian (2,876 | 27.6%), and Two or more Races (220 | 2.1%).
| Race | # Population | % Population |
| Asian | 4 | 0.0% |
| Black / African American | 7,328 | 70.2% |
| Hawaiian / Pacific | 0 | 0.0% |
| Hispanic or Latino | 22 | 0.2% |
| Native / Alaskan | 13 | 0.1% |
| White / Caucasian | 2,876 | 27.6% |
| Two or more Races | 220 | 2.1% |
| Some other Race | 0 | 0.0% |
| Total | 10,441 | 100.0% |
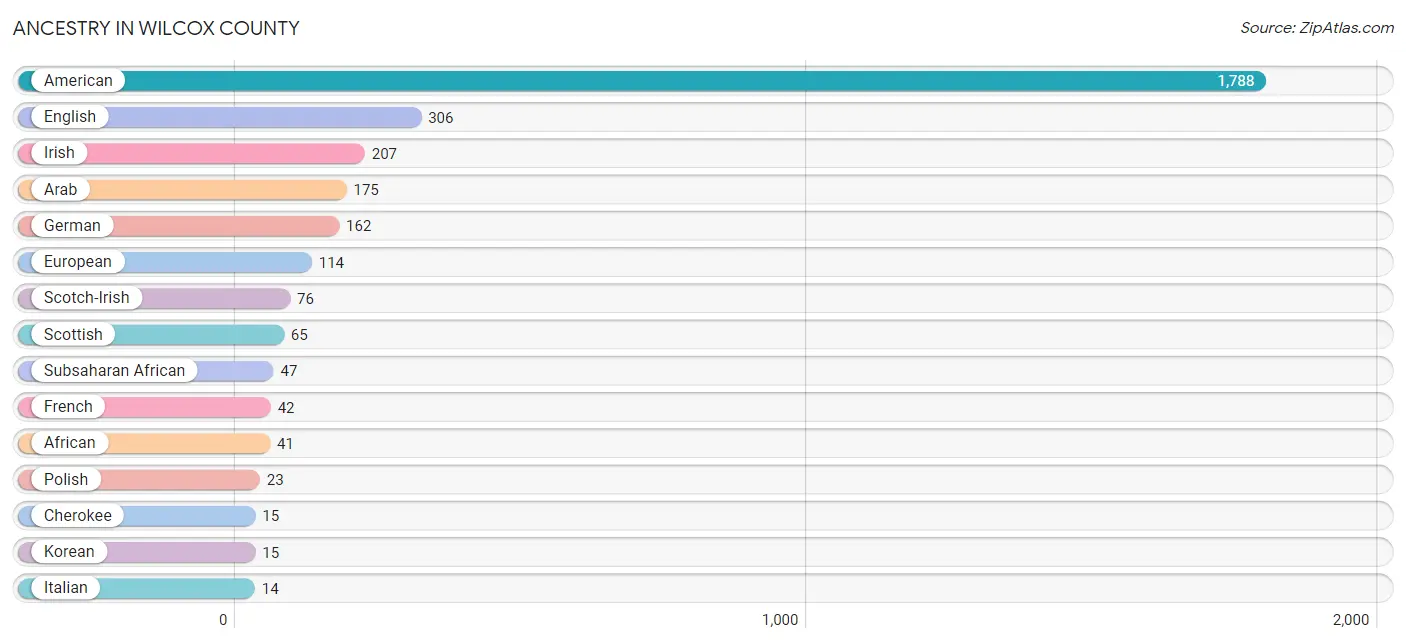
Ancestry in Wilcox County
The most populous ancestries reported in Wilcox County are American (1,788 | 17.1%), English (306 | 2.9%), Irish (207 | 2.0%), Arab (175 | 1.7%), and German (162 | 1.5%), together accounting for 25.3% of all Wilcox County residents.
| Ancestry | # Population | % Population |
| African | 41 | 0.4% |
| Alaska Native | 5 | 0.1% |
| American | 1,788 | 17.1% |
| Arab | 175 | 1.7% |
| Belgian | 7 | 0.1% |
| British | 3 | 0.0% |
| Cherokee | 15 | 0.1% |
| Colombian | 1 | 0.0% |
| Creek | 2 | 0.0% |
| Czech | 13 | 0.1% |
| Czechoslovakian | 8 | 0.1% |
| Danish | 6 | 0.1% |
| English | 306 | 2.9% |
| European | 114 | 1.1% |
| French | 42 | 0.4% |
| German | 162 | 1.5% |
| Irish | 207 | 2.0% |
| Italian | 14 | 0.1% |
| Korean | 15 | 0.1% |
| Mexican | 6 | 0.1% |
| Northern European | 8 | 0.1% |
| Norwegian | 11 | 0.1% |
| Polish | 23 | 0.2% |
| Puerto Rican | 9 | 0.1% |
| Russian | 9 | 0.1% |
| Scotch-Irish | 76 | 0.7% |
| Scottish | 65 | 0.6% |
| South African | 6 | 0.1% |
| South American | 1 | 0.0% |
| Subsaharan African | 47 | 0.4% |
| Swedish | 7 | 0.1% | View All 31 Rows |
Immigrants in Wilcox County
The most numerous immigrant groups reported in Wilcox County came from Asia (42 | 0.4%), Western Asia (42 | 0.4%), Yemen (42 | 0.4%), Latin America (7 | 0.1%), and Central America (6 | 0.1%), together accounting for 1.3% of all Wilcox County residents.

| Immigration Origin | # Population | % Population |
| Asia | 42 | 0.4% |
| Central America | 6 | 0.1% |
| Colombia | 1 | 0.0% |
| England | 5 | 0.1% |
| Europe | 5 | 0.1% |
| Latin America | 7 | 0.1% |
| Mexico | 6 | 0.1% |
| Northern Europe | 5 | 0.1% |
| South America | 1 | 0.0% |
| Western Asia | 42 | 0.4% |
| Yemen | 42 | 0.4% | View All 11 Rows |
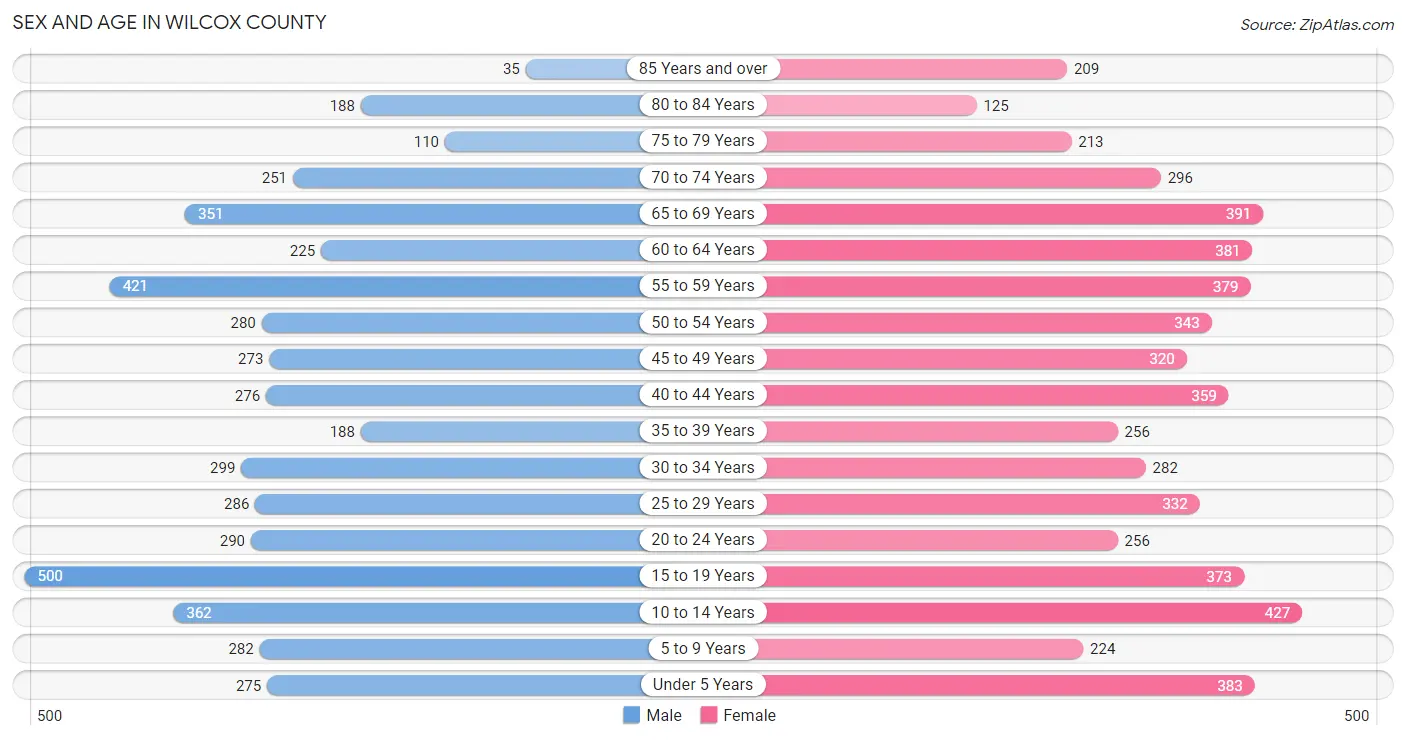
Sex and Age in Wilcox County
Sex and Age in Wilcox County
The most populous age groups in Wilcox County are 15 to 19 Years (500 | 10.2%) for men and 10 to 14 Years (427 | 7.7%) for women.
| Age Bracket | Male | Female |
| Under 5 Years | 275 (5.6%) | 383 (6.9%) |
| 5 to 9 Years | 282 (5.8%) | 224 (4.0%) |
| 10 to 14 Years | 362 (7.4%) | 427 (7.7%) |
| 15 to 19 Years | 500 (10.2%) | 373 (6.7%) |
| 20 to 24 Years | 290 (5.9%) | 256 (4.6%) |
| 25 to 29 Years | 286 (5.9%) | 332 (6.0%) |
| 30 to 34 Years | 299 (6.1%) | 282 (5.1%) |
| 35 to 39 Years | 188 (3.8%) | 256 (4.6%) |
| 40 to 44 Years | 276 (5.6%) | 359 (6.5%) |
| 45 to 49 Years | 273 (5.6%) | 320 (5.8%) |
| 50 to 54 Years | 280 (5.7%) | 343 (6.2%) |
| 55 to 59 Years | 421 (8.6%) | 379 (6.8%) |
| 60 to 64 Years | 225 (4.6%) | 381 (6.9%) |
| 65 to 69 Years | 351 (7.2%) | 391 (7.0%) |
| 70 to 74 Years | 251 (5.1%) | 296 (5.3%) |
| 75 to 79 Years | 110 (2.2%) | 213 (3.8%) |
| 80 to 84 Years | 188 (3.8%) | 125 (2.2%) |
| 85 Years and over | 35 (0.7%) | 209 (3.8%) |
| Total | 4,892 (100.0%) | 5,549 (100.0%) |
Families and Households in Wilcox County
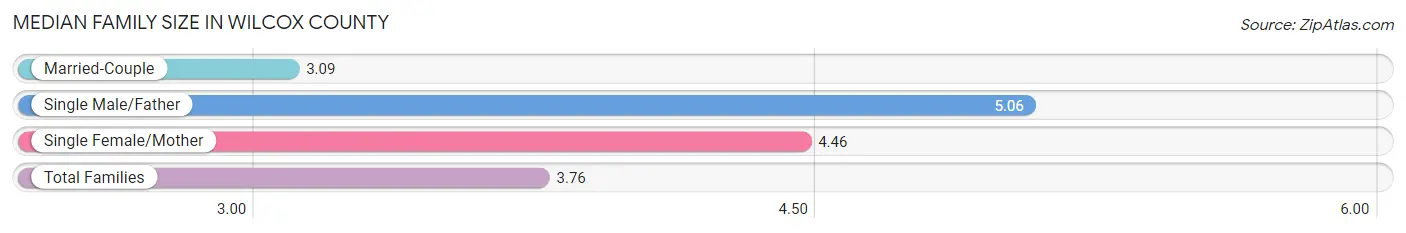
Median Family Size in Wilcox County
The median family size in Wilcox County is 3.76 persons per family, with single male/father families (114 | 5.0%) accounting for the largest median family size of 5.06 persons per family. On the other hand, married-couple families (1,218 | 53.2%) represent the smallest median family size with 3.09 persons per family.
| Family Type | # Families | Family Size |
| Married-Couple | 1,218 (53.2%) | 3.09 |
| Single Male/Father | 114 (5.0%) | 5.06 |
| Single Female/Mother | 956 (41.8%) | 4.46 |
| Total Families | 2,288 (100.0%) | 3.76 |
Median Household Size in Wilcox County
The median household size in Wilcox County is 2.86 persons per household, with single male/father households (114 | 3.2%) accounting for the largest median household size of 5.24 persons per household. non-family households (1,291 | 36.1%) represent the smallest median household size with 1.14 persons per household.

| Household Type | # Households | Household Size |
| Married-Couple | 1,218 (34.0%) | 3.12 |
| Single Male/Father | 114 (3.2%) | 5.24 |
| Single Female/Mother | 956 (26.7%) | 4.57 |
| Non-family | 1,291 (36.1%) | 1.14 |
| Total Households | 3,579 (100.0%) | 2.86 |
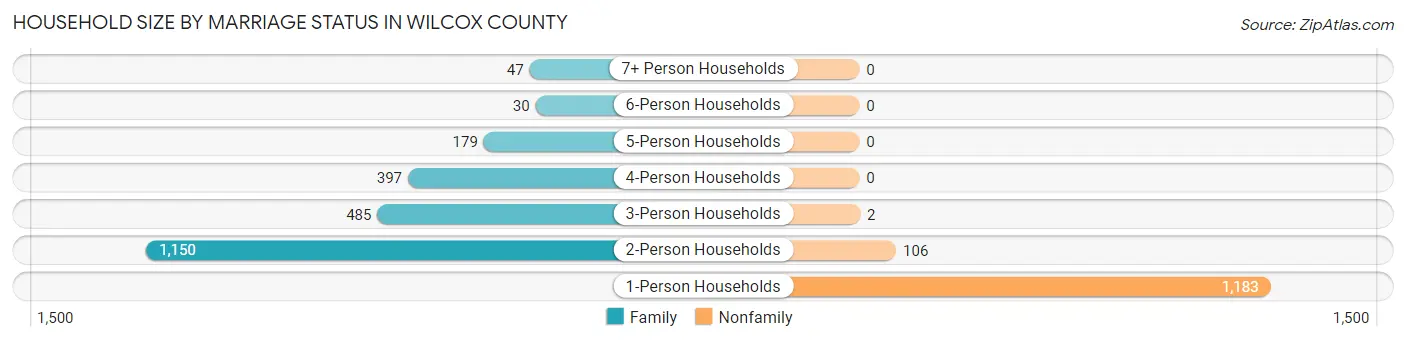
Household Size by Marriage Status in Wilcox County
Out of a total of 3,579 households in Wilcox County, 2,288 (63.9%) are family households, while 1,291 (36.1%) are nonfamily households. The most numerous type of family households are 2-person households, comprising 1,150, and the most common type of nonfamily households are 1-person households, comprising 1,183.
| Household Size | Family Households | Nonfamily Households |
| 1-Person Households | - | 1,183 (33.1%) |
| 2-Person Households | 1,150 (32.1%) | 106 (3.0%) |
| 3-Person Households | 485 (13.6%) | 2 (0.1%) |
| 4-Person Households | 397 (11.1%) | 0 (0.0%) |
| 5-Person Households | 179 (5.0%) | 0 (0.0%) |
| 6-Person Households | 30 (0.8%) | 0 (0.0%) |
| 7+ Person Households | 47 (1.3%) | 0 (0.0%) |
| Total | 2,288 (63.9%) | 1,291 (36.1%) |
Female Fertility in Wilcox County
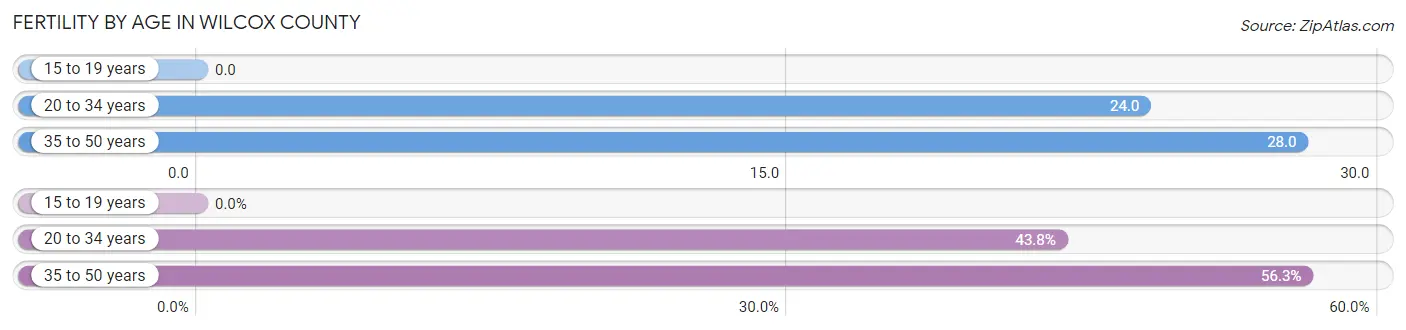
Fertility by Age in Wilcox County
Average fertility rate in Wilcox County is 22.0 births per 1,000 women. Women in the age bracket of 35 to 50 years have the highest fertility rate with 28.0 births per 1,000 women. Women in the age bracket of 35 to 50 years acount for 56.2% of all women with births.
| Age Bracket | Women with Births | Births / 1,000 Women |
| 15 to 19 years | 0 (0.0%) | 0.0 |
| 20 to 34 years | 21 (43.8%) | 24.0 |
| 35 to 50 years | 27 (56.2%) | 28.0 |
| Total | 48 (100.0%) | 22.0 |
Fertility by Age by Marriage Status in Wilcox County
72.9% of women with births (48) in Wilcox County are married. The highest percentage of unmarried women with births falls into 20 to 34 years age bracket with 61.9% of them unmarried at the time of birth, while the lowest percentage of unmarried women with births belong to 35 to 50 years age bracket with 0.0% of them unmarried.

| Age Bracket | Married | Unmarried |
| 15 to 19 years | 0 (0.0%) | 0 (0.0%) |
| 20 to 34 years | 8 (38.1%) | 13 (61.9%) |
| 35 to 50 years | 27 (100.0%) | 0 (0.0%) |
| Total | 35 (72.9%) | 13 (27.1%) |
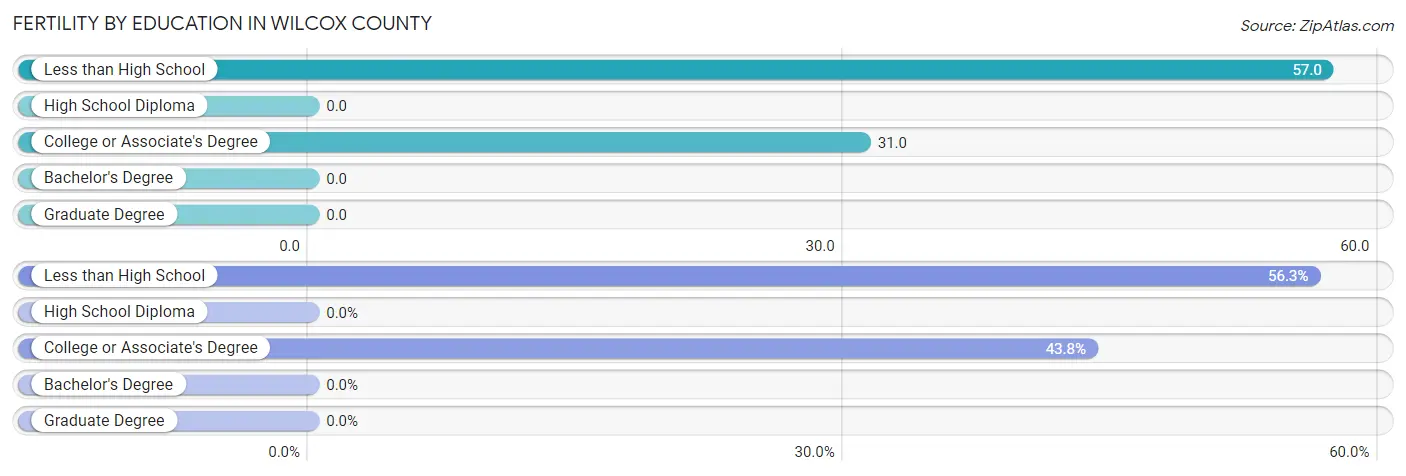
Fertility by Education in Wilcox County
| Educational Attainment | Women with Births | Births / 1,000 Women |
| Less than High School | 27 (56.2%) | 57.0 |
| High School Diploma | 0 (0.0%) | 0.0 |
| College or Associate's Degree | 21 (43.8%) | 31.0 |
| Bachelor's Degree | 0 (0.0%) | 0.0 |
| Graduate Degree | 0 (0.0%) | 0.0 |
| Total | 48 (100.0%) | 22.0 |
Fertility by Education by Marriage Status in Wilcox County
27.1% of women with births in Wilcox County are unmarried. Women with the educational attainment of less than high school are most likely to be married with 100.0% of them married at childbirth, while women with the educational attainment of college or associate's degree are least likely to be married with 61.9% of them unmarried at childbirth.
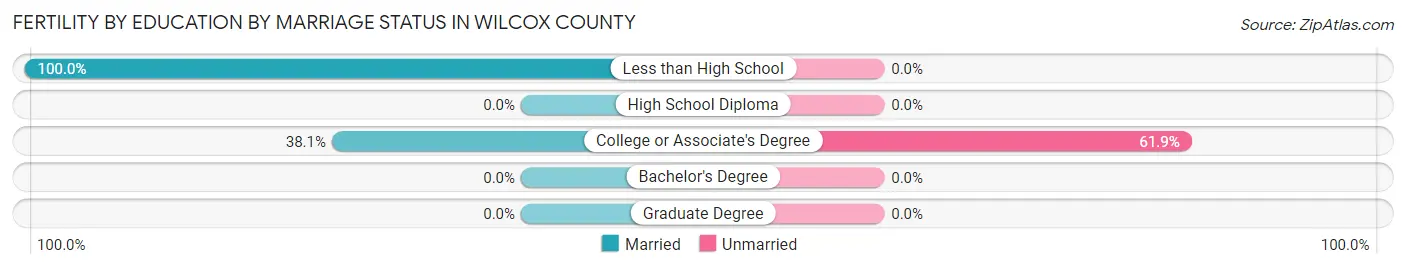
| Educational Attainment | Married | Unmarried |
| Less than High School | 27 (100.0%) | 0 (0.0%) |
| High School Diploma | 0 (0.0%) | 0 (0.0%) |
| College or Associate's Degree | 8 (38.1%) | 13 (61.9%) |
| Bachelor's Degree | 0 (0.0%) | 0 (0.0%) |
| Graduate Degree | 0 (0.0%) | 0 (0.0%) |
| Total | 35 (72.9%) | 13 (27.1%) |
Income in Wilcox County
Income Overview in Wilcox County
Per Capita Income in Wilcox County is $20,442, while median incomes of families and households are $46,269 and $38,208 respectively.
| Characteristic | Number | Measure |
| Per Capita Income | 10,441 | $20,442 |
| Median Family Income | 2,288 | $46,269 |
| Mean Family Income | 2,288 | $61,295 |
| Median Household Income | 3,579 | $38,208 |
| Mean Household Income | 3,579 | $50,522 |
| Income Deficit | 2,288 | $9,657 |
| Wage / Income Gap (%) | 10,441 | 41.93% |
| Wage / Income Gap ($) | 10,441 | 58.07¢ per $1 |
| Gini / Inequality Index | 10,441 | 0.46 |
Earnings by Sex in Wilcox County
Average Earnings in Wilcox County are $30,614, $37,267 for men and $21,641 for women, a difference of 41.9%.
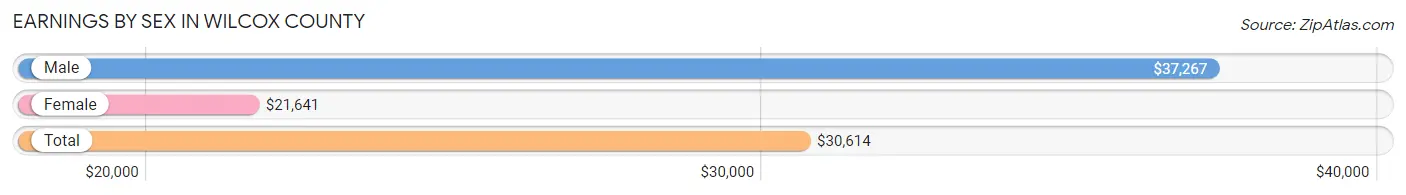
| Sex | Number | Average Earnings |
| Male | 1,838 (49.0%) | $37,267 |
| Female | 1,909 (50.9%) | $21,641 |
| Total | 3,747 (100.0%) | $30,614 |
Earnings by Sex by Income Bracket in Wilcox County
The most common earnings brackets in Wilcox County are $55,000 to $64,999 for men (273 | 14.8%) and $30,000 to $34,999 for women (280 | 14.7%).
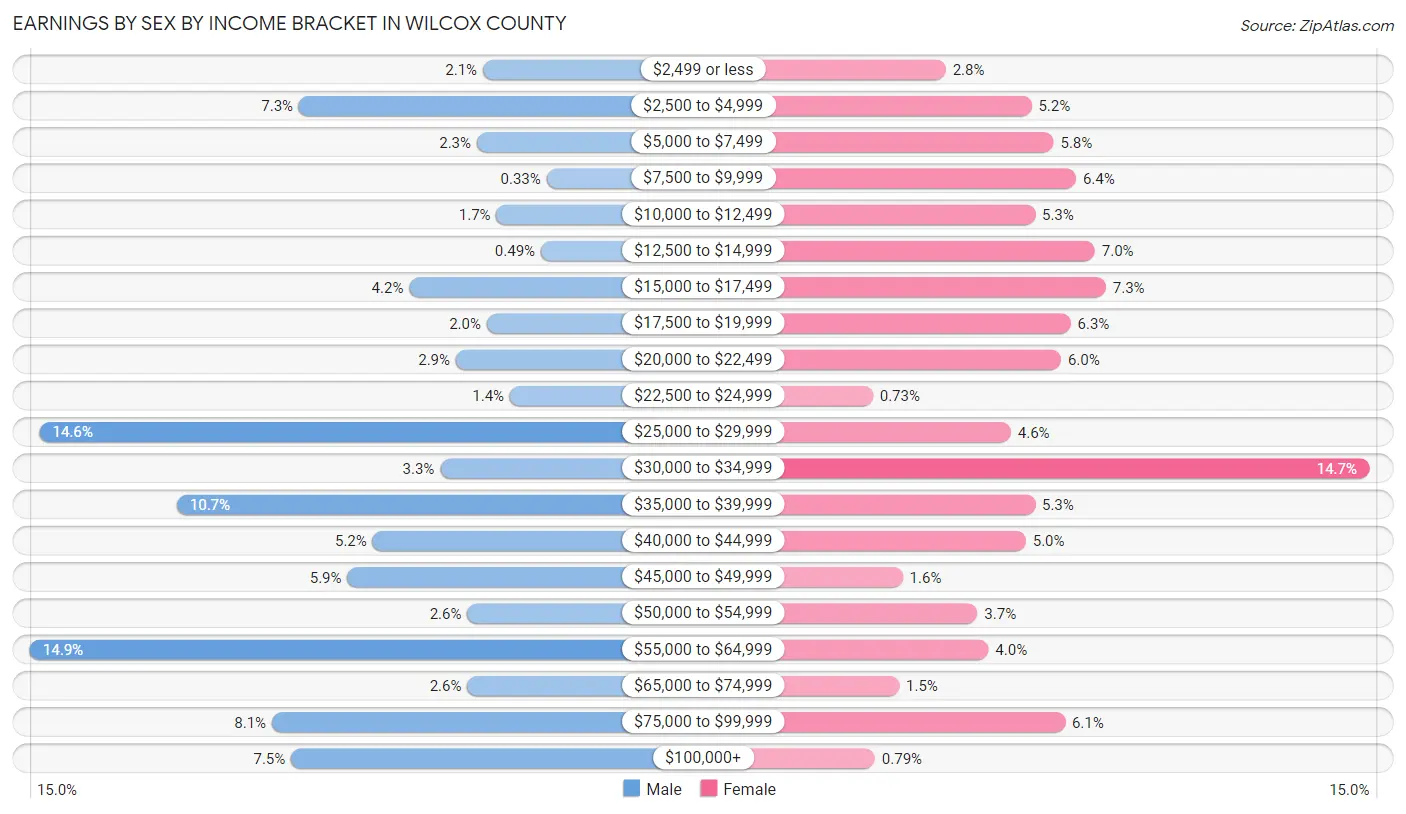
| Income | Male | Female |
| $2,499 or less | 39 (2.1%) | 53 (2.8%) |
| $2,500 to $4,999 | 134 (7.3%) | 99 (5.2%) |
| $5,000 to $7,499 | 42 (2.3%) | 111 (5.8%) |
| $7,500 to $9,999 | 6 (0.3%) | 123 (6.4%) |
| $10,000 to $12,499 | 32 (1.7%) | 101 (5.3%) |
| $12,500 to $14,999 | 9 (0.5%) | 133 (7.0%) |
| $15,000 to $17,499 | 77 (4.2%) | 139 (7.3%) |
| $17,500 to $19,999 | 37 (2.0%) | 120 (6.3%) |
| $20,000 to $22,499 | 53 (2.9%) | 115 (6.0%) |
| $22,500 to $24,999 | 25 (1.4%) | 14 (0.7%) |
| $25,000 to $29,999 | 268 (14.6%) | 88 (4.6%) |
| $30,000 to $34,999 | 61 (3.3%) | 280 (14.7%) |
| $35,000 to $39,999 | 197 (10.7%) | 101 (5.3%) |
| $40,000 to $44,999 | 96 (5.2%) | 96 (5.0%) |
| $45,000 to $49,999 | 109 (5.9%) | 30 (1.6%) |
| $50,000 to $54,999 | 47 (2.6%) | 70 (3.7%) |
| $55,000 to $64,999 | 273 (14.8%) | 76 (4.0%) |
| $65,000 to $74,999 | 47 (2.6%) | 28 (1.5%) |
| $75,000 to $99,999 | 148 (8.1%) | 117 (6.1%) |
| $100,000+ | 138 (7.5%) | 15 (0.8%) |
| Total | 1,838 (100.0%) | 1,909 (100.0%) |
Earnings by Sex by Educational Attainment in Wilcox County
Average earnings in Wilcox County are $39,814 for men and $28,125 for women, a difference of 29.4%. Men with an educational attainment of bachelor's degree enjoy the highest average annual earnings of $72,321, while those with less than high school education earn the least with $29,102. Women with an educational attainment of graduate degree earn the most with the average annual earnings of $63,333, while those with high school diploma education have the smallest earnings of $22,083.
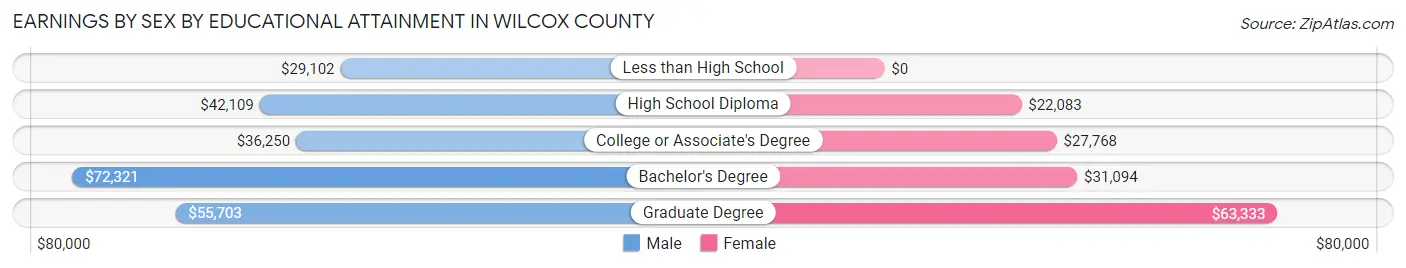
| Educational Attainment | Male Income | Female Income |
| Less than High School | $29,102 | $0 |
| High School Diploma | $42,109 | $22,083 |
| College or Associate's Degree | $36,250 | $27,768 |
| Bachelor's Degree | $72,321 | $31,094 |
| Graduate Degree | $55,703 | $63,333 |
| Total | $39,814 | $28,125 |
Family Income in Wilcox County
Family Income Brackets in Wilcox County
According to the Wilcox County family income data, there are 371 families falling into the $50,000 to $74,999 income range, which is the most common income bracket and makes up 16.2% of all families. Conversely, the $200,000+ income bracket is the least frequent group with only 39 families (1.7%) belonging to this category.
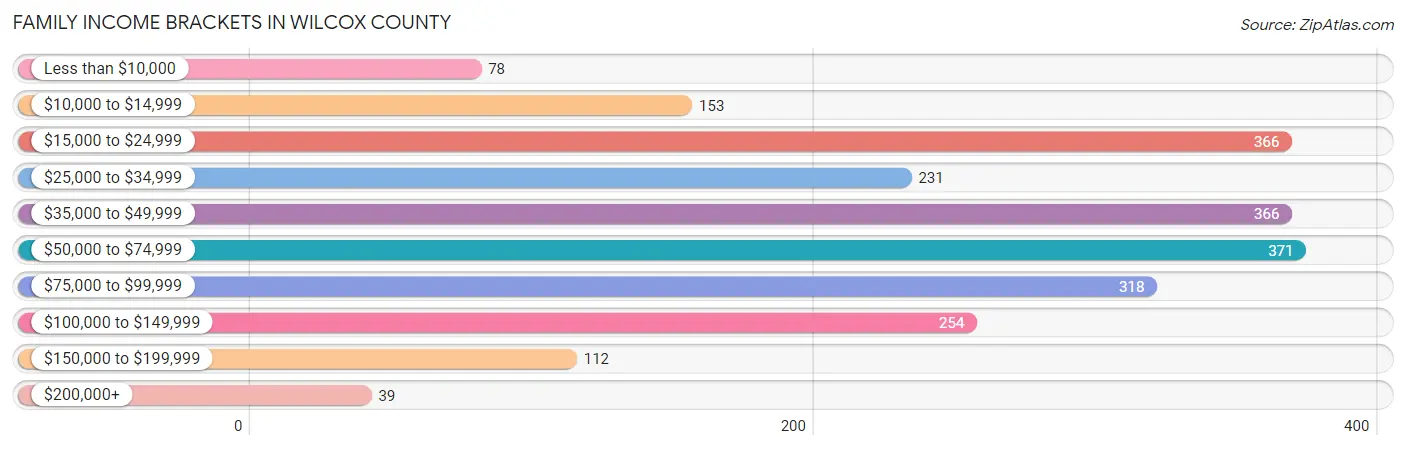
| Income Bracket | # Families | % Families |
| Less than $10,000 | 78 | 3.4% |
| $10,000 to $14,999 | 153 | 6.7% |
| $15,000 to $24,999 | 366 | 16.0% |
| $25,000 to $34,999 | 231 | 10.1% |
| $35,000 to $49,999 | 366 | 16.0% |
| $50,000 to $74,999 | 371 | 16.2% |
| $75,000 to $99,999 | 318 | 13.9% |
| $100,000 to $149,999 | 254 | 11.1% |
| $150,000 to $199,999 | 112 | 4.9% |
| $200,000+ | 39 | 1.7% |
Family Income by Famaliy Size in Wilcox County
6-person families (25 | 1.1%) account for the highest median family income in Wilcox County with $69,018 per family, while 2-person families (1,187 | 51.9%) have the highest median income of $22,370 per family member.
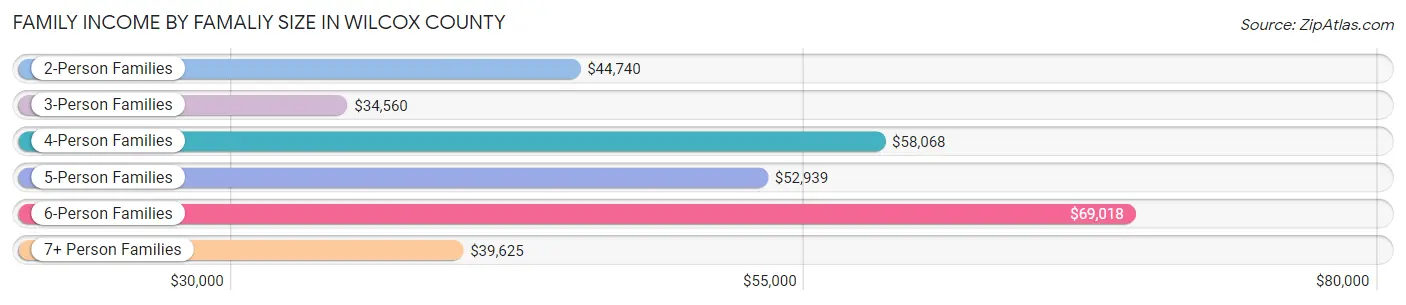
| Income Bracket | # Families | Median Income |
| 2-Person Families | 1,187 (51.9%) | $44,740 |
| 3-Person Families | 503 (22.0%) | $34,560 |
| 4-Person Families | 342 (14.9%) | $58,068 |
| 5-Person Families | 198 (8.6%) | $52,939 |
| 6-Person Families | 25 (1.1%) | $69,018 |
| 7+ Person Families | 33 (1.4%) | $39,625 |
| Total | 2,288 (100.0%) | $46,269 |
Family Income by Number of Earners in Wilcox County
The median family income in Wilcox County is $46,269, with families comprising 3+ earners (167) having the highest median family income of $125,842, while families with no earners (722) have the lowest median family income of $25,278, accounting for 7.3% and 31.6% of families, respectively.
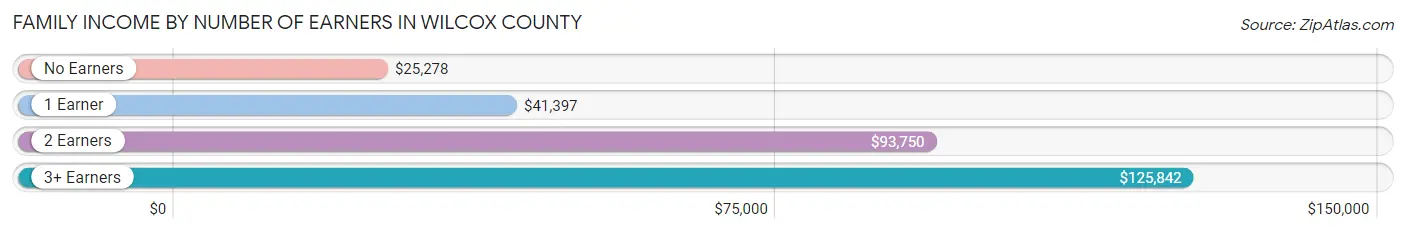
| Number of Earners | # Families | Median Income |
| No Earners | 722 (31.6%) | $25,278 |
| 1 Earner | 881 (38.5%) | $41,397 |
| 2 Earners | 518 (22.6%) | $93,750 |
| 3+ Earners | 167 (7.3%) | $125,842 |
| Total | 2,288 (100.0%) | $46,269 |
Household Income in Wilcox County
Household Income Brackets in Wilcox County
With 605 households falling in the category, the $35,000 to $49,999 income range is the most frequent in Wilcox County, accounting for 16.9% of all households. In contrast, only 39 households (1.1%) fall into the $200,000+ income bracket, making it the least populous group.
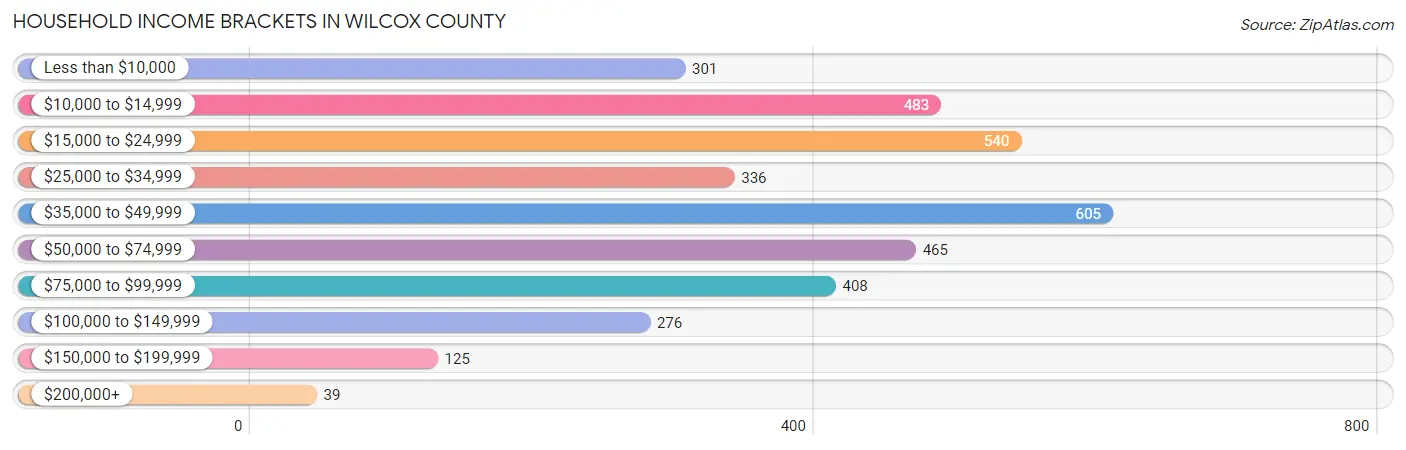
| Income Bracket | # Households | % Households |
| Less than $10,000 | 301 | 8.4% |
| $10,000 to $14,999 | 483 | 13.5% |
| $15,000 to $24,999 | 540 | 15.1% |
| $25,000 to $34,999 | 336 | 9.4% |
| $35,000 to $49,999 | 605 | 16.9% |
| $50,000 to $74,999 | 465 | 13.0% |
| $75,000 to $99,999 | 408 | 11.4% |
| $100,000 to $149,999 | 276 | 7.7% |
| $150,000 to $199,999 | 125 | 3.5% |
| $200,000+ | 39 | 1.1% |
Household Income by Householder Age in Wilcox County
The median household income in Wilcox County is $38,208, with the highest median household income of $40,199 found in the 25 to 44 years age bracket for the primary householder. A total of 649 households (18.1%) fall into this category. Meanwhile, the 15 to 24 years age bracket for the primary householder has the lowest median household income of $0, with 27 households (0.7%) in this group.
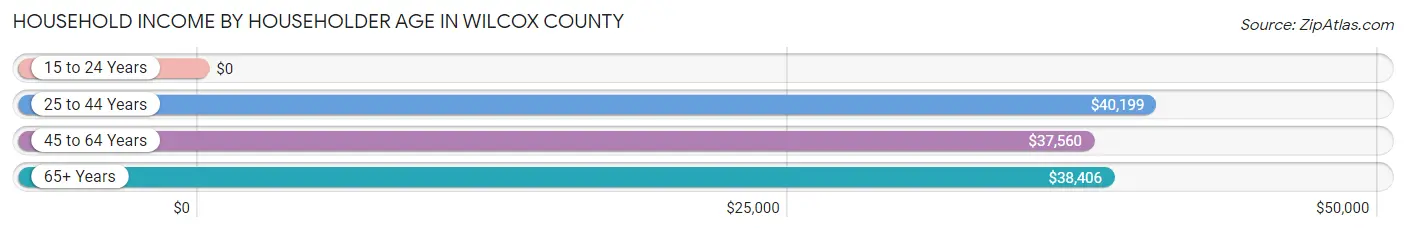
| Income Bracket | # Households | Median Income |
| 15 to 24 Years | 27 (0.7%) | $0 |
| 25 to 44 Years | 649 (18.1%) | $40,199 |
| 45 to 64 Years | 1,519 (42.4%) | $37,560 |
| 65+ Years | 1,384 (38.7%) | $38,406 |
| Total | 3,579 (100.0%) | $38,208 |
Poverty in Wilcox County
Income Below Poverty by Sex and Age in Wilcox County
With 23.9% poverty level for males and 29.2% for females among the residents of Wilcox County, 6 to 11 year old males and 6 to 11 year old females are the most vulnerable to poverty, with 256 males (57.3%) and 259 females (67.3%) in their respective age groups living below the poverty level.
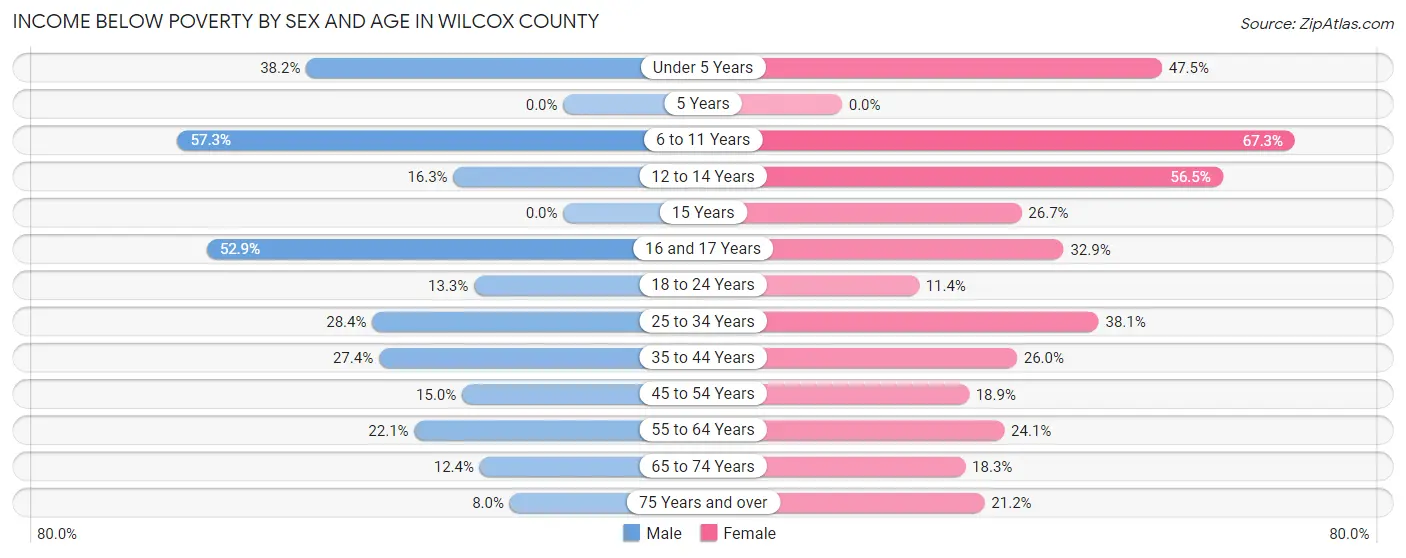
| Age Bracket | Male | Female |
| Under 5 Years | 105 (38.2%) | 182 (47.5%) |
| 5 Years | 0 (0.0%) | 0 (0.0%) |
| 6 to 11 Years | 256 (57.3%) | 259 (67.3%) |
| 12 to 14 Years | 31 (16.3%) | 121 (56.5%) |
| 15 Years | 0 (0.0%) | 8 (26.7%) |
| 16 and 17 Years | 81 (52.9%) | 53 (32.9%) |
| 18 to 24 Years | 71 (13.3%) | 50 (11.4%) |
| 25 to 34 Years | 160 (28.4%) | 220 (38.1%) |
| 35 to 44 Years | 118 (27.4%) | 158 (26.0%) |
| 45 to 54 Years | 81 (15.0%) | 125 (18.9%) |
| 55 to 64 Years | 142 (22.1%) | 182 (24.1%) |
| 65 to 74 Years | 71 (12.4%) | 124 (18.3%) |
| 75 Years and over | 26 (8.0%) | 111 (21.2%) |
| Total | 1,142 (23.9%) | 1,593 (29.2%) |
Income Above Poverty by Sex and Age in Wilcox County
According to the poverty statistics in Wilcox County, males aged 5 years and females aged 5 years are the age groups that are most secure financially, with 100.0% of males and 100.0% of females in these age groups living above the poverty line.
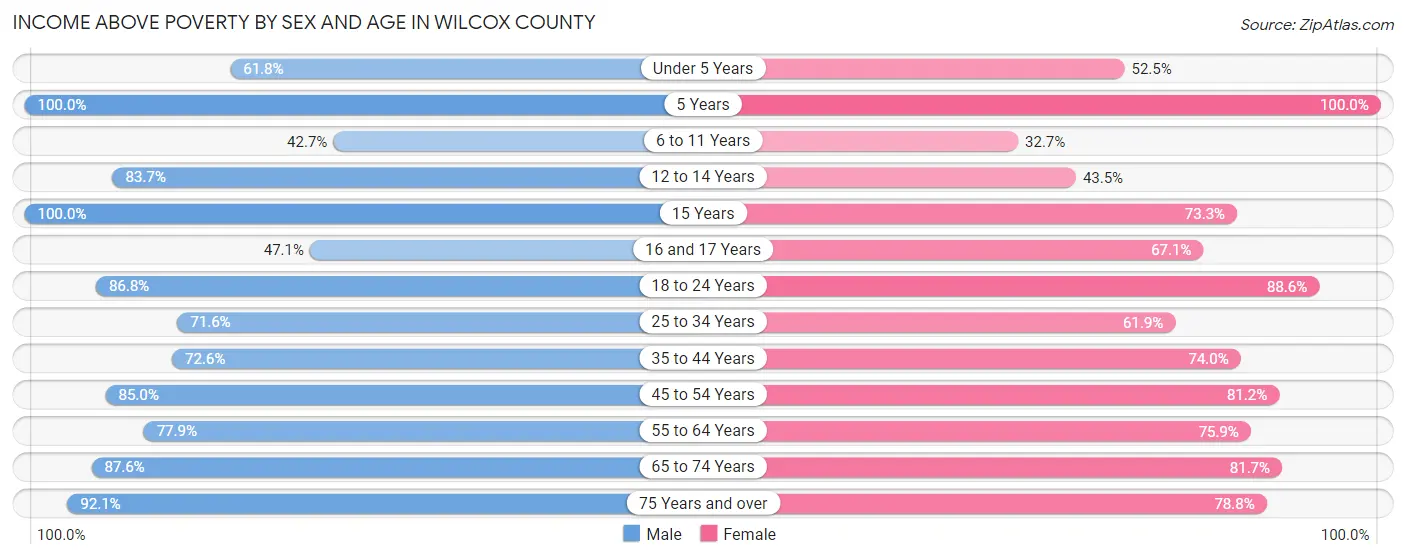
| Age Bracket | Male | Female |
| Under 5 Years | 170 (61.8%) | 201 (52.5%) |
| 5 Years | 5 (100.0%) | 32 (100.0%) |
| 6 to 11 Years | 191 (42.7%) | 126 (32.7%) |
| 12 to 14 Years | 159 (83.7%) | 93 (43.5%) |
| 15 Years | 91 (100.0%) | 22 (73.3%) |
| 16 and 17 Years | 72 (47.1%) | 108 (67.1%) |
| 18 to 24 Years | 465 (86.8%) | 388 (88.6%) |
| 25 to 34 Years | 404 (71.6%) | 357 (61.9%) |
| 35 to 44 Years | 313 (72.6%) | 450 (74.0%) |
| 45 to 54 Years | 458 (85.0%) | 538 (81.1%) |
| 55 to 64 Years | 500 (77.9%) | 573 (75.9%) |
| 65 to 74 Years | 501 (87.6%) | 553 (81.7%) |
| 75 Years and over | 301 (92.0%) | 413 (78.8%) |
| Total | 3,630 (76.1%) | 3,854 (70.8%) |
Income Below Poverty Among Married-Couple Families in Wilcox County
The poverty statistics for married-couple families in Wilcox County show that 4.7% or 57 of the total 1,218 families live below the poverty line. Families with 1 or 2 children have the highest poverty rate of 10.8%, comprising of 25 families. On the other hand, families with 3 or 4 children have the lowest poverty rate of 0.0%, which includes 0 families.
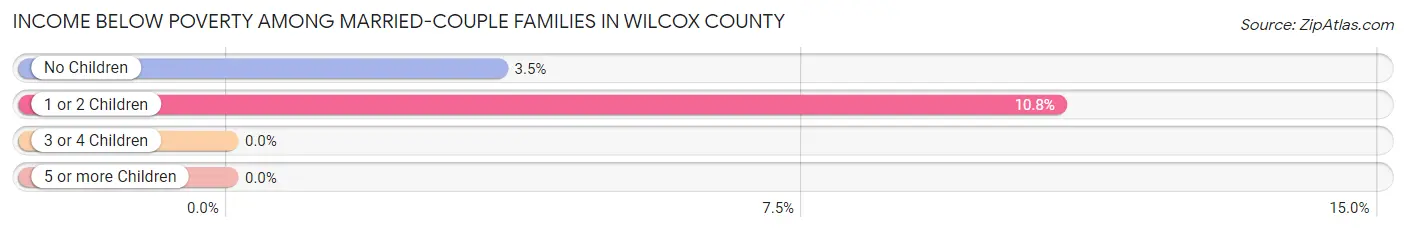
| Children | Above Poverty | Below Poverty |
| No Children | 877 (96.5%) | 32 (3.5%) |
| 1 or 2 Children | 206 (89.2%) | 25 (10.8%) |
| 3 or 4 Children | 78 (100.0%) | 0 (0.0%) |
| 5 or more Children | 0 (0.0%) | 0 (0.0%) |
| Total | 1,161 (95.3%) | 57 (4.7%) |
Income Below Poverty Among Single-Parent Households in Wilcox County
According to the poverty data in Wilcox County, 57.0% or 65 single-father households and 34.3% or 328 single-mother households are living below the poverty line. Among single-father households, those with 1 or 2 children have the highest poverty rate, with 11 households (73.3%) experiencing poverty. Likewise, among single-mother households, those with 3 or 4 children have the highest poverty rate, with 123 households (89.8%) falling below the poverty line.
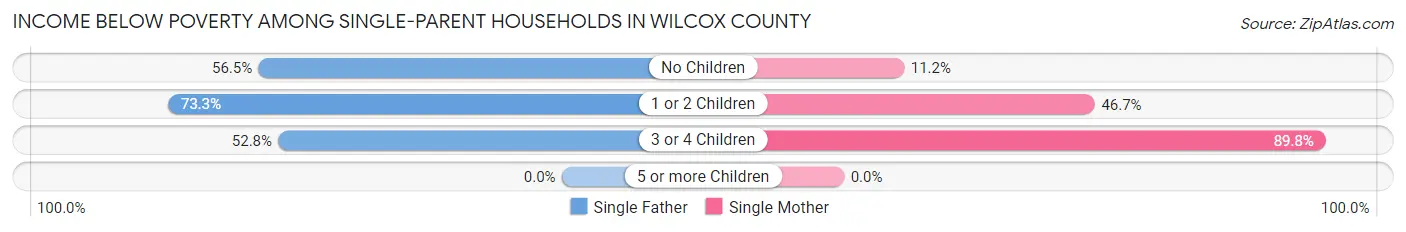
| Children | Single Father | Single Mother |
| No Children | 26 (56.5%) | 56 (11.2%) |
| 1 or 2 Children | 11 (73.3%) | 149 (46.7%) |
| 3 or 4 Children | 28 (52.8%) | 123 (89.8%) |
| 5 or more Children | 0 (0.0%) | 0 (0.0%) |
| Total | 65 (57.0%) | 328 (34.3%) |
Income Below Poverty Among Married-Couple vs Single-Parent Households in Wilcox County
The poverty data for Wilcox County shows that 57 of the married-couple family households (4.7%) and 393 of the single-parent households (36.7%) are living below the poverty level. Within the married-couple family households, those with 1 or 2 children have the highest poverty rate, with 25 households (10.8%) falling below the poverty line. Among the single-parent households, those with 3 or 4 children have the highest poverty rate, with 151 household (79.5%) living below poverty.

| Children | Married-Couple Families | Single-Parent Households |
| No Children | 32 (3.5%) | 82 (15.0%) |
| 1 or 2 Children | 25 (10.8%) | 160 (47.9%) |
| 3 or 4 Children | 0 (0.0%) | 151 (79.5%) |
| 5 or more Children | 0 (0.0%) | 0 (0.0%) |
| Total | 57 (4.7%) | 393 (36.7%) |
Employment Characteristics in Wilcox County
Employment by Class of Employer in Wilcox County
Among the 3,174 employed individuals in Wilcox County, private company employees (2,149 | 67.7%), local government employees (349 | 11.0%), and not-for-profit organizations (209 | 6.6%) make up the most common classes of employment.
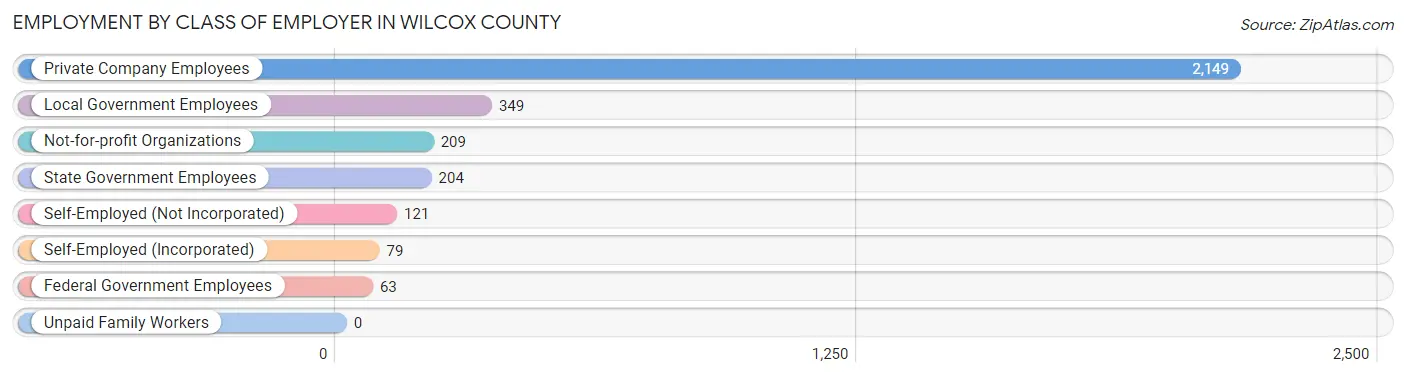
| Employer Class | # Employees | % Employees |
| Private Company Employees | 2,149 | 67.7% |
| Self-Employed (Incorporated) | 79 | 2.5% |
| Self-Employed (Not Incorporated) | 121 | 3.8% |
| Not-for-profit Organizations | 209 | 6.6% |
| Local Government Employees | 349 | 11.0% |
| State Government Employees | 204 | 6.4% |
| Federal Government Employees | 63 | 2.0% |
| Unpaid Family Workers | 0 | 0.0% |
| Total | 3,174 | 100.0% |
Employment Status by Age in Wilcox County
According to the labor force statistics for Wilcox County, out of the total population over 16 years of age (8,367), 44.8% or 3,748 individuals are in the labor force, with 10.7% or 401 of them unemployed. The age group with the highest labor force participation rate is 20 to 24 years, with 84.2% or 460 individuals in the labor force. Within the labor force, the 30 to 34 years age range has the highest percentage of unemployed individuals, with 26.7% or 106 of them being unemployed.

| Age Bracket | In Labor Force | Unemployed |
| 16 to 19 Years | 197 (26.2%) | 16 (8.1%) |
| 20 to 24 Years | 460 (84.2%) | 65 (14.1%) |
| 25 to 29 Years | 379 (61.3%) | 34 (9.0%) |
| 30 to 34 Years | 397 (68.3%) | 106 (26.7%) |
| 35 to 44 Years | 533 (49.4%) | 60 (11.3%) |
| 45 to 54 Years | 833 (68.5%) | 92 (11.0%) |
| 55 to 59 Years | 436 (54.5%) | 0 (0.0%) |
| 60 to 64 Years | 209 (34.5%) | 28 (13.4%) |
| 65 to 74 Years | 291 (22.6%) | 0 (0.0%) |
| 75 Years and over | 11 (1.3%) | 0 (0.0%) |
| Total | 3,748 (44.8%) | 401 (10.7%) |
Employment Status by Educational Attainment in Wilcox County
According to labor force statistics for Wilcox County, 56.9% of individuals (2,788) out of the total population between 25 and 64 years of age (4,900) are in the labor force, with 11.5% or 321 of them being unemployed. The group with the highest labor force participation rate are those with the educational attainment of bachelor's degree or higher, with 86.9% or 472 individuals in the labor force. Within the labor force, individuals with high school diploma education have the highest percentage of unemployment, with 15.4% or 160 of them being unemployed.
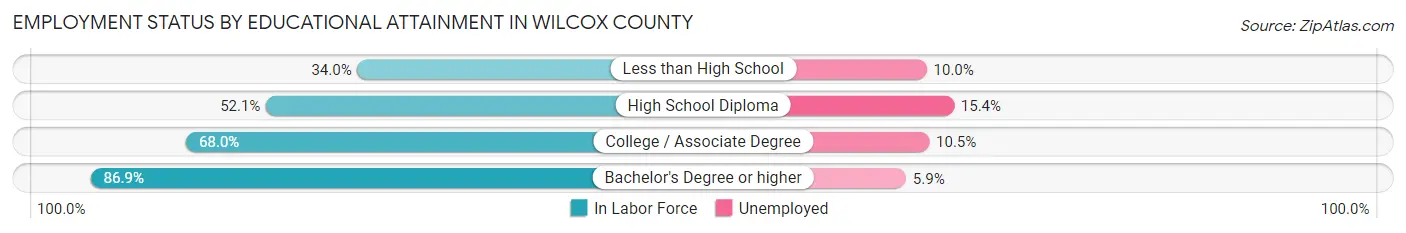
| Educational Attainment | In Labor Force | Unemployed |
| Less than High School | 330 (34.0%) | 97 (10.0%) |
| High School Diploma | 1,039 (52.1%) | 307 (15.4%) |
| College / Associate Degree | 946 (68.0%) | 146 (10.5%) |
| Bachelor's Degree or higher | 472 (86.9%) | 32 (5.9%) |
| Total | 2,788 (56.9%) | 564 (11.5%) |
Employment Occupations by Sex in Wilcox County
Management, Business, Science and Arts Occupations
The most common Management, Business, Science and Arts occupations in Wilcox County are Community & Social Service (295 | 8.8%), Management (276 | 8.3%), Education Instruction & Library (193 | 5.8%), Health Diagnosing & Treating (107 | 3.2%), and Health Technologists (101 | 3.0%).
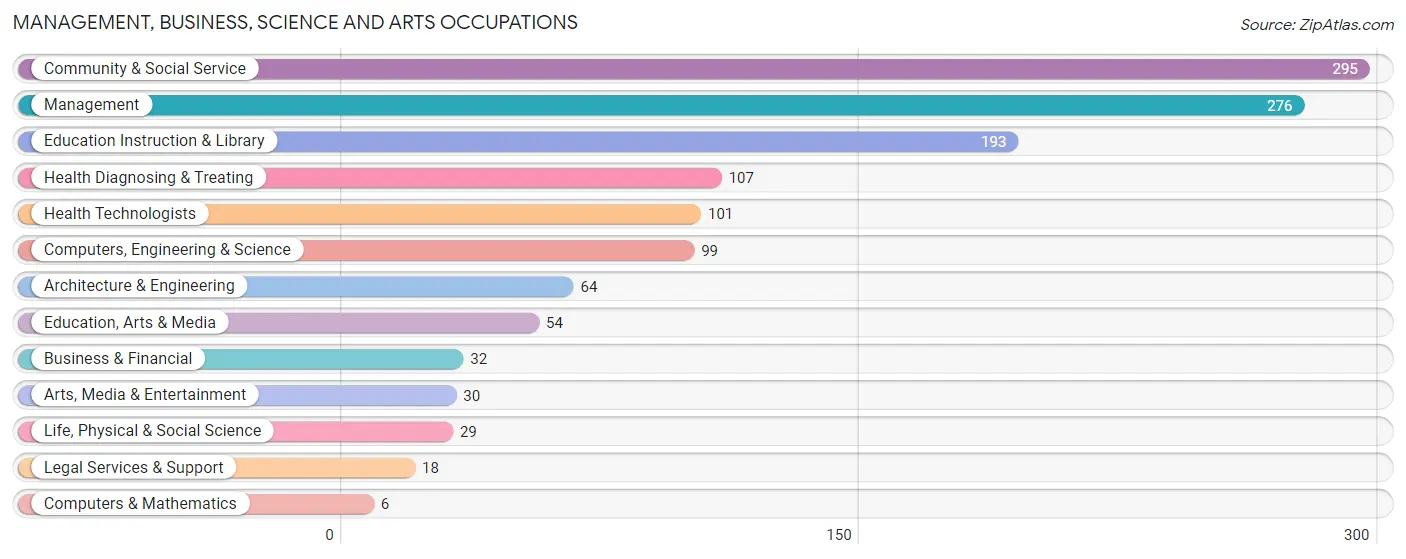
Management, Business, Science and Arts Occupations by Sex
Within the Management, Business, Science and Arts occupations in Wilcox County, the most male-oriented occupations are Computers & Mathematics (100.0%), Architecture & Engineering (98.4%), and Computers, Engineering & Science (93.9%), while the most female-oriented occupations are Education Instruction & Library (99.5%), Arts, Media & Entertainment (93.3%), and Community & Social Service (89.8%).
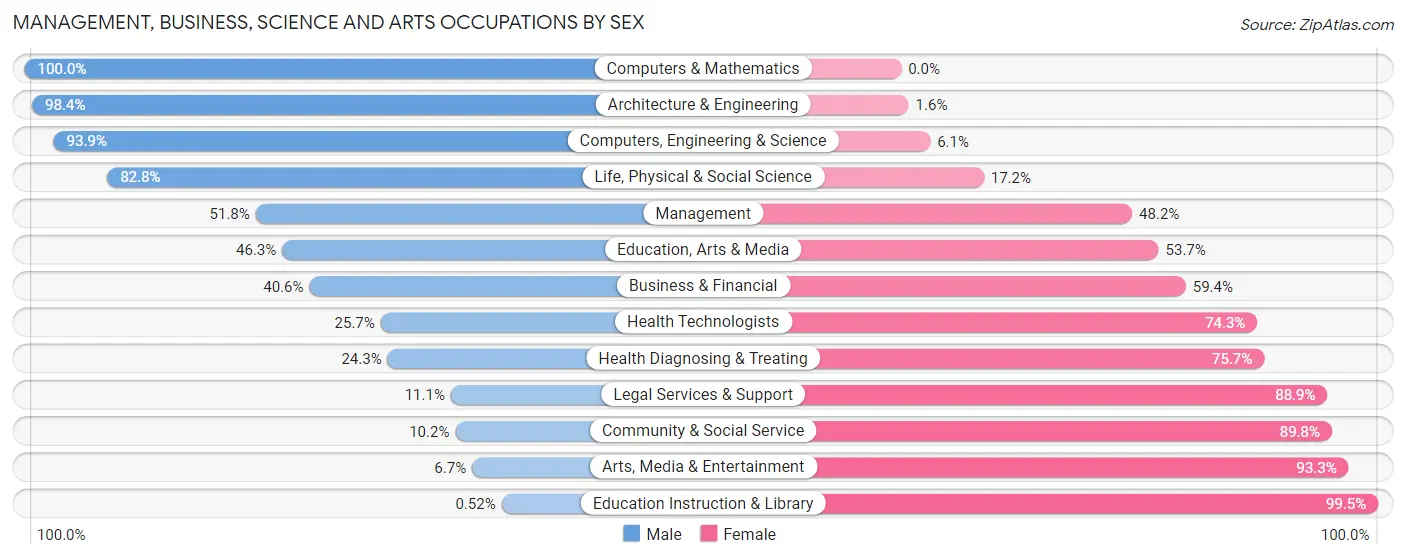
| Occupation | Male | Female |
| Management | 143 (51.8%) | 133 (48.2%) |
| Business & Financial | 13 (40.6%) | 19 (59.4%) |
| Computers, Engineering & Science | 93 (93.9%) | 6 (6.1%) |
| Computers & Mathematics | 6 (100.0%) | 0 (0.0%) |
| Architecture & Engineering | 63 (98.4%) | 1 (1.6%) |
| Life, Physical & Social Science | 24 (82.8%) | 5 (17.2%) |
| Community & Social Service | 30 (10.2%) | 265 (89.8%) |
| Education, Arts & Media | 25 (46.3%) | 29 (53.7%) |
| Legal Services & Support | 2 (11.1%) | 16 (88.9%) |
| Education Instruction & Library | 1 (0.5%) | 192 (99.5%) |
| Arts, Media & Entertainment | 2 (6.7%) | 28 (93.3%) |
| Health Diagnosing & Treating | 26 (24.3%) | 81 (75.7%) |
| Health Technologists | 26 (25.7%) | 75 (74.3%) |
| Total (Category) | 305 (37.7%) | 504 (62.3%) |
| Total (Overall) | 1,693 (50.6%) | 1,652 (49.4%) |
Services Occupations
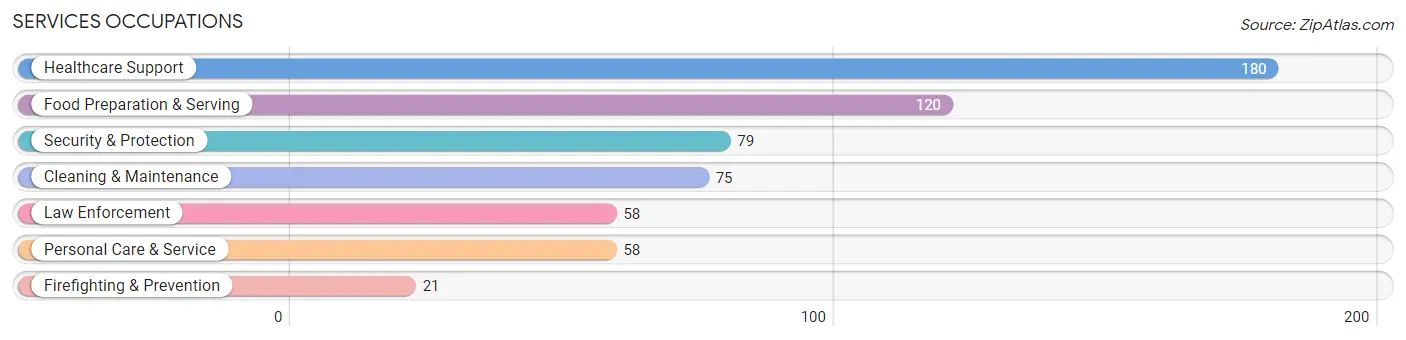
The most common Services occupations in Wilcox County are Healthcare Support (180 | 5.4%), Food Preparation & Serving (120 | 3.6%), Security & Protection (79 | 2.4%), Cleaning & Maintenance (75 | 2.2%), and Law Enforcement (58 | 1.7%).
Services Occupations by Sex
Within the Services occupations in Wilcox County, the most male-oriented occupations are Firefighting & Prevention (90.5%), Cleaning & Maintenance (48.0%), and Personal Care & Service (24.1%), while the most female-oriented occupations are Healthcare Support (100.0%), Law Enforcement (100.0%), and Food Preparation & Serving (87.5%).
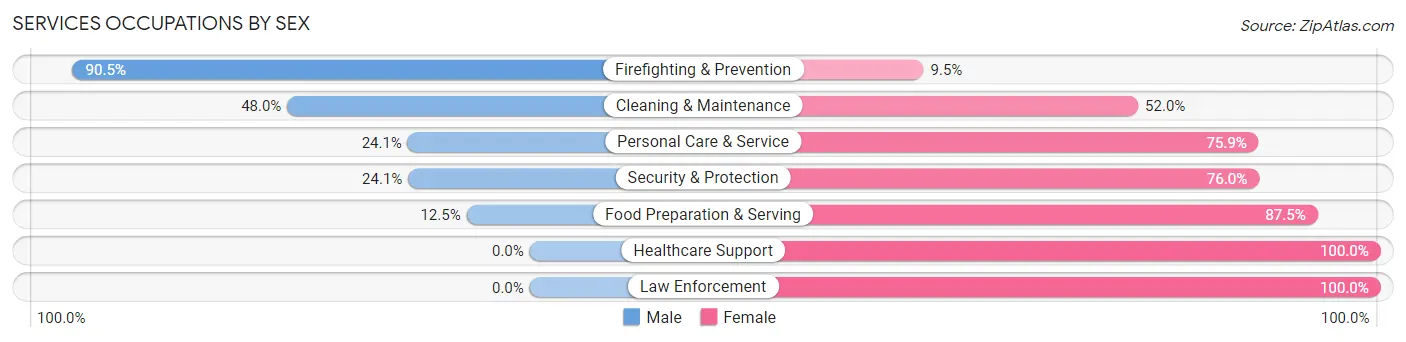
| Occupation | Male | Female |
| Healthcare Support | 0 (0.0%) | 180 (100.0%) |
| Security & Protection | 19 (24.0%) | 60 (75.9%) |
| Firefighting & Prevention | 19 (90.5%) | 2 (9.5%) |
| Law Enforcement | 0 (0.0%) | 58 (100.0%) |
| Food Preparation & Serving | 15 (12.5%) | 105 (87.5%) |
| Cleaning & Maintenance | 36 (48.0%) | 39 (52.0%) |
| Personal Care & Service | 14 (24.1%) | 44 (75.9%) |
| Total (Category) | 84 (16.4%) | 428 (83.6%) |
| Total (Overall) | 1,693 (50.6%) | 1,652 (49.4%) |
Sales and Office Occupations
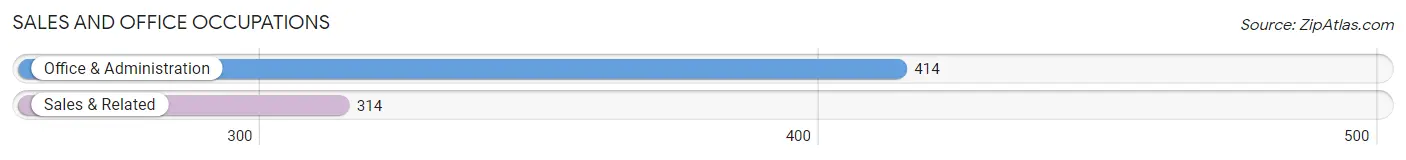
The most common Sales and Office occupations in Wilcox County are Office & Administration (414 | 12.4%), and Sales & Related (314 | 9.4%).
Sales and Office Occupations by Sex

| Occupation | Male | Female |
| Sales & Related | 98 (31.2%) | 216 (68.8%) |
| Office & Administration | 107 (25.9%) | 307 (74.2%) |
| Total (Category) | 205 (28.2%) | 523 (71.8%) |
| Total (Overall) | 1,693 (50.6%) | 1,652 (49.4%) |
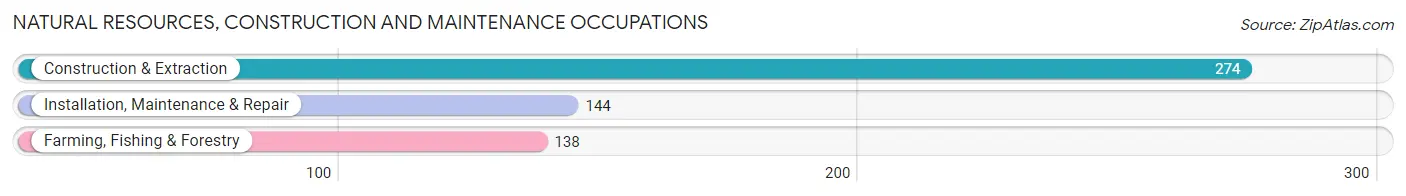
Natural Resources, Construction and Maintenance Occupations
The most common Natural Resources, Construction and Maintenance occupations in Wilcox County are Construction & Extraction (274 | 8.2%), Installation, Maintenance & Repair (144 | 4.3%), and Farming, Fishing & Forestry (138 | 4.1%).
Natural Resources, Construction and Maintenance Occupations by Sex
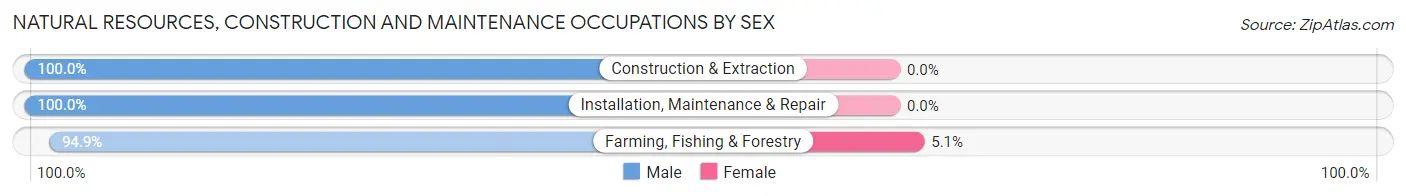
| Occupation | Male | Female |
| Farming, Fishing & Forestry | 131 (94.9%) | 7 (5.1%) |
| Construction & Extraction | 274 (100.0%) | 0 (0.0%) |
| Installation, Maintenance & Repair | 144 (100.0%) | 0 (0.0%) |
| Total (Category) | 549 (98.7%) | 7 (1.3%) |
| Total (Overall) | 1,693 (50.6%) | 1,652 (49.4%) |
Production, Transportation and Moving Occupations
The most common Production, Transportation and Moving occupations in Wilcox County are Production (440 | 13.2%), Transportation (163 | 4.9%), and Material Moving (137 | 4.1%).

Production, Transportation and Moving Occupations by Sex
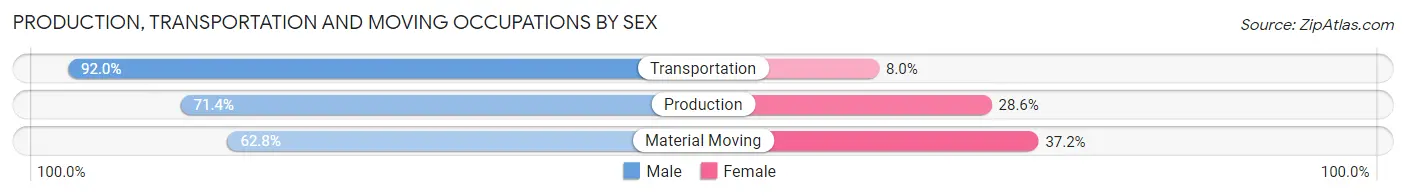
| Occupation | Male | Female |
| Production | 314 (71.4%) | 126 (28.6%) |
| Transportation | 150 (92.0%) | 13 (8.0%) |
| Material Moving | 86 (62.8%) | 51 (37.2%) |
| Total (Category) | 550 (74.3%) | 190 (25.7%) |
| Total (Overall) | 1,693 (50.6%) | 1,652 (49.4%) |
Employment Industries by Sex in Wilcox County
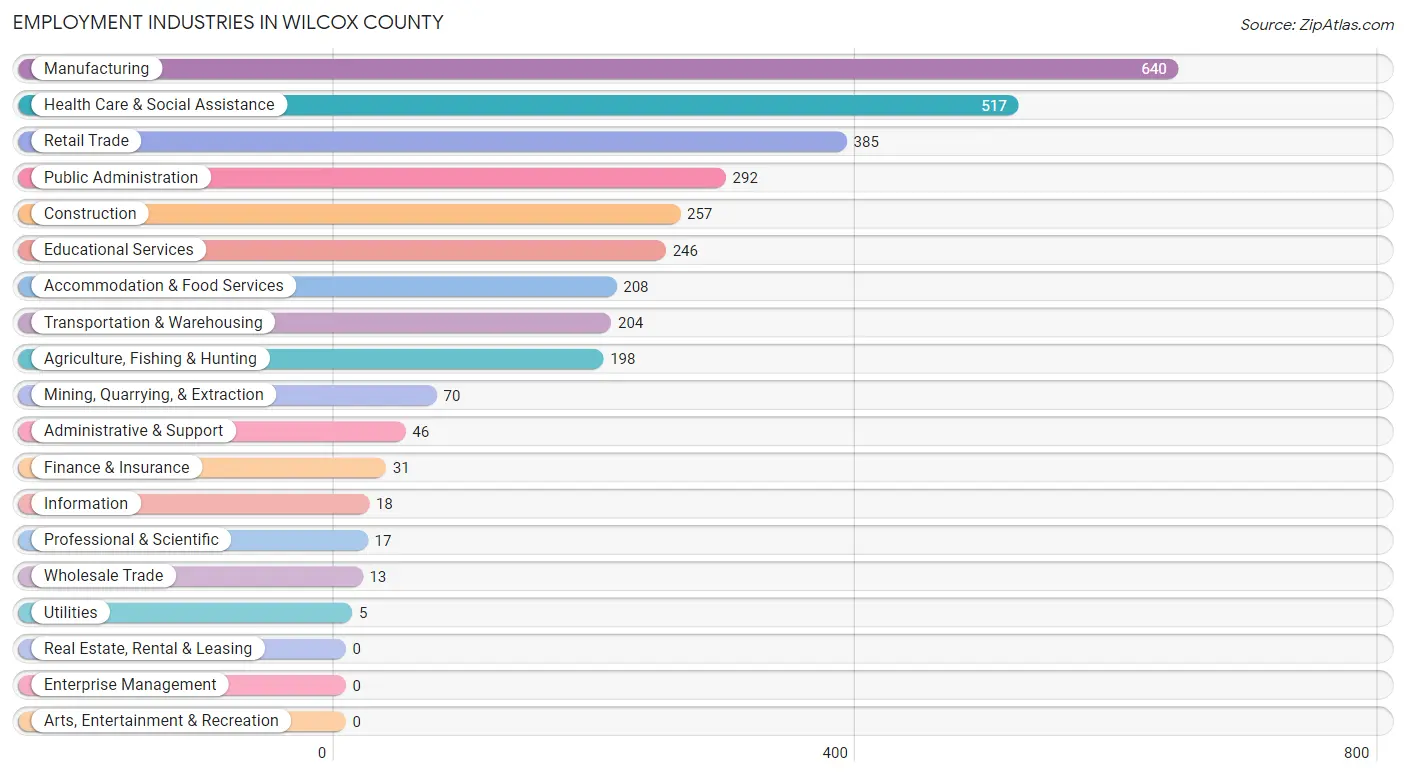
Employment Industries in Wilcox County
The major employment industries in Wilcox County include Manufacturing (640 | 19.1%), Health Care & Social Assistance (517 | 15.5%), Retail Trade (385 | 11.5%), Public Administration (292 | 8.7%), and Construction (257 | 7.7%).
Employment Industries by Sex in Wilcox County
The Wilcox County industries that see more men than women are Utilities (100.0%), Construction (98.1%), and Agriculture, Fishing & Hunting (82.8%), whereas the industries that tend to have a higher number of women are Educational Services (91.1%), Professional & Scientific (88.2%), and Public Administration (85.6%).

| Industry | Male | Female |
| Agriculture, Fishing & Hunting | 164 (82.8%) | 34 (17.2%) |
| Mining, Quarrying, & Extraction | 54 (77.1%) | 16 (22.9%) |
| Construction | 252 (98.1%) | 5 (1.9%) |
| Manufacturing | 452 (70.6%) | 188 (29.4%) |
| Wholesale Trade | 7 (53.8%) | 6 (46.2%) |
| Retail Trade | 202 (52.5%) | 183 (47.5%) |
| Transportation & Warehousing | 148 (72.6%) | 56 (27.5%) |
| Utilities | 5 (100.0%) | 0 (0.0%) |
| Information | 11 (61.1%) | 7 (38.9%) |
| Finance & Insurance | 5 (16.1%) | 26 (83.9%) |
| Real Estate, Rental & Leasing | 0 (0.0%) | 0 (0.0%) |
| Professional & Scientific | 2 (11.8%) | 15 (88.2%) |
| Enterprise Management | 0 (0.0%) | 0 (0.0%) |
| Administrative & Support | 21 (45.7%) | 25 (54.3%) |
| Educational Services | 22 (8.9%) | 224 (91.1%) |
| Health Care & Social Assistance | 96 (18.6%) | 421 (81.4%) |
| Arts, Entertainment & Recreation | 0 (0.0%) | 0 (0.0%) |
| Accommodation & Food Services | 97 (46.6%) | 111 (53.4%) |
| Public Administration | 42 (14.4%) | 250 (85.6%) |
| Total | 1,693 (50.6%) | 1,652 (49.4%) |
Education in Wilcox County
School Enrollment in Wilcox County
The most common levels of schooling among the 2,320 students in Wilcox County are high school (784 | 33.8%), middle school (577 | 24.9%), and elementary school (537 | 23.2%).
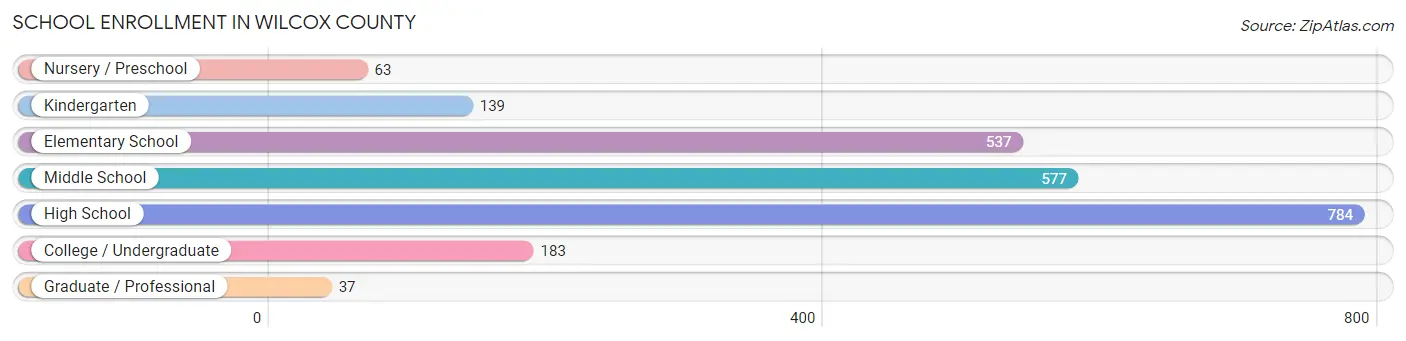
| School Level | # Students | % Students |
| Nursery / Preschool | 63 | 2.7% |
| Kindergarten | 139 | 6.0% |
| Elementary School | 537 | 23.2% |
| Middle School | 577 | 24.9% |
| High School | 784 | 33.8% |
| College / Undergraduate | 183 | 7.9% |
| Graduate / Professional | 37 | 1.6% |
| Total | 2,320 | 100.0% |
School Enrollment by Age by Funding Source in Wilcox County
Out of a total of 2,320 students who are enrolled in schools in Wilcox County, 258 (11.1%) attend a private institution, while the remaining 2,062 (88.9%) are enrolled in public schools. The age group of 15 to 17 year olds has the highest likelihood of being enrolled in private schools, with 81 (20.8% in the age bracket) enrolled. Conversely, the age group of 20 to 24 year olds has the lowest likelihood of being enrolled in a private school, with 68 (100.0% in the age bracket) attending a public institution.
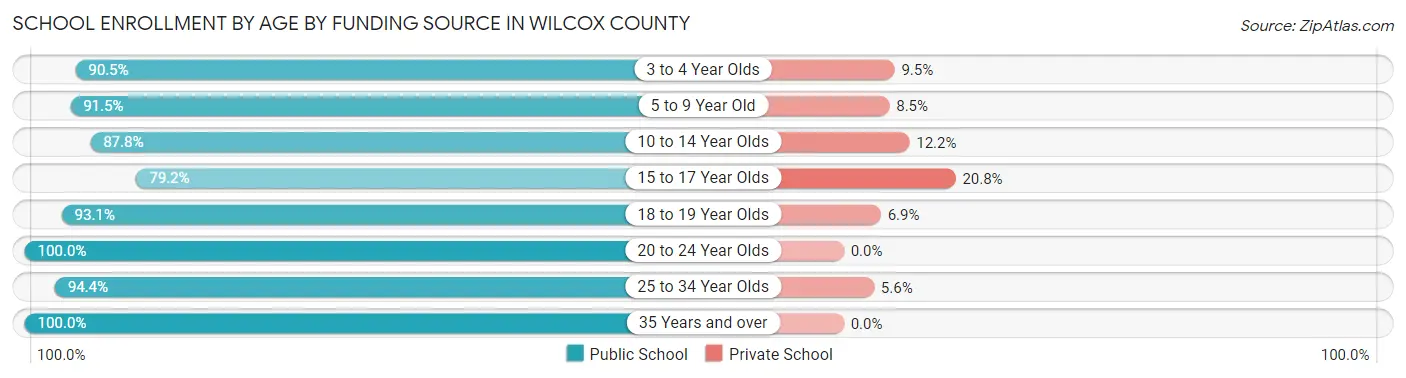
| Age Bracket | Public School | Private School |
| 3 to 4 Year Olds | 67 (90.5%) | 7 (9.5%) |
| 5 to 9 Year Old | 463 (91.5%) | 43 (8.5%) |
| 10 to 14 Year Olds | 689 (87.8%) | 96 (12.2%) |
| 15 to 17 Year Olds | 308 (79.2%) | 81 (20.8%) |
| 18 to 19 Year Olds | 351 (93.1%) | 26 (6.9%) |
| 20 to 24 Year Olds | 68 (100.0%) | 0 (0.0%) |
| 25 to 34 Year Olds | 67 (94.4%) | 4 (5.6%) |
| 35 Years and over | 50 (100.0%) | 0 (0.0%) |
| Total | 2,062 (88.9%) | 258 (11.1%) |
Educational Attainment by Field of Study in Wilcox County
Business (344 | 41.1%), education (189 | 22.6%), science & technology (84 | 10.0%), bio, nature & agricultural (48 | 5.7%), and computers & mathematics (36 | 4.3%) are the most common fields of study among 837 individuals in Wilcox County who have obtained a bachelor's degree or higher.
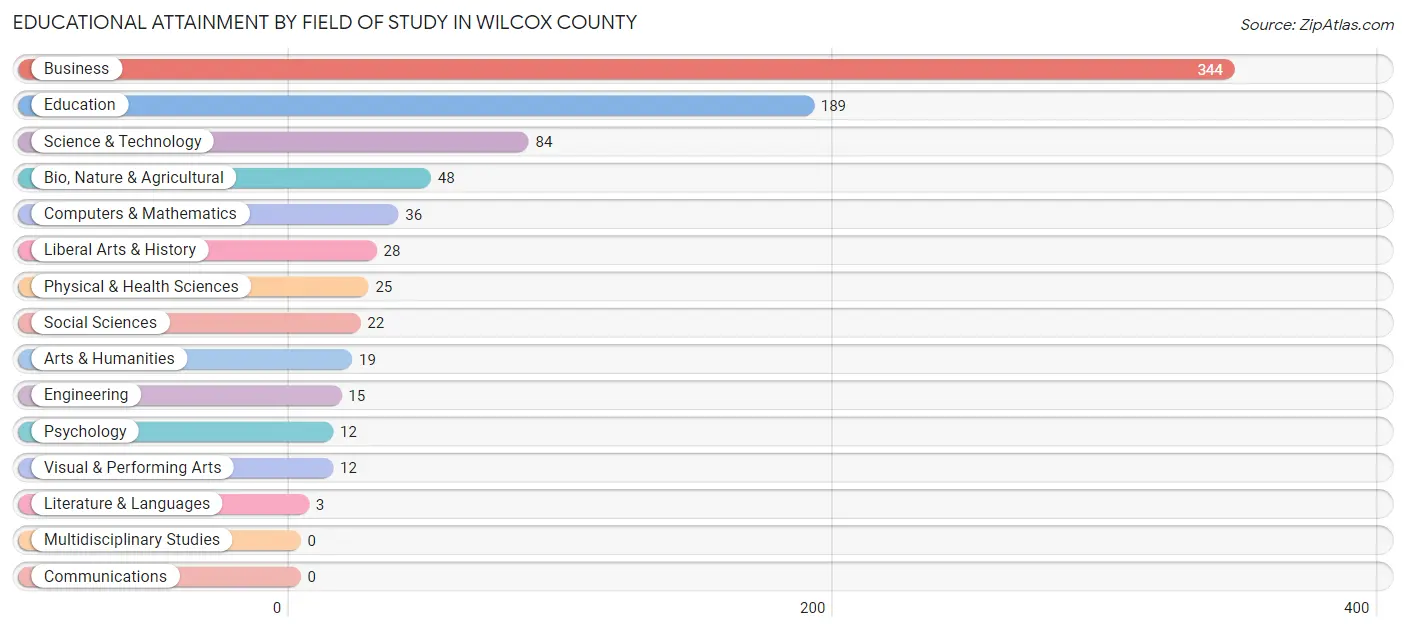
| Field of Study | # Graduates | % Graduates |
| Computers & Mathematics | 36 | 4.3% |
| Bio, Nature & Agricultural | 48 | 5.7% |
| Physical & Health Sciences | 25 | 3.0% |
| Psychology | 12 | 1.4% |
| Social Sciences | 22 | 2.6% |
| Engineering | 15 | 1.8% |
| Multidisciplinary Studies | 0 | 0.0% |
| Science & Technology | 84 | 10.0% |
| Business | 344 | 41.1% |
| Education | 189 | 22.6% |
| Literature & Languages | 3 | 0.4% |
| Liberal Arts & History | 28 | 3.4% |
| Visual & Performing Arts | 12 | 1.4% |
| Communications | 0 | 0.0% |
| Arts & Humanities | 19 | 2.3% |
| Total | 837 | 100.0% |
Transportation & Commute in Wilcox County
Vehicle Availability by Sex in Wilcox County
The most prevalent vehicle ownership categories in Wilcox County are males with 2 vehicles (646, accounting for 41.0%) and females with 2 vehicles (649, making up 40.5%).
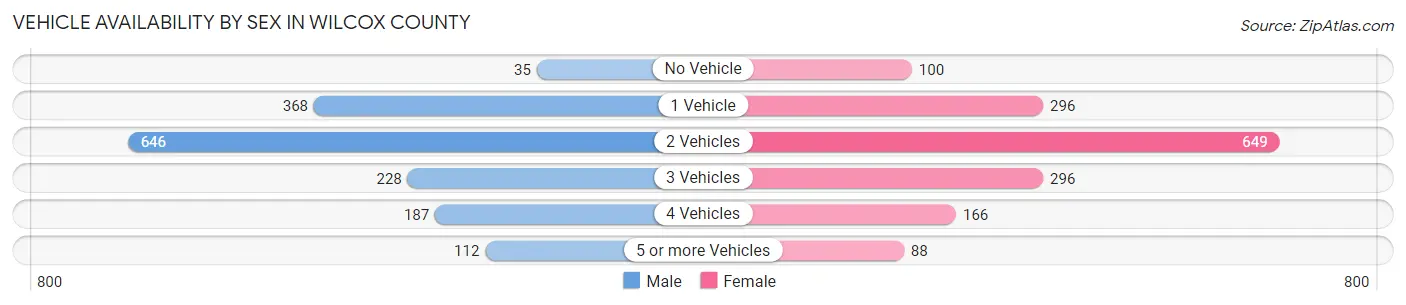
| Vehicles Available | Male | Female |
| No Vehicle | 35 (2.2%) | 100 (6.3%) |
| 1 Vehicle | 368 (23.4%) | 296 (18.6%) |
| 2 Vehicles | 646 (41.0%) | 649 (40.7%) |
| 3 Vehicles | 228 (14.5%) | 296 (18.6%) |
| 4 Vehicles | 187 (11.9%) | 166 (10.4%) |
| 5 or more Vehicles | 112 (7.1%) | 88 (5.5%) |
| Total | 1,576 (100.0%) | 1,595 (100.0%) |
Commute Time in Wilcox County
The most frequently occuring commute durations in Wilcox County are 30 to 34 minutes (520 commuters, 16.9%), 10 to 14 minutes (496 commuters, 16.1%), and 5 to 9 minutes (479 commuters, 15.6%).
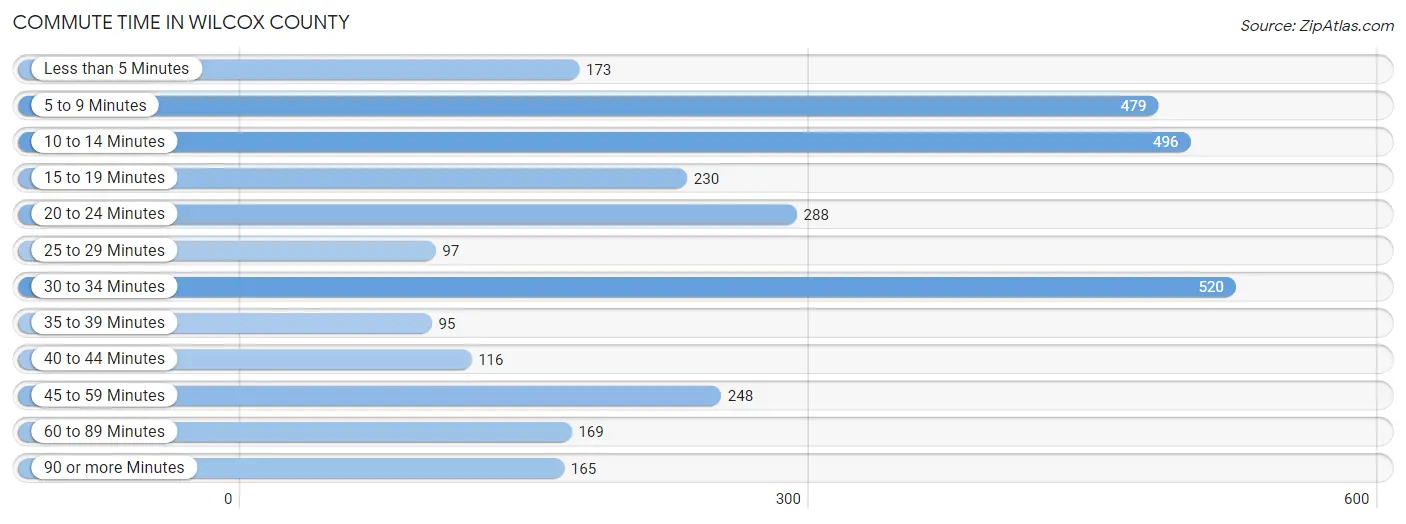
| Commute Time | # Commuters | % Commuters |
| Less than 5 Minutes | 173 | 5.6% |
| 5 to 9 Minutes | 479 | 15.6% |
| 10 to 14 Minutes | 496 | 16.1% |
| 15 to 19 Minutes | 230 | 7.5% |
| 20 to 24 Minutes | 288 | 9.4% |
| 25 to 29 Minutes | 97 | 3.2% |
| 30 to 34 Minutes | 520 | 16.9% |
| 35 to 39 Minutes | 95 | 3.1% |
| 40 to 44 Minutes | 116 | 3.8% |
| 45 to 59 Minutes | 248 | 8.1% |
| 60 to 89 Minutes | 169 | 5.5% |
| 90 or more Minutes | 165 | 5.4% |
Commute Time by Sex in Wilcox County
The most common commute times in Wilcox County are 10 to 14 minutes (325 commuters, 21.0%) for males and 5 to 9 minutes (323 commuters, 21.1%) for females.
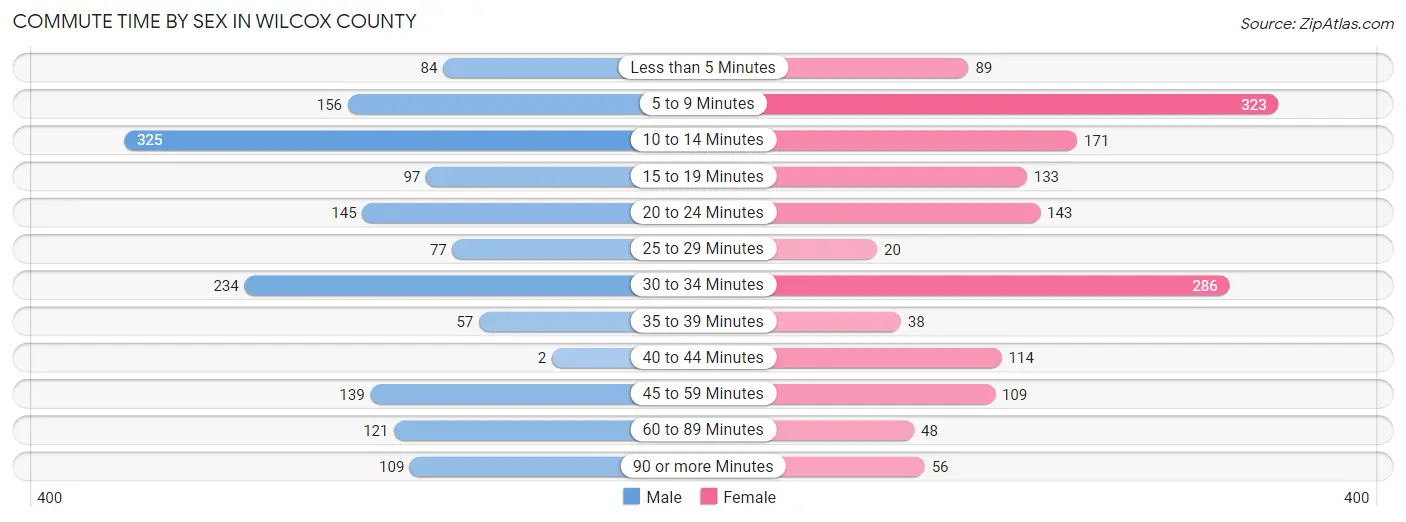
| Commute Time | Male | Female |
| Less than 5 Minutes | 84 (5.4%) | 89 (5.8%) |
| 5 to 9 Minutes | 156 (10.1%) | 323 (21.1%) |
| 10 to 14 Minutes | 325 (21.0%) | 171 (11.2%) |
| 15 to 19 Minutes | 97 (6.3%) | 133 (8.7%) |
| 20 to 24 Minutes | 145 (9.4%) | 143 (9.3%) |
| 25 to 29 Minutes | 77 (5.0%) | 20 (1.3%) |
| 30 to 34 Minutes | 234 (15.1%) | 286 (18.7%) |
| 35 to 39 Minutes | 57 (3.7%) | 38 (2.5%) |
| 40 to 44 Minutes | 2 (0.1%) | 114 (7.4%) |
| 45 to 59 Minutes | 139 (9.0%) | 109 (7.1%) |
| 60 to 89 Minutes | 121 (7.8%) | 48 (3.1%) |
| 90 or more Minutes | 109 (7.0%) | 56 (3.7%) |
Time of Departure to Work by Sex in Wilcox County
The most frequent times of departure to work in Wilcox County are 12:00 AM to 4:59 AM (298, 19.3%) for males and 7:00 AM to 7:29 AM (331, 21.6%) for females.

| Time of Departure | Male | Female |
| 12:00 AM to 4:59 AM | 298 (19.3%) | 126 (8.2%) |
| 5:00 AM to 5:29 AM | 120 (7.8%) | 5 (0.3%) |
| 5:30 AM to 5:59 AM | 141 (9.1%) | 13 (0.9%) |
| 6:00 AM to 6:29 AM | 147 (9.5%) | 169 (11.1%) |
| 6:30 AM to 6:59 AM | 177 (11.5%) | 98 (6.4%) |
| 7:00 AM to 7:29 AM | 122 (7.9%) | 331 (21.6%) |
| 7:30 AM to 7:59 AM | 92 (5.9%) | 196 (12.8%) |
| 8:00 AM to 8:29 AM | 17 (1.1%) | 156 (10.2%) |
| 8:30 AM to 8:59 AM | 12 (0.8%) | 54 (3.5%) |
| 9:00 AM to 9:59 AM | 0 (0.0%) | 60 (3.9%) |
| 10:00 AM to 10:59 AM | 16 (1.0%) | 32 (2.1%) |
| 11:00 AM to 11:59 AM | 0 (0.0%) | 89 (5.8%) |
| 12:00 PM to 3:59 PM | 199 (12.9%) | 112 (7.3%) |
| 4:00 PM to 11:59 PM | 205 (13.3%) | 89 (5.8%) |
| Total | 1,546 (100.0%) | 1,530 (100.0%) |
Housing Occupancy in Wilcox County
Occupancy by Ownership in Wilcox County
Of the total 3,579 dwellings in Wilcox County, owner-occupied units account for 2,844 (79.5%), while renter-occupied units make up 735 (20.5%).
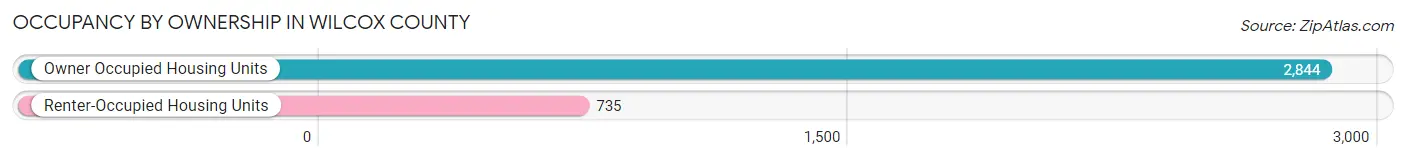
| Occupancy | # Housing Units | % Housing Units |
| Owner Occupied Housing Units | 2,844 | 79.5% |
| Renter-Occupied Housing Units | 735 | 20.5% |
| Total Occupied Housing Units | 3,579 | 100.0% |
Occupancy by Household Size in Wilcox County
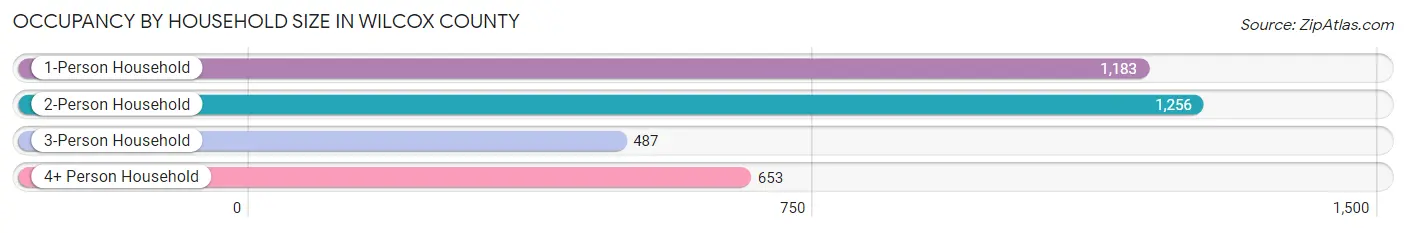
| Household Size | # Housing Units | % Housing Units |
| 1-Person Household | 1,183 | 33.1% |
| 2-Person Household | 1,256 | 35.1% |
| 3-Person Household | 487 | 13.6% |
| 4+ Person Household | 653 | 18.2% |
| Total Housing Units | 3,579 | 100.0% |
Occupancy by Ownership by Household Size in Wilcox County
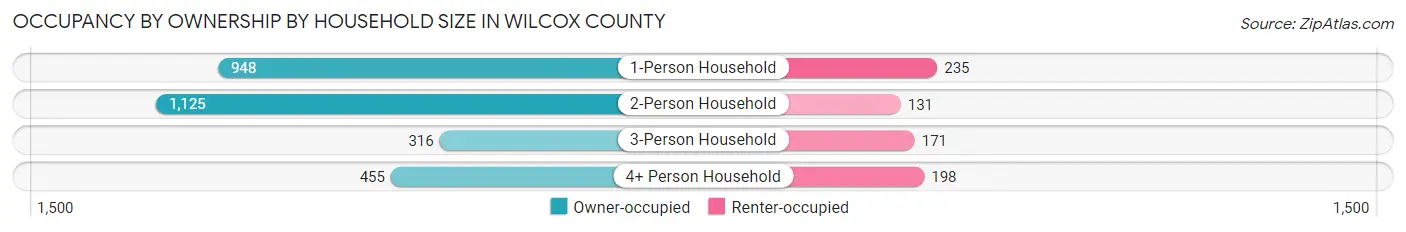
| Household Size | Owner-occupied | Renter-occupied |
| 1-Person Household | 948 (80.1%) | 235 (19.9%) |
| 2-Person Household | 1,125 (89.6%) | 131 (10.4%) |
| 3-Person Household | 316 (64.9%) | 171 (35.1%) |
| 4+ Person Household | 455 (69.7%) | 198 (30.3%) |
| Total Housing Units | 2,844 (79.5%) | 735 (20.5%) |
Occupancy by Educational Attainment in Wilcox County
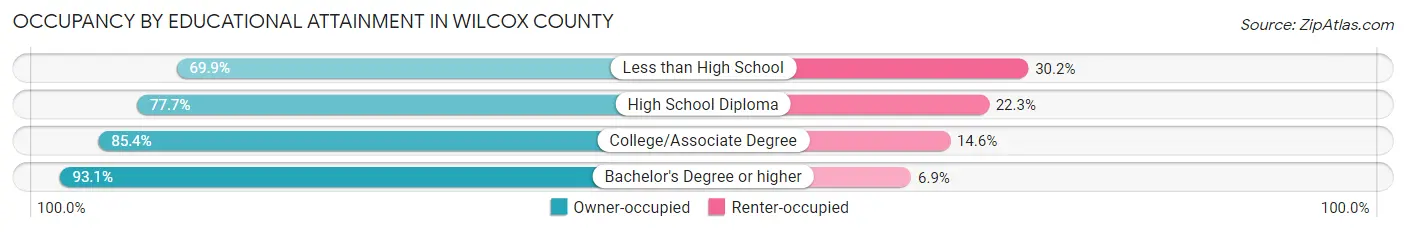
| Household Size | Owner-occupied | Renter-occupied |
| Less than High School | 563 (69.9%) | 243 (30.1%) |
| High School Diploma | 1,187 (77.7%) | 341 (22.3%) |
| College/Associate Degree | 718 (85.4%) | 123 (14.6%) |
| Bachelor's Degree or higher | 376 (93.1%) | 28 (6.9%) |
Occupancy by Age of Householder in Wilcox County
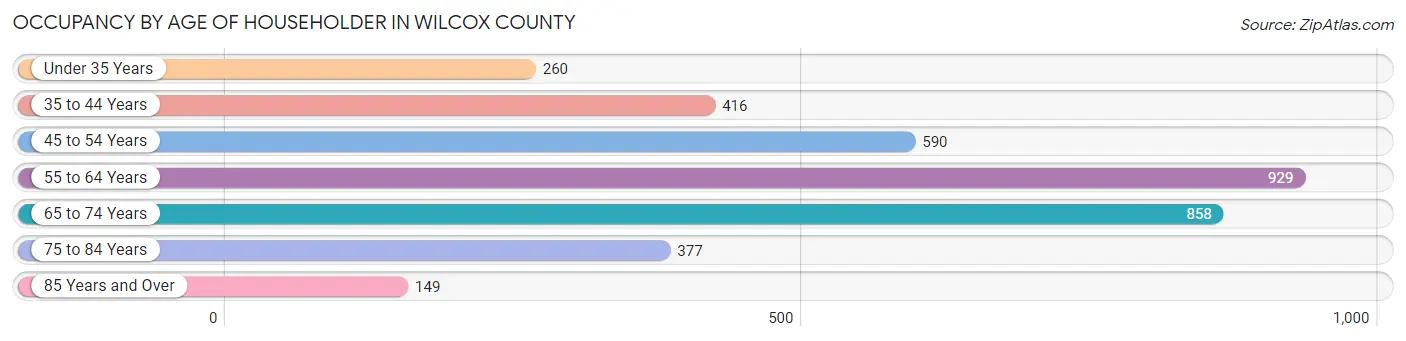
| Age Bracket | # Households | % Households |
| Under 35 Years | 260 | 7.3% |
| 35 to 44 Years | 416 | 11.6% |
| 45 to 54 Years | 590 | 16.5% |
| 55 to 64 Years | 929 | 26.0% |
| 65 to 74 Years | 858 | 24.0% |
| 75 to 84 Years | 377 | 10.5% |
| 85 Years and Over | 149 | 4.2% |
| Total | 3,579 | 100.0% |
Housing Finances in Wilcox County
Median Income by Occupancy in Wilcox County
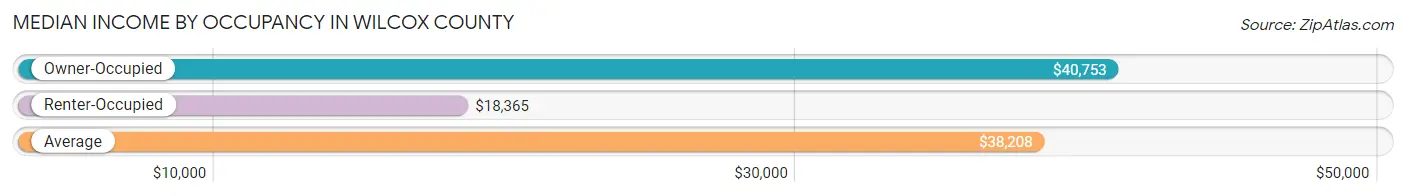
| Occupancy Type | # Households | Median Income |
| Owner-Occupied | 2,844 (79.5%) | $40,753 |
| Renter-Occupied | 735 (20.5%) | $18,365 |
| Average | 3,579 (100.0%) | $38,208 |
Occupancy by Householder Income Bracket in Wilcox County

| Income Bracket | Owner-occupied | Renter-occupied |
| Less than $5,000 | 67 (2.4%) | 83 (11.3%) |
| $5,000 to $9,999 | 113 (4.0%) | 37 (5.0%) |
| $10,000 to $14,999 | 345 (12.1%) | 138 (18.8%) |
| $15,000 to $19,999 | 89 (3.1%) | 135 (18.4%) |
| $20,000 to $24,999 | 290 (10.2%) | 28 (3.8%) |
| $25,000 to $34,999 | 277 (9.7%) | 59 (8.0%) |
| $35,000 to $49,999 | 540 (19.0%) | 66 (9.0%) |
| $50,000 to $74,999 | 400 (14.1%) | 64 (8.7%) |
| $75,000 to $99,999 | 360 (12.7%) | 48 (6.5%) |
| $100,000 to $149,999 | 229 (8.1%) | 46 (6.3%) |
| $150,000 or more | 134 (4.7%) | 31 (4.2%) |
| Total | 2,844 (100.0%) | 735 (100.0%) |
Monthly Housing Cost Tiers in Wilcox County

| Monthly Cost | Owner-occupied | Renter-occupied |
| Less than $300 | 441 (15.5%) | 106 (14.4%) |
| $300 to $499 | 1,000 (35.2%) | 28 (3.8%) |
| $500 to $799 | 592 (20.8%) | 125 (17.0%) |
| $800 to $999 | 287 (10.1%) | 172 (23.4%) |
| $1,000 to $1,499 | 388 (13.6%) | 35 (4.8%) |
| $1,500 to $1,999 | 65 (2.3%) | 29 (4.0%) |
| $2,000 to $2,499 | 22 (0.8%) | 0 (0.0%) |
| $2,500 to $2,999 | 25 (0.9%) | 0 (0.0%) |
| $3,000 or more | 24 (0.8%) | 0 (0.0%) |
| Total | 2,844 (100.0%) | 735 (100.0%) |
Physical Housing Characteristics in Wilcox County
Housing Structures in Wilcox County
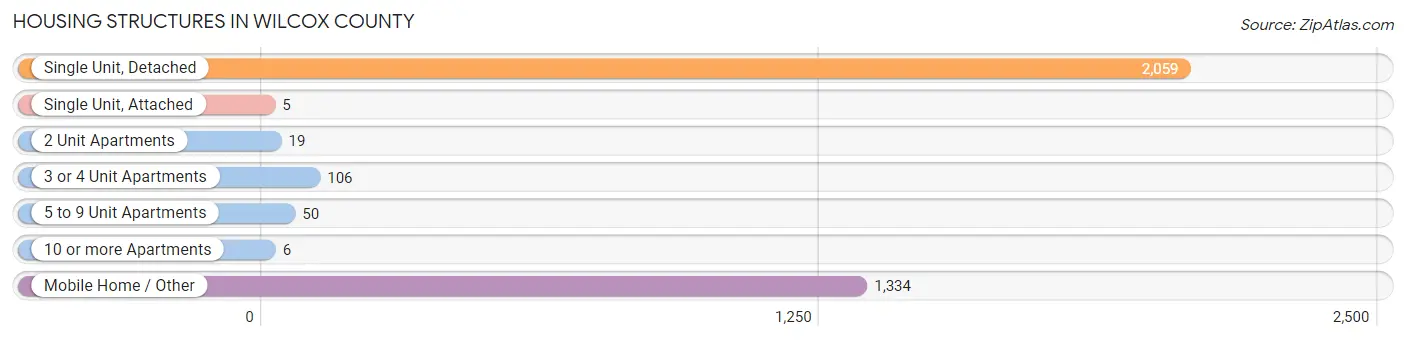
| Structure Type | # Housing Units | % Housing Units |
| Single Unit, Detached | 2,059 | 57.5% |
| Single Unit, Attached | 5 | 0.1% |
| 2 Unit Apartments | 19 | 0.5% |
| 3 or 4 Unit Apartments | 106 | 3.0% |
| 5 to 9 Unit Apartments | 50 | 1.4% |
| 10 or more Apartments | 6 | 0.2% |
| Mobile Home / Other | 1,334 | 37.3% |
| Total | 3,579 | 100.0% |
Housing Structures by Occupancy in Wilcox County
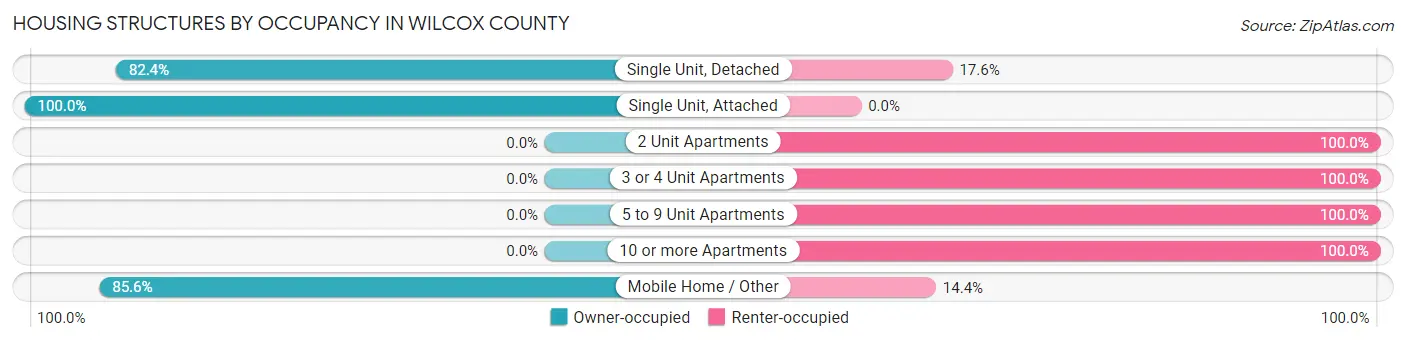
| Structure Type | Owner-occupied | Renter-occupied |
| Single Unit, Detached | 1,697 (82.4%) | 362 (17.6%) |
| Single Unit, Attached | 5 (100.0%) | 0 (0.0%) |
| 2 Unit Apartments | 0 (0.0%) | 19 (100.0%) |
| 3 or 4 Unit Apartments | 0 (0.0%) | 106 (100.0%) |
| 5 to 9 Unit Apartments | 0 (0.0%) | 50 (100.0%) |
| 10 or more Apartments | 0 (0.0%) | 6 (100.0%) |
| Mobile Home / Other | 1,142 (85.6%) | 192 (14.4%) |
| Total | 2,844 (79.5%) | 735 (20.5%) |
Housing Structures by Number of Rooms in Wilcox County
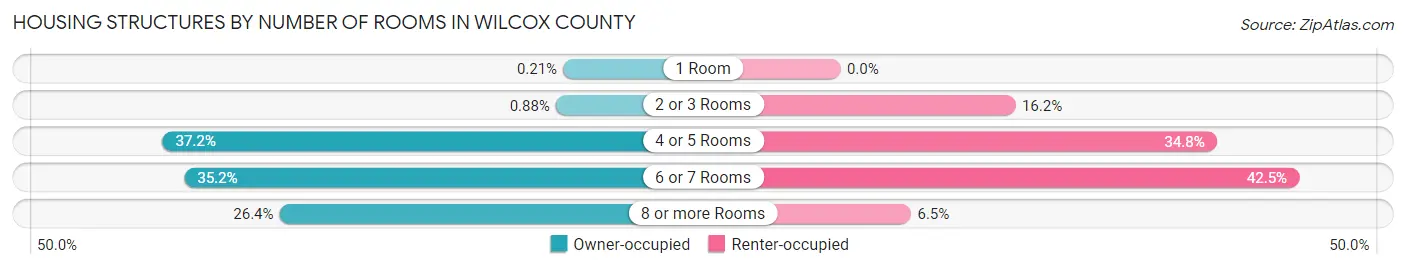
| Number of Rooms | Owner-occupied | Renter-occupied |
| 1 Room | 6 (0.2%) | 0 (0.0%) |
| 2 or 3 Rooms | 25 (0.9%) | 119 (16.2%) |
| 4 or 5 Rooms | 1,059 (37.2%) | 256 (34.8%) |
| 6 or 7 Rooms | 1,002 (35.2%) | 312 (42.4%) |
| 8 or more Rooms | 752 (26.4%) | 48 (6.5%) |
| Total | 2,844 (100.0%) | 735 (100.0%) |
Housing Structure by Heating Type in Wilcox County

| Heating Type | Owner-occupied | Renter-occupied |
| Utility Gas | 215 (7.6%) | 12 (1.6%) |
| Bottled, Tank, or LP Gas | 770 (27.1%) | 91 (12.4%) |
| Electricity | 1,769 (62.2%) | 600 (81.6%) |
| Fuel Oil or Kerosene | 11 (0.4%) | 0 (0.0%) |
| Coal or Coke | 0 (0.0%) | 0 (0.0%) |
| All other Fuels | 51 (1.8%) | 32 (4.3%) |
| No Fuel Used | 28 (1.0%) | 0 (0.0%) |
| Total | 2,844 (100.0%) | 735 (100.0%) |
Household Vehicle Usage in Wilcox County
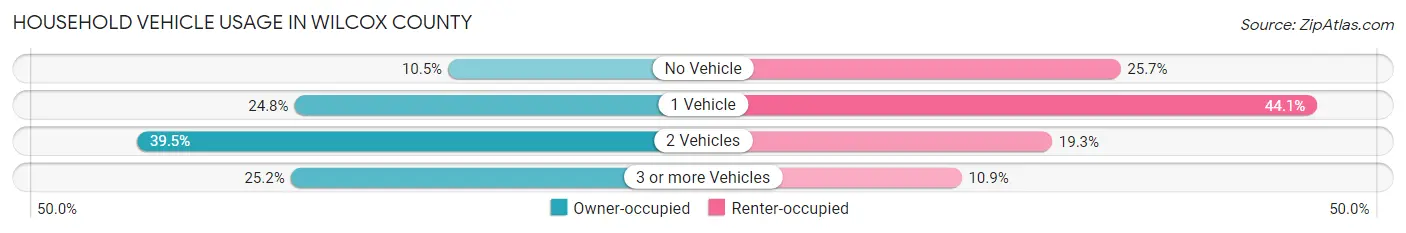
| Vehicles per Household | Owner-occupied | Renter-occupied |
| No Vehicle | 298 (10.5%) | 189 (25.7%) |
| 1 Vehicle | 706 (24.8%) | 324 (44.1%) |
| 2 Vehicles | 1,124 (39.5%) | 142 (19.3%) |
| 3 or more Vehicles | 716 (25.2%) | 80 (10.9%) |
| Total | 2,844 (100.0%) | 735 (100.0%) |
Real Estate & Mortgages in Wilcox County
Real Estate and Mortgage Overview in Wilcox County
| Characteristic | Without Mortgage | With Mortgage |
| Housing Units | 1,989 | 855 |
| Median Property Value | $67,200 | $116,500 |
| Median Household Income | $36,484 | $93 |
| Monthly Housing Costs | $414 | $24 |
| Real Estate Taxes | $213 | $146 |
Property Value by Mortgage Status in Wilcox County
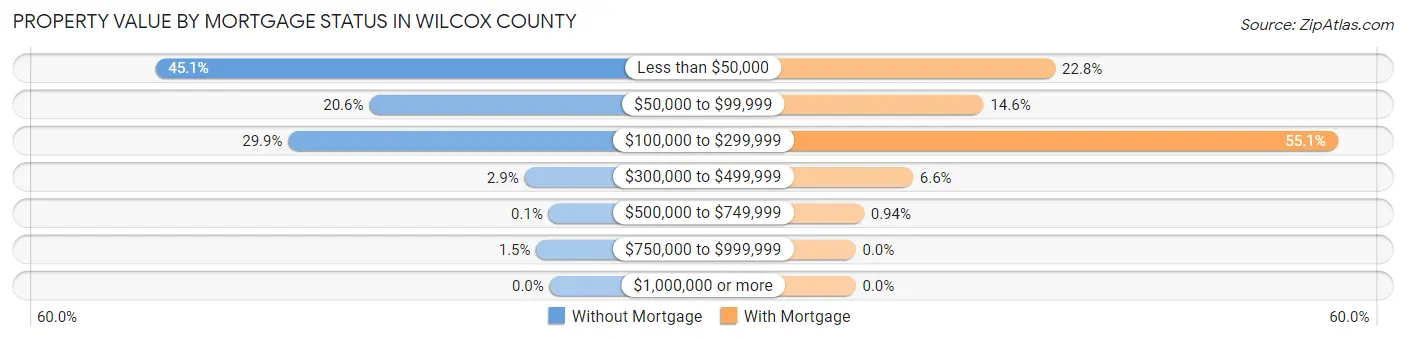
| Property Value | Without Mortgage | With Mortgage |
| Less than $50,000 | 896 (45.1%) | 195 (22.8%) |
| $50,000 to $99,999 | 410 (20.6%) | 125 (14.6%) |
| $100,000 to $299,999 | 594 (29.9%) | 471 (55.1%) |
| $300,000 to $499,999 | 57 (2.9%) | 56 (6.6%) |
| $500,000 to $749,999 | 2 (0.1%) | 8 (0.9%) |
| $750,000 to $999,999 | 30 (1.5%) | 0 (0.0%) |
| $1,000,000 or more | 0 (0.0%) | 0 (0.0%) |
| Total | 1,989 (100.0%) | 855 (100.0%) |
Household Income by Mortgage Status in Wilcox County
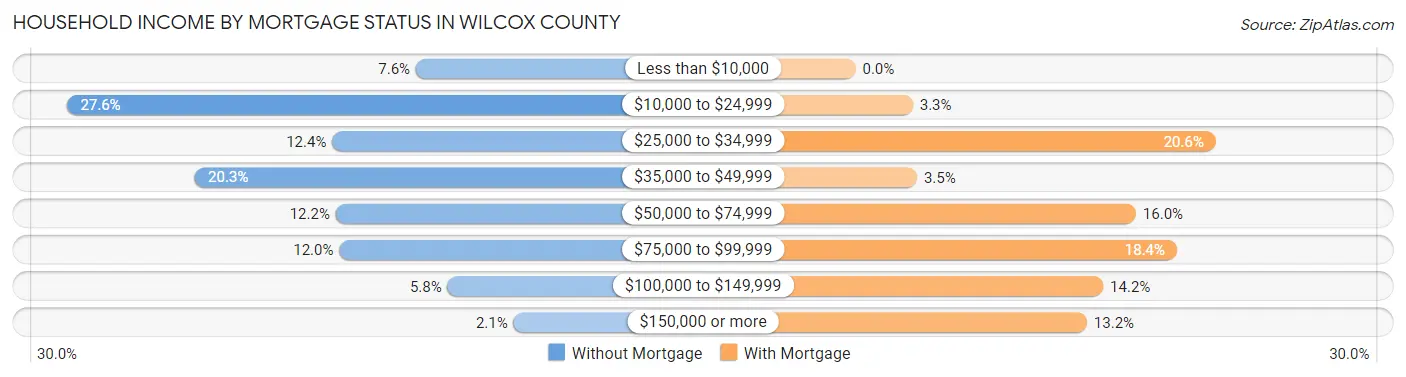
| Household Income | Without Mortgage | With Mortgage |
| Less than $10,000 | 152 (7.6%) | 0 (0.0%) |
| $10,000 to $24,999 | 548 (27.6%) | 28 (3.3%) |
| $25,000 to $34,999 | 247 (12.4%) | 176 (20.6%) |
| $35,000 to $49,999 | 403 (20.3%) | 30 (3.5%) |
| $50,000 to $74,999 | 243 (12.2%) | 137 (16.0%) |
| $75,000 to $99,999 | 239 (12.0%) | 157 (18.4%) |
| $100,000 to $149,999 | 116 (5.8%) | 121 (14.1%) |
| $150,000 or more | 41 (2.1%) | 113 (13.2%) |
| Total | 1,989 (100.0%) | 855 (100.0%) |
Property Value to Household Income Ratio in Wilcox County
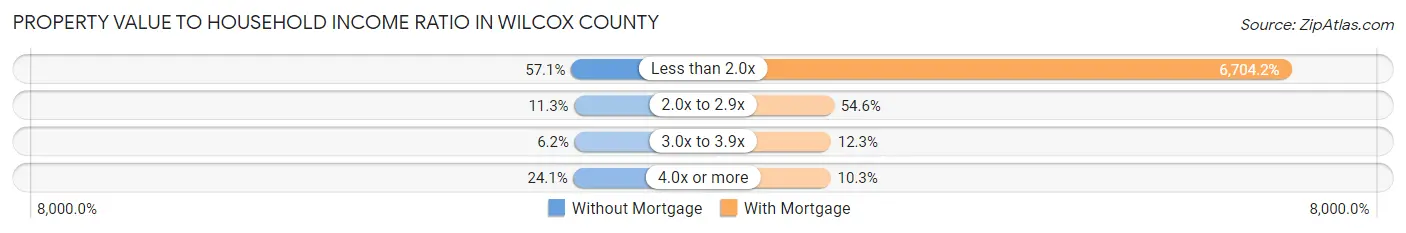
| Value-to-Income Ratio | Without Mortgage | With Mortgage |
| Less than 2.0x | 1,135 (57.1%) | 57,321 (6,704.2%) |
| 2.0x to 2.9x | 225 (11.3%) | 467 (54.6%) |
| 3.0x to 3.9x | 123 (6.2%) | 105 (12.3%) |
| 4.0x or more | 480 (24.1%) | 88 (10.3%) |
| Total | 1,989 (100.0%) | 855 (100.0%) |
Real Estate Taxes by Mortgage Status in Wilcox County
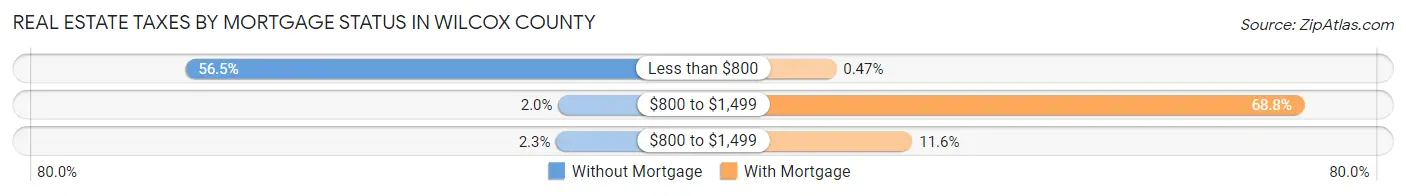
| Property Taxes | Without Mortgage | With Mortgage |
| Less than $800 | 1,124 (56.5%) | 4 (0.5%) |
| $800 to $1,499 | 40 (2.0%) | 588 (68.8%) |
| $800 to $1,499 | 46 (2.3%) | 99 (11.6%) |
| Total | 1,989 (100.0%) | 855 (100.0%) |
Health & Disability in Wilcox County
Health Insurance Coverage by Age in Wilcox County
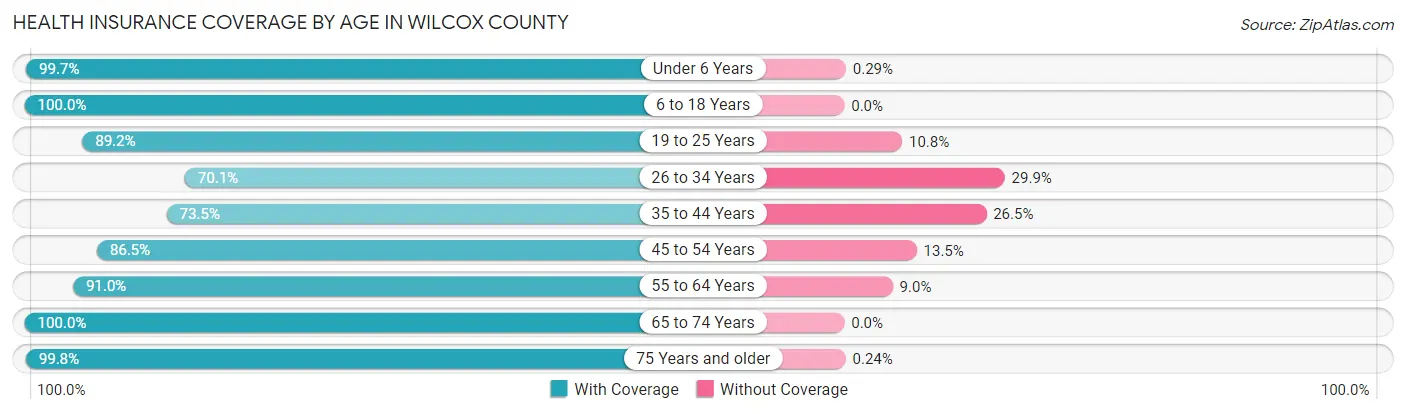
| Age Bracket | With Coverage | Without Coverage |
| Under 6 Years | 693 (99.7%) | 2 (0.3%) |
| 6 to 18 Years | 1,980 (100.0%) | 0 (0.0%) |
| 19 to 25 Years | 688 (89.2%) | 83 (10.8%) |
| 26 to 34 Years | 741 (70.1%) | 316 (29.9%) |
| 35 to 44 Years | 764 (73.5%) | 275 (26.5%) |
| 45 to 54 Years | 1,040 (86.5%) | 162 (13.5%) |
| 55 to 64 Years | 1,271 (91.0%) | 126 (9.0%) |
| 65 to 74 Years | 1,249 (100.0%) | 0 (0.0%) |
| 75 Years and older | 849 (99.8%) | 2 (0.2%) |
| Total | 9,275 (90.6%) | 966 (9.4%) |
Health Insurance Coverage by Citizenship Status in Wilcox County
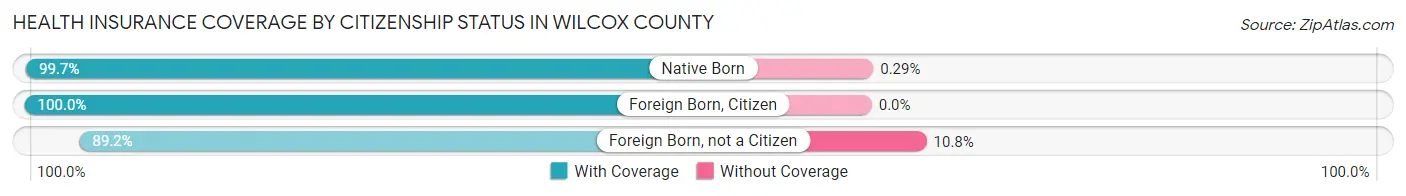
| Citizenship Status | With Coverage | Without Coverage |
| Native Born | 693 (99.7%) | 2 (0.3%) |
| Foreign Born, Citizen | 1,980 (100.0%) | 0 (0.0%) |
| Foreign Born, not a Citizen | 688 (89.2%) | 83 (10.8%) |
Health Insurance Coverage by Household Income in Wilcox County
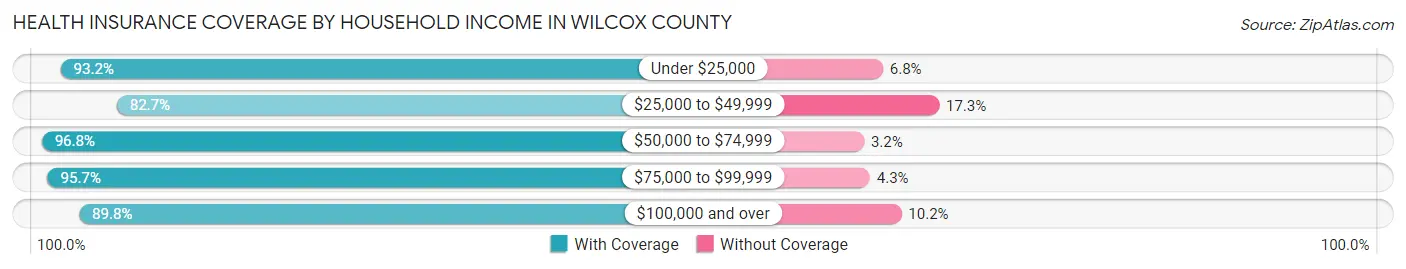
| Household Income | With Coverage | Without Coverage |
| Under $25,000 | 2,703 (93.2%) | 196 (6.8%) |
| $25,000 to $49,999 | 2,303 (82.7%) | 481 (17.3%) |
| $50,000 to $74,999 | 1,508 (96.8%) | 50 (3.2%) |
| $75,000 to $99,999 | 1,086 (95.7%) | 49 (4.3%) |
| $100,000 and over | 1,668 (89.8%) | 190 (10.2%) |
Public vs Private Health Insurance Coverage by Age in Wilcox County
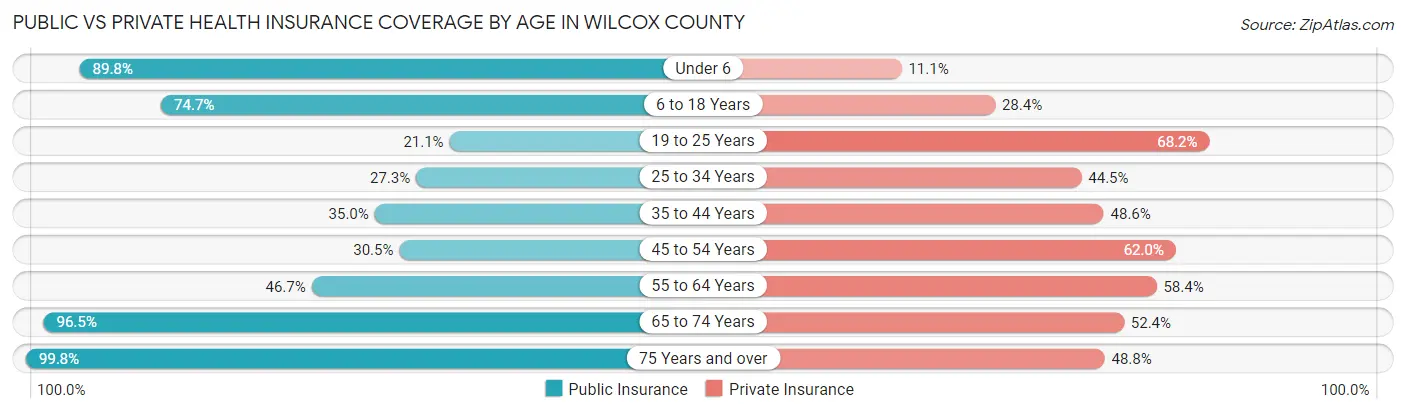
| Age Bracket | Public Insurance | Private Insurance |
| Under 6 | 624 (89.8%) | 77 (11.1%) |
| 6 to 18 Years | 1,478 (74.7%) | 563 (28.4%) |
| 19 to 25 Years | 163 (21.1%) | 526 (68.2%) |
| 25 to 34 Years | 289 (27.3%) | 470 (44.5%) |
| 35 to 44 Years | 364 (35.0%) | 505 (48.6%) |
| 45 to 54 Years | 366 (30.4%) | 745 (62.0%) |
| 55 to 64 Years | 653 (46.7%) | 816 (58.4%) |
| 65 to 74 Years | 1,205 (96.5%) | 654 (52.4%) |
| 75 Years and over | 849 (99.8%) | 415 (48.8%) |
| Total | 5,991 (58.5%) | 4,771 (46.6%) |
Disability Status by Sex by Age in Wilcox County
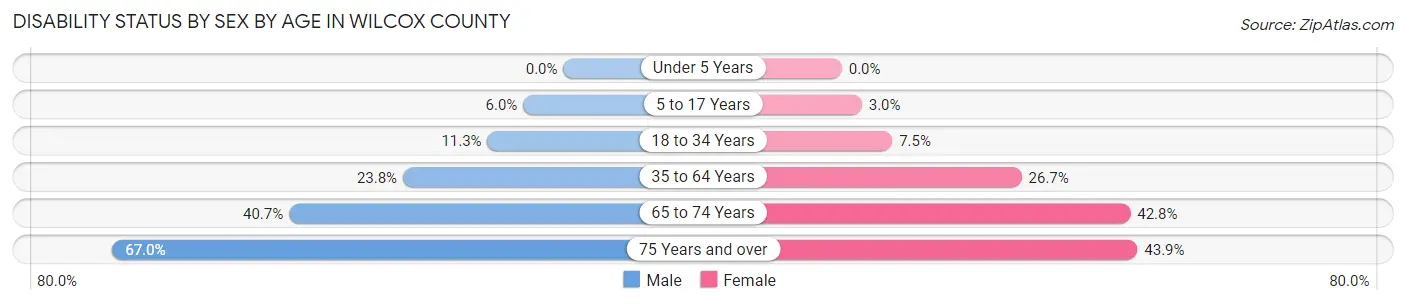
| Age Bracket | Male | Female |
| Under 5 Years | 0 (0.0%) | 0 (0.0%) |
| 5 to 17 Years | 53 (6.0%) | 25 (3.0%) |
| 18 to 34 Years | 124 (11.3%) | 76 (7.5%) |
| 35 to 64 Years | 384 (23.8%) | 541 (26.7%) |
| 65 to 74 Years | 233 (40.7%) | 290 (42.8%) |
| 75 Years and over | 219 (67.0%) | 230 (43.9%) |
Disability Class by Sex by Age in Wilcox County
Disability Class: Hearing Difficulty
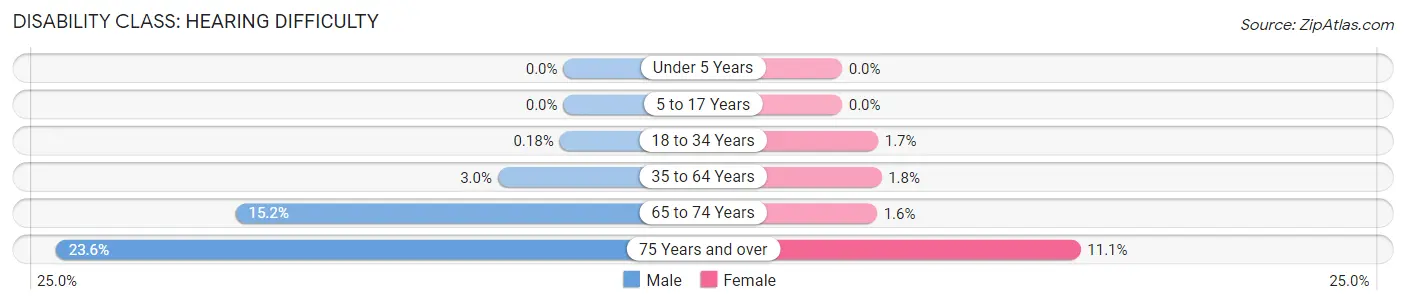
| Age Bracket | Male | Female |
| Under 5 Years | 0 (0.0%) | 0 (0.0%) |
| 5 to 17 Years | 0 (0.0%) | 0 (0.0%) |
| 18 to 34 Years | 2 (0.2%) | 17 (1.7%) |
| 35 to 64 Years | 49 (3.0%) | 37 (1.8%) |
| 65 to 74 Years | 87 (15.2%) | 11 (1.6%) |
| 75 Years and over | 77 (23.5%) | 58 (11.1%) |
Disability Class: Vision Difficulty
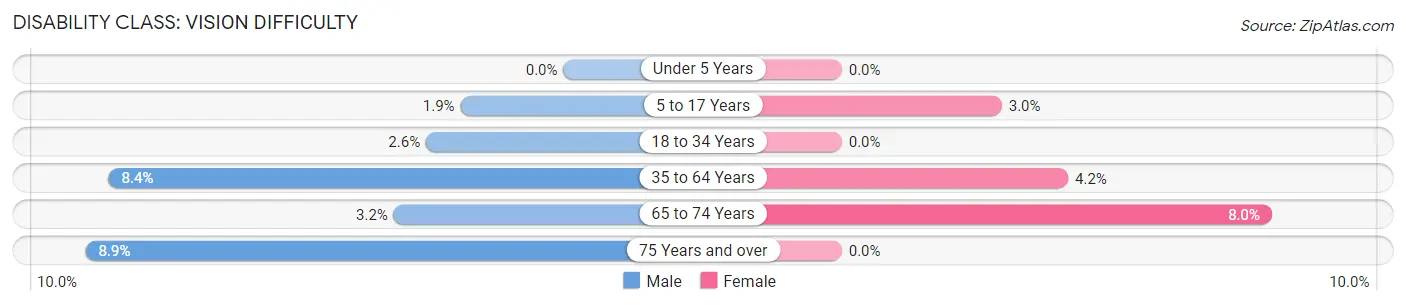
| Age Bracket | Male | Female |
| Under 5 Years | 0 (0.0%) | 0 (0.0%) |
| 5 to 17 Years | 17 (1.9%) | 25 (3.0%) |
| 18 to 34 Years | 28 (2.5%) | 0 (0.0%) |
| 35 to 64 Years | 136 (8.4%) | 85 (4.2%) |
| 65 to 74 Years | 18 (3.2%) | 54 (8.0%) |
| 75 Years and over | 29 (8.9%) | 0 (0.0%) |
Disability Class: Cognitive Difficulty
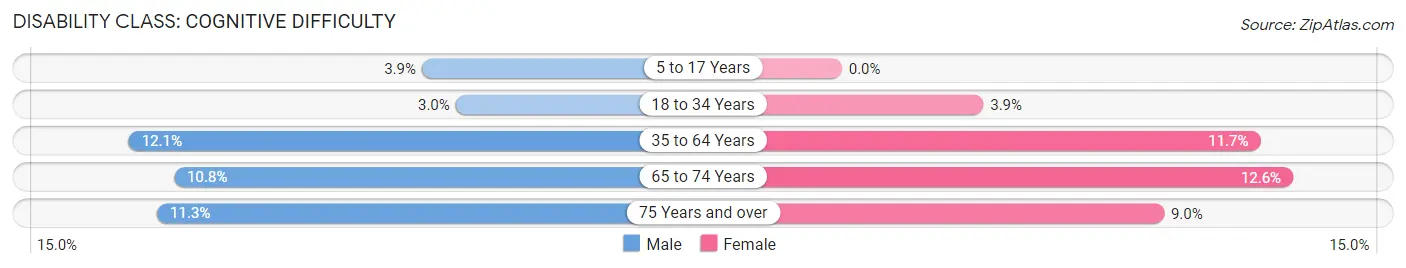
| Age Bracket | Male | Female |
| 5 to 17 Years | 35 (3.9%) | 0 (0.0%) |
| 18 to 34 Years | 33 (3.0%) | 40 (3.9%) |
| 35 to 64 Years | 195 (12.1%) | 236 (11.7%) |
| 65 to 74 Years | 62 (10.8%) | 85 (12.6%) |
| 75 Years and over | 37 (11.3%) | 47 (9.0%) |
Disability Class: Ambulatory Difficulty
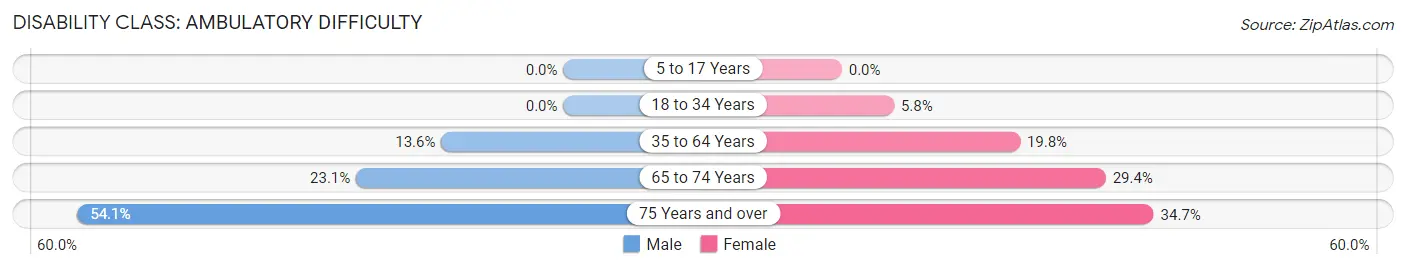
| Age Bracket | Male | Female |
| 5 to 17 Years | 0 (0.0%) | 0 (0.0%) |
| 18 to 34 Years | 0 (0.0%) | 59 (5.8%) |
| 35 to 64 Years | 219 (13.6%) | 402 (19.8%) |
| 65 to 74 Years | 132 (23.1%) | 199 (29.4%) |
| 75 Years and over | 177 (54.1%) | 182 (34.7%) |
Disability Class: Self-Care Difficulty
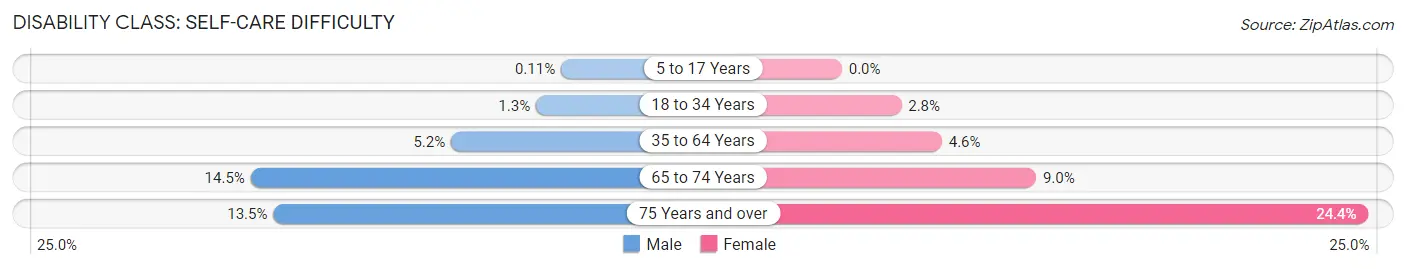
| Age Bracket | Male | Female |
| 5 to 17 Years | 1 (0.1%) | 0 (0.0%) |
| 18 to 34 Years | 14 (1.3%) | 28 (2.8%) |
| 35 to 64 Years | 84 (5.2%) | 94 (4.6%) |
| 65 to 74 Years | 83 (14.5%) | 61 (9.0%) |
| 75 Years and over | 44 (13.5%) | 128 (24.4%) |
Technology Access in Wilcox County
Computing Device Access in Wilcox County
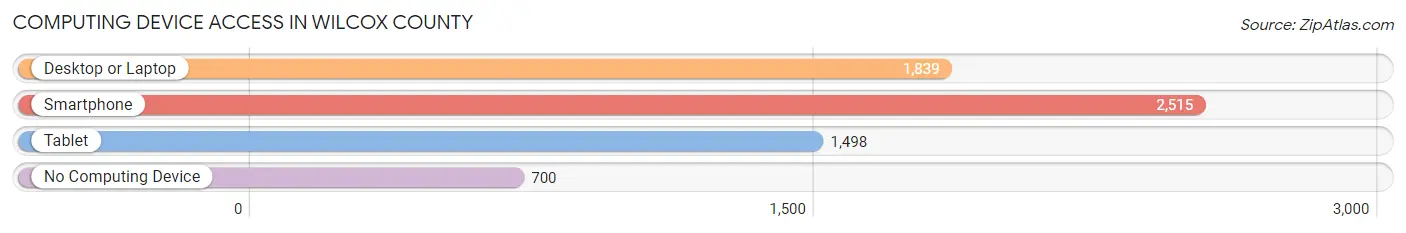
| Device Type | # Households | % Households |
| Desktop or Laptop | 1,839 | 51.4% |
| Smartphone | 2,515 | 70.3% |
| Tablet | 1,498 | 41.9% |
| No Computing Device | 700 | 19.6% |
| Total | 3,579 | 100.0% |
Internet Access in Wilcox County
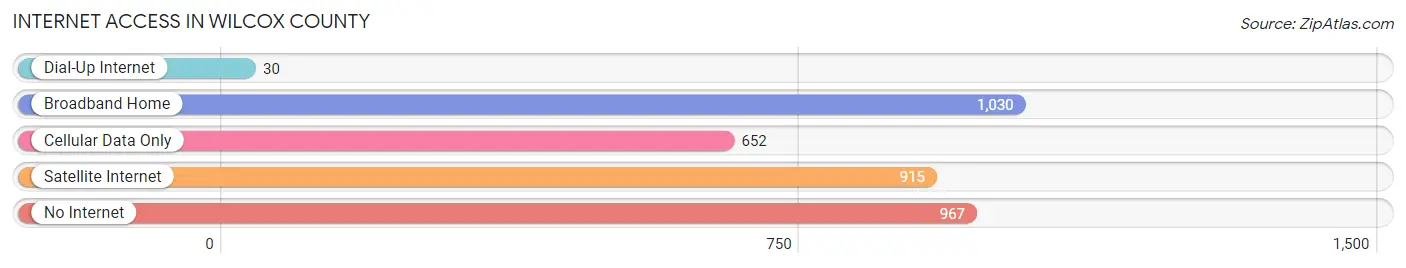
| Internet Type | # Households | % Households |
| Dial-Up Internet | 30 | 0.8% |
| Broadband Home | 1,030 | 28.8% |
| Cellular Data Only | 652 | 18.2% |
| Satellite Internet | 915 | 25.6% |
| No Internet | 967 | 27.0% |
| Total | 3,579 | 100.0% |
Wilcox County Summary
Wilcox County is located in the south-central region of Alabama, and is part of the Black Belt region of the state. The county was established in 1819 and is named after Joseph M. Wilcox, a Revolutionary War veteran. Wilcox County is bordered by Dallas County to the north, Monroe County to the east, Clarke County to the south, and Marengo County to the west. The county seat is Camden, and the largest city is Pine Hill.
Geography
Wilcox County covers an area of 845 square miles, making it the fourth-largest county in Alabama. The terrain is mostly flat, with some rolling hills in the northern part of the county. The county is drained by the Alabama River, which forms the western boundary of the county. The county is also home to several small creeks and streams, including the Little Uchee Creek, the Uchee Creek, and the Sepulga River.
The climate of Wilcox County is humid subtropical, with hot, humid summers and mild winters. The average annual temperature is around 68°F, and the average annual precipitation is around 50 inches.
Demographics
As of the 2010 census, Wilcox County had a population of 11,670. The racial makeup of the county was 57.3% African American, 40.2% White, 0.3% Native American, 0.2% Asian, 0.1% Pacific Islander, 0.7% from other races, and 1.4% from two or more races. Hispanic or Latino of any race were 1.7% of the population.
The median household income in Wilcox County was $25,945, and the median family income was $32,917. The per capita income was $14,845. About 28.2% of the population was below the poverty line.
Economy
The economy of Wilcox County is largely based on agriculture. The county is home to several large farms, and the main crops grown in the county are cotton, corn, soybeans, and peanuts. The county is also home to several timber companies, and the timber industry is a major source of employment in the county.
In addition to agriculture, Wilcox County is home to several manufacturing companies, including a paper mill, a furniture factory, and a textile mill. The county is also home to several retail stores, restaurants, and other businesses.
History
Wilcox County was established in 1819, and was named after Joseph M. Wilcox, a Revolutionary War veteran. The county was originally part of the Choctaw Nation, and was later part of the Creek Nation. The county was home to several Native American tribes, including the Choctaw, Creek, and Chickasaw.
The county was home to several plantations during the antebellum period, and the economy of the county was largely based on cotton production. After the Civil War, the county was home to several freedmen's towns, and the economy of the county shifted to small-scale farming.
In the early 20th century, the timber industry began to grow in the county, and the economy of the county shifted to timber production. The county was also home to several manufacturing companies, and the economy of the county continued to diversify.
Today, Wilcox County is a rural county with a largely agricultural economy. The county is home to several large farms, and the main crops grown in the county are cotton, corn, soybeans, and peanuts. The county is also home to several timber companies, and the timber industry is a major source of employment in the county. In addition to agriculture, Wilcox County is home to several manufacturing companies, including a paper mill, a furniture factory, and a textile mill. The county is also home to several retail stores, restaurants, and other businesses.
Common Questions
What is the Total Population of Wilcox County?
Total Population of Wilcox County is 10,441.
What is the Total Male Population of Wilcox County?
Total Male Population of Wilcox County is 4,892.
What is the Total Female Population of Wilcox County?
Total Female Population of Wilcox County is 5,549.
What is the Ratio of Males per 100 Females in Wilcox County?
There are 88.16 Males per 100 Females in Wilcox County.
What is the Ratio of Females per 100 Males in Wilcox County?
There are 113.43 Females per 100 Males in Wilcox County.
What is the Median Population Age in Wilcox County?
Median Population Age in Wilcox County is 41.1 Years.
What is the Average Family Size in Wilcox County
Average Family Size in Wilcox County is 3.8 People.
What is the Average Household Size in Wilcox County
Average Household Size in Wilcox County is 2.9 People.
What is Per Capita Income in Wilcox County?
Per Capita income in Wilcox County is $20,442.
What is the Median Family Income in Wilcox County?
Median Family Income in Wilcox County is $46,269.
What is the Median Household income in Wilcox County?
Median Household Income in Wilcox County is $38,208.
What is Income or Wage Gap in Wilcox County?
Income or Wage Gap in Wilcox County is 41.9%.
Women in Wilcox County earn 58.1 cents for every dollar earned by a man.
What is Family Income Deficit in Wilcox County?
Family Income Deficit in Wilcox County is $9,657.
Families that are below poverty line in Wilcox County earn $9,657 less on average than the poverty threshold level.
What is Inequality or Gini Index in Wilcox County?
Inequality or Gini Index in Wilcox County is 0.46.
How Large is the Labor Force in Wilcox County?
There are 3,748 People in the Labor Forcein in Wilcox County.
What is the Percentage of People in the Labor Force in Wilcox County?
44.8% of People are in the Labor Force in Wilcox County.
What is the Unemployment Rate in Wilcox County?
Unemployment Rate in Wilcox County is 10.7%.