Marengo County, AL
Marengo County Map

Marengo County Overview
19,180
TOTAL POPULATION
9,100
MALE POPULATION
10,080
FEMALE POPULATION
90.28
MALES / 100 FEMALES
110.77
FEMALES / 100 MALES
41.7
MEDIAN AGE
3.6
AVG FAMILY SIZE
2.6
AVG HOUSEHOLD SIZE
$27,210
PER CAPITA INCOME
$67,083
AVG FAMILY INCOME
$42,975
AVG HOUSEHOLD INCOME
38.5%
WAGE / INCOME GAP [ % ]
61.5¢/ $1
WAGE / INCOME GAP [ $ ]
$9,853
FAMILY INCOME DEFICIT
0.52
INEQUALITY / GINI INDEX
7,810
LABOR FORCE [ PEOPLE ]
50.6%
PERCENT IN LABOR FORCE
2.8%
UNEMPLOYMENT RATE
Marengo County Area Codes
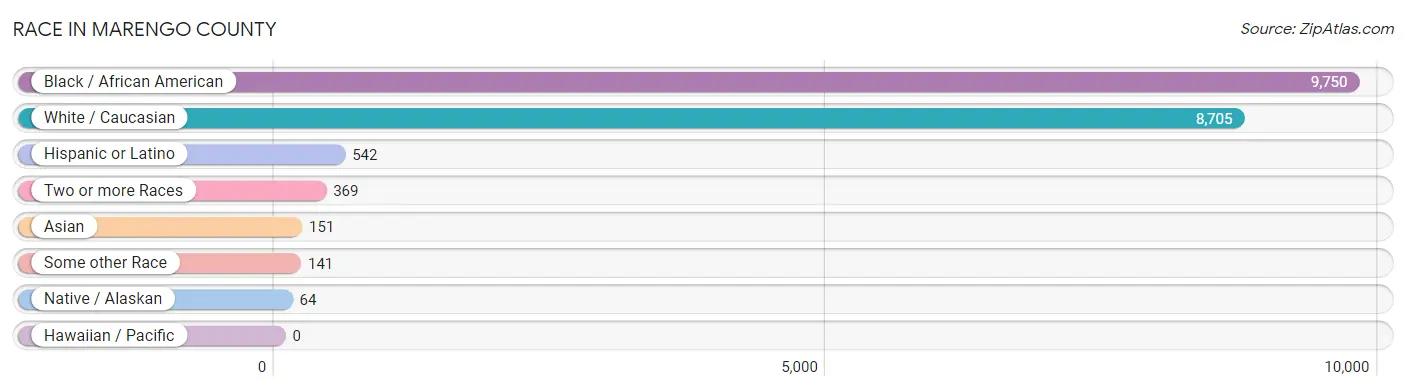
Race in Marengo County
The most populous races in Marengo County are Black / African American (9,750 | 50.8%), White / Caucasian (8,705 | 45.4%), and Hispanic or Latino (542 | 2.8%).
| Race | # Population | % Population |
| Asian | 151 | 0.8% |
| Black / African American | 9,750 | 50.8% |
| Hawaiian / Pacific | 0 | 0.0% |
| Hispanic or Latino | 542 | 2.8% |
| Native / Alaskan | 64 | 0.3% |
| White / Caucasian | 8,705 | 45.4% |
| Two or more Races | 369 | 1.9% |
| Some other Race | 141 | 0.7% |
| Total | 19,180 | 100.0% |
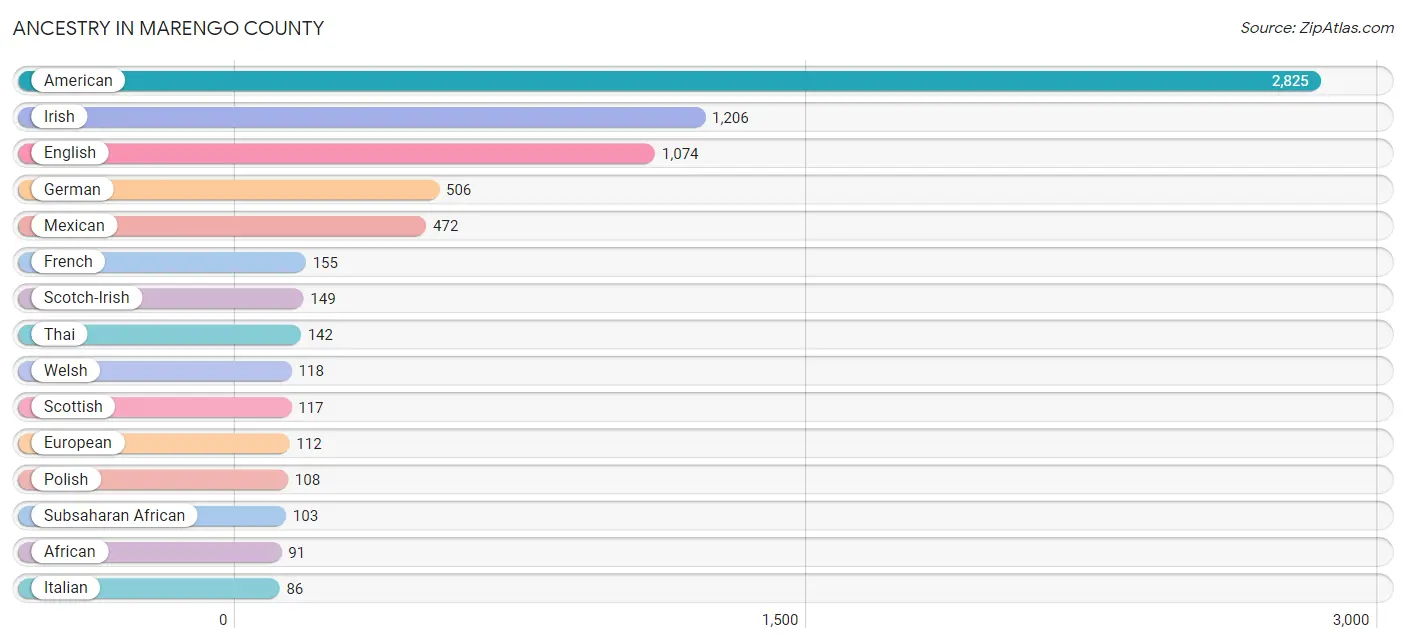
Ancestry in Marengo County
The most populous ancestries reported in Marengo County are American (2,825 | 14.7%), Irish (1,206 | 6.3%), English (1,074 | 5.6%), German (506 | 2.6%), and Mexican (472 | 2.5%), together accounting for 31.7% of all Marengo County residents.
| Ancestry | # Population | % Population |
| African | 91 | 0.5% |
| American | 2,825 | 14.7% |
| Arab | 5 | 0.0% |
| British | 6 | 0.0% |
| Canadian | 26 | 0.1% |
| Cherokee | 79 | 0.4% |
| Dutch | 18 | 0.1% |
| Eastern European | 11 | 0.1% |
| English | 1,074 | 5.6% |
| European | 112 | 0.6% |
| Finnish | 16 | 0.1% |
| French | 155 | 0.8% |
| French Canadian | 18 | 0.1% |
| German | 506 | 2.6% |
| Greek | 29 | 0.2% |
| Hungarian | 11 | 0.1% |
| Irish | 1,206 | 6.3% |
| Italian | 86 | 0.4% |
| Korean | 9 | 0.1% |
| Lebanese | 5 | 0.0% |
| Mexican | 472 | 2.5% |
| Mexican American Indian | 28 | 0.2% |
| Nigerian | 12 | 0.1% |
| Peruvian | 22 | 0.1% |
| Polish | 108 | 0.6% |
| Portuguese | 21 | 0.1% |
| Puerto Rican | 39 | 0.2% |
| Scotch-Irish | 149 | 0.8% |
| Scottish | 117 | 0.6% |
| Slovak | 10 | 0.1% |
| South American | 22 | 0.1% |
| Spaniard | 7 | 0.0% |
| Subsaharan African | 103 | 0.5% |
| Swedish | 15 | 0.1% |
| Thai | 142 | 0.7% |
| Welsh | 118 | 0.6% | View All 36 Rows |
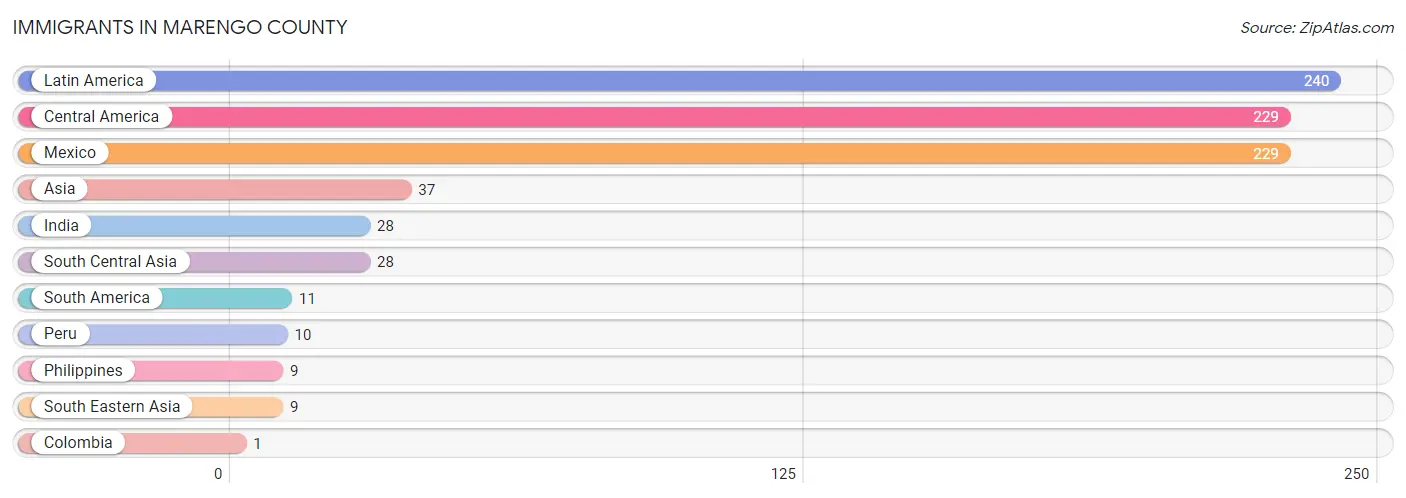
Immigrants in Marengo County
The most numerous immigrant groups reported in Marengo County came from Latin America (240 | 1.3%), Central America (229 | 1.2%), Mexico (229 | 1.2%), Asia (37 | 0.2%), and India (28 | 0.2%), together accounting for 4.0% of all Marengo County residents.
| Immigration Origin | # Population | % Population |
| Asia | 37 | 0.2% |
| Central America | 229 | 1.2% |
| Colombia | 1 | 0.0% |
| India | 28 | 0.2% |
| Latin America | 240 | 1.3% |
| Mexico | 229 | 1.2% |
| Peru | 10 | 0.1% |
| Philippines | 9 | 0.1% |
| South America | 11 | 0.1% |
| South Central Asia | 28 | 0.2% |
| South Eastern Asia | 9 | 0.1% | View All 11 Rows |
Sex and Age in Marengo County
Sex and Age in Marengo County
The most populous age groups in Marengo County are Under 5 Years (780 | 8.6%) for men and 55 to 59 Years (804 | 8.0%) for women.

| Age Bracket | Male | Female |
| Under 5 Years | 780 (8.6%) | 457 (4.5%) |
| 5 to 9 Years | 471 (5.2%) | 536 (5.3%) |
| 10 to 14 Years | 694 (7.6%) | 675 (6.7%) |
| 15 to 19 Years | 576 (6.3%) | 796 (7.9%) |
| 20 to 24 Years | 501 (5.5%) | 697 (6.9%) |
| 25 to 29 Years | 596 (6.6%) | 266 (2.6%) |
| 30 to 34 Years | 338 (3.7%) | 658 (6.5%) |
| 35 to 39 Years | 479 (5.3%) | 744 (7.4%) |
| 40 to 44 Years | 678 (7.4%) | 349 (3.5%) |
| 45 to 49 Years | 517 (5.7%) | 614 (6.1%) |
| 50 to 54 Years | 566 (6.2%) | 654 (6.5%) |
| 55 to 59 Years | 606 (6.7%) | 804 (8.0%) |
| 60 to 64 Years | 608 (6.7%) | 702 (7.0%) |
| 65 to 69 Years | 551 (6.0%) | 703 (7.0%) |
| 70 to 74 Years | 501 (5.5%) | 451 (4.5%) |
| 75 to 79 Years | 284 (3.1%) | 372 (3.7%) |
| 80 to 84 Years | 161 (1.8%) | 217 (2.1%) |
| 85 Years and over | 193 (2.1%) | 385 (3.8%) |
| Total | 9,100 (100.0%) | 10,080 (100.0%) |
Families and Households in Marengo County
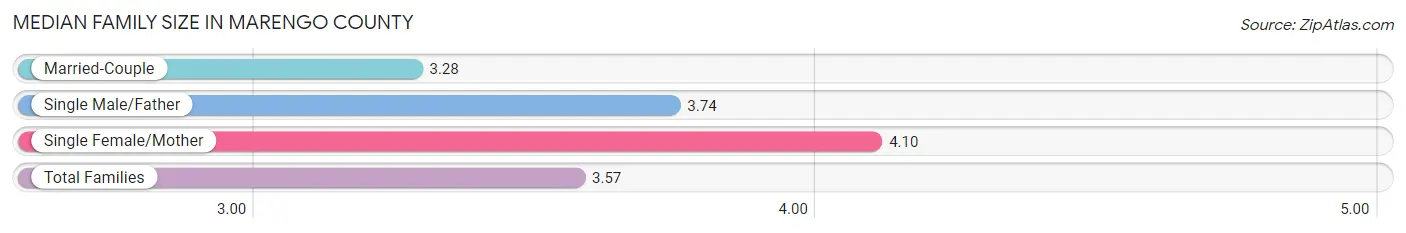
Median Family Size in Marengo County
The median family size in Marengo County is 3.57 persons per family, with single female/mother families (1,329 | 31.8%) accounting for the largest median family size of 4.1 persons per family. On the other hand, married-couple families (2,578 | 61.8%) represent the smallest median family size with 3.28 persons per family.
| Family Type | # Families | Family Size |
| Married-Couple | 2,578 (61.8%) | 3.28 |
| Single Male/Father | 268 (6.4%) | 3.74 |
| Single Female/Mother | 1,329 (31.8%) | 4.10 |
| Total Families | 4,175 (100.0%) | 3.57 |
Median Household Size in Marengo County
The median household size in Marengo County is 2.56 persons per household, with single male/father households (268 | 3.6%) accounting for the largest median household size of 4.62 persons per household. non-family households (3,204 | 43.4%) represent the smallest median household size with 1.11 persons per household.
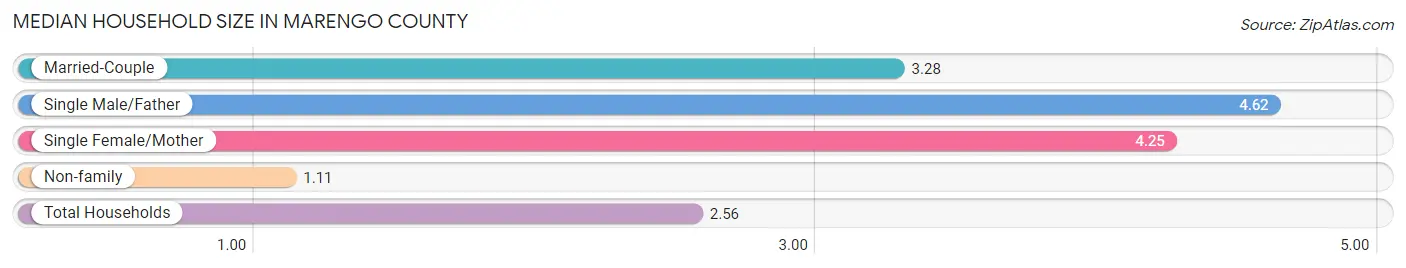
| Household Type | # Households | Household Size |
| Married-Couple | 2,578 (34.9%) | 3.28 |
| Single Male/Father | 268 (3.6%) | 4.62 |
| Single Female/Mother | 1,329 (18.0%) | 4.25 |
| Non-family | 3,204 (43.4%) | 1.11 |
| Total Households | 7,379 (100.0%) | 2.56 |
Household Size by Marriage Status in Marengo County
Out of a total of 7,379 households in Marengo County, 4,175 (56.6%) are family households, while 3,204 (43.4%) are nonfamily households. The most numerous type of family households are 2-person households, comprising 2,383, and the most common type of nonfamily households are 1-person households, comprising 3,065.
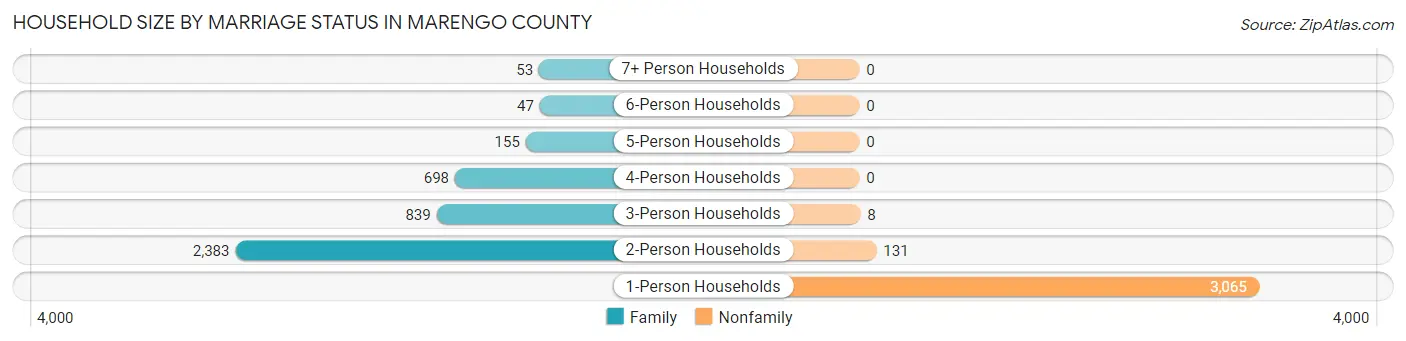
| Household Size | Family Households | Nonfamily Households |
| 1-Person Households | - | 3,065 (41.5%) |
| 2-Person Households | 2,383 (32.3%) | 131 (1.8%) |
| 3-Person Households | 839 (11.4%) | 8 (0.1%) |
| 4-Person Households | 698 (9.5%) | 0 (0.0%) |
| 5-Person Households | 155 (2.1%) | 0 (0.0%) |
| 6-Person Households | 47 (0.6%) | 0 (0.0%) |
| 7+ Person Households | 53 (0.7%) | 0 (0.0%) |
| Total | 4,175 (56.6%) | 3,204 (43.4%) |
Female Fertility in Marengo County
Fertility by Age in Marengo County
Average fertility rate in Marengo County is 39.0 births per 1,000 women. Women in the age bracket of 20 to 34 years have the highest fertility rate with 58.0 births per 1,000 women. Women in the age bracket of 20 to 34 years acount for 55.6% of all women with births.

| Age Bracket | Women with Births | Births / 1,000 Women |
| 15 to 19 years | 16 (9.5%) | 20.0 |
| 20 to 34 years | 94 (55.6%) | 58.0 |
| 35 to 50 years | 59 (34.9%) | 31.0 |
| Total | 169 (100.0%) | 39.0 |
Fertility by Age by Marriage Status in Marengo County
71.6% of women with births (169) in Marengo County are married. The highest percentage of unmarried women with births falls into 15 to 19 years age bracket with 100.0% of them unmarried at the time of birth, while the lowest percentage of unmarried women with births belong to 35 to 50 years age bracket with 0.0% of them unmarried.

| Age Bracket | Married | Unmarried |
| 15 to 19 years | 0 (0.0%) | 16 (100.0%) |
| 20 to 34 years | 62 (66.0%) | 32 (34.0%) |
| 35 to 50 years | 59 (100.0%) | 0 (0.0%) |
| Total | 121 (71.6%) | 48 (28.4%) |
Fertility by Education in Marengo County
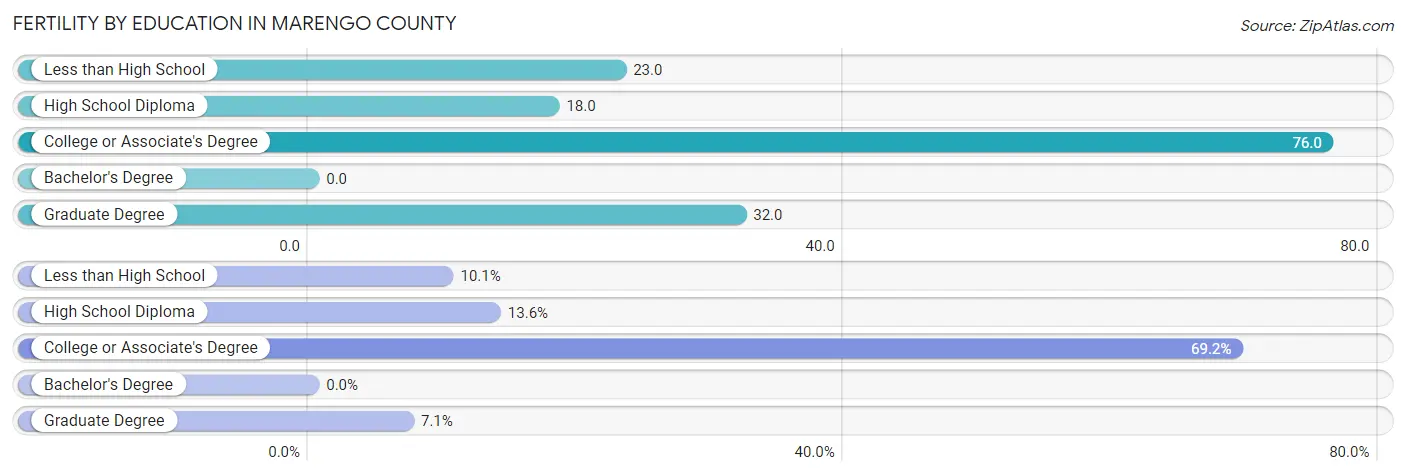
| Educational Attainment | Women with Births | Births / 1,000 Women |
| Less than High School | 17 (10.1%) | 23.0 |
| High School Diploma | 23 (13.6%) | 18.0 |
| College or Associate's Degree | 117 (69.2%) | 76.0 |
| Bachelor's Degree | 0 (0.0%) | 0.0 |
| Graduate Degree | 12 (7.1%) | 32.0 |
| Total | 169 (100.0%) | 39.0 |
Fertility by Education by Marriage Status in Marengo County
28.4% of women with births in Marengo County are unmarried. Women with the educational attainment of graduate degree are most likely to be married with 100.0% of them married at childbirth, while women with the educational attainment of less than high school are least likely to be married with 100.0% of them unmarried at childbirth.

| Educational Attainment | Married | Unmarried |
| Less than High School | 0 (0.0%) | 17 (100.0%) |
| High School Diploma | 4 (17.4%) | 19 (82.6%) |
| College or Associate's Degree | 105 (89.7%) | 12 (10.3%) |
| Bachelor's Degree | 0 (0.0%) | 0 (0.0%) |
| Graduate Degree | 12 (100.0%) | 0 (0.0%) |
| Total | 121 (71.6%) | 48 (28.4%) |
Income in Marengo County
Income Overview in Marengo County
Per Capita Income in Marengo County is $27,210, while median incomes of families and households are $67,083 and $42,975 respectively.
| Characteristic | Number | Measure |
| Per Capita Income | 19,180 | $27,210 |
| Median Family Income | 4,175 | $67,083 |
| Mean Family Income | 4,175 | $89,341 |
| Median Household Income | 7,379 | $42,975 |
| Mean Household Income | 7,379 | $65,484 |
| Income Deficit | 4,175 | $9,853 |
| Wage / Income Gap (%) | 19,180 | 38.47% |
| Wage / Income Gap ($) | 19,180 | 61.53¢ per $1 |
| Gini / Inequality Index | 19,180 | 0.52 |
Earnings by Sex in Marengo County
Average Earnings in Marengo County are $33,159, $44,099 for men and $27,136 for women, a difference of 38.5%.
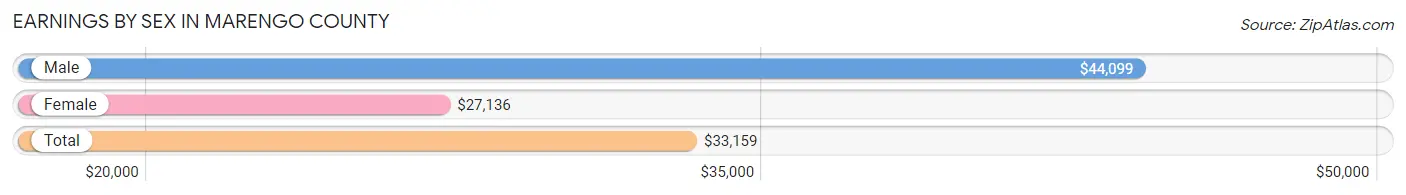
| Sex | Number | Average Earnings |
| Male | 4,119 (49.7%) | $44,099 |
| Female | 4,174 (50.3%) | $27,136 |
| Total | 8,293 (100.0%) | $33,159 |
Earnings by Sex by Income Bracket in Marengo County
The most common earnings brackets in Marengo County are $55,000 to $64,999 for men (603 | 14.6%) and $55,000 to $64,999 for women (457 | 11.0%).
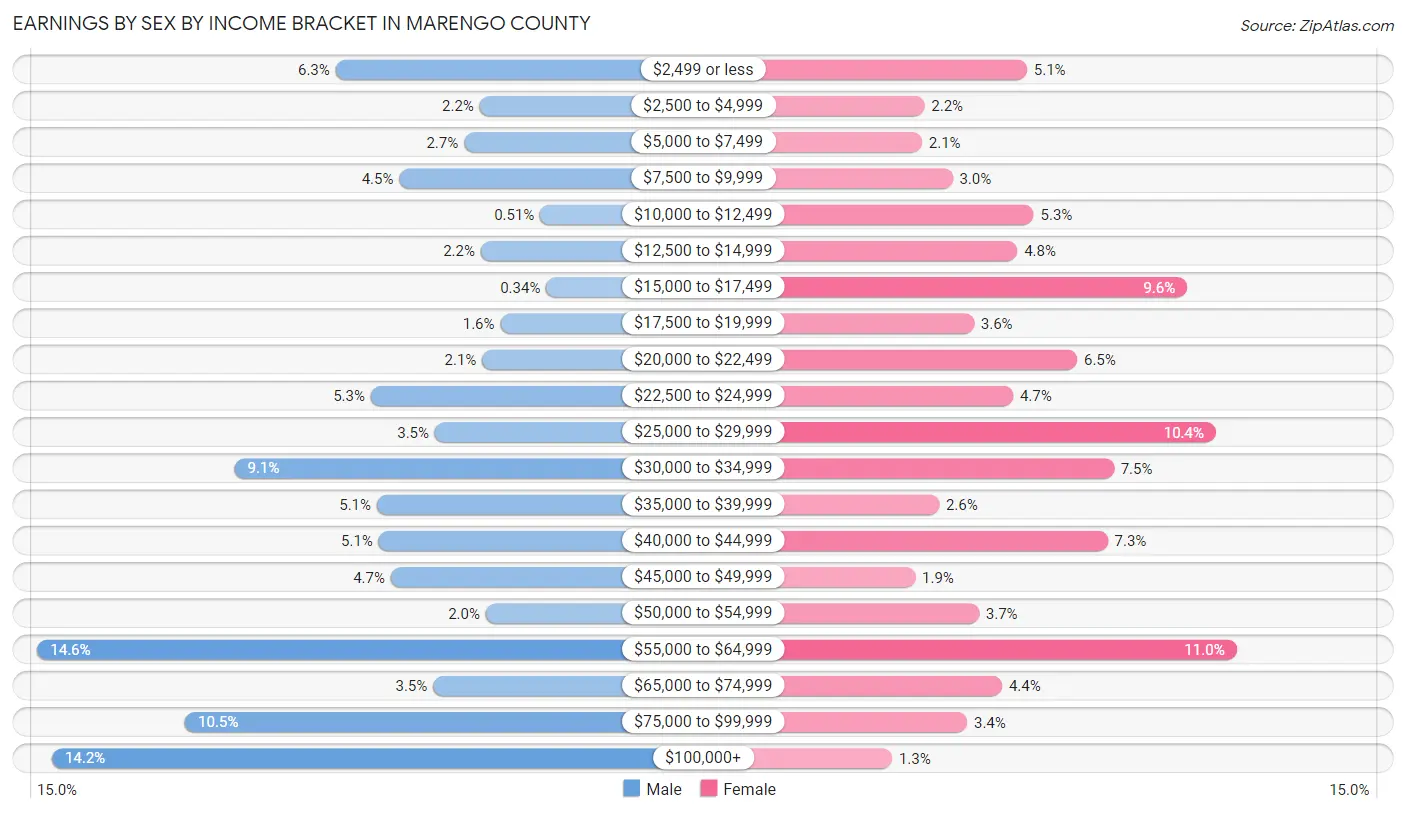
| Income | Male | Female |
| $2,499 or less | 258 (6.3%) | 211 (5.1%) |
| $2,500 to $4,999 | 91 (2.2%) | 91 (2.2%) |
| $5,000 to $7,499 | 109 (2.6%) | 88 (2.1%) |
| $7,500 to $9,999 | 184 (4.5%) | 124 (3.0%) |
| $10,000 to $12,499 | 21 (0.5%) | 219 (5.2%) |
| $12,500 to $14,999 | 90 (2.2%) | 200 (4.8%) |
| $15,000 to $17,499 | 14 (0.3%) | 399 (9.6%) |
| $17,500 to $19,999 | 67 (1.6%) | 149 (3.6%) |
| $20,000 to $22,499 | 88 (2.1%) | 270 (6.5%) |
| $22,500 to $24,999 | 217 (5.3%) | 195 (4.7%) |
| $25,000 to $29,999 | 143 (3.5%) | 433 (10.4%) |
| $30,000 to $34,999 | 375 (9.1%) | 313 (7.5%) |
| $35,000 to $39,999 | 210 (5.1%) | 108 (2.6%) |
| $40,000 to $44,999 | 208 (5.1%) | 306 (7.3%) |
| $45,000 to $49,999 | 194 (4.7%) | 80 (1.9%) |
| $50,000 to $54,999 | 84 (2.0%) | 155 (3.7%) |
| $55,000 to $64,999 | 603 (14.6%) | 457 (11.0%) |
| $65,000 to $74,999 | 145 (3.5%) | 182 (4.4%) |
| $75,000 to $99,999 | 432 (10.5%) | 141 (3.4%) |
| $100,000+ | 586 (14.2%) | 53 (1.3%) |
| Total | 4,119 (100.0%) | 4,174 (100.0%) |
Earnings by Sex by Educational Attainment in Marengo County
Average earnings in Marengo County are $49,698 for men and $31,213 for women, a difference of 37.2%. Men with an educational attainment of graduate degree enjoy the highest average annual earnings of $98,782, while those with less than high school education earn the least with $38,750. Women with an educational attainment of graduate degree earn the most with the average annual earnings of $53,560, while those with high school diploma education have the smallest earnings of $25,978.

| Educational Attainment | Male Income | Female Income |
| Less than High School | $38,750 | $32,791 |
| High School Diploma | $45,773 | $25,978 |
| College or Associate's Degree | $62,730 | $31,767 |
| Bachelor's Degree | $50,000 | $36,746 |
| Graduate Degree | $98,782 | $53,560 |
| Total | $49,698 | $31,213 |
Family Income in Marengo County
Family Income Brackets in Marengo County
According to the Marengo County family income data, there are 1,048 families falling into the $50,000 to $74,999 income range, which is the most common income bracket and makes up 25.1% of all families. Conversely, the $10,000 to $14,999 income bracket is the least frequent group with only 142 families (3.4%) belonging to this category.

| Income Bracket | # Families | % Families |
| Less than $10,000 | 171 | 4.1% |
| $10,000 to $14,999 | 142 | 3.4% |
| $15,000 to $24,999 | 409 | 9.8% |
| $25,000 to $34,999 | 175 | 4.2% |
| $35,000 to $49,999 | 543 | 13.0% |
| $50,000 to $74,999 | 1,048 | 25.1% |
| $75,000 to $99,999 | 418 | 10.0% |
| $100,000 to $149,999 | 660 | 15.8% |
| $150,000 to $199,999 | 338 | 8.1% |
| $200,000+ | 267 | 6.4% |
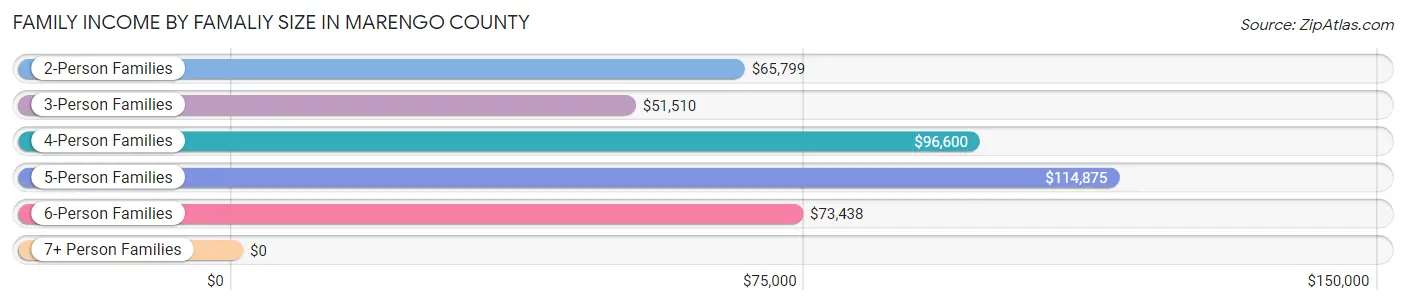
Family Income by Famaliy Size in Marengo County
5-person families (153 | 3.7%) account for the highest median family income in Marengo County with $114,875 per family, while 2-person families (2,529 | 60.6%) have the highest median income of $32,900 per family member.
| Income Bracket | # Families | Median Income |
| 2-Person Families | 2,529 (60.6%) | $65,799 |
| 3-Person Families | 781 (18.7%) | $51,510 |
| 4-Person Families | 618 (14.8%) | $96,600 |
| 5-Person Families | 153 (3.7%) | $114,875 |
| 6-Person Families | 47 (1.1%) | $73,438 |
| 7+ Person Families | 47 (1.1%) | $0 |
| Total | 4,175 (100.0%) | $67,083 |
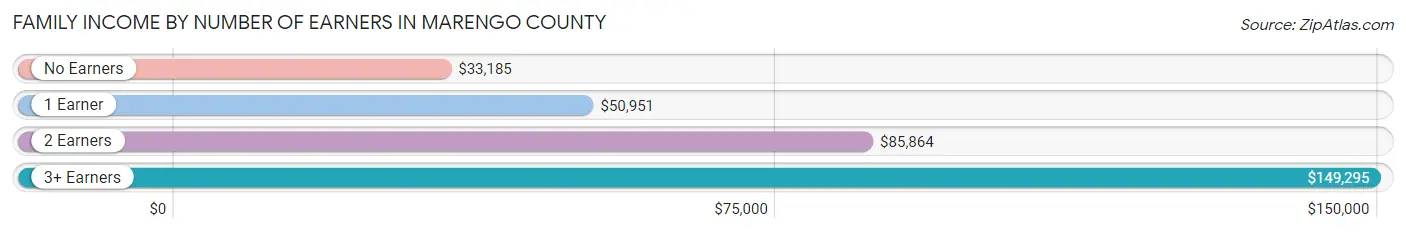
Family Income by Number of Earners in Marengo County
The median family income in Marengo County is $67,083, with families comprising 3+ earners (357) having the highest median family income of $149,295, while families with no earners (1,033) have the lowest median family income of $33,185, accounting for 8.6% and 24.7% of families, respectively.
| Number of Earners | # Families | Median Income |
| No Earners | 1,033 (24.7%) | $33,185 |
| 1 Earner | 1,141 (27.3%) | $50,951 |
| 2 Earners | 1,644 (39.4%) | $85,864 |
| 3+ Earners | 357 (8.6%) | $149,295 |
| Total | 4,175 (100.0%) | $67,083 |
Household Income in Marengo County
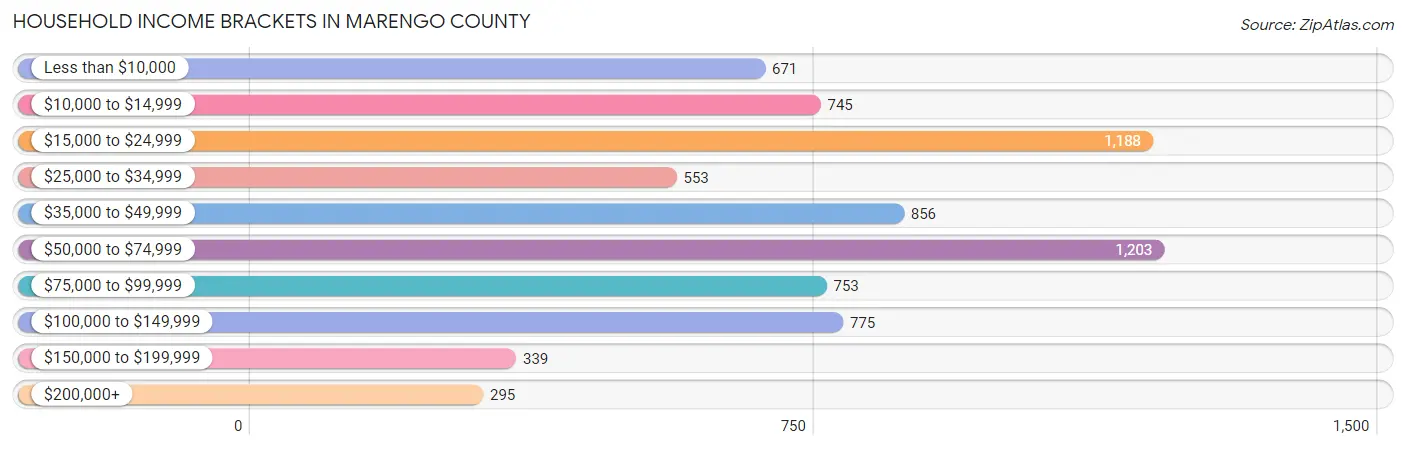
Household Income Brackets in Marengo County
With 1,203 households falling in the category, the $50,000 to $74,999 income range is the most frequent in Marengo County, accounting for 16.3% of all households. In contrast, only 295 households (4.0%) fall into the $200,000+ income bracket, making it the least populous group.
| Income Bracket | # Households | % Households |
| Less than $10,000 | 671 | 9.1% |
| $10,000 to $14,999 | 745 | 10.1% |
| $15,000 to $24,999 | 1,188 | 16.1% |
| $25,000 to $34,999 | 553 | 7.5% |
| $35,000 to $49,999 | 856 | 11.6% |
| $50,000 to $74,999 | 1,203 | 16.3% |
| $75,000 to $99,999 | 753 | 10.2% |
| $100,000 to $149,999 | 775 | 10.5% |
| $150,000 to $199,999 | 339 | 4.6% |
| $200,000+ | 295 | 4.0% |
Household Income by Householder Age in Marengo County
The median household income in Marengo County is $42,975, with the highest median household income of $59,605 found in the 45 to 64 years age bracket for the primary householder. A total of 3,040 households (41.2%) fall into this category. Meanwhile, the 15 to 24 years age bracket for the primary householder has the lowest median household income of $20,552, with 245 households (3.3%) in this group.
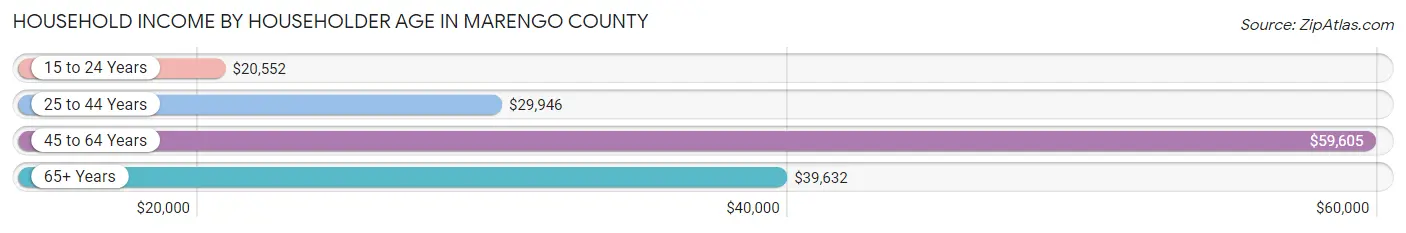
| Income Bracket | # Households | Median Income |
| 15 to 24 Years | 245 (3.3%) | $20,552 |
| 25 to 44 Years | 1,807 (24.5%) | $29,946 |
| 45 to 64 Years | 3,040 (41.2%) | $59,605 |
| 65+ Years | 2,287 (31.0%) | $39,632 |
| Total | 7,379 (100.0%) | $42,975 |
Poverty in Marengo County
Income Below Poverty by Sex and Age in Marengo County
With 18.8% poverty level for males and 23.8% for females among the residents of Marengo County, under 5 year old males and 5 year old females are the most vulnerable to poverty, with 394 males (50.8%) and 44 females (93.6%) in their respective age groups living below the poverty level.

| Age Bracket | Male | Female |
| Under 5 Years | 394 (50.8%) | 160 (35.0%) |
| 5 Years | 0 (0.0%) | 44 (93.6%) |
| 6 to 11 Years | 279 (42.8%) | 330 (39.6%) |
| 12 to 14 Years | 11 (2.3%) | 46 (14.1%) |
| 15 Years | 28 (35.4%) | 39 (72.2%) |
| 16 and 17 Years | 27 (11.4%) | 24 (6.5%) |
| 18 to 24 Years | 196 (26.1%) | 412 (38.4%) |
| 25 to 34 Years | 14 (1.5%) | 248 (26.8%) |
| 35 to 44 Years | 158 (13.9%) | 227 (20.8%) |
| 45 to 54 Years | 83 (7.7%) | 203 (16.1%) |
| 55 to 64 Years | 169 (14.1%) | 238 (15.8%) |
| 65 to 74 Years | 223 (21.7%) | 243 (21.2%) |
| 75 Years and over | 108 (17.6%) | 159 (18.2%) |
| Total | 1,690 (18.8%) | 2,373 (23.8%) |
Income Above Poverty by Sex and Age in Marengo County
According to the poverty statistics in Marengo County, males aged 5 years and females aged 16 and 17 years are the age groups that are most secure financially, with 100.0% of males and 93.5% of females in these age groups living above the poverty line.
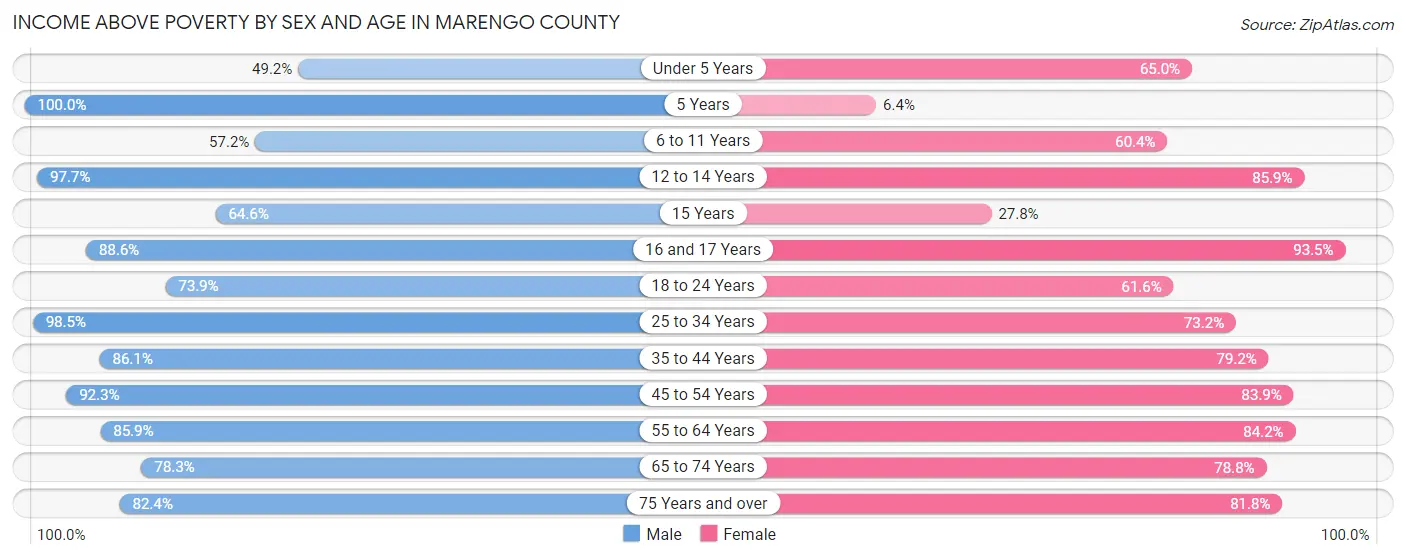
| Age Bracket | Male | Female |
| Under 5 Years | 382 (49.2%) | 297 (65.0%) |
| 5 Years | 34 (100.0%) | 3 (6.4%) |
| 6 to 11 Years | 373 (57.2%) | 504 (60.4%) |
| 12 to 14 Years | 466 (97.7%) | 279 (85.9%) |
| 15 Years | 51 (64.6%) | 15 (27.8%) |
| 16 and 17 Years | 210 (88.6%) | 343 (93.5%) |
| 18 to 24 Years | 554 (73.9%) | 660 (61.6%) |
| 25 to 34 Years | 914 (98.5%) | 676 (73.2%) |
| 35 to 44 Years | 977 (86.1%) | 866 (79.2%) |
| 45 to 54 Years | 991 (92.3%) | 1,055 (83.9%) |
| 55 to 64 Years | 1,033 (85.9%) | 1,267 (84.2%) |
| 65 to 74 Years | 805 (78.3%) | 904 (78.8%) |
| 75 Years and over | 505 (82.4%) | 712 (81.8%) |
| Total | 7,295 (81.2%) | 7,581 (76.2%) |
Income Below Poverty Among Married-Couple Families in Marengo County
The poverty statistics for married-couple families in Marengo County show that 5.0% or 128 of the total 2,578 families live below the poverty line. Families with 1 or 2 children have the highest poverty rate of 6.8%, comprising of 43 families. On the other hand, families with 3 or 4 children have the lowest poverty rate of 0.0%, which includes 0 families.
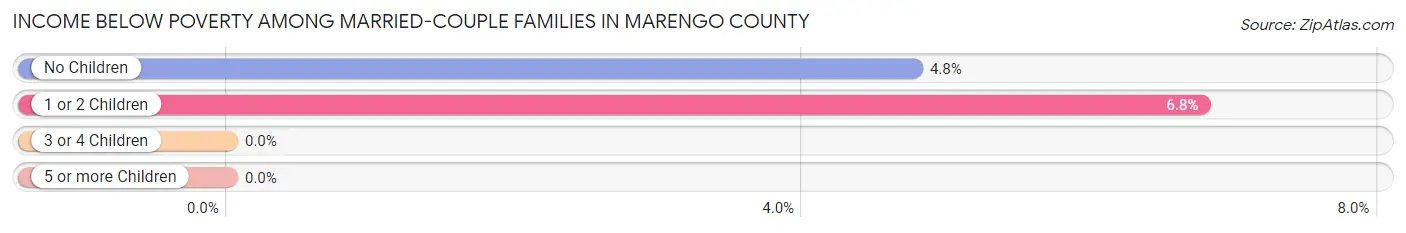
| Children | Above Poverty | Below Poverty |
| No Children | 1,698 (95.2%) | 85 (4.8%) |
| 1 or 2 Children | 592 (93.2%) | 43 (6.8%) |
| 3 or 4 Children | 160 (100.0%) | 0 (0.0%) |
| 5 or more Children | 0 (0.0%) | 0 (0.0%) |
| Total | 2,450 (95.0%) | 128 (5.0%) |
Income Below Poverty Among Single-Parent Households in Marengo County
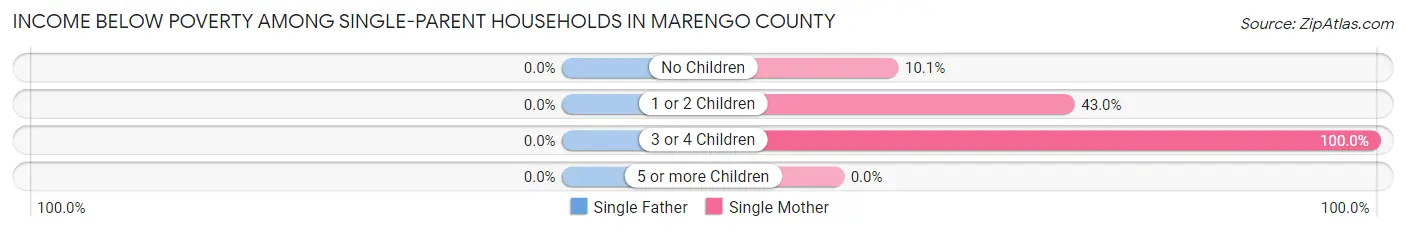
| Children | Single Father | Single Mother |
| No Children | 0 (0.0%) | 64 (10.1%) |
| 1 or 2 Children | 0 (0.0%) | 278 (43.0%) |
| 3 or 4 Children | 0 (0.0%) | 50 (100.0%) |
| 5 or more Children | 0 (0.0%) | 0 (0.0%) |
| Total | 0 (0.0%) | 392 (29.5%) |
Income Below Poverty Among Married-Couple vs Single-Parent Households in Marengo County
The poverty data for Marengo County shows that 128 of the married-couple family households (5.0%) and 392 of the single-parent households (24.5%) are living below the poverty level. Within the married-couple family households, those with 1 or 2 children have the highest poverty rate, with 43 households (6.8%) falling below the poverty line. Among the single-parent households, those with 3 or 4 children have the highest poverty rate, with 50 household (56.2%) living below poverty.
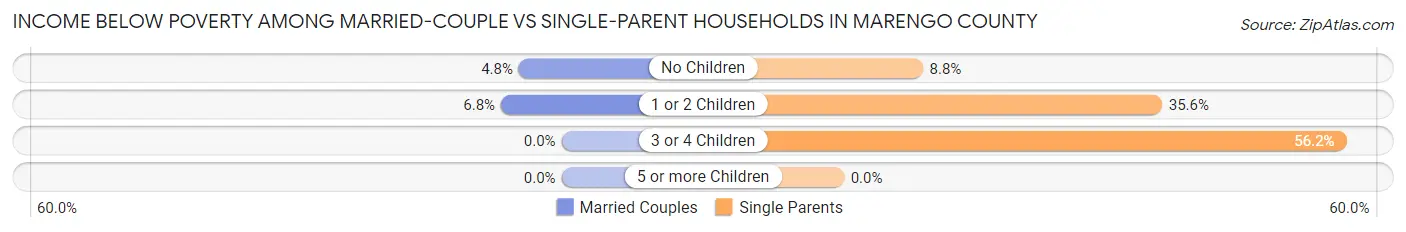
| Children | Married-Couple Families | Single-Parent Households |
| No Children | 85 (4.8%) | 64 (8.8%) |
| 1 or 2 Children | 43 (6.8%) | 278 (35.5%) |
| 3 or 4 Children | 0 (0.0%) | 50 (56.2%) |
| 5 or more Children | 0 (0.0%) | 0 (0.0%) |
| Total | 128 (5.0%) | 392 (24.5%) |
Employment Characteristics in Marengo County
Employment by Class of Employer in Marengo County
Among the 7,399 employed individuals in Marengo County, private company employees (4,821 | 65.2%), local government employees (935 | 12.6%), and not-for-profit organizations (563 | 7.6%) make up the most common classes of employment.
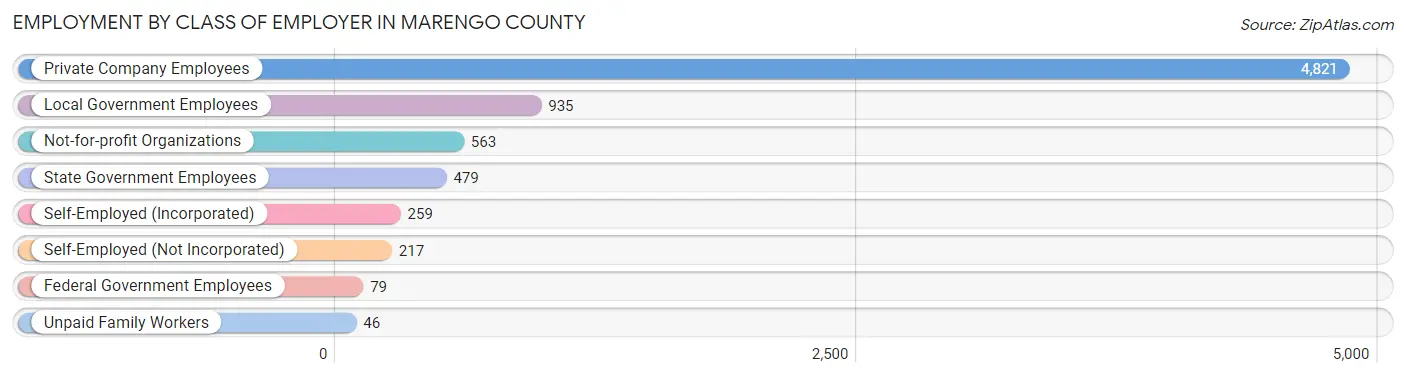
| Employer Class | # Employees | % Employees |
| Private Company Employees | 4,821 | 65.2% |
| Self-Employed (Incorporated) | 259 | 3.5% |
| Self-Employed (Not Incorporated) | 217 | 2.9% |
| Not-for-profit Organizations | 563 | 7.6% |
| Local Government Employees | 935 | 12.6% |
| State Government Employees | 479 | 6.5% |
| Federal Government Employees | 79 | 1.1% |
| Unpaid Family Workers | 46 | 0.6% |
| Total | 7,399 | 100.0% |
Employment Status by Age in Marengo County
According to the labor force statistics for Marengo County, out of the total population over 16 years of age (15,434), 50.6% or 7,810 individuals are in the labor force, with 2.8% or 219 of them unemployed. The age group with the highest labor force participation rate is 35 to 44 years, with 75.5% or 1,699 individuals in the labor force. Within the labor force, the 16 to 19 years age range has the highest percentage of unemployed individuals, with 13.2% or 58 of them being unemployed.
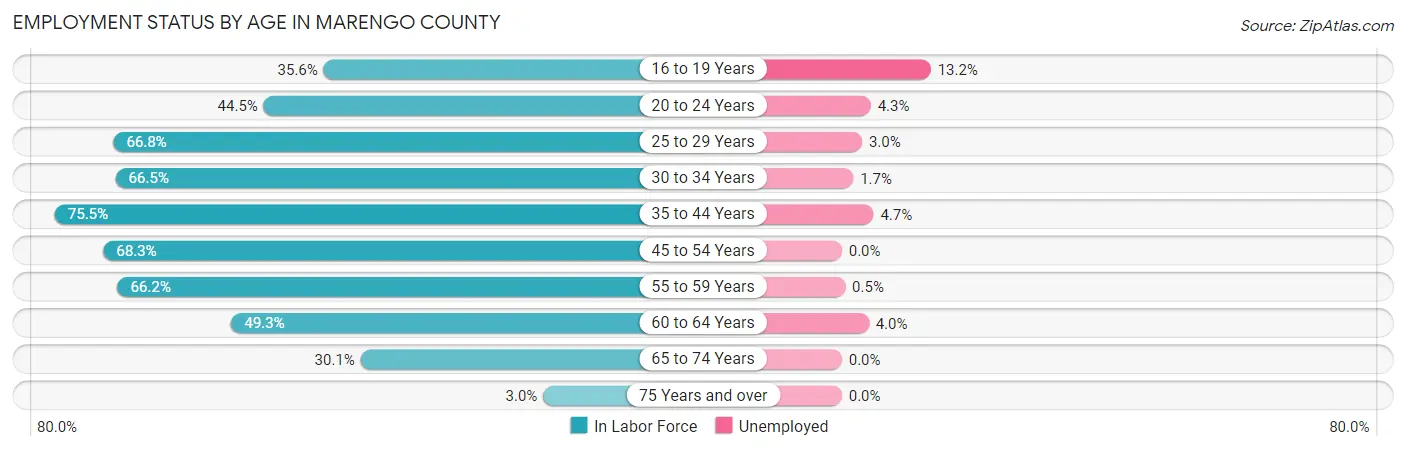
| Age Bracket | In Labor Force | Unemployed |
| 16 to 19 Years | 441 (35.6%) | 58 (13.2%) |
| 20 to 24 Years | 533 (44.5%) | 23 (4.3%) |
| 25 to 29 Years | 576 (66.8%) | 17 (3.0%) |
| 30 to 34 Years | 662 (66.5%) | 11 (1.7%) |
| 35 to 44 Years | 1,699 (75.5%) | 80 (4.7%) |
| 45 to 54 Years | 1,606 (68.3%) | 0 (0.0%) |
| 55 to 59 Years | 933 (66.2%) | 5 (0.5%) |
| 60 to 64 Years | 646 (49.3%) | 26 (4.0%) |
| 65 to 74 Years | 664 (30.1%) | 0 (0.0%) |
| 75 Years and over | 48 (3.0%) | 0 (0.0%) |
| Total | 7,810 (50.6%) | 219 (2.8%) |
Employment Status by Educational Attainment in Marengo County
According to labor force statistics for Marengo County, 66.7% of individuals (6,122) out of the total population between 25 and 64 years of age (9,179) are in the labor force, with 2.3% or 141 of them being unemployed. The group with the highest labor force participation rate are those with the educational attainment of college / associate degree, with 77.2% or 2,300 individuals in the labor force. Within the labor force, individuals with high school diploma education have the highest percentage of unemployment, with 5.1% or 101 of them being unemployed.
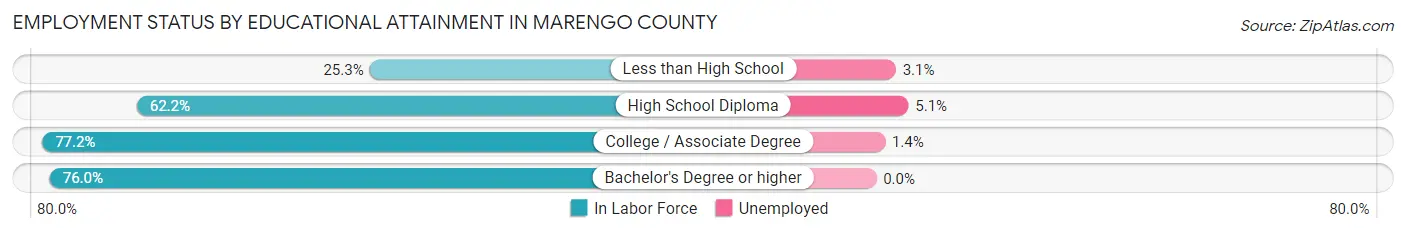
| Educational Attainment | In Labor Force | Unemployed |
| Less than High School | 227 (25.3%) | 28 (3.1%) |
| High School Diploma | 1,979 (62.2%) | 162 (5.1%) |
| College / Associate Degree | 2,300 (77.2%) | 42 (1.4%) |
| Bachelor's Degree or higher | 1,613 (76.0%) | 0 (0.0%) |
| Total | 6,122 (66.7%) | 211 (2.3%) |
Employment Occupations by Sex in Marengo County
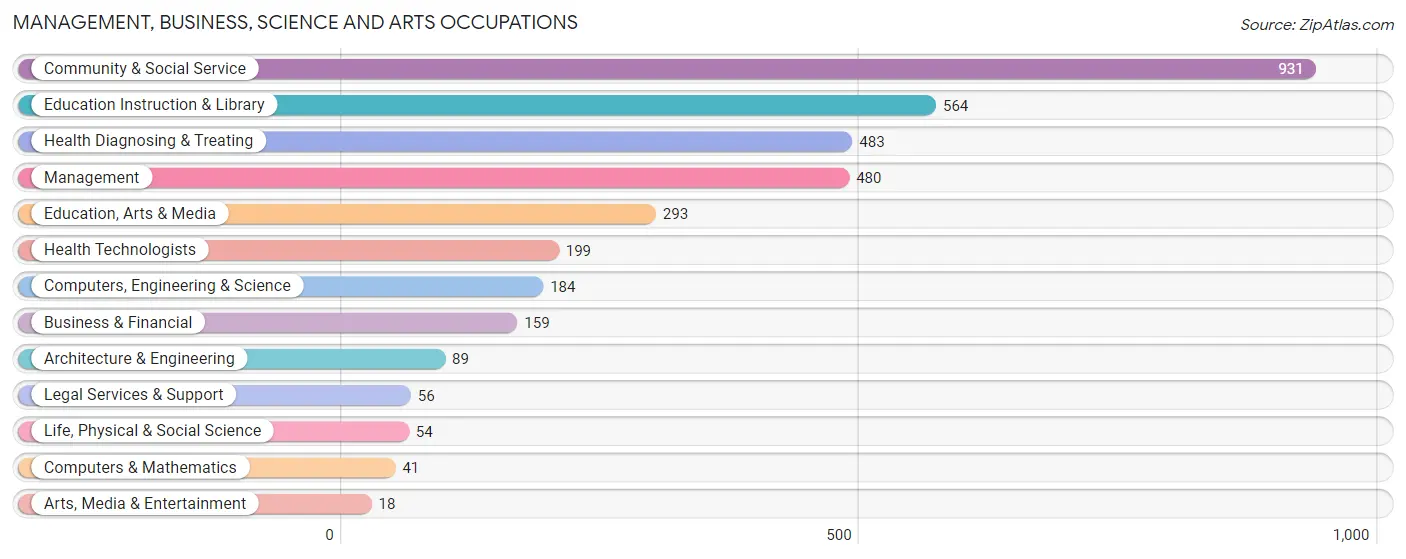
Management, Business, Science and Arts Occupations
The most common Management, Business, Science and Arts occupations in Marengo County are Community & Social Service (931 | 12.3%), Education Instruction & Library (564 | 7.4%), Health Diagnosing & Treating (483 | 6.4%), Management (480 | 6.3%), and Education, Arts & Media (293 | 3.9%).
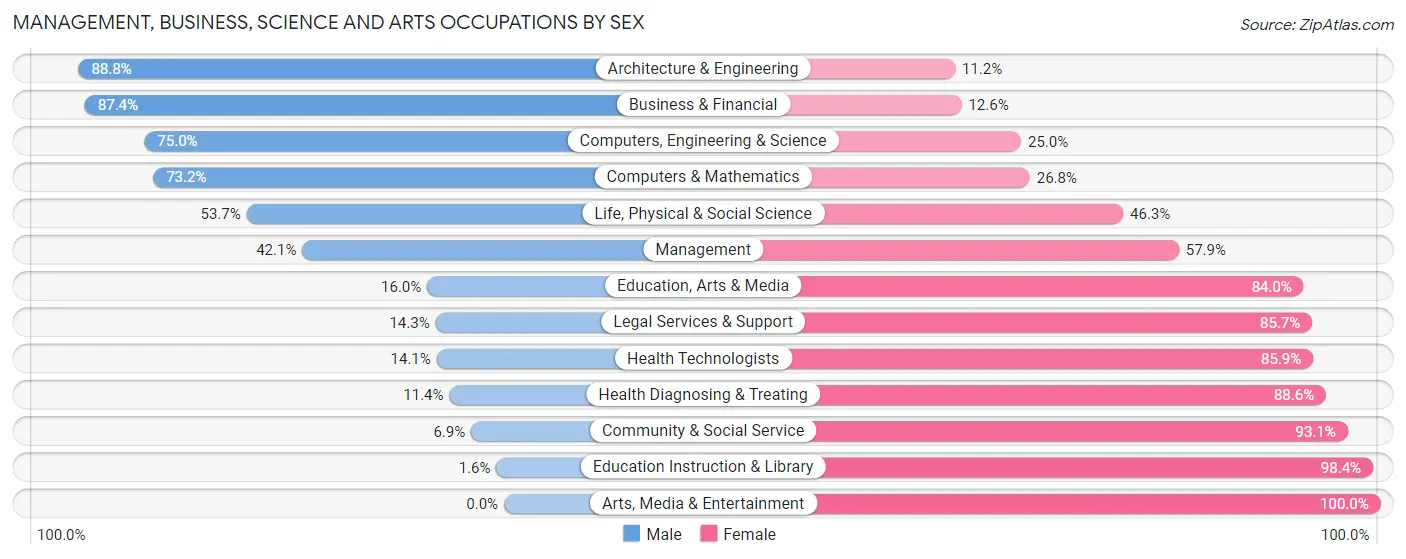
Management, Business, Science and Arts Occupations by Sex
Within the Management, Business, Science and Arts occupations in Marengo County, the most male-oriented occupations are Architecture & Engineering (88.8%), Business & Financial (87.4%), and Computers, Engineering & Science (75.0%), while the most female-oriented occupations are Arts, Media & Entertainment (100.0%), Education Instruction & Library (98.4%), and Community & Social Service (93.1%).
| Occupation | Male | Female |
| Management | 202 (42.1%) | 278 (57.9%) |
| Business & Financial | 139 (87.4%) | 20 (12.6%) |
| Computers, Engineering & Science | 138 (75.0%) | 46 (25.0%) |
| Computers & Mathematics | 30 (73.2%) | 11 (26.8%) |
| Architecture & Engineering | 79 (88.8%) | 10 (11.2%) |
| Life, Physical & Social Science | 29 (53.7%) | 25 (46.3%) |
| Community & Social Service | 64 (6.9%) | 867 (93.1%) |
| Education, Arts & Media | 47 (16.0%) | 246 (84.0%) |
| Legal Services & Support | 8 (14.3%) | 48 (85.7%) |
| Education Instruction & Library | 9 (1.6%) | 555 (98.4%) |
| Arts, Media & Entertainment | 0 (0.0%) | 18 (100.0%) |
| Health Diagnosing & Treating | 55 (11.4%) | 428 (88.6%) |
| Health Technologists | 28 (14.1%) | 171 (85.9%) |
| Total (Category) | 598 (26.7%) | 1,639 (73.3%) |
| Total (Overall) | 3,688 (48.6%) | 3,899 (51.4%) |
Services Occupations
The most common Services occupations in Marengo County are Healthcare Support (374 | 4.9%), Food Preparation & Serving (328 | 4.3%), Security & Protection (305 | 4.0%), Cleaning & Maintenance (221 | 2.9%), and Law Enforcement (189 | 2.5%).

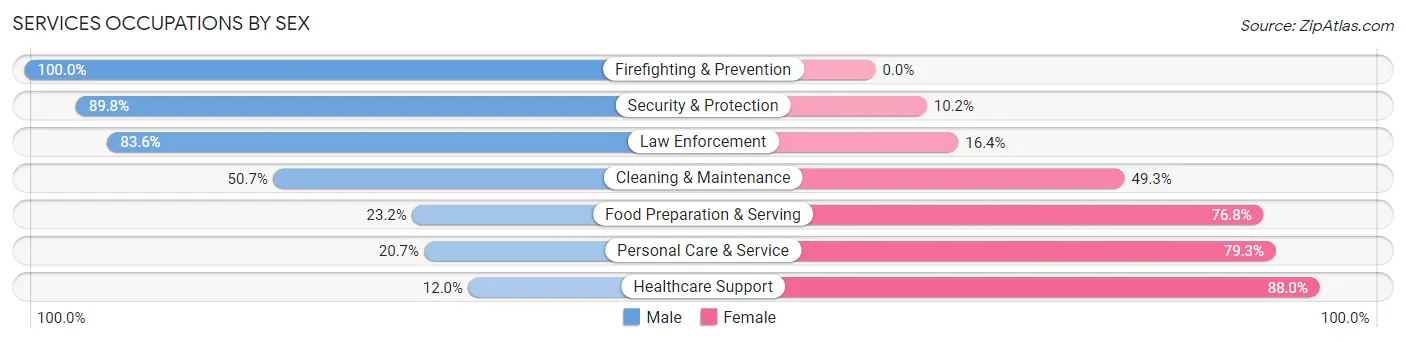
Services Occupations by Sex
Within the Services occupations in Marengo County, the most male-oriented occupations are Firefighting & Prevention (100.0%), Security & Protection (89.8%), and Law Enforcement (83.6%), while the most female-oriented occupations are Healthcare Support (88.0%), Personal Care & Service (79.3%), and Food Preparation & Serving (76.8%).
| Occupation | Male | Female |
| Healthcare Support | 45 (12.0%) | 329 (88.0%) |
| Security & Protection | 274 (89.8%) | 31 (10.2%) |
| Firefighting & Prevention | 116 (100.0%) | 0 (0.0%) |
| Law Enforcement | 158 (83.6%) | 31 (16.4%) |
| Food Preparation & Serving | 76 (23.2%) | 252 (76.8%) |
| Cleaning & Maintenance | 112 (50.7%) | 109 (49.3%) |
| Personal Care & Service | 39 (20.7%) | 149 (79.3%) |
| Total (Category) | 546 (38.6%) | 870 (61.4%) |
| Total (Overall) | 3,688 (48.6%) | 3,899 (51.4%) |
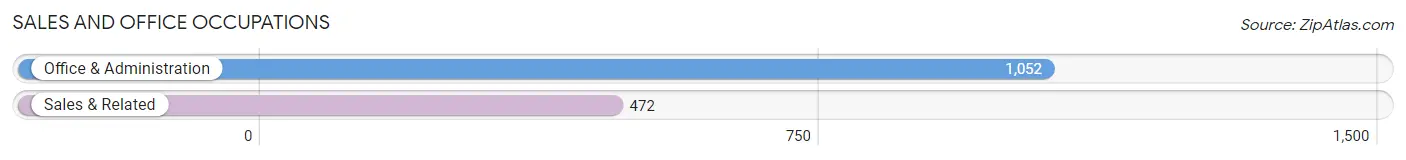
Sales and Office Occupations
The most common Sales and Office occupations in Marengo County are Office & Administration (1,052 | 13.9%), and Sales & Related (472 | 6.2%).
Sales and Office Occupations by Sex
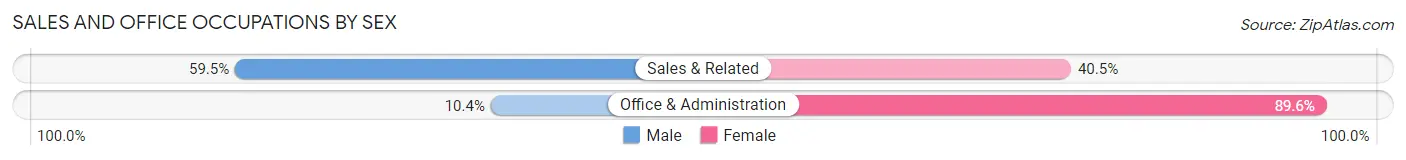
| Occupation | Male | Female |
| Sales & Related | 281 (59.5%) | 191 (40.5%) |
| Office & Administration | 109 (10.4%) | 943 (89.6%) |
| Total (Category) | 390 (25.6%) | 1,134 (74.4%) |
| Total (Overall) | 3,688 (48.6%) | 3,899 (51.4%) |
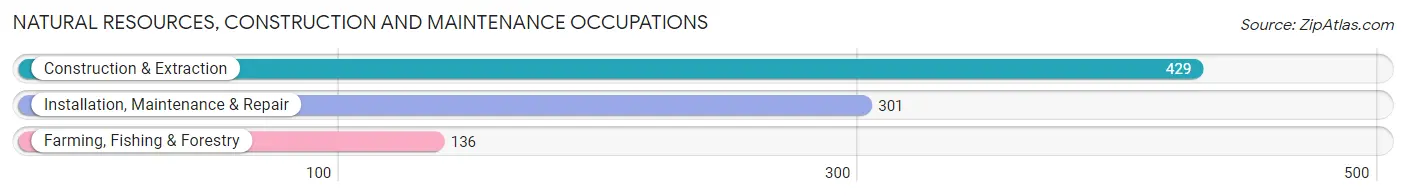
Natural Resources, Construction and Maintenance Occupations
The most common Natural Resources, Construction and Maintenance occupations in Marengo County are Construction & Extraction (429 | 5.7%), Installation, Maintenance & Repair (301 | 4.0%), and Farming, Fishing & Forestry (136 | 1.8%).
Natural Resources, Construction and Maintenance Occupations by Sex
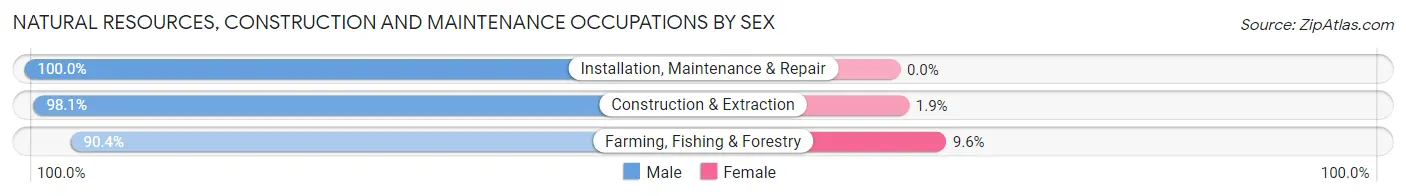
| Occupation | Male | Female |
| Farming, Fishing & Forestry | 123 (90.4%) | 13 (9.6%) |
| Construction & Extraction | 421 (98.1%) | 8 (1.9%) |
| Installation, Maintenance & Repair | 301 (100.0%) | 0 (0.0%) |
| Total (Category) | 845 (97.6%) | 21 (2.4%) |
| Total (Overall) | 3,688 (48.6%) | 3,899 (51.4%) |
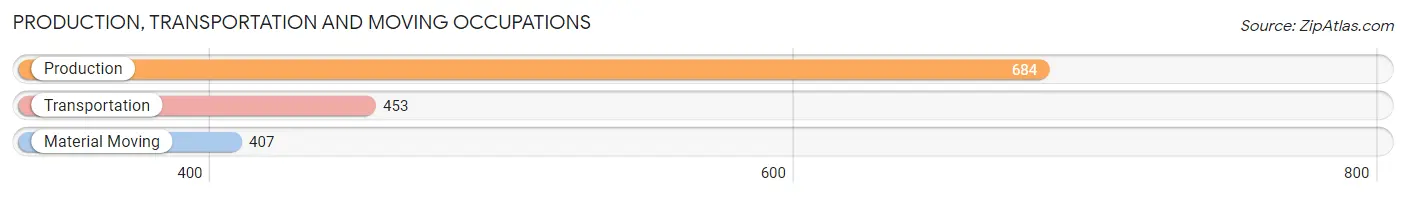
Production, Transportation and Moving Occupations
The most common Production, Transportation and Moving occupations in Marengo County are Production (684 | 9.0%), Transportation (453 | 6.0%), and Material Moving (407 | 5.4%).
Production, Transportation and Moving Occupations by Sex
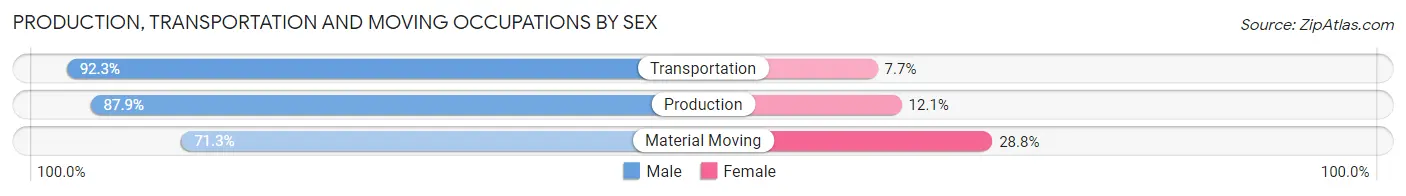
| Occupation | Male | Female |
| Production | 601 (87.9%) | 83 (12.1%) |
| Transportation | 418 (92.3%) | 35 (7.7%) |
| Material Moving | 290 (71.3%) | 117 (28.7%) |
| Total (Category) | 1,309 (84.8%) | 235 (15.2%) |
| Total (Overall) | 3,688 (48.6%) | 3,899 (51.4%) |
Employment Industries by Sex in Marengo County
Employment Industries in Marengo County
The major employment industries in Marengo County include Manufacturing (1,372 | 18.1%), Health Care & Social Assistance (1,161 | 15.3%), Retail Trade (854 | 11.3%), Educational Services (758 | 10.0%), and Accommodation & Food Services (572 | 7.5%).

Employment Industries by Sex in Marengo County
The Marengo County industries that see more men than women are Mining, Quarrying, & Extraction (100.0%), Information (95.7%), and Agriculture, Fishing & Hunting (94.9%), whereas the industries that tend to have a higher number of women are Educational Services (94.5%), Health Care & Social Assistance (90.3%), and Finance & Insurance (87.6%).
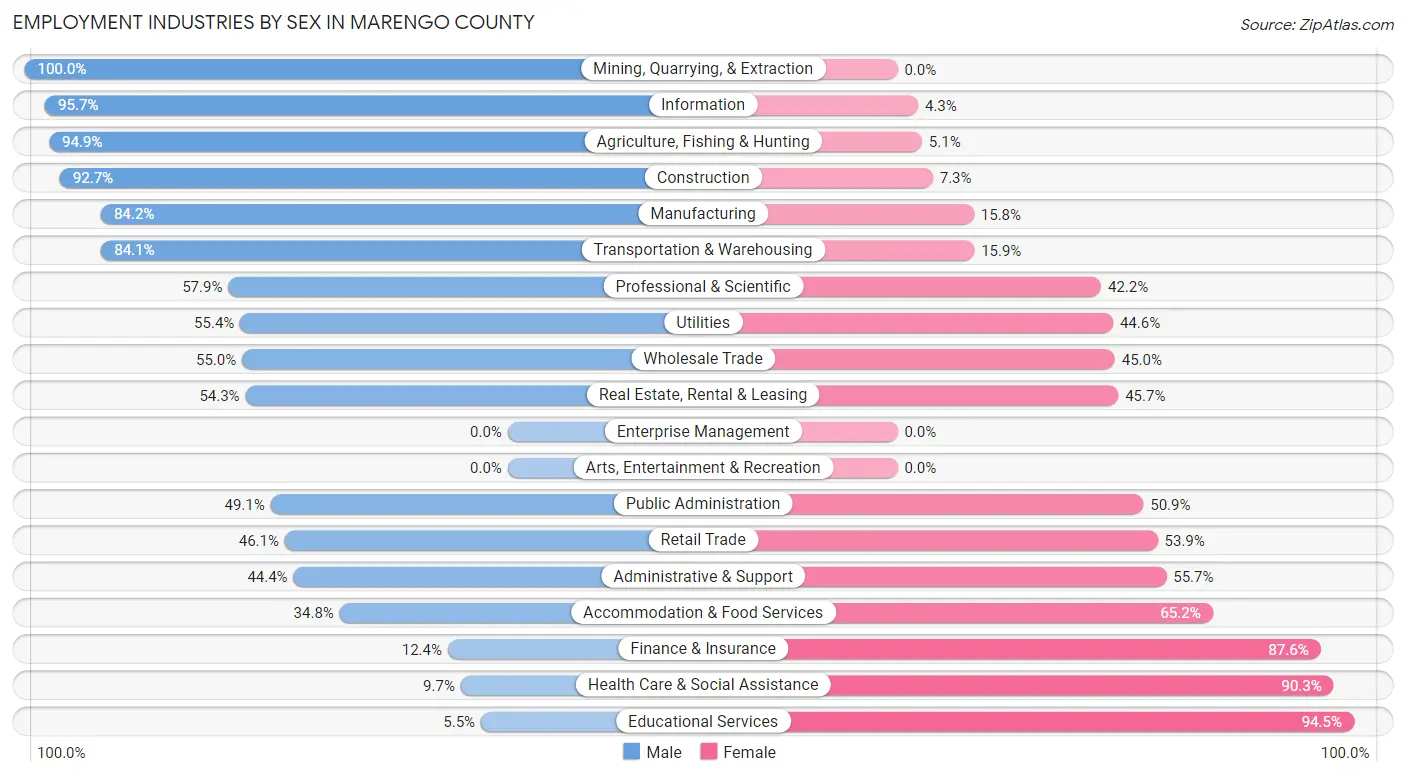
| Industry | Male | Female |
| Agriculture, Fishing & Hunting | 262 (94.9%) | 14 (5.1%) |
| Mining, Quarrying, & Extraction | 44 (100.0%) | 0 (0.0%) |
| Construction | 481 (92.7%) | 38 (7.3%) |
| Manufacturing | 1,155 (84.2%) | 217 (15.8%) |
| Wholesale Trade | 55 (55.0%) | 45 (45.0%) |
| Retail Trade | 394 (46.1%) | 460 (53.9%) |
| Transportation & Warehousing | 217 (84.1%) | 41 (15.9%) |
| Utilities | 72 (55.4%) | 58 (44.6%) |
| Information | 45 (95.7%) | 2 (4.3%) |
| Finance & Insurance | 31 (12.4%) | 219 (87.6%) |
| Real Estate, Rental & Leasing | 19 (54.3%) | 16 (45.7%) |
| Professional & Scientific | 129 (57.9%) | 94 (42.1%) |
| Enterprise Management | 0 (0.0%) | 0 (0.0%) |
| Administrative & Support | 51 (44.4%) | 64 (55.6%) |
| Educational Services | 42 (5.5%) | 716 (94.5%) |
| Health Care & Social Assistance | 113 (9.7%) | 1,048 (90.3%) |
| Arts, Entertainment & Recreation | 0 (0.0%) | 0 (0.0%) |
| Accommodation & Food Services | 199 (34.8%) | 373 (65.2%) |
| Public Administration | 272 (49.1%) | 282 (50.9%) |
| Total | 3,688 (48.6%) | 3,899 (51.4%) |
Education in Marengo County
School Enrollment in Marengo County
The most common levels of schooling among the 4,674 students in Marengo County are middle school (1,160 | 24.8%), college / undergraduate (1,071 | 22.9%), and high school (1,032 | 22.1%).

| School Level | # Students | % Students |
| Nursery / Preschool | 241 | 5.2% |
| Kindergarten | 88 | 1.9% |
| Elementary School | 990 | 21.2% |
| Middle School | 1,160 | 24.8% |
| High School | 1,032 | 22.1% |
| College / Undergraduate | 1,071 | 22.9% |
| Graduate / Professional | 92 | 2.0% |
| Total | 4,674 | 100.0% |
School Enrollment by Age by Funding Source in Marengo County
Out of a total of 4,674 students who are enrolled in schools in Marengo County, 397 (8.5%) attend a private institution, while the remaining 4,277 (91.5%) are enrolled in public schools. The age group of 35 years and over has the highest likelihood of being enrolled in private schools, with 104 (51.5% in the age bracket) enrolled. Conversely, the age group of 10 to 14 year olds has the lowest likelihood of being enrolled in a private school, with 1,338 (98.6% in the age bracket) attending a public institution.
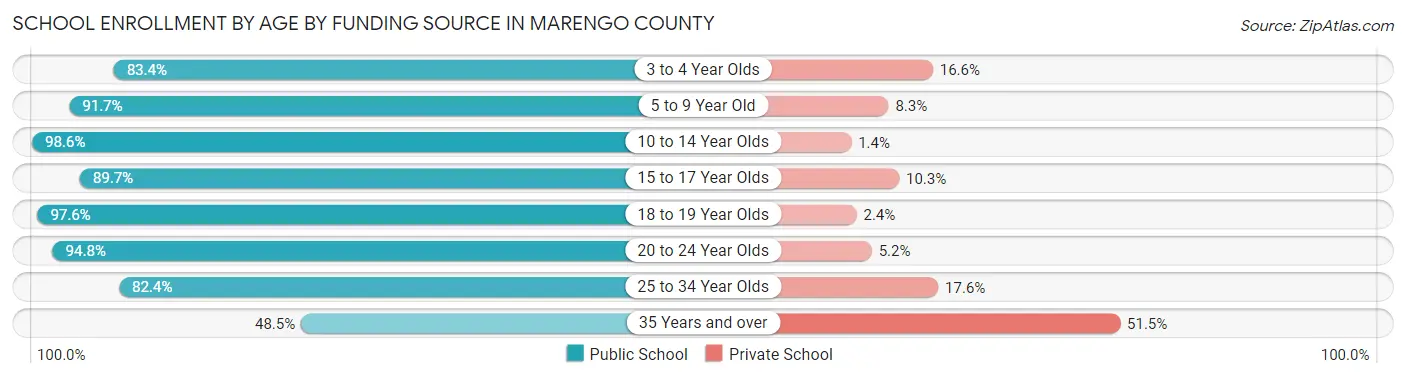
| Age Bracket | Public School | Private School |
| 3 to 4 Year Olds | 201 (83.4%) | 40 (16.6%) |
| 5 to 9 Year Old | 901 (91.7%) | 82 (8.3%) |
| 10 to 14 Year Olds | 1,338 (98.6%) | 19 (1.4%) |
| 15 to 17 Year Olds | 661 (89.7%) | 76 (10.3%) |
| 18 to 19 Year Olds | 528 (97.6%) | 13 (2.4%) |
| 20 to 24 Year Olds | 344 (94.8%) | 19 (5.2%) |
| 25 to 34 Year Olds | 206 (82.4%) | 44 (17.6%) |
| 35 Years and over | 98 (48.5%) | 104 (51.5%) |
| Total | 4,277 (91.5%) | 397 (8.5%) |
Educational Attainment by Field of Study in Marengo County
Business (804 | 27.2%), education (803 | 27.2%), science & technology (272 | 9.2%), psychology (248 | 8.4%), and liberal arts & history (188 | 6.4%) are the most common fields of study among 2,958 individuals in Marengo County who have obtained a bachelor's degree or higher.
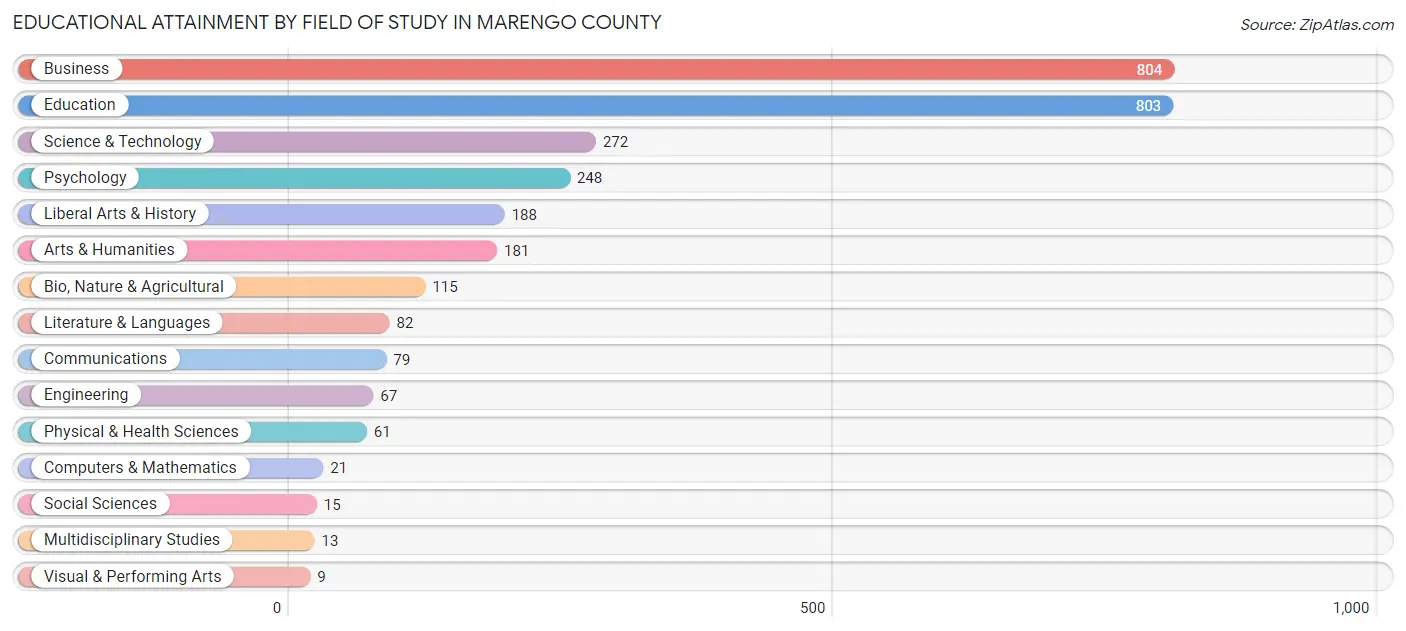
| Field of Study | # Graduates | % Graduates |
| Computers & Mathematics | 21 | 0.7% |
| Bio, Nature & Agricultural | 115 | 3.9% |
| Physical & Health Sciences | 61 | 2.1% |
| Psychology | 248 | 8.4% |
| Social Sciences | 15 | 0.5% |
| Engineering | 67 | 2.3% |
| Multidisciplinary Studies | 13 | 0.4% |
| Science & Technology | 272 | 9.2% |
| Business | 804 | 27.2% |
| Education | 803 | 27.2% |
| Literature & Languages | 82 | 2.8% |
| Liberal Arts & History | 188 | 6.4% |
| Visual & Performing Arts | 9 | 0.3% |
| Communications | 79 | 2.7% |
| Arts & Humanities | 181 | 6.1% |
| Total | 2,958 | 100.0% |
Transportation & Commute in Marengo County
Vehicle Availability by Sex in Marengo County
The most prevalent vehicle ownership categories in Marengo County are males with 2 vehicles (1,255, accounting for 35.2%) and females with 2 vehicles (1,750, making up 32.8%).

| Vehicles Available | Male | Female |
| No Vehicle | 21 (0.6%) | 109 (2.8%) |
| 1 Vehicle | 838 (23.5%) | 754 (19.7%) |
| 2 Vehicles | 1,255 (35.2%) | 1,750 (45.7%) |
| 3 Vehicles | 694 (19.5%) | 863 (22.5%) |
| 4 Vehicles | 447 (12.5%) | 253 (6.6%) |
| 5 or more Vehicles | 311 (8.7%) | 103 (2.7%) |
| Total | 3,566 (100.0%) | 3,832 (100.0%) |
Commute Time in Marengo County
The most frequently occuring commute durations in Marengo County are 5 to 9 minutes (1,238 commuters, 17.6%), 30 to 34 minutes (1,010 commuters, 14.4%), and 10 to 14 minutes (991 commuters, 14.1%).
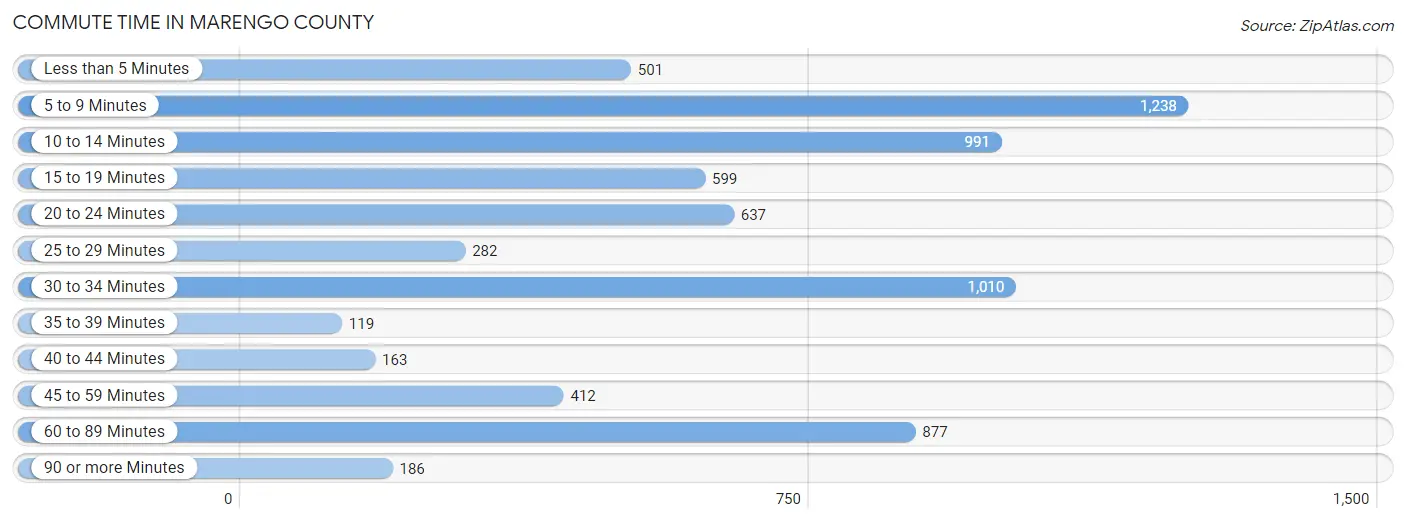
| Commute Time | # Commuters | % Commuters |
| Less than 5 Minutes | 501 | 7.1% |
| 5 to 9 Minutes | 1,238 | 17.6% |
| 10 to 14 Minutes | 991 | 14.1% |
| 15 to 19 Minutes | 599 | 8.5% |
| 20 to 24 Minutes | 637 | 9.1% |
| 25 to 29 Minutes | 282 | 4.0% |
| 30 to 34 Minutes | 1,010 | 14.4% |
| 35 to 39 Minutes | 119 | 1.7% |
| 40 to 44 Minutes | 163 | 2.3% |
| 45 to 59 Minutes | 412 | 5.9% |
| 60 to 89 Minutes | 877 | 12.5% |
| 90 or more Minutes | 186 | 2.6% |
Commute Time by Sex in Marengo County
The most common commute times in Marengo County are 30 to 34 minutes (684 commuters, 20.1%) for males and 5 to 9 minutes (764 commuters, 21.2%) for females.
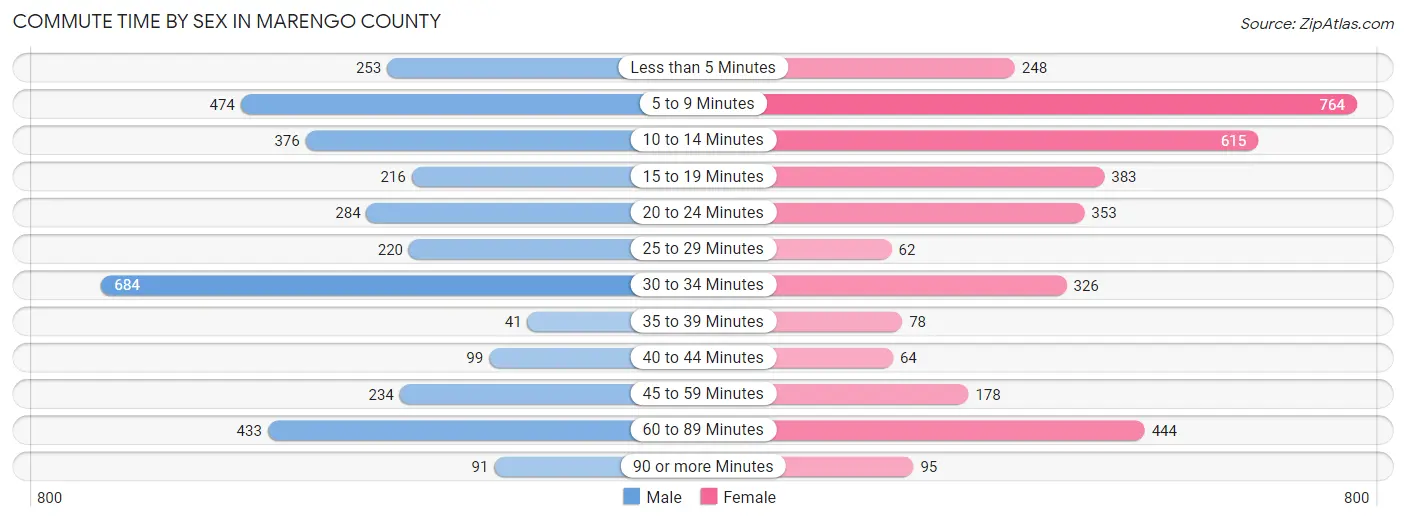
| Commute Time | Male | Female |
| Less than 5 Minutes | 253 (7.4%) | 248 (6.9%) |
| 5 to 9 Minutes | 474 (13.9%) | 764 (21.2%) |
| 10 to 14 Minutes | 376 (11.0%) | 615 (17.0%) |
| 15 to 19 Minutes | 216 (6.3%) | 383 (10.6%) |
| 20 to 24 Minutes | 284 (8.3%) | 353 (9.8%) |
| 25 to 29 Minutes | 220 (6.5%) | 62 (1.7%) |
| 30 to 34 Minutes | 684 (20.1%) | 326 (9.0%) |
| 35 to 39 Minutes | 41 (1.2%) | 78 (2.2%) |
| 40 to 44 Minutes | 99 (2.9%) | 64 (1.8%) |
| 45 to 59 Minutes | 234 (6.9%) | 178 (4.9%) |
| 60 to 89 Minutes | 433 (12.7%) | 444 (12.3%) |
| 90 or more Minutes | 91 (2.7%) | 95 (2.6%) |
Time of Departure to Work by Sex in Marengo County
The most frequent times of departure to work in Marengo County are 7:00 AM to 7:29 AM (510, 15.0%) for males and 7:00 AM to 7:29 AM (941, 26.1%) for females.
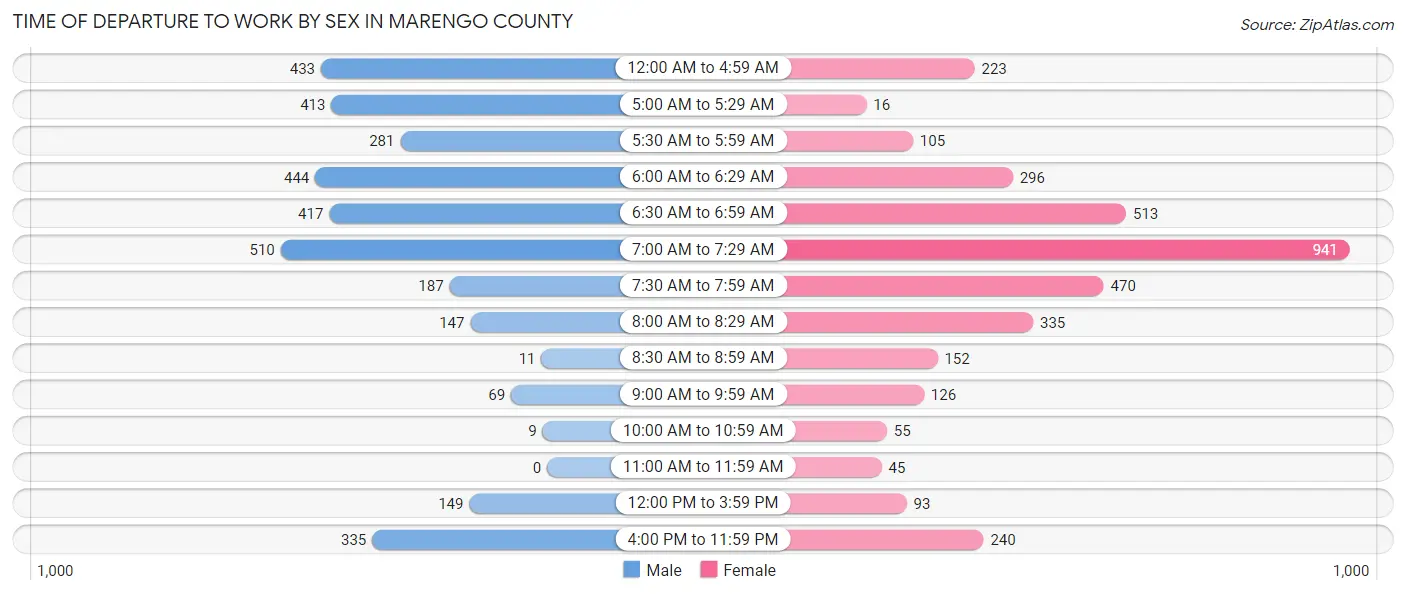
| Time of Departure | Male | Female |
| 12:00 AM to 4:59 AM | 433 (12.7%) | 223 (6.2%) |
| 5:00 AM to 5:29 AM | 413 (12.1%) | 16 (0.4%) |
| 5:30 AM to 5:59 AM | 281 (8.3%) | 105 (2.9%) |
| 6:00 AM to 6:29 AM | 444 (13.0%) | 296 (8.2%) |
| 6:30 AM to 6:59 AM | 417 (12.2%) | 513 (14.2%) |
| 7:00 AM to 7:29 AM | 510 (15.0%) | 941 (26.1%) |
| 7:30 AM to 7:59 AM | 187 (5.5%) | 470 (13.0%) |
| 8:00 AM to 8:29 AM | 147 (4.3%) | 335 (9.3%) |
| 8:30 AM to 8:59 AM | 11 (0.3%) | 152 (4.2%) |
| 9:00 AM to 9:59 AM | 69 (2.0%) | 126 (3.5%) |
| 10:00 AM to 10:59 AM | 9 (0.3%) | 55 (1.5%) |
| 11:00 AM to 11:59 AM | 0 (0.0%) | 45 (1.3%) |
| 12:00 PM to 3:59 PM | 149 (4.4%) | 93 (2.6%) |
| 4:00 PM to 11:59 PM | 335 (9.8%) | 240 (6.7%) |
| Total | 3,405 (100.0%) | 3,610 (100.0%) |
Housing Occupancy in Marengo County
Occupancy by Ownership in Marengo County
Of the total 7,379 dwellings in Marengo County, owner-occupied units account for 5,038 (68.3%), while renter-occupied units make up 2,341 (31.7%).

| Occupancy | # Housing Units | % Housing Units |
| Owner Occupied Housing Units | 5,038 | 68.3% |
| Renter-Occupied Housing Units | 2,341 | 31.7% |
| Total Occupied Housing Units | 7,379 | 100.0% |
Occupancy by Household Size in Marengo County
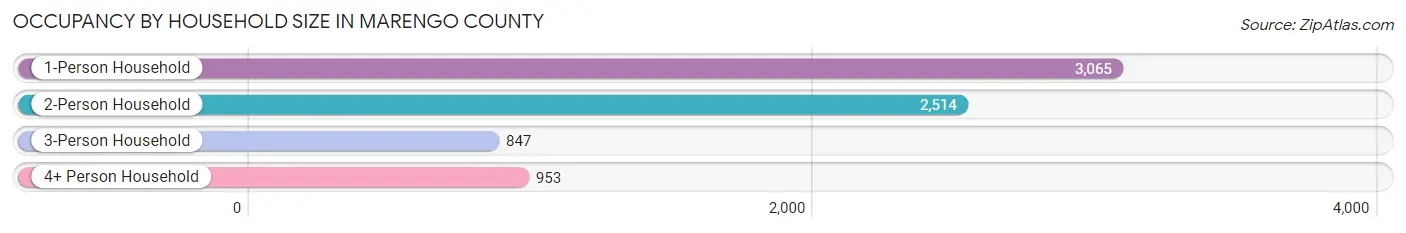
| Household Size | # Housing Units | % Housing Units |
| 1-Person Household | 3,065 | 41.5% |
| 2-Person Household | 2,514 | 34.1% |
| 3-Person Household | 847 | 11.5% |
| 4+ Person Household | 953 | 12.9% |
| Total Housing Units | 7,379 | 100.0% |
Occupancy by Ownership by Household Size in Marengo County

| Household Size | Owner-occupied | Renter-occupied |
| 1-Person Household | 1,729 (56.4%) | 1,336 (43.6%) |
| 2-Person Household | 1,951 (77.6%) | 563 (22.4%) |
| 3-Person Household | 600 (70.8%) | 247 (29.2%) |
| 4+ Person Household | 758 (79.5%) | 195 (20.5%) |
| Total Housing Units | 5,038 (68.3%) | 2,341 (31.7%) |
Occupancy by Educational Attainment in Marengo County
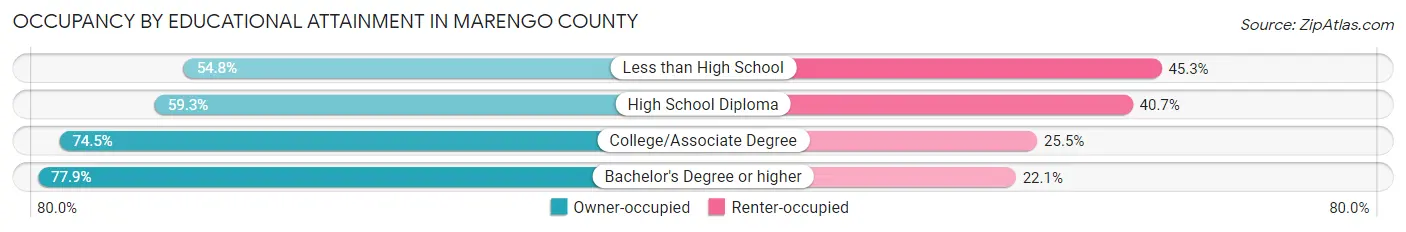
| Household Size | Owner-occupied | Renter-occupied |
| Less than High School | 294 (54.7%) | 243 (45.3%) |
| High School Diploma | 1,587 (59.3%) | 1,088 (40.7%) |
| College/Associate Degree | 1,919 (74.5%) | 658 (25.5%) |
| Bachelor's Degree or higher | 1,238 (77.9%) | 352 (22.1%) |
Occupancy by Age of Householder in Marengo County
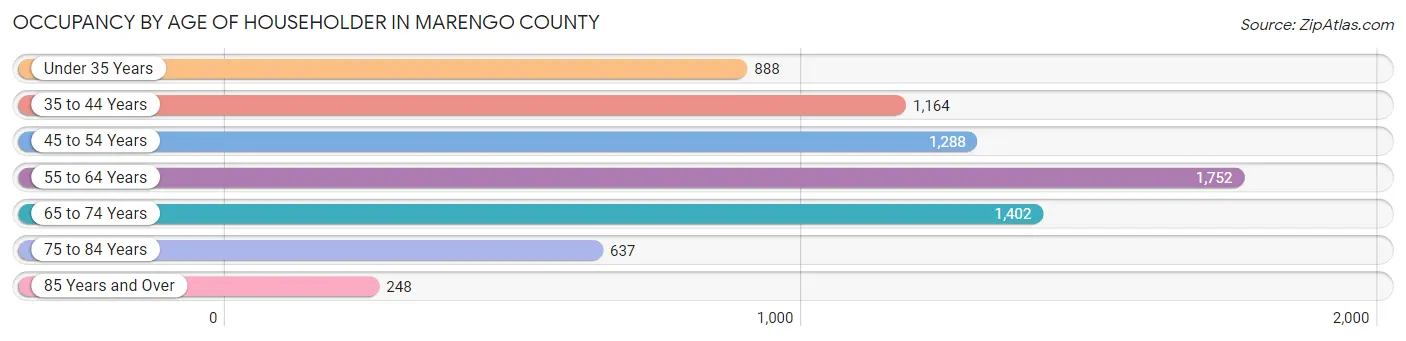
| Age Bracket | # Households | % Households |
| Under 35 Years | 888 | 12.0% |
| 35 to 44 Years | 1,164 | 15.8% |
| 45 to 54 Years | 1,288 | 17.4% |
| 55 to 64 Years | 1,752 | 23.7% |
| 65 to 74 Years | 1,402 | 19.0% |
| 75 to 84 Years | 637 | 8.6% |
| 85 Years and Over | 248 | 3.4% |
| Total | 7,379 | 100.0% |
Housing Finances in Marengo County
Median Income by Occupancy in Marengo County
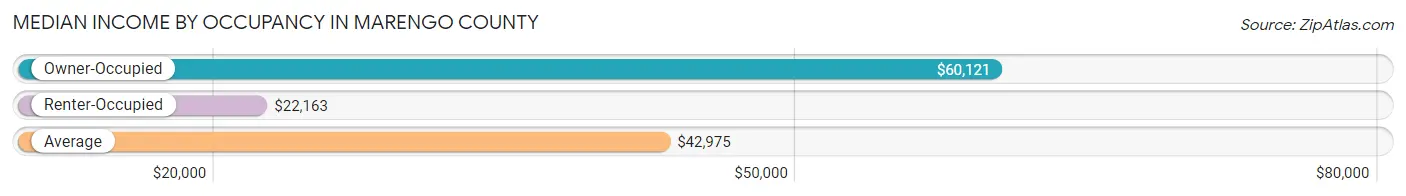
| Occupancy Type | # Households | Median Income |
| Owner-Occupied | 5,038 (68.3%) | $60,121 |
| Renter-Occupied | 2,341 (31.7%) | $22,163 |
| Average | 7,379 (100.0%) | $42,975 |
Occupancy by Householder Income Bracket in Marengo County

| Income Bracket | Owner-occupied | Renter-occupied |
| Less than $5,000 | 203 (4.0%) | 225 (9.6%) |
| $5,000 to $9,999 | 78 (1.5%) | 167 (7.1%) |
| $10,000 to $14,999 | 346 (6.9%) | 399 (17.0%) |
| $15,000 to $19,999 | 401 (8.0%) | 293 (12.5%) |
| $20,000 to $24,999 | 223 (4.4%) | 271 (11.6%) |
| $25,000 to $34,999 | 331 (6.6%) | 223 (9.5%) |
| $35,000 to $49,999 | 613 (12.2%) | 245 (10.5%) |
| $50,000 to $74,999 | 963 (19.1%) | 238 (10.2%) |
| $75,000 to $99,999 | 607 (12.0%) | 147 (6.3%) |
| $100,000 to $149,999 | 658 (13.1%) | 116 (5.0%) |
| $150,000 or more | 615 (12.2%) | 17 (0.7%) |
| Total | 5,038 (100.0%) | 2,341 (100.0%) |
Monthly Housing Cost Tiers in Marengo County

| Monthly Cost | Owner-occupied | Renter-occupied |
| Less than $300 | 682 (13.5%) | 120 (5.1%) |
| $300 to $499 | 1,592 (31.6%) | 277 (11.8%) |
| $500 to $799 | 1,278 (25.4%) | 854 (36.5%) |
| $800 to $999 | 475 (9.4%) | 383 (16.4%) |
| $1,000 to $1,499 | 566 (11.2%) | 289 (12.3%) |
| $1,500 to $1,999 | 221 (4.4%) | 20 (0.9%) |
| $2,000 to $2,499 | 91 (1.8%) | 48 (2.1%) |
| $2,500 to $2,999 | 63 (1.3%) | 0 (0.0%) |
| $3,000 or more | 70 (1.4%) | 5 (0.2%) |
| Total | 5,038 (100.0%) | 2,341 (100.0%) |
Physical Housing Characteristics in Marengo County
Housing Structures in Marengo County
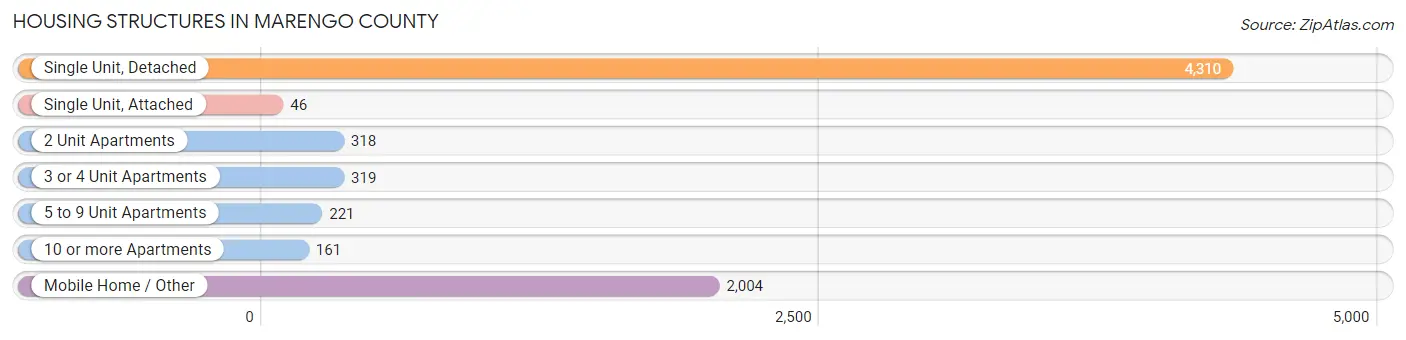
| Structure Type | # Housing Units | % Housing Units |
| Single Unit, Detached | 4,310 | 58.4% |
| Single Unit, Attached | 46 | 0.6% |
| 2 Unit Apartments | 318 | 4.3% |
| 3 or 4 Unit Apartments | 319 | 4.3% |
| 5 to 9 Unit Apartments | 221 | 3.0% |
| 10 or more Apartments | 161 | 2.2% |
| Mobile Home / Other | 2,004 | 27.2% |
| Total | 7,379 | 100.0% |
Housing Structures by Occupancy in Marengo County

| Structure Type | Owner-occupied | Renter-occupied |
| Single Unit, Detached | 3,300 (76.6%) | 1,010 (23.4%) |
| Single Unit, Attached | 46 (100.0%) | 0 (0.0%) |
| 2 Unit Apartments | 27 (8.5%) | 291 (91.5%) |
| 3 or 4 Unit Apartments | 0 (0.0%) | 319 (100.0%) |
| 5 to 9 Unit Apartments | 0 (0.0%) | 221 (100.0%) |
| 10 or more Apartments | 9 (5.6%) | 152 (94.4%) |
| Mobile Home / Other | 1,656 (82.6%) | 348 (17.4%) |
| Total | 5,038 (68.3%) | 2,341 (31.7%) |
Housing Structures by Number of Rooms in Marengo County

| Number of Rooms | Owner-occupied | Renter-occupied |
| 1 Room | 0 (0.0%) | 52 (2.2%) |
| 2 or 3 Rooms | 137 (2.7%) | 325 (13.9%) |
| 4 or 5 Rooms | 1,571 (31.2%) | 1,256 (53.6%) |
| 6 or 7 Rooms | 2,174 (43.1%) | 600 (25.6%) |
| 8 or more Rooms | 1,156 (23.0%) | 108 (4.6%) |
| Total | 5,038 (100.0%) | 2,341 (100.0%) |
Housing Structure by Heating Type in Marengo County

| Heating Type | Owner-occupied | Renter-occupied |
| Utility Gas | 944 (18.7%) | 282 (12.0%) |
| Bottled, Tank, or LP Gas | 771 (15.3%) | 175 (7.5%) |
| Electricity | 3,216 (63.8%) | 1,812 (77.4%) |
| Fuel Oil or Kerosene | 0 (0.0%) | 0 (0.0%) |
| Coal or Coke | 0 (0.0%) | 0 (0.0%) |
| All other Fuels | 94 (1.9%) | 42 (1.8%) |
| No Fuel Used | 13 (0.3%) | 30 (1.3%) |
| Total | 5,038 (100.0%) | 2,341 (100.0%) |
Household Vehicle Usage in Marengo County

| Vehicles per Household | Owner-occupied | Renter-occupied |
| No Vehicle | 206 (4.1%) | 428 (18.3%) |
| 1 Vehicle | 1,595 (31.7%) | 1,235 (52.8%) |
| 2 Vehicles | 1,895 (37.6%) | 542 (23.2%) |
| 3 or more Vehicles | 1,342 (26.6%) | 136 (5.8%) |
| Total | 5,038 (100.0%) | 2,341 (100.0%) |
Real Estate & Mortgages in Marengo County
Real Estate and Mortgage Overview in Marengo County
| Characteristic | Without Mortgage | With Mortgage |
| Housing Units | 3,463 | 1,575 |
| Median Property Value | $90,200 | $138,000 |
| Median Household Income | $47,923 | $306 |
| Monthly Housing Costs | $432 | $69 |
| Real Estate Taxes | $286 | $310 |
Property Value by Mortgage Status in Marengo County
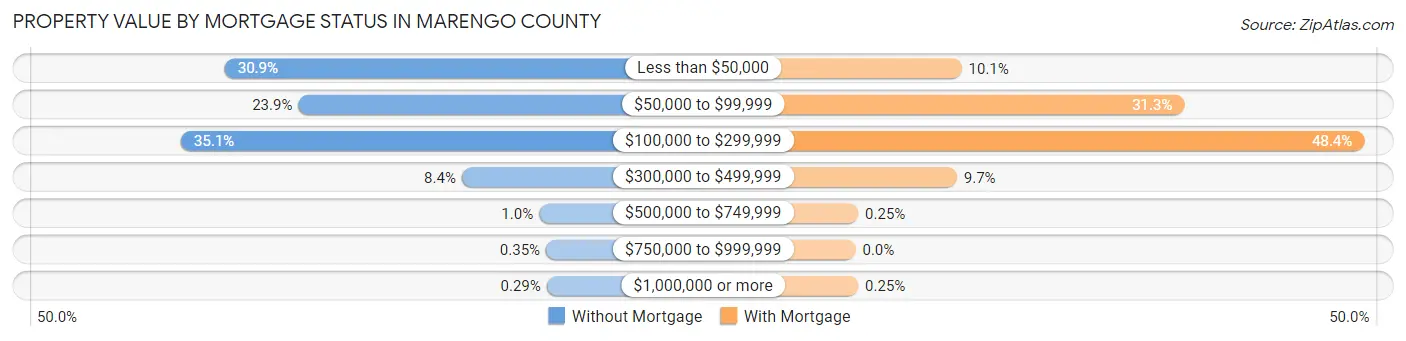
| Property Value | Without Mortgage | With Mortgage |
| Less than $50,000 | 1,071 (30.9%) | 159 (10.1%) |
| $50,000 to $99,999 | 829 (23.9%) | 493 (31.3%) |
| $100,000 to $299,999 | 1,216 (35.1%) | 763 (48.4%) |
| $300,000 to $499,999 | 290 (8.4%) | 152 (9.7%) |
| $500,000 to $749,999 | 35 (1.0%) | 4 (0.3%) |
| $750,000 to $999,999 | 12 (0.4%) | 0 (0.0%) |
| $1,000,000 or more | 10 (0.3%) | 4 (0.3%) |
| Total | 3,463 (100.0%) | 1,575 (100.0%) |
Household Income by Mortgage Status in Marengo County

| Household Income | Without Mortgage | With Mortgage |
| Less than $10,000 | 249 (7.2%) | 30 (1.9%) |
| $10,000 to $24,999 | 812 (23.4%) | 32 (2.0%) |
| $25,000 to $34,999 | 320 (9.2%) | 158 (10.0%) |
| $35,000 to $49,999 | 402 (11.6%) | 11 (0.7%) |
| $50,000 to $74,999 | 609 (17.6%) | 211 (13.4%) |
| $75,000 to $99,999 | 390 (11.3%) | 354 (22.5%) |
| $100,000 to $149,999 | 372 (10.7%) | 217 (13.8%) |
| $150,000 or more | 309 (8.9%) | 286 (18.2%) |
| Total | 3,463 (100.0%) | 1,575 (100.0%) |
Property Value to Household Income Ratio in Marengo County
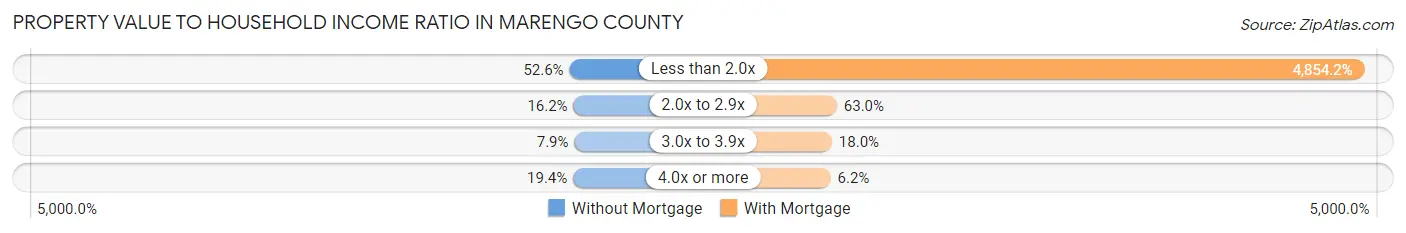
| Value-to-Income Ratio | Without Mortgage | With Mortgage |
| Less than 2.0x | 1,822 (52.6%) | 76,453 (4,854.2%) |
| 2.0x to 2.9x | 561 (16.2%) | 992 (63.0%) |
| 3.0x to 3.9x | 274 (7.9%) | 284 (18.0%) |
| 4.0x or more | 670 (19.4%) | 97 (6.2%) |
| Total | 3,463 (100.0%) | 1,575 (100.0%) |
Real Estate Taxes by Mortgage Status in Marengo County

| Property Taxes | Without Mortgage | With Mortgage |
| Less than $800 | 2,135 (61.7%) | 27 (1.7%) |
| $800 to $1,499 | 460 (13.3%) | 788 (50.0%) |
| $800 to $1,499 | 128 (3.7%) | 311 (19.8%) |
| Total | 3,463 (100.0%) | 1,575 (100.0%) |
Health & Disability in Marengo County
Health Insurance Coverage by Age in Marengo County

| Age Bracket | With Coverage | Without Coverage |
| Under 6 Years | 1,318 (100.0%) | 0 (0.0%) |
| 6 to 18 Years | 3,402 (99.0%) | 33 (1.0%) |
| 19 to 25 Years | 1,047 (65.9%) | 541 (34.1%) |
| 26 to 34 Years | 1,275 (75.8%) | 408 (24.2%) |
| 35 to 44 Years | 1,903 (85.4%) | 325 (14.6%) |
| 45 to 54 Years | 2,136 (91.6%) | 196 (8.4%) |
| 55 to 64 Years | 2,502 (92.4%) | 205 (7.6%) |
| 65 to 74 Years | 2,126 (97.8%) | 49 (2.2%) |
| 75 Years and older | 1,484 (100.0%) | 0 (0.0%) |
| Total | 17,193 (90.7%) | 1,757 (9.3%) |
Health Insurance Coverage by Citizenship Status in Marengo County
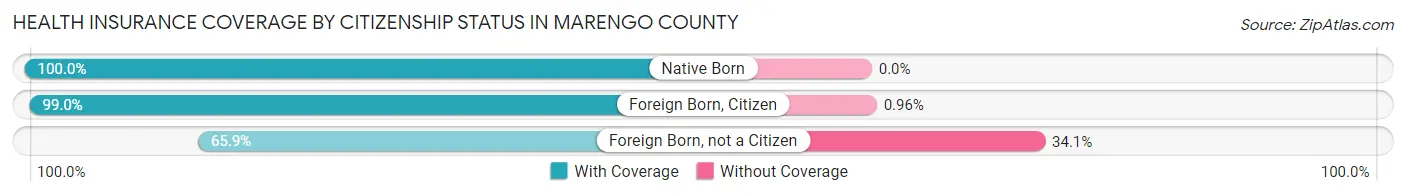
| Citizenship Status | With Coverage | Without Coverage |
| Native Born | 1,318 (100.0%) | 0 (0.0%) |
| Foreign Born, Citizen | 3,402 (99.0%) | 33 (1.0%) |
| Foreign Born, not a Citizen | 1,047 (65.9%) | 541 (34.1%) |
Health Insurance Coverage by Household Income in Marengo County
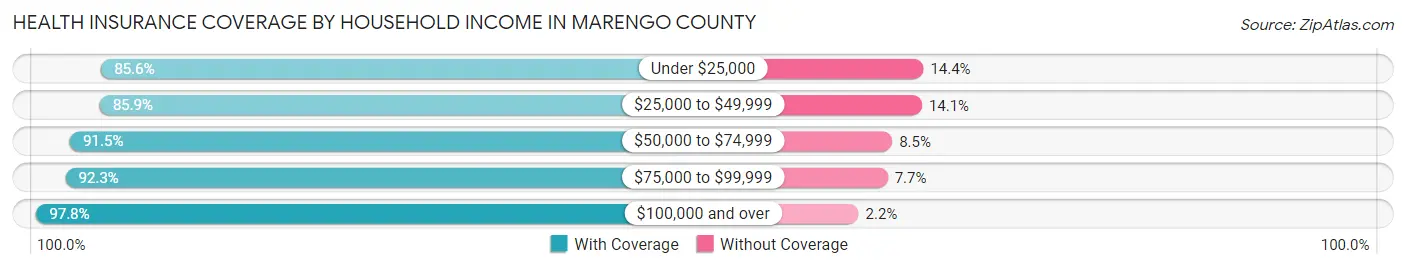
| Household Income | With Coverage | Without Coverage |
| Under $25,000 | 4,247 (85.6%) | 712 (14.4%) |
| $25,000 to $49,999 | 2,873 (85.9%) | 471 (14.1%) |
| $50,000 to $74,999 | 2,978 (91.5%) | 277 (8.5%) |
| $75,000 to $99,999 | 2,279 (92.3%) | 189 (7.7%) |
| $100,000 and over | 4,783 (97.8%) | 108 (2.2%) |
Public vs Private Health Insurance Coverage by Age in Marengo County
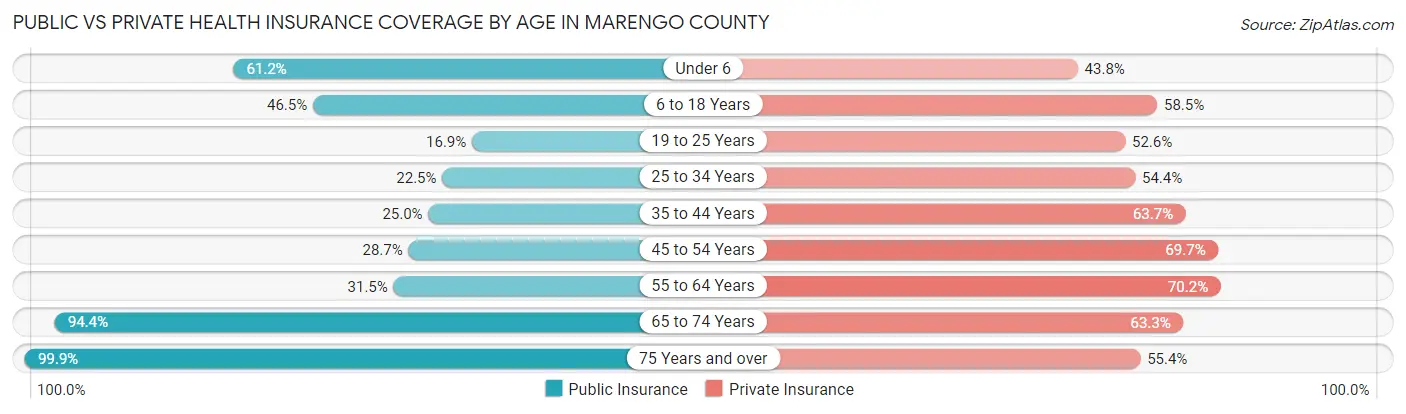
| Age Bracket | Public Insurance | Private Insurance |
| Under 6 | 807 (61.2%) | 577 (43.8%) |
| 6 to 18 Years | 1,596 (46.5%) | 2,010 (58.5%) |
| 19 to 25 Years | 269 (16.9%) | 835 (52.6%) |
| 25 to 34 Years | 378 (22.5%) | 916 (54.4%) |
| 35 to 44 Years | 558 (25.0%) | 1,419 (63.7%) |
| 45 to 54 Years | 670 (28.7%) | 1,626 (69.7%) |
| 55 to 64 Years | 853 (31.5%) | 1,900 (70.2%) |
| 65 to 74 Years | 2,053 (94.4%) | 1,376 (63.3%) |
| 75 Years and over | 1,483 (99.9%) | 822 (55.4%) |
| Total | 8,667 (45.7%) | 11,481 (60.6%) |
Disability Status by Sex by Age in Marengo County
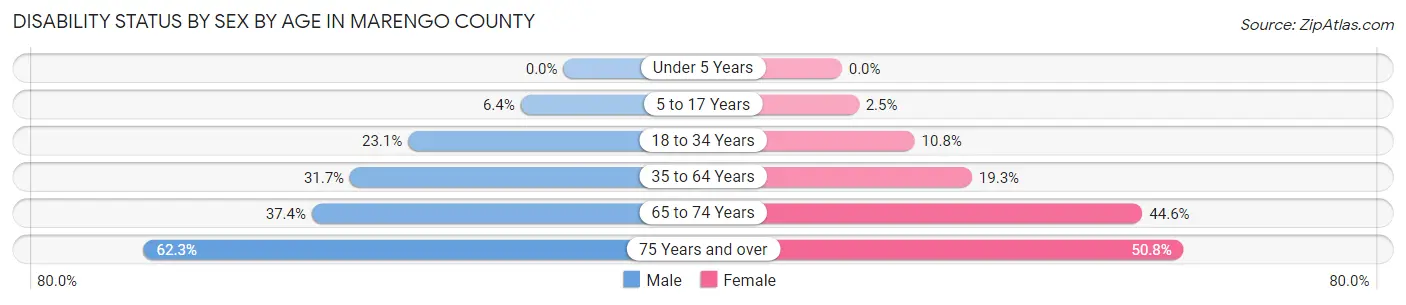
| Age Bracket | Male | Female |
| Under 5 Years | 0 (0.0%) | 0 (0.0%) |
| 5 to 17 Years | 94 (6.4%) | 41 (2.5%) |
| 18 to 34 Years | 387 (23.1%) | 216 (10.8%) |
| 35 to 64 Years | 1,081 (31.7%) | 745 (19.3%) |
| 65 to 74 Years | 384 (37.3%) | 512 (44.6%) |
| 75 Years and over | 382 (62.3%) | 442 (50.7%) |
Disability Class by Sex by Age in Marengo County
Disability Class: Hearing Difficulty

| Age Bracket | Male | Female |
| Under 5 Years | 0 (0.0%) | 0 (0.0%) |
| 5 to 17 Years | 0 (0.0%) | 0 (0.0%) |
| 18 to 34 Years | 132 (7.9%) | 63 (3.2%) |
| 35 to 64 Years | 201 (5.9%) | 45 (1.2%) |
| 65 to 74 Years | 96 (9.3%) | 85 (7.4%) |
| 75 Years and over | 180 (29.4%) | 139 (16.0%) |
Disability Class: Vision Difficulty
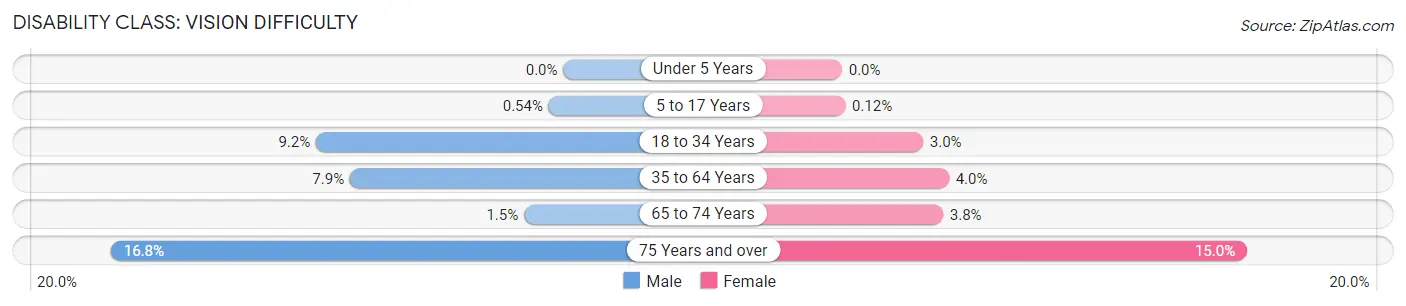
| Age Bracket | Male | Female |
| Under 5 Years | 0 (0.0%) | 0 (0.0%) |
| 5 to 17 Years | 8 (0.5%) | 2 (0.1%) |
| 18 to 34 Years | 154 (9.2%) | 60 (3.0%) |
| 35 to 64 Years | 270 (7.9%) | 153 (4.0%) |
| 65 to 74 Years | 15 (1.5%) | 43 (3.7%) |
| 75 Years and over | 103 (16.8%) | 131 (15.0%) |
Disability Class: Cognitive Difficulty
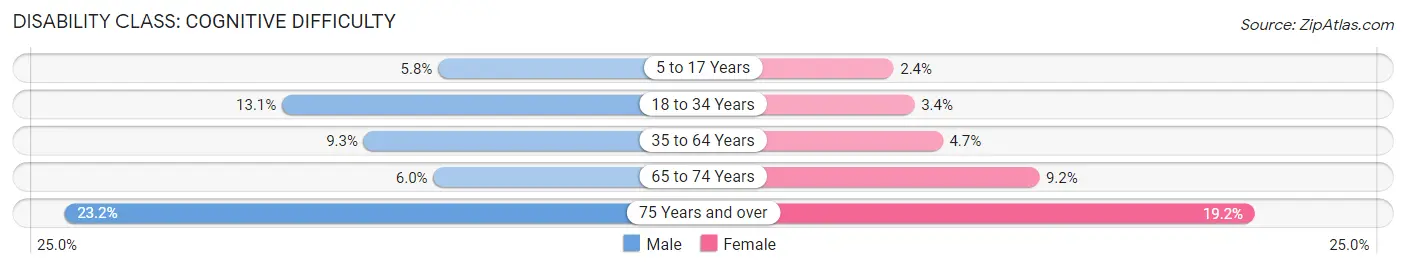
| Age Bracket | Male | Female |
| 5 to 17 Years | 86 (5.8%) | 39 (2.4%) |
| 18 to 34 Years | 219 (13.1%) | 67 (3.4%) |
| 35 to 64 Years | 316 (9.3%) | 180 (4.7%) |
| 65 to 74 Years | 62 (6.0%) | 105 (9.1%) |
| 75 Years and over | 142 (23.2%) | 167 (19.2%) |
Disability Class: Ambulatory Difficulty

| Age Bracket | Male | Female |
| 5 to 17 Years | 0 (0.0%) | 0 (0.0%) |
| 18 to 34 Years | 23 (1.4%) | 51 (2.6%) |
| 35 to 64 Years | 710 (20.8%) | 592 (15.3%) |
| 65 to 74 Years | 326 (31.7%) | 354 (30.9%) |
| 75 Years and over | 240 (39.2%) | 336 (38.6%) |
Disability Class: Self-Care Difficulty
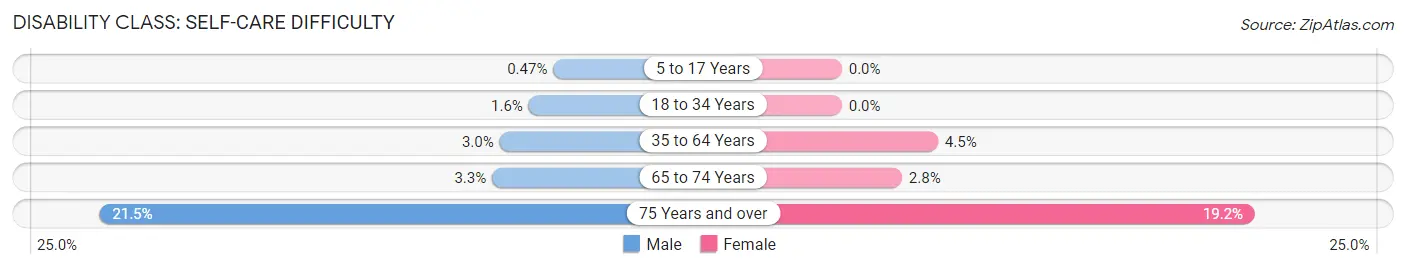
| Age Bracket | Male | Female |
| 5 to 17 Years | 7 (0.5%) | 0 (0.0%) |
| 18 to 34 Years | 27 (1.6%) | 0 (0.0%) |
| 35 to 64 Years | 101 (3.0%) | 172 (4.5%) |
| 65 to 74 Years | 34 (3.3%) | 32 (2.8%) |
| 75 Years and over | 132 (21.5%) | 167 (19.2%) |
Technology Access in Marengo County
Computing Device Access in Marengo County
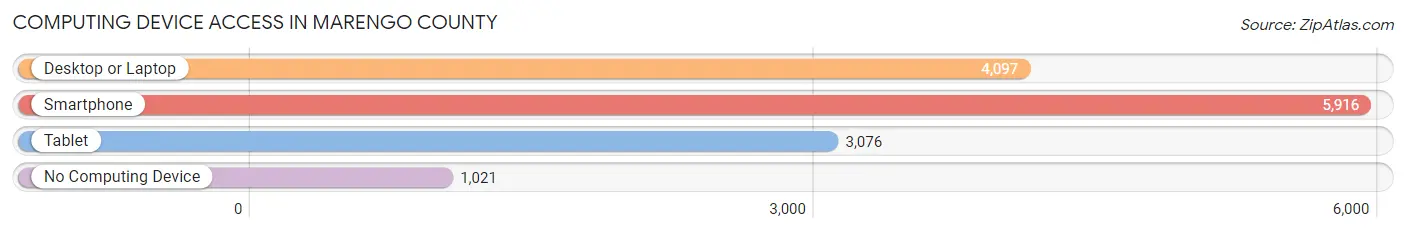
| Device Type | # Households | % Households |
| Desktop or Laptop | 4,097 | 55.5% |
| Smartphone | 5,916 | 80.2% |
| Tablet | 3,076 | 41.7% |
| No Computing Device | 1,021 | 13.8% |
| Total | 7,379 | 100.0% |
Internet Access in Marengo County
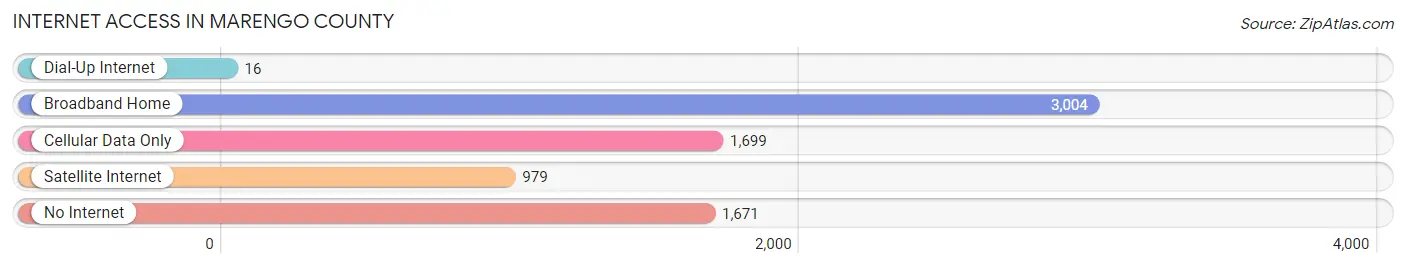
| Internet Type | # Households | % Households |
| Dial-Up Internet | 16 | 0.2% |
| Broadband Home | 3,004 | 40.7% |
| Cellular Data Only | 1,699 | 23.0% |
| Satellite Internet | 979 | 13.3% |
| No Internet | 1,671 | 22.7% |
| Total | 7,379 | 100.0% |
Marengo County Summary
Marengo County is located in the southwestern part of the state of Alabama, in the Black Belt region of the state. It is bordered by Sumter County to the north, Choctaw County to the east, Clarke County to the south, and Wilcox County to the west. The county seat is Linden, and the largest city is Demopolis. The county was established in 1818 and named for the Battle of Marengo, which was fought in 1800 during the French Revolutionary Wars.
Geography
Marengo County covers an area of 1,541 square miles, making it the fourth-largest county in Alabama. The terrain is mostly flat, with some rolling hills in the northern part of the county. The Tombigbee River forms the western border of the county, and the Alabama River forms the eastern border. The county is drained by several creeks, including the Mulberry, Sipsey, and Sucarnoochee. The county is mostly covered in pine and hardwood forests, with some agricultural land in the northern part of the county.
Demographics
As of the 2010 census, Marengo County had a population of 21,027. The racial makeup of the county was 57.3% White, 40.2% Black or African American, 0.3% Native American, 0.3% Asian, 0.2% from other races, and 1.9% from two or more races. 1.7% of the population were Hispanic or Latino of any race.
The median household income in the county was $30,945, and the median family income was $37,945. The per capita income was $16,945. About 22.2% of the population was below the poverty line.
Economy
Marengo County is largely rural and agricultural. The main crops grown in the county are cotton, soybeans, corn, and peanuts. The county also has a large timber industry, with pine and hardwood forests covering much of the county.
The county also has a growing tourism industry, with several historic sites and attractions. The Demopolis Historic District is a National Historic Landmark, and the town of Demopolis is home to several antebellum homes and other historic buildings. The county is also home to the Bluff Hall Plantation, a historic plantation house that is now a museum.
The county is served by the Alabama State Port Authority, which operates the Port of Demopolis on the Tombigbee River. The port is used for shipping agricultural products, timber, and other goods.
History
Marengo County was established in 1818 and named for the Battle of Marengo, which was fought in 1800 during the French Revolutionary Wars. The county was originally part of the Choctaw Nation, and the area was first settled by European Americans in the early 19th century.
The county was home to several large plantations, and the economy was largely based on agriculture. The county was also home to several Confederate military units during the Civil War. After the war, the county's economy shifted to timber and lumber production.
In the late 19th and early 20th centuries, the county was home to several large sawmills and timber companies. The county also had a thriving agricultural industry, with cotton, soybeans, corn, and peanuts being the main crops.
The county has seen a decline in population since the mid-20th century, as many people have moved away in search of better economic opportunities. However, the county has seen a resurgence in recent years, with a growing tourism industry and a growing timber industry.
Common Questions
What is the Total Population of Marengo County?
Total Population of Marengo County is 19,180.
What is the Total Male Population of Marengo County?
Total Male Population of Marengo County is 9,100.
What is the Total Female Population of Marengo County?
Total Female Population of Marengo County is 10,080.
What is the Ratio of Males per 100 Females in Marengo County?
There are 90.28 Males per 100 Females in Marengo County.
What is the Ratio of Females per 100 Males in Marengo County?
There are 110.77 Females per 100 Males in Marengo County.
What is the Median Population Age in Marengo County?
Median Population Age in Marengo County is 41.7 Years.
What is the Average Family Size in Marengo County
Average Family Size in Marengo County is 3.6 People.
What is the Average Household Size in Marengo County
Average Household Size in Marengo County is 2.6 People.
What is Per Capita Income in Marengo County?
Per Capita income in Marengo County is $27,210.
What is the Median Family Income in Marengo County?
Median Family Income in Marengo County is $67,083.
What is the Median Household income in Marengo County?
Median Household Income in Marengo County is $42,975.
What is Income or Wage Gap in Marengo County?
Income or Wage Gap in Marengo County is 38.5%.
Women in Marengo County earn 61.5 cents for every dollar earned by a man.
What is Family Income Deficit in Marengo County?
Family Income Deficit in Marengo County is $9,853.
Families that are below poverty line in Marengo County earn $9,853 less on average than the poverty threshold level.
What is Inequality or Gini Index in Marengo County?
Inequality or Gini Index in Marengo County is 0.52.
How Large is the Labor Force in Marengo County?
There are 7,810 People in the Labor Forcein in Marengo County.
What is the Percentage of People in the Labor Force in Marengo County?
50.6% of People are in the Labor Force in Marengo County.
What is the Unemployment Rate in Marengo County?
Unemployment Rate in Marengo County is 2.8%.