Macon County, AL
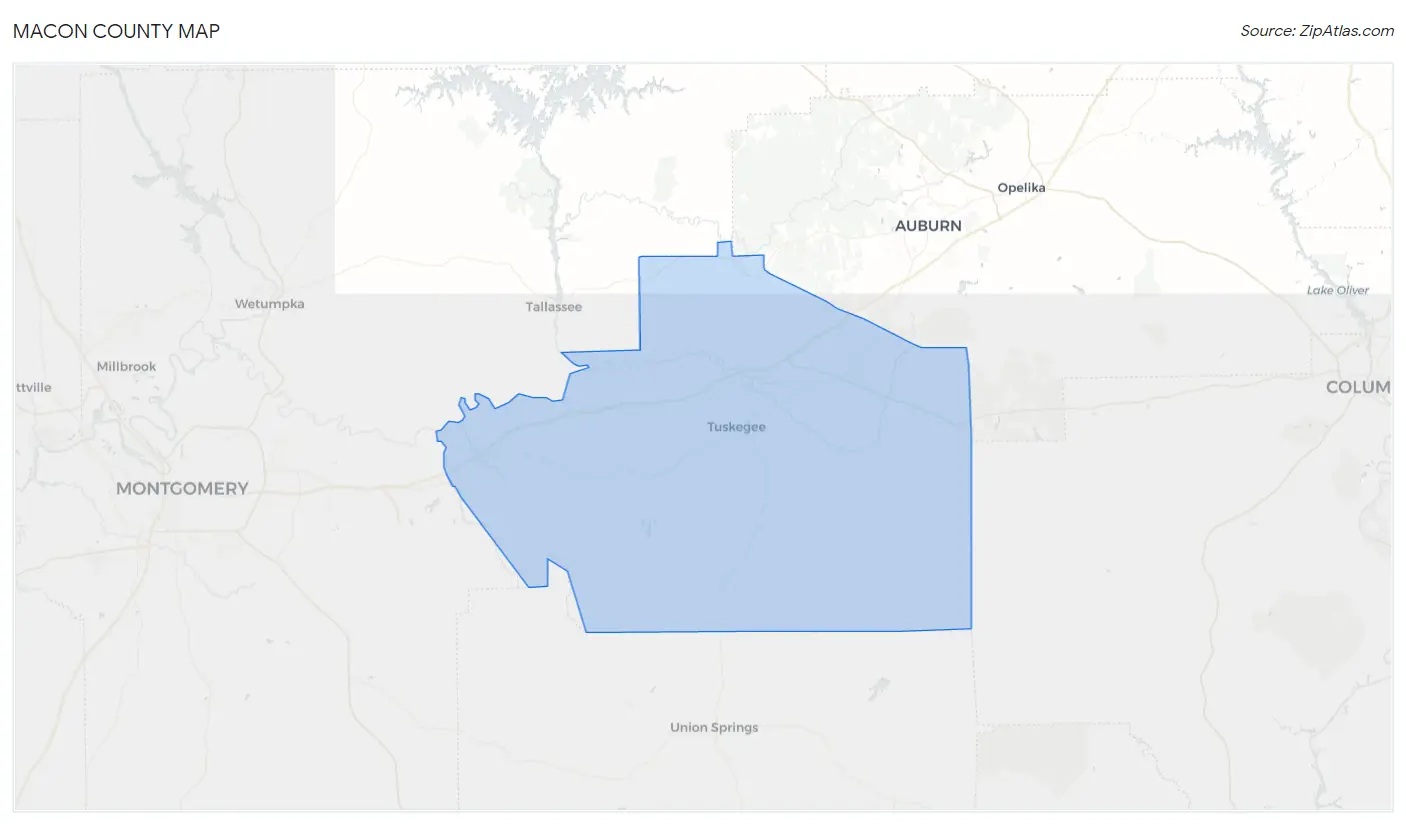
Macon County Map
Macon County Overview
19,198
TOTAL POPULATION
8,865
MALE POPULATION
10,333
FEMALE POPULATION
85.79
MALES / 100 FEMALES
116.56
FEMALES / 100 MALES
37.8
MEDIAN AGE
3.0
AVG FAMILY SIZE
2.3
AVG HOUSEHOLD SIZE
$22,449
PER CAPITA INCOME
$52,617
AVG FAMILY INCOME
$41,206
AVG HOUSEHOLD INCOME
37.0%
WAGE / INCOME GAP [ % ]
63.0¢/ $1
WAGE / INCOME GAP [ $ ]
$10,950
FAMILY INCOME DEFICIT
0.49
INEQUALITY / GINI INDEX
8,179
LABOR FORCE [ PEOPLE ]
49.8%
PERCENT IN LABOR FORCE
12.5%
UNEMPLOYMENT RATE
Macon County Area Codes
Race in Macon County
The most populous races in Macon County are Black / African American (15,142 | 78.9%), White / Caucasian (3,133 | 16.3%), and Two or more Races (789 | 4.1%).

| Race | # Population | % Population |
| Asian | 78 | 0.4% |
| Black / African American | 15,142 | 78.9% |
| Hawaiian / Pacific | 0 | 0.0% |
| Hispanic or Latino | 453 | 2.4% |
| Native / Alaskan | 7 | 0.0% |
| White / Caucasian | 3,133 | 16.3% |
| Two or more Races | 789 | 4.1% |
| Some other Race | 49 | 0.3% |
| Total | 19,198 | 100.0% |
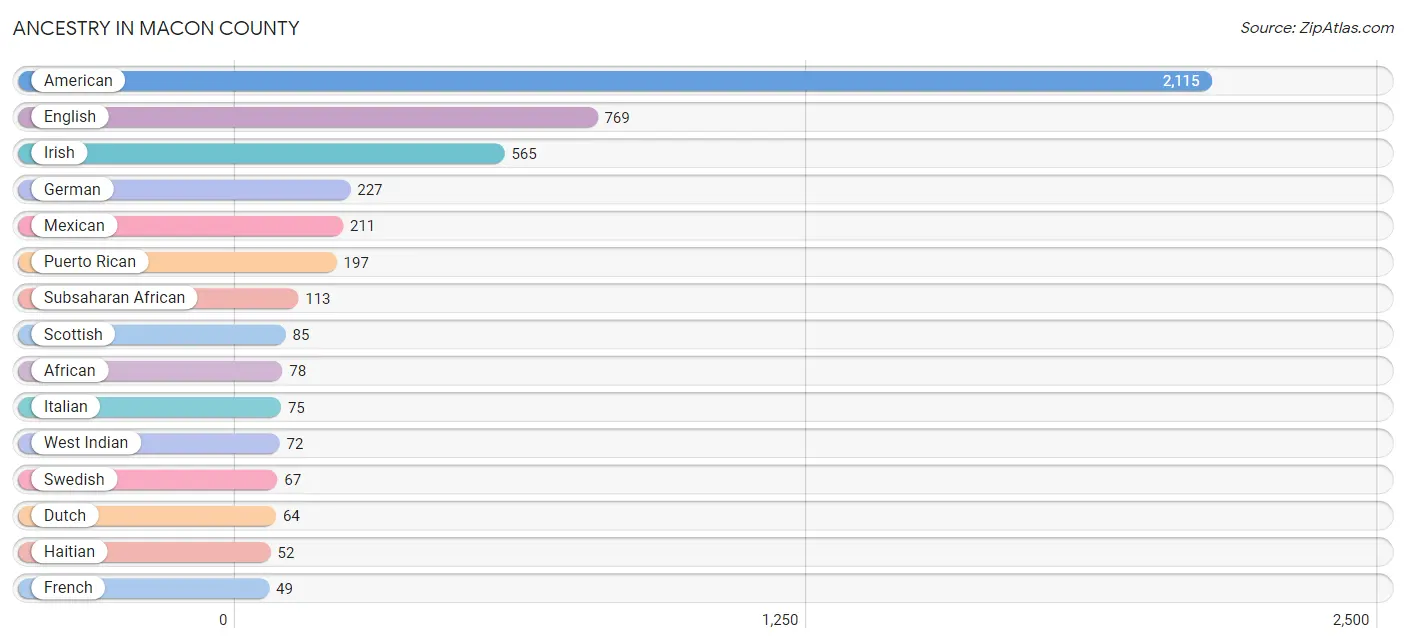
Ancestry in Macon County
The most populous ancestries reported in Macon County are American (2,115 | 11.0%), English (769 | 4.0%), Irish (565 | 2.9%), German (227 | 1.2%), and Mexican (211 | 1.1%), together accounting for 20.3% of all Macon County residents.
| Ancestry | # Population | % Population |
| African | 78 | 0.4% |
| American | 2,115 | 11.0% |
| Argentinean | 6 | 0.0% |
| Bahamian | 35 | 0.2% |
| Bhutanese | 5 | 0.0% |
| British | 20 | 0.1% |
| Burmese | 12 | 0.1% |
| Canadian | 6 | 0.0% |
| Central American | 29 | 0.2% |
| Cherokee | 41 | 0.2% |
| Choctaw | 2 | 0.0% |
| Creek | 8 | 0.0% |
| Czech | 3 | 0.0% |
| Danish | 4 | 0.0% |
| Dominican | 4 | 0.0% |
| Dutch | 64 | 0.3% |
| Eastern European | 2 | 0.0% |
| English | 769 | 4.0% |
| Estonian | 3 | 0.0% |
| European | 45 | 0.2% |
| Finnish | 4 | 0.0% |
| French | 49 | 0.3% |
| French Canadian | 11 | 0.1% |
| German | 227 | 1.2% |
| Greek | 17 | 0.1% |
| Guatemalan | 8 | 0.0% |
| Haitian | 52 | 0.3% |
| Irish | 565 | 2.9% |
| Israeli | 15 | 0.1% |
| Italian | 75 | 0.4% |
| Jamaican | 12 | 0.1% |
| Korean | 14 | 0.1% |
| Mexican | 211 | 1.1% |
| Mexican American Indian | 5 | 0.0% |
| Navajo | 12 | 0.1% |
| Nigerian | 31 | 0.2% |
| Pakistani | 11 | 0.1% |
| Polish | 39 | 0.2% |
| Puerto Rican | 197 | 1.0% |
| Salvadoran | 21 | 0.1% |
| Scandinavian | 2 | 0.0% |
| Scotch-Irish | 33 | 0.2% |
| Scottish | 85 | 0.4% |
| Sioux | 3 | 0.0% |
| South American | 6 | 0.0% |
| Sri Lankan | 25 | 0.1% |
| Subsaharan African | 113 | 0.6% |
| Swedish | 67 | 0.4% |
| Swiss | 28 | 0.2% |
| Trinidadian and Tobagonian | 14 | 0.1% |
| Welsh | 28 | 0.2% |
| West Indian | 72 | 0.4% | View All 52 Rows |
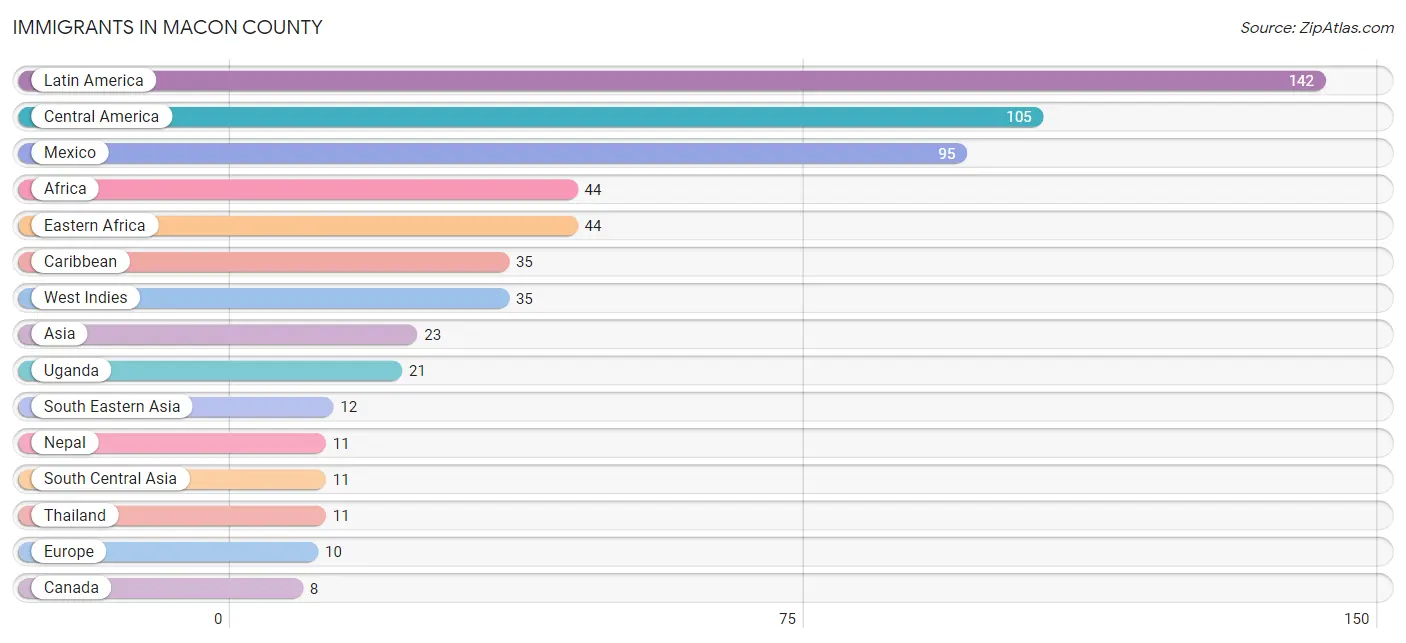
Immigrants in Macon County
The most numerous immigrant groups reported in Macon County came from Latin America (142 | 0.7%), Central America (105 | 0.5%), Mexico (95 | 0.5%), Africa (44 | 0.2%), and Eastern Africa (44 | 0.2%), together accounting for 2.2% of all Macon County residents.
| Immigration Origin | # Population | % Population |
| Africa | 44 | 0.2% |
| Asia | 23 | 0.1% |
| Canada | 8 | 0.0% |
| Caribbean | 35 | 0.2% |
| Central America | 105 | 0.5% |
| Eastern Africa | 44 | 0.2% |
| El Salvador | 2 | 0.0% |
| England | 7 | 0.0% |
| Europe | 10 | 0.1% |
| Guatemala | 8 | 0.0% |
| Guyana | 2 | 0.0% |
| Italy | 3 | 0.0% |
| Latin America | 142 | 0.7% |
| Mexico | 95 | 0.5% |
| Nepal | 11 | 0.1% |
| Northern Europe | 7 | 0.0% |
| Philippines | 1 | 0.0% |
| South America | 2 | 0.0% |
| South Central Asia | 11 | 0.1% |
| South Eastern Asia | 12 | 0.1% |
| Southern Europe | 3 | 0.0% |
| Thailand | 11 | 0.1% |
| Uganda | 21 | 0.1% |
| West Indies | 35 | 0.2% | View All 24 Rows |
Sex and Age in Macon County
Sex and Age in Macon County
The most populous age groups in Macon County are 15 to 19 Years (1,055 | 11.9%) for men and 15 to 19 Years (1,335 | 12.9%) for women.

| Age Bracket | Male | Female |
| Under 5 Years | 451 (5.1%) | 444 (4.3%) |
| 5 to 9 Years | 398 (4.5%) | 333 (3.2%) |
| 10 to 14 Years | 466 (5.3%) | 523 (5.1%) |
| 15 to 19 Years | 1,055 (11.9%) | 1,335 (12.9%) |
| 20 to 24 Years | 1,048 (11.8%) | 1,265 (12.2%) |
| 25 to 29 Years | 650 (7.3%) | 527 (5.1%) |
| 30 to 34 Years | 418 (4.7%) | 448 (4.3%) |
| 35 to 39 Years | 297 (3.4%) | 323 (3.1%) |
| 40 to 44 Years | 389 (4.4%) | 434 (4.2%) |
| 45 to 49 Years | 422 (4.8%) | 511 (5.0%) |
| 50 to 54 Years | 516 (5.8%) | 564 (5.5%) |
| 55 to 59 Years | 481 (5.4%) | 763 (7.4%) |
| 60 to 64 Years | 667 (7.5%) | 587 (5.7%) |
| 65 to 69 Years | 618 (7.0%) | 837 (8.1%) |
| 70 to 74 Years | 419 (4.7%) | 480 (4.6%) |
| 75 to 79 Years | 318 (3.6%) | 369 (3.6%) |
| 80 to 84 Years | 157 (1.8%) | 303 (2.9%) |
| 85 Years and over | 95 (1.1%) | 287 (2.8%) |
| Total | 8,865 (100.0%) | 10,333 (100.0%) |
Families and Households in Macon County
Median Family Size in Macon County
The median family size in Macon County is 3.00 persons per family, with married-couple families (2,165 | 51.4%) accounting for the largest median family size of 3.08 persons per family. On the other hand, single male/father families (360 | 8.6%) represent the smallest median family size with 2.82 persons per family.

| Family Type | # Families | Family Size |
| Married-Couple | 2,165 (51.4%) | 3.08 |
| Single Male/Father | 360 (8.6%) | 2.82 |
| Single Female/Mother | 1,685 (40.0%) | 2.93 |
| Total Families | 4,210 (100.0%) | 3.00 |
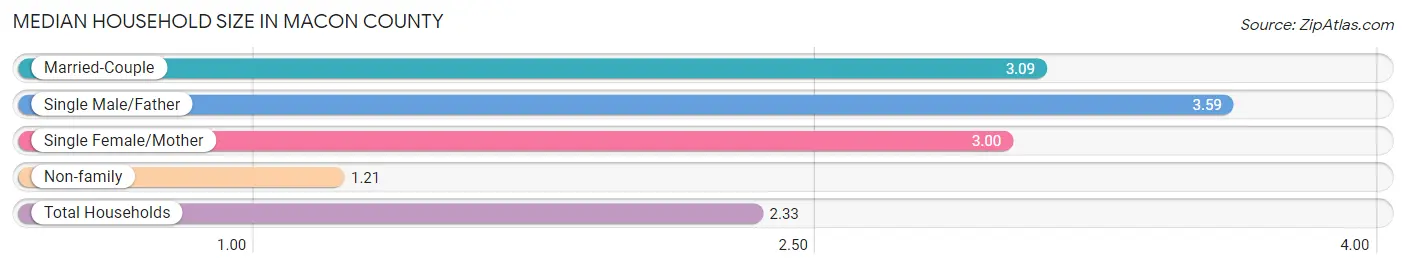
Median Household Size in Macon County
The median household size in Macon County is 2.33 persons per household, with single male/father households (360 | 5.1%) accounting for the largest median household size of 3.59 persons per household. non-family households (2,921 | 41.0%) represent the smallest median household size with 1.21 persons per household.
| Household Type | # Households | Household Size |
| Married-Couple | 2,165 (30.4%) | 3.09 |
| Single Male/Father | 360 (5.1%) | 3.59 |
| Single Female/Mother | 1,685 (23.6%) | 3.00 |
| Non-family | 2,921 (41.0%) | 1.21 |
| Total Households | 7,131 (100.0%) | 2.33 |
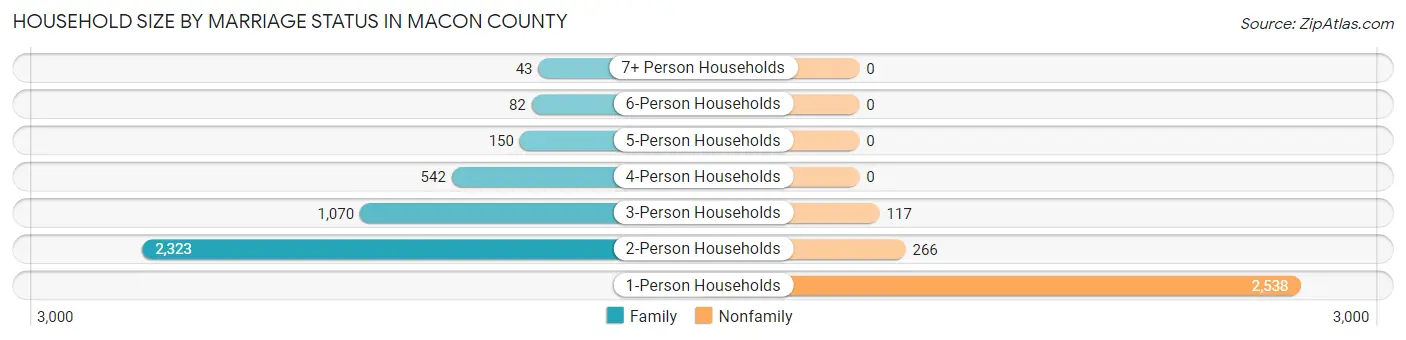
Household Size by Marriage Status in Macon County
Out of a total of 7,131 households in Macon County, 4,210 (59.0%) are family households, while 2,921 (41.0%) are nonfamily households. The most numerous type of family households are 2-person households, comprising 2,323, and the most common type of nonfamily households are 1-person households, comprising 2,538.
| Household Size | Family Households | Nonfamily Households |
| 1-Person Households | - | 2,538 (35.6%) |
| 2-Person Households | 2,323 (32.6%) | 266 (3.7%) |
| 3-Person Households | 1,070 (15.0%) | 117 (1.6%) |
| 4-Person Households | 542 (7.6%) | 0 (0.0%) |
| 5-Person Households | 150 (2.1%) | 0 (0.0%) |
| 6-Person Households | 82 (1.1%) | 0 (0.0%) |
| 7+ Person Households | 43 (0.6%) | 0 (0.0%) |
| Total | 4,210 (59.0%) | 2,921 (41.0%) |
Female Fertility in Macon County
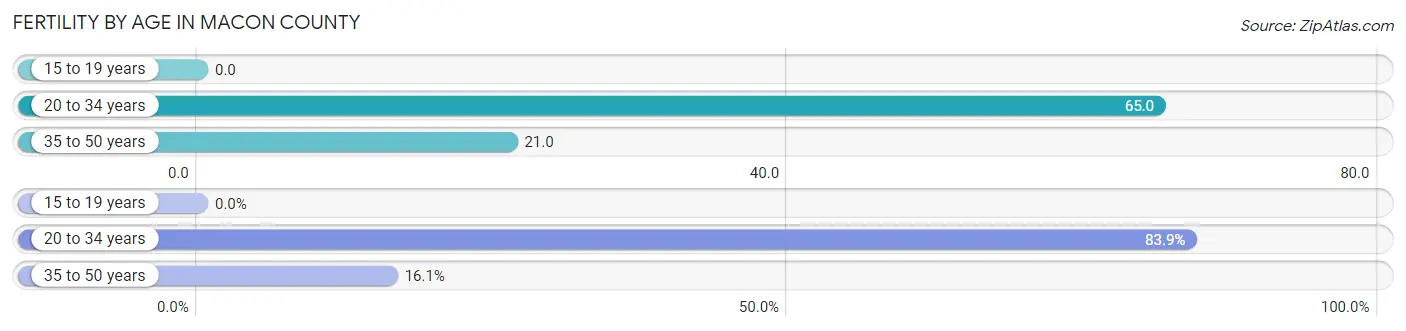
Fertility by Age in Macon County
Average fertility rate in Macon County is 35.0 births per 1,000 women. Women in the age bracket of 20 to 34 years have the highest fertility rate with 65.0 births per 1,000 women. Women in the age bracket of 20 to 34 years acount for 83.9% of all women with births.
| Age Bracket | Women with Births | Births / 1,000 Women |
| 15 to 19 years | 0 (0.0%) | 0.0 |
| 20 to 34 years | 146 (83.9%) | 65.0 |
| 35 to 50 years | 28 (16.1%) | 21.0 |
| Total | 174 (100.0%) | 35.0 |
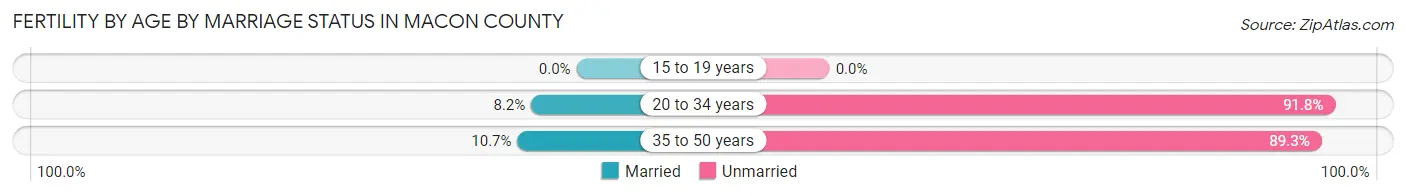
Fertility by Age by Marriage Status in Macon County
8.6% of women with births (174) in Macon County are married. The highest percentage of unmarried women with births falls into 20 to 34 years age bracket with 91.8% of them unmarried at the time of birth, while the lowest percentage of unmarried women with births belong to 35 to 50 years age bracket with 89.3% of them unmarried.
| Age Bracket | Married | Unmarried |
| 15 to 19 years | 0 (0.0%) | 0 (0.0%) |
| 20 to 34 years | 12 (8.2%) | 134 (91.8%) |
| 35 to 50 years | 3 (10.7%) | 25 (89.3%) |
| Total | 15 (8.6%) | 159 (91.4%) |
Fertility by Education in Macon County

| Educational Attainment | Women with Births | Births / 1,000 Women |
| Less than High School | 40 (23.0%) | 63.0 |
| High School Diploma | 89 (51.1%) | 83.0 |
| College or Associate's Degree | 42 (24.1%) | 16.0 |
| Bachelor's Degree | 3 (1.7%) | 9.0 |
| Graduate Degree | 0 (0.0%) | 0.0 |
| Total | 174 (100.0%) | 35.0 |
Fertility by Education by Marriage Status in Macon County
91.4% of women with births in Macon County are unmarried. Women with the educational attainment of bachelor's degree are most likely to be married with 100.0% of them married at childbirth, while women with the educational attainment of less than high school are least likely to be married with 100.0% of them unmarried at childbirth.

| Educational Attainment | Married | Unmarried |
| Less than High School | 0 (0.0%) | 40 (100.0%) |
| High School Diploma | 0 (0.0%) | 89 (100.0%) |
| College or Associate's Degree | 12 (28.6%) | 30 (71.4%) |
| Bachelor's Degree | 3 (100.0%) | 0 (0.0%) |
| Graduate Degree | 0 (0.0%) | 0 (0.0%) |
| Total | 15 (8.6%) | 159 (91.4%) |
Income in Macon County
Income Overview in Macon County
Per Capita Income in Macon County is $22,449, while median incomes of families and households are $52,617 and $41,206 respectively.
| Characteristic | Number | Measure |
| Per Capita Income | 19,198 | $22,449 |
| Median Family Income | 4,210 | $52,617 |
| Mean Family Income | 4,210 | $70,163 |
| Median Household Income | 7,131 | $41,206 |
| Mean Household Income | 7,131 | $57,338 |
| Income Deficit | 4,210 | $10,950 |
| Wage / Income Gap (%) | 19,198 | 36.98% |
| Wage / Income Gap ($) | 19,198 | 63.02¢ per $1 |
| Gini / Inequality Index | 19,198 | 0.49 |
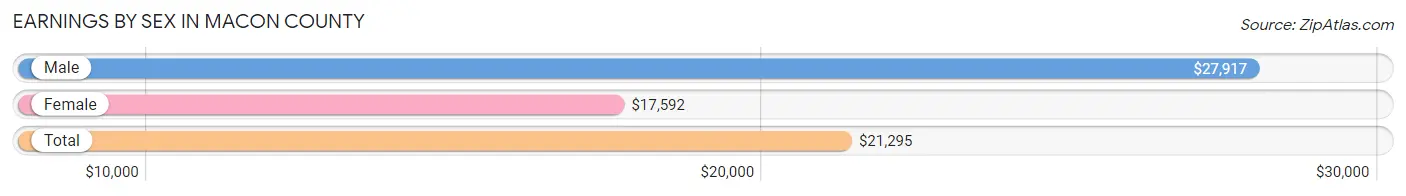
Earnings by Sex in Macon County
Average Earnings in Macon County are $21,295, $27,917 for men and $17,592 for women, a difference of 37.0%.
| Sex | Number | Average Earnings |
| Male | 4,202 (46.1%) | $27,917 |
| Female | 4,912 (53.9%) | $17,592 |
| Total | 9,114 (100.0%) | $21,295 |
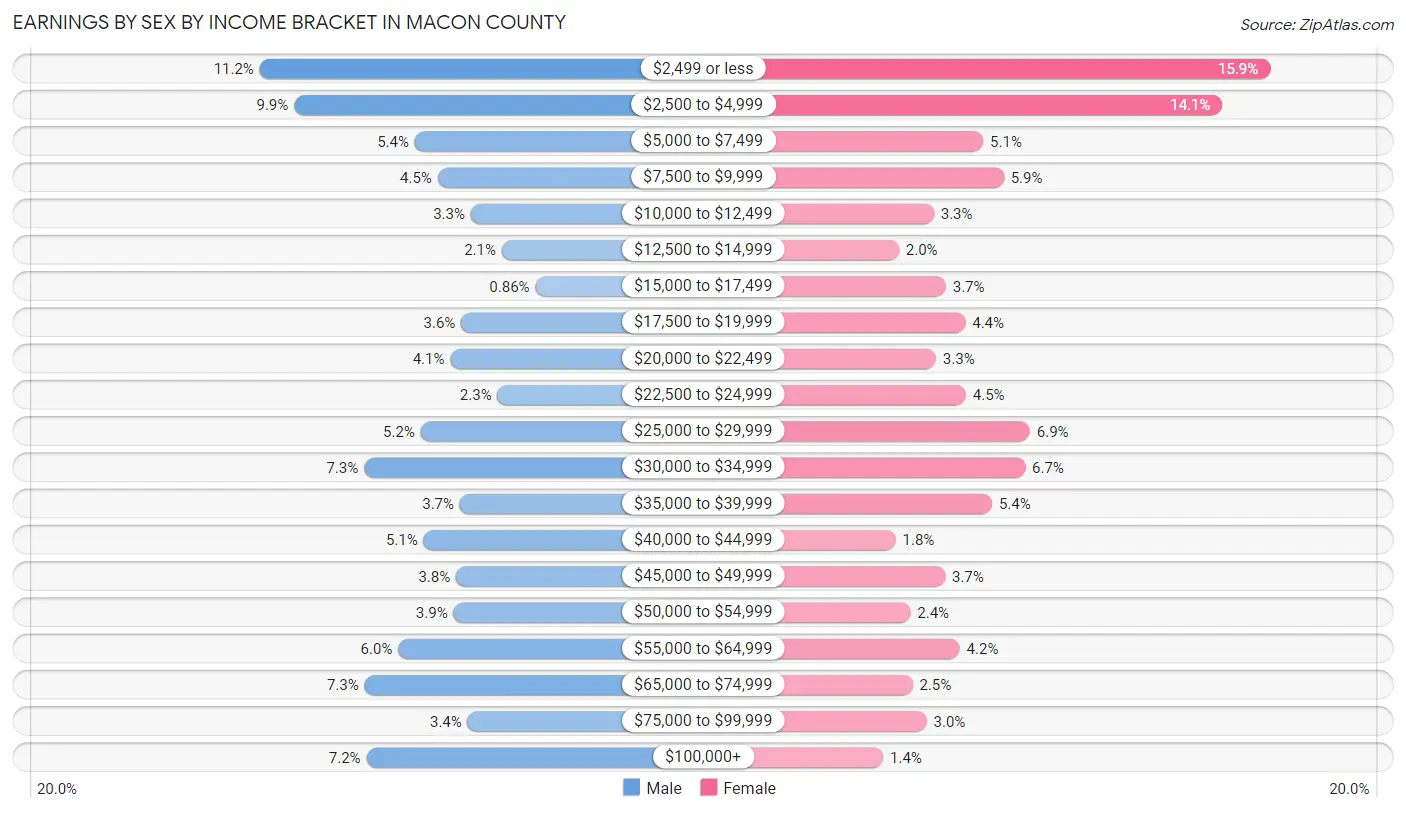
Earnings by Sex by Income Bracket in Macon County
The most common earnings brackets in Macon County are $2,499 or less for men (470 | 11.2%) and $2,499 or less for women (779 | 15.9%).
| Income | Male | Female |
| $2,499 or less | 470 (11.2%) | 779 (15.9%) |
| $2,500 to $4,999 | 416 (9.9%) | 691 (14.1%) |
| $5,000 to $7,499 | 226 (5.4%) | 251 (5.1%) |
| $7,500 to $9,999 | 190 (4.5%) | 289 (5.9%) |
| $10,000 to $12,499 | 138 (3.3%) | 160 (3.3%) |
| $12,500 to $14,999 | 89 (2.1%) | 96 (1.9%) |
| $15,000 to $17,499 | 36 (0.9%) | 182 (3.7%) |
| $17,500 to $19,999 | 153 (3.6%) | 218 (4.4%) |
| $20,000 to $22,499 | 170 (4.1%) | 164 (3.3%) |
| $22,500 to $24,999 | 96 (2.3%) | 219 (4.5%) |
| $25,000 to $29,999 | 217 (5.2%) | 337 (6.9%) |
| $30,000 to $34,999 | 306 (7.3%) | 328 (6.7%) |
| $35,000 to $39,999 | 155 (3.7%) | 267 (5.4%) |
| $40,000 to $44,999 | 212 (5.1%) | 90 (1.8%) |
| $45,000 to $49,999 | 161 (3.8%) | 181 (3.7%) |
| $50,000 to $54,999 | 165 (3.9%) | 117 (2.4%) |
| $55,000 to $64,999 | 252 (6.0%) | 208 (4.2%) |
| $65,000 to $74,999 | 305 (7.3%) | 121 (2.5%) |
| $75,000 to $99,999 | 143 (3.4%) | 147 (3.0%) |
| $100,000+ | 302 (7.2%) | 67 (1.4%) |
| Total | 4,202 (100.0%) | 4,912 (100.0%) |
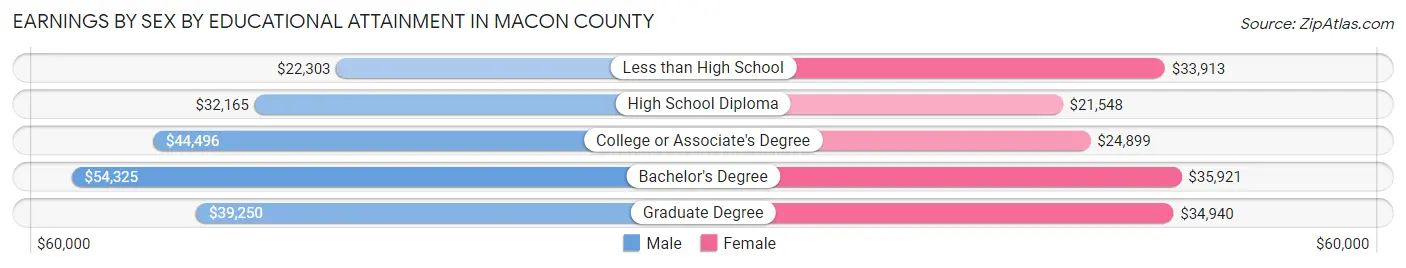
Earnings by Sex by Educational Attainment in Macon County
Average earnings in Macon County are $39,872 for men and $28,620 for women, a difference of 28.2%. Men with an educational attainment of bachelor's degree enjoy the highest average annual earnings of $54,325, while those with less than high school education earn the least with $22,303. Women with an educational attainment of bachelor's degree earn the most with the average annual earnings of $35,921, while those with high school diploma education have the smallest earnings of $21,548.
| Educational Attainment | Male Income | Female Income |
| Less than High School | $22,303 | $33,913 |
| High School Diploma | $32,165 | $21,548 |
| College or Associate's Degree | $44,496 | $24,899 |
| Bachelor's Degree | $54,325 | $35,921 |
| Graduate Degree | $39,250 | $34,940 |
| Total | $39,872 | $28,620 |
Family Income in Macon County
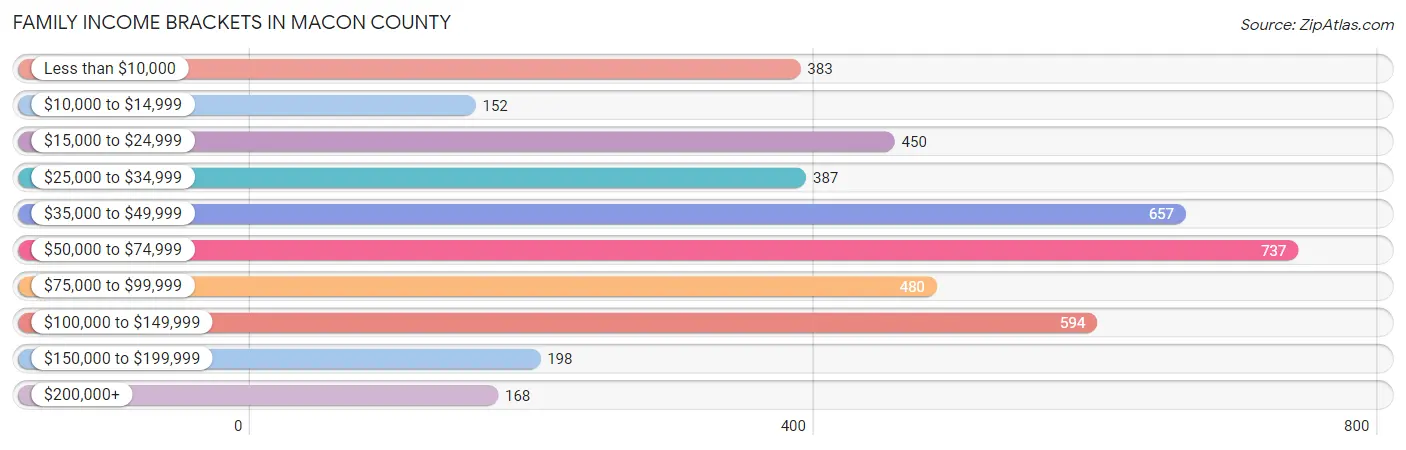
Family Income Brackets in Macon County
According to the Macon County family income data, there are 737 families falling into the $50,000 to $74,999 income range, which is the most common income bracket and makes up 17.5% of all families. Conversely, the $10,000 to $14,999 income bracket is the least frequent group with only 152 families (3.6%) belonging to this category.
| Income Bracket | # Families | % Families |
| Less than $10,000 | 383 | 9.1% |
| $10,000 to $14,999 | 152 | 3.6% |
| $15,000 to $24,999 | 450 | 10.7% |
| $25,000 to $34,999 | 387 | 9.2% |
| $35,000 to $49,999 | 657 | 15.6% |
| $50,000 to $74,999 | 737 | 17.5% |
| $75,000 to $99,999 | 480 | 11.4% |
| $100,000 to $149,999 | 594 | 14.1% |
| $150,000 to $199,999 | 198 | 4.7% |
| $200,000+ | 168 | 4.0% |
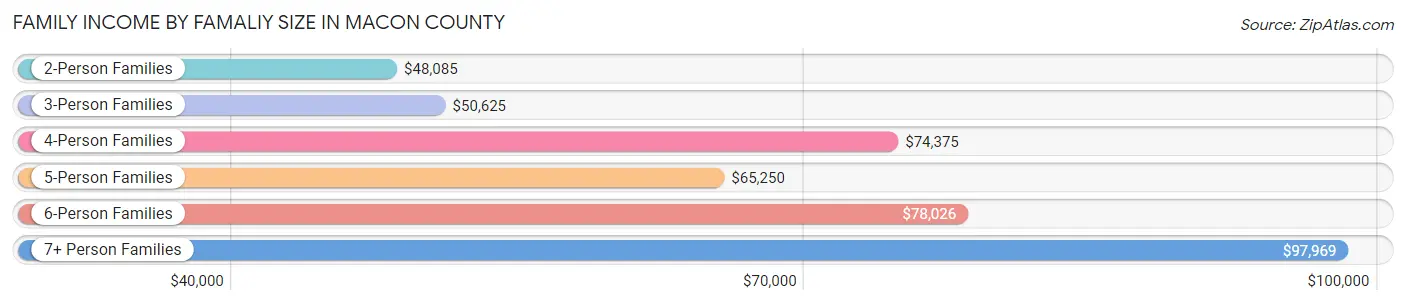
Family Income by Famaliy Size in Macon County
7+ person families (35 | 0.8%) account for the highest median family income in Macon County with $97,969 per family, while 2-person families (2,431 | 57.7%) have the highest median income of $24,042 per family member.
| Income Bracket | # Families | Median Income |
| 2-Person Families | 2,431 (57.7%) | $48,085 |
| 3-Person Families | 1,082 (25.7%) | $50,625 |
| 4-Person Families | 476 (11.3%) | $74,375 |
| 5-Person Families | 128 (3.0%) | $65,250 |
| 6-Person Families | 58 (1.4%) | $78,026 |
| 7+ Person Families | 35 (0.8%) | $97,969 |
| Total | 4,210 (100.0%) | $52,617 |
Family Income by Number of Earners in Macon County
The median family income in Macon County is $52,617, with families comprising 3+ earners (297) having the highest median family income of $103,512, while families with no earners (1,074) have the lowest median family income of $28,534, accounting for 7.0% and 25.5% of families, respectively.
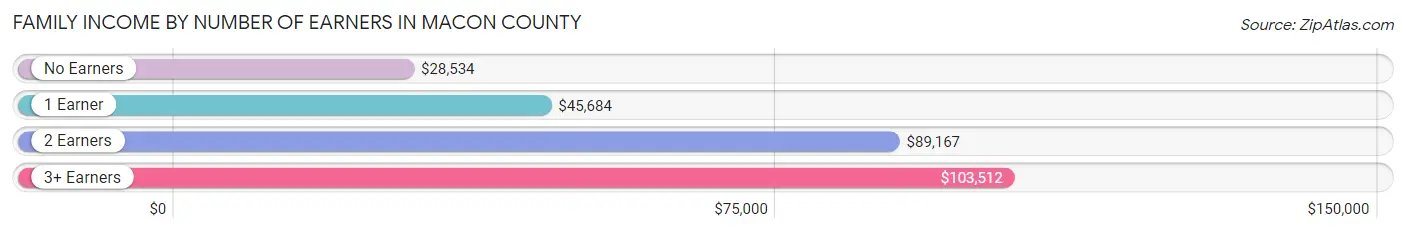
| Number of Earners | # Families | Median Income |
| No Earners | 1,074 (25.5%) | $28,534 |
| 1 Earner | 1,633 (38.8%) | $45,684 |
| 2 Earners | 1,206 (28.6%) | $89,167 |
| 3+ Earners | 297 (7.0%) | $103,512 |
| Total | 4,210 (100.0%) | $52,617 |
Household Income in Macon County
Household Income Brackets in Macon County
With 1,127 households falling in the category, the $50,000 to $74,999 income range is the most frequent in Macon County, accounting for 15.8% of all households. In contrast, only 185 households (2.6%) fall into the $200,000+ income bracket, making it the least populous group.
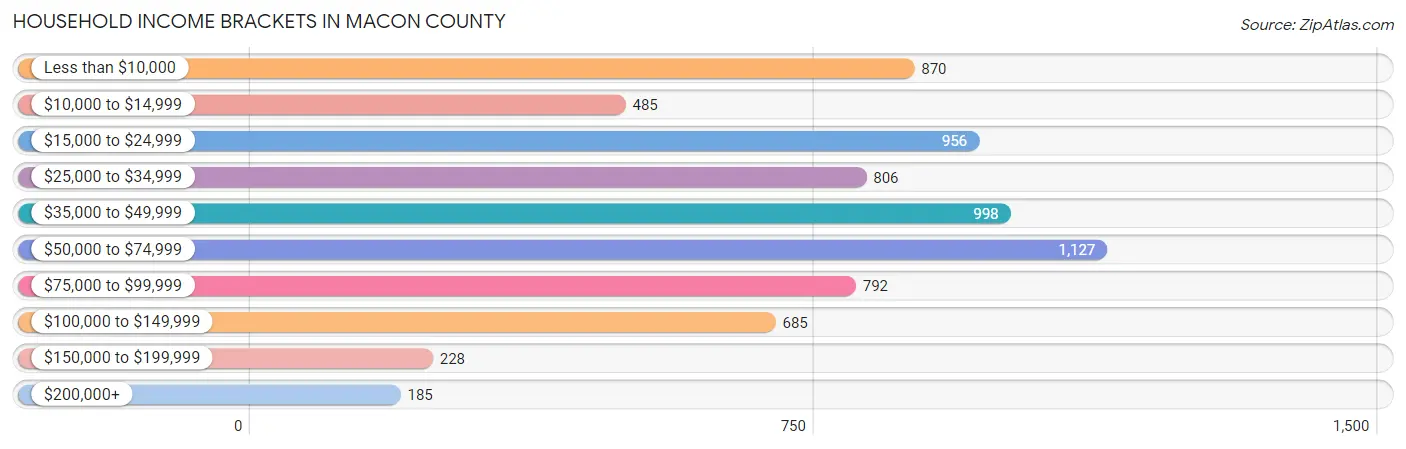
| Income Bracket | # Households | % Households |
| Less than $10,000 | 870 | 12.2% |
| $10,000 to $14,999 | 485 | 6.8% |
| $15,000 to $24,999 | 956 | 13.4% |
| $25,000 to $34,999 | 806 | 11.3% |
| $35,000 to $49,999 | 998 | 14.0% |
| $50,000 to $74,999 | 1,127 | 15.8% |
| $75,000 to $99,999 | 792 | 11.1% |
| $100,000 to $149,999 | 685 | 9.6% |
| $150,000 to $199,999 | 228 | 3.2% |
| $200,000+ | 185 | 2.6% |
Household Income by Householder Age in Macon County
The median household income in Macon County is $41,206, with the highest median household income of $46,374 found in the 45 to 64 years age bracket for the primary householder. A total of 2,676 households (37.5%) fall into this category. Meanwhile, the 15 to 24 years age bracket for the primary householder has the lowest median household income of $0, with 378 households (5.3%) in this group.
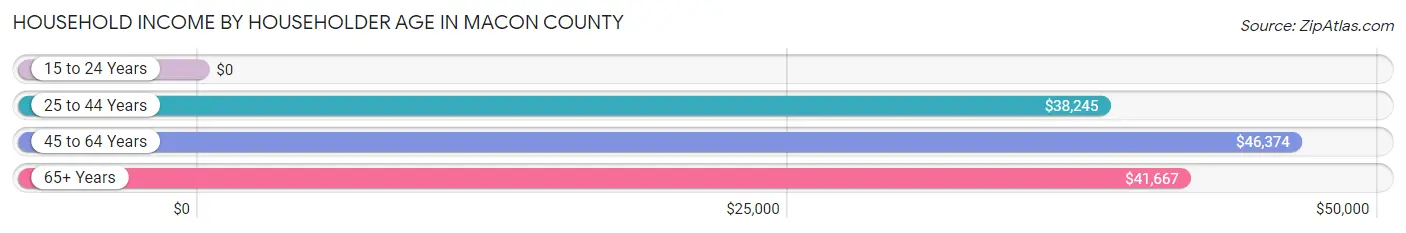
| Income Bracket | # Households | Median Income |
| 15 to 24 Years | 378 (5.3%) | $0 |
| 25 to 44 Years | 1,543 (21.6%) | $38,245 |
| 45 to 64 Years | 2,676 (37.5%) | $46,374 |
| 65+ Years | 2,534 (35.5%) | $41,667 |
| Total | 7,131 (100.0%) | $41,206 |
Poverty in Macon County
Income Below Poverty by Sex and Age in Macon County
With 25.2% poverty level for males and 24.8% for females among the residents of Macon County, 5 year old males and 18 to 24 year old females are the most vulnerable to poverty, with 19 males (70.4%) and 316 females (52.4%) in their respective age groups living below the poverty level.

| Age Bracket | Male | Female |
| Under 5 Years | 121 (29.2%) | 131 (30.8%) |
| 5 Years | 19 (70.4%) | 6 (10.7%) |
| 6 to 11 Years | 184 (34.2%) | 157 (31.1%) |
| 12 to 14 Years | 56 (23.5%) | 121 (41.0%) |
| 15 Years | 25 (41.0%) | 26 (26.3%) |
| 16 and 17 Years | 102 (45.5%) | 38 (25.3%) |
| 18 to 24 Years | 324 (29.8%) | 316 (52.4%) |
| 25 to 34 Years | 329 (31.1%) | 263 (27.0%) |
| 35 to 44 Years | 165 (24.4%) | 230 (30.4%) |
| 45 to 54 Years | 212 (22.6%) | 205 (19.1%) |
| 55 to 64 Years | 258 (22.9%) | 277 (20.5%) |
| 65 to 74 Years | 155 (15.2%) | 181 (13.9%) |
| 75 Years and over | 55 (10.2%) | 171 (17.8%) |
| Total | 2,005 (25.2%) | 2,122 (24.8%) |
Income Above Poverty by Sex and Age in Macon County
According to the poverty statistics in Macon County, males aged 75 years and over and females aged 5 years are the age groups that are most secure financially, with 89.8% of males and 89.3% of females in these age groups living above the poverty line.
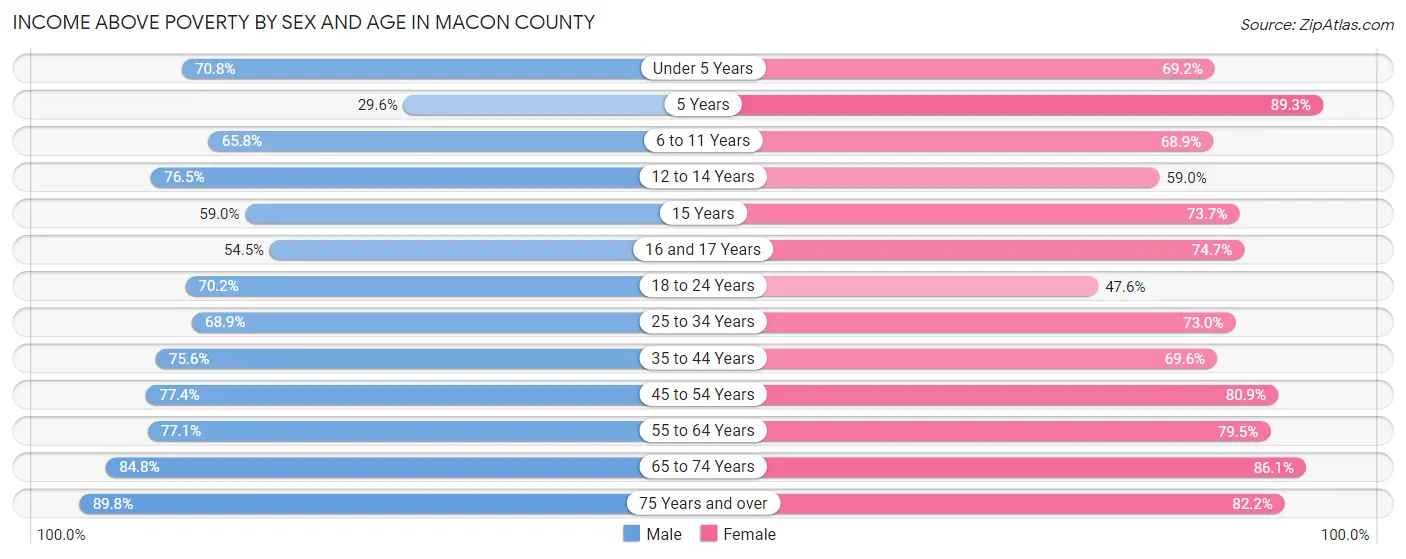
| Age Bracket | Male | Female |
| Under 5 Years | 293 (70.8%) | 294 (69.2%) |
| 5 Years | 8 (29.6%) | 50 (89.3%) |
| 6 to 11 Years | 354 (65.8%) | 348 (68.9%) |
| 12 to 14 Years | 182 (76.5%) | 174 (59.0%) |
| 15 Years | 36 (59.0%) | 73 (73.7%) |
| 16 and 17 Years | 122 (54.5%) | 112 (74.7%) |
| 18 to 24 Years | 762 (70.2%) | 287 (47.6%) |
| 25 to 34 Years | 729 (68.9%) | 712 (73.0%) |
| 35 to 44 Years | 511 (75.6%) | 527 (69.6%) |
| 45 to 54 Years | 726 (77.4%) | 870 (80.9%) |
| 55 to 64 Years | 870 (77.1%) | 1,073 (79.5%) |
| 65 to 74 Years | 867 (84.8%) | 1,122 (86.1%) |
| 75 Years and over | 482 (89.8%) | 788 (82.2%) |
| Total | 5,942 (74.8%) | 6,430 (75.2%) |
Income Below Poverty Among Married-Couple Families in Macon County
The poverty statistics for married-couple families in Macon County show that 9.6% or 208 of the total 2,165 families live below the poverty line. Families with 5 or more children have the highest poverty rate of 100.0%, comprising of 4 families. On the other hand, families with no children have the lowest poverty rate of 9.4%, which includes 155 families.
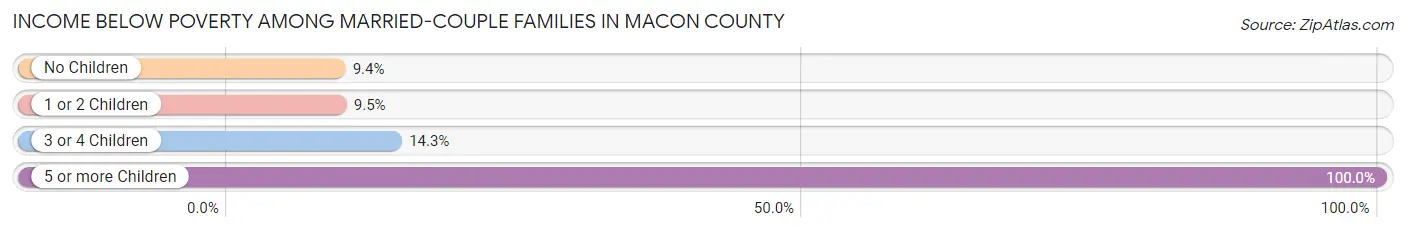
| Children | Above Poverty | Below Poverty |
| No Children | 1,499 (90.6%) | 155 (9.4%) |
| 1 or 2 Children | 440 (90.5%) | 46 (9.5%) |
| 3 or 4 Children | 18 (85.7%) | 3 (14.3%) |
| 5 or more Children | 0 (0.0%) | 4 (100.0%) |
| Total | 1,957 (90.4%) | 208 (9.6%) |
Income Below Poverty Among Single-Parent Households in Macon County
According to the poverty data in Macon County, 18.1% or 65 single-father households and 34.3% or 578 single-mother households are living below the poverty line. Among single-father households, those with 3 or 4 children have the highest poverty rate, with 6 households (30.0%) experiencing poverty. Likewise, among single-mother households, those with 1 or 2 children have the highest poverty rate, with 417 households (50.5%) falling below the poverty line.

| Children | Single Father | Single Mother |
| No Children | 27 (13.6%) | 160 (19.0%) |
| 1 or 2 Children | 32 (22.7%) | 417 (50.5%) |
| 3 or 4 Children | 6 (30.0%) | 1 (25.0%) |
| 5 or more Children | 0 (0.0%) | 0 (0.0%) |
| Total | 65 (18.1%) | 578 (34.3%) |
Income Below Poverty Among Married-Couple vs Single-Parent Households in Macon County
The poverty data for Macon County shows that 208 of the married-couple family households (9.6%) and 643 of the single-parent households (31.4%) are living below the poverty level. Within the married-couple family households, those with 5 or more children have the highest poverty rate, with 4 households (100.0%) falling below the poverty line. Among the single-parent households, those with 1 or 2 children have the highest poverty rate, with 449 household (46.4%) living below poverty.
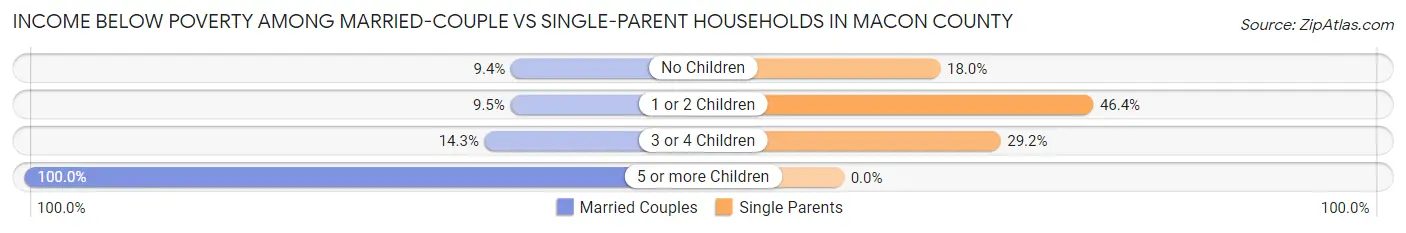
| Children | Married-Couple Families | Single-Parent Households |
| No Children | 155 (9.4%) | 187 (17.9%) |
| 1 or 2 Children | 46 (9.5%) | 449 (46.4%) |
| 3 or 4 Children | 3 (14.3%) | 7 (29.2%) |
| 5 or more Children | 4 (100.0%) | 0 (0.0%) |
| Total | 208 (9.6%) | 643 (31.4%) |
Employment Characteristics in Macon County
Employment by Class of Employer in Macon County
Among the 6,787 employed individuals in Macon County, private company employees (3,962 | 58.4%), state government employees (663 | 9.8%), and not-for-profit organizations (558 | 8.2%) make up the most common classes of employment.

| Employer Class | # Employees | % Employees |
| Private Company Employees | 3,962 | 58.4% |
| Self-Employed (Incorporated) | 153 | 2.2% |
| Self-Employed (Not Incorporated) | 444 | 6.5% |
| Not-for-profit Organizations | 558 | 8.2% |
| Local Government Employees | 537 | 7.9% |
| State Government Employees | 663 | 9.8% |
| Federal Government Employees | 470 | 6.9% |
| Unpaid Family Workers | 0 | 0.0% |
| Total | 6,787 | 100.0% |
Employment Status by Age in Macon County
According to the labor force statistics for Macon County, out of the total population over 16 years of age (16,423), 49.8% or 8,179 individuals are in the labor force, with 12.5% or 1,022 of them unemployed. The age group with the highest labor force participation rate is 35 to 44 years, with 78.8% or 1,137 individuals in the labor force. Within the labor force, the 25 to 29 years age range has the highest percentage of unemployed individuals, with 28.4% or 241 of them being unemployed.
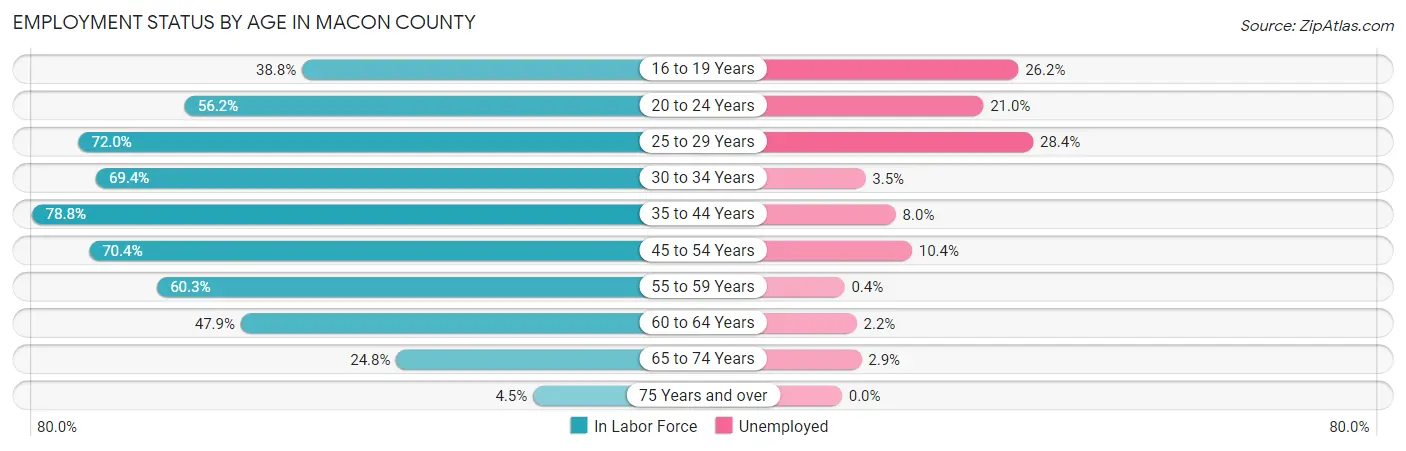
| Age Bracket | In Labor Force | Unemployed |
| 16 to 19 Years | 865 (38.8%) | 227 (26.2%) |
| 20 to 24 Years | 1,300 (56.2%) | 273 (21.0%) |
| 25 to 29 Years | 847 (72.0%) | 241 (28.4%) |
| 30 to 34 Years | 601 (69.4%) | 21 (3.5%) |
| 35 to 44 Years | 1,137 (78.8%) | 91 (8.0%) |
| 45 to 54 Years | 1,417 (70.4%) | 147 (10.4%) |
| 55 to 59 Years | 750 (60.3%) | 3 (0.4%) |
| 60 to 64 Years | 601 (47.9%) | 13 (2.2%) |
| 65 to 74 Years | 584 (24.8%) | 17 (2.9%) |
| 75 Years and over | 69 (4.5%) | 0 (0.0%) |
| Total | 8,179 (49.8%) | 1,022 (12.5%) |
Employment Status by Educational Attainment in Macon County
According to labor force statistics for Macon County, 67.0% of individuals (5,358) out of the total population between 25 and 64 years of age (7,997) are in the labor force, with 9.6% or 514 of them being unemployed. The group with the highest labor force participation rate are those with the educational attainment of bachelor's degree or higher, with 85.6% or 1,260 individuals in the labor force. Within the labor force, individuals with high school diploma education have the highest percentage of unemployment, with 21.0% or 347 of them being unemployed.
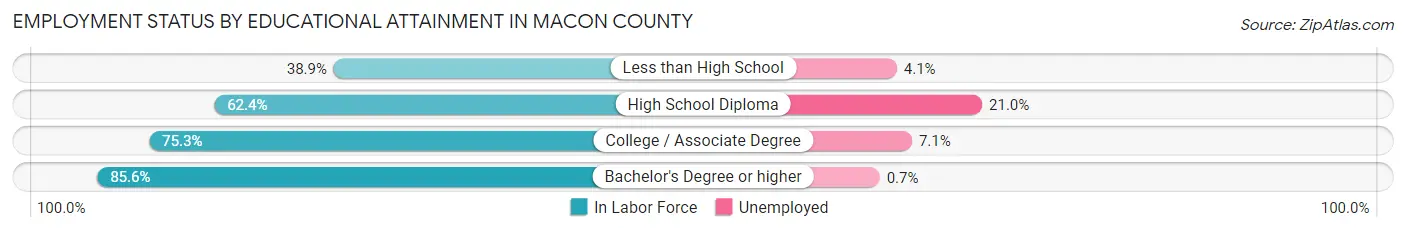
| Educational Attainment | In Labor Force | Unemployed |
| Less than High School | 509 (38.9%) | 54 (4.1%) |
| High School Diploma | 1,654 (62.4%) | 557 (21.0%) |
| College / Associate Degree | 1,932 (75.3%) | 182 (7.1%) |
| Bachelor's Degree or higher | 1,260 (85.6%) | 10 (0.7%) |
| Total | 5,358 (67.0%) | 768 (9.6%) |
Employment Occupations by Sex in Macon County
Management, Business, Science and Arts Occupations
The most common Management, Business, Science and Arts occupations in Macon County are Community & Social Service (857 | 12.1%), Management (494 | 7.0%), Education Instruction & Library (431 | 6.1%), Health Diagnosing & Treating (321 | 4.5%), and Business & Financial (303 | 4.3%).

Management, Business, Science and Arts Occupations by Sex
Within the Management, Business, Science and Arts occupations in Macon County, the most male-oriented occupations are Computers & Mathematics (100.0%), Architecture & Engineering (100.0%), and Computers, Engineering & Science (91.4%), while the most female-oriented occupations are Legal Services & Support (98.4%), Education Instruction & Library (90.7%), and Community & Social Service (88.2%).
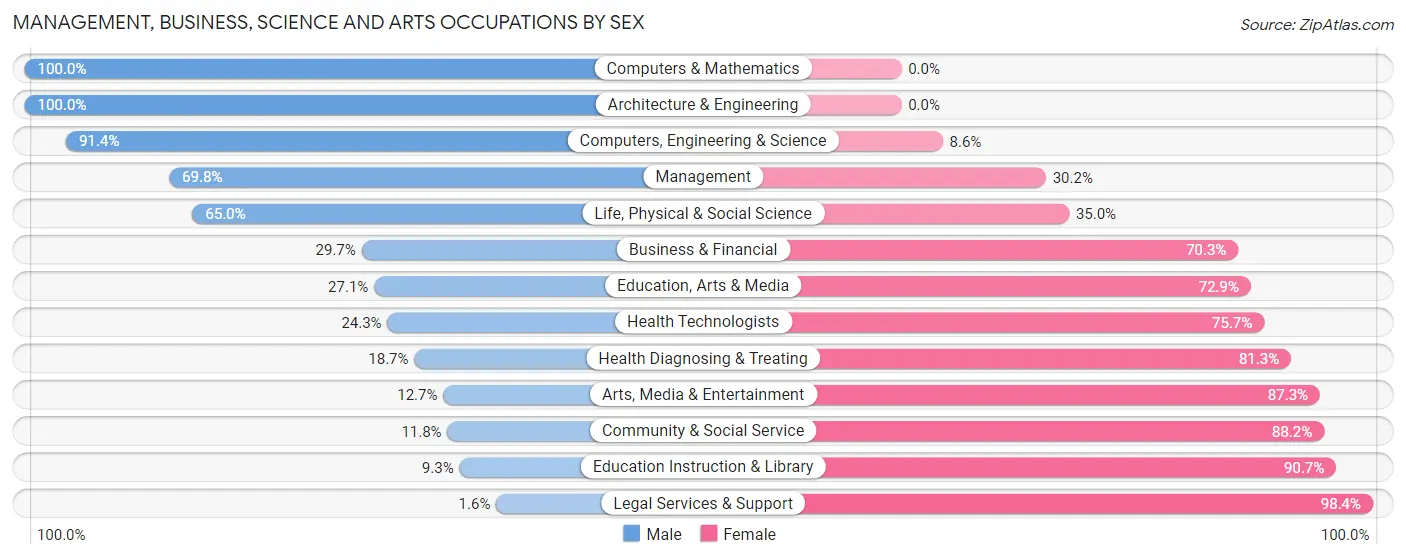
| Occupation | Male | Female |
| Management | 345 (69.8%) | 149 (30.2%) |
| Business & Financial | 90 (29.7%) | 213 (70.3%) |
| Computers, Engineering & Science | 148 (91.4%) | 14 (8.6%) |
| Computers & Mathematics | 84 (100.0%) | 0 (0.0%) |
| Architecture & Engineering | 38 (100.0%) | 0 (0.0%) |
| Life, Physical & Social Science | 26 (65.0%) | 14 (35.0%) |
| Community & Social Service | 101 (11.8%) | 756 (88.2%) |
| Education, Arts & Media | 39 (27.1%) | 105 (72.9%) |
| Legal Services & Support | 2 (1.6%) | 122 (98.4%) |
| Education Instruction & Library | 40 (9.3%) | 391 (90.7%) |
| Arts, Media & Entertainment | 20 (12.7%) | 138 (87.3%) |
| Health Diagnosing & Treating | 60 (18.7%) | 261 (81.3%) |
| Health Technologists | 44 (24.3%) | 137 (75.7%) |
| Total (Category) | 744 (34.8%) | 1,393 (65.2%) |
| Total (Overall) | 3,104 (43.9%) | 3,968 (56.1%) |
Services Occupations
The most common Services occupations in Macon County are Food Preparation & Serving (577 | 8.2%), Cleaning & Maintenance (434 | 6.1%), Personal Care & Service (361 | 5.1%), Healthcare Support (220 | 3.1%), and Security & Protection (175 | 2.5%).

Services Occupations by Sex
Within the Services occupations in Macon County, the most male-oriented occupations are Law Enforcement (100.0%), Cleaning & Maintenance (82.5%), and Security & Protection (68.0%), while the most female-oriented occupations are Personal Care & Service (93.3%), Healthcare Support (85.0%), and Food Preparation & Serving (76.6%).
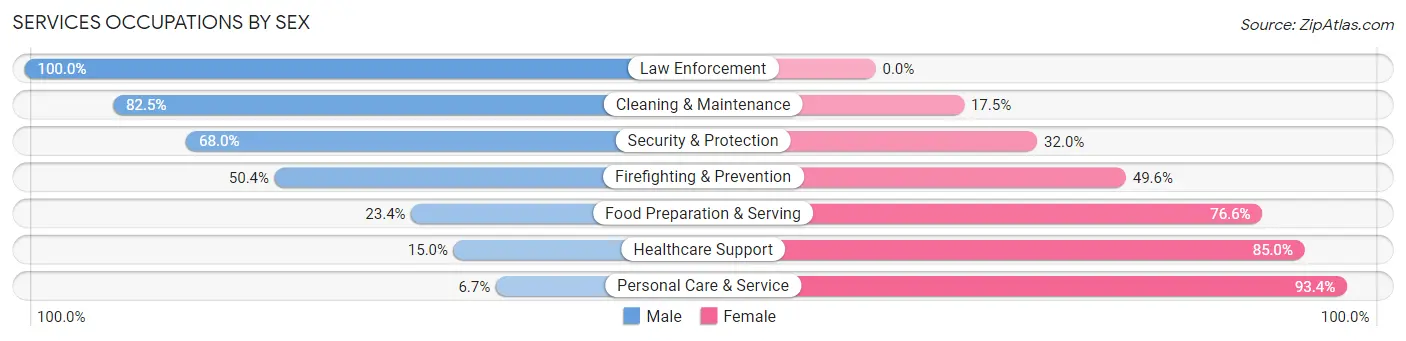
| Occupation | Male | Female |
| Healthcare Support | 33 (15.0%) | 187 (85.0%) |
| Security & Protection | 119 (68.0%) | 56 (32.0%) |
| Firefighting & Prevention | 57 (50.4%) | 56 (49.6%) |
| Law Enforcement | 62 (100.0%) | 0 (0.0%) |
| Food Preparation & Serving | 135 (23.4%) | 442 (76.6%) |
| Cleaning & Maintenance | 358 (82.5%) | 76 (17.5%) |
| Personal Care & Service | 24 (6.7%) | 337 (93.3%) |
| Total (Category) | 669 (37.9%) | 1,098 (62.1%) |
| Total (Overall) | 3,104 (43.9%) | 3,968 (56.1%) |
Sales and Office Occupations
The most common Sales and Office occupations in Macon County are Sales & Related (714 | 10.1%), and Office & Administration (598 | 8.5%).

Sales and Office Occupations by Sex
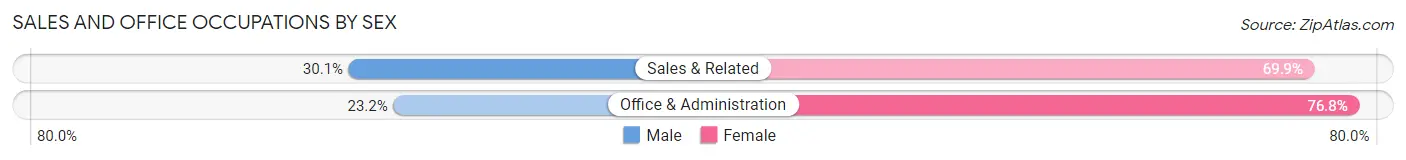
| Occupation | Male | Female |
| Sales & Related | 215 (30.1%) | 499 (69.9%) |
| Office & Administration | 139 (23.2%) | 459 (76.8%) |
| Total (Category) | 354 (27.0%) | 958 (73.0%) |
| Total (Overall) | 3,104 (43.9%) | 3,968 (56.1%) |
Natural Resources, Construction and Maintenance Occupations
The most common Natural Resources, Construction and Maintenance occupations in Macon County are Construction & Extraction (205 | 2.9%), Installation, Maintenance & Repair (108 | 1.5%), and Farming, Fishing & Forestry (84 | 1.2%).
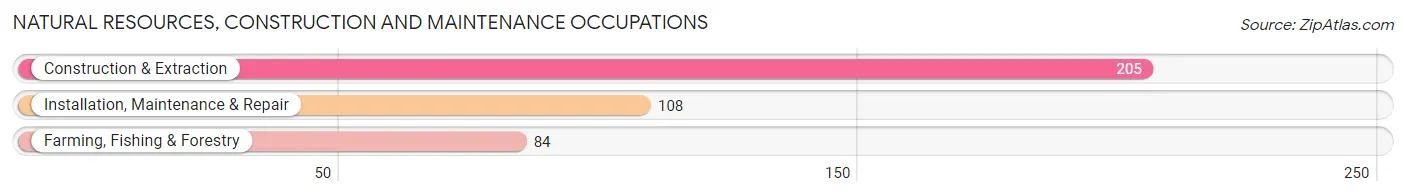
Natural Resources, Construction and Maintenance Occupations by Sex
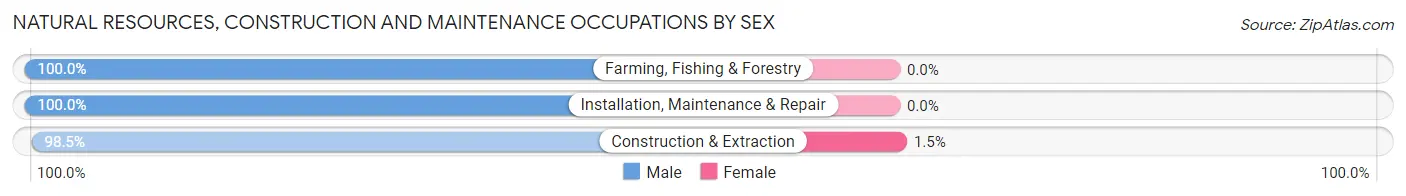
| Occupation | Male | Female |
| Farming, Fishing & Forestry | 84 (100.0%) | 0 (0.0%) |
| Construction & Extraction | 202 (98.5%) | 3 (1.5%) |
| Installation, Maintenance & Repair | 108 (100.0%) | 0 (0.0%) |
| Total (Category) | 394 (99.2%) | 3 (0.8%) |
| Total (Overall) | 3,104 (43.9%) | 3,968 (56.1%) |
Production, Transportation and Moving Occupations
The most common Production, Transportation and Moving occupations in Macon County are Production (698 | 9.9%), Transportation (398 | 5.6%), and Material Moving (363 | 5.1%).
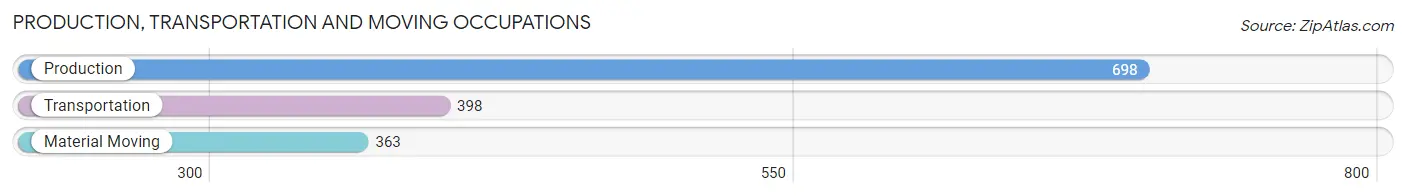
Production, Transportation and Moving Occupations by Sex

| Occupation | Male | Female |
| Production | 367 (52.6%) | 331 (47.4%) |
| Transportation | 300 (75.4%) | 98 (24.6%) |
| Material Moving | 276 (76.0%) | 87 (24.0%) |
| Total (Category) | 943 (64.6%) | 516 (35.4%) |
| Total (Overall) | 3,104 (43.9%) | 3,968 (56.1%) |
Employment Industries by Sex in Macon County
Employment Industries in Macon County
The major employment industries in Macon County include Educational Services (1,240 | 17.5%), Health Care & Social Assistance (836 | 11.8%), Accommodation & Food Services (836 | 11.8%), Manufacturing (797 | 11.3%), and Administrative & Support (610 | 8.6%).
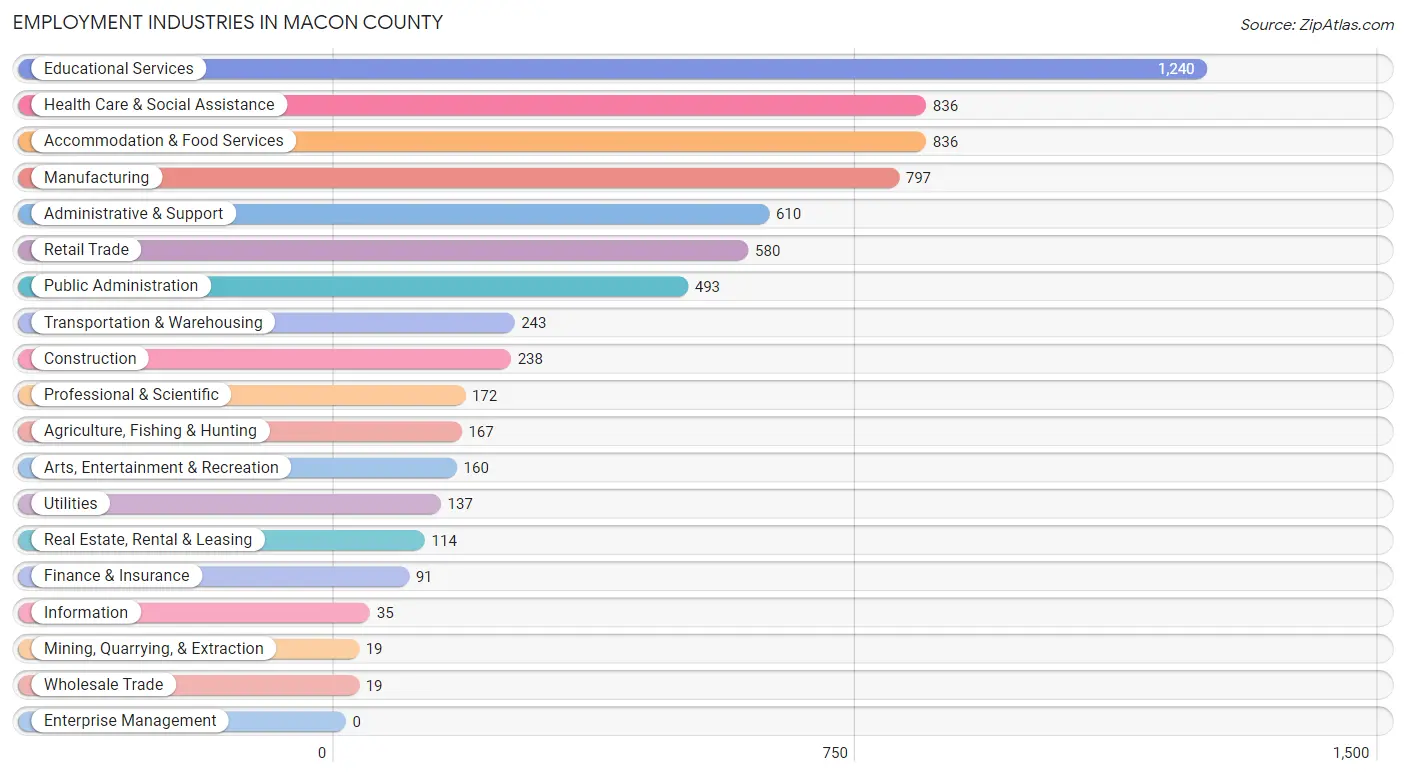
Employment Industries by Sex in Macon County
The Macon County industries that see more men than women are Wholesale Trade (100.0%), Construction (96.6%), and Agriculture, Fishing & Hunting (92.8%), whereas the industries that tend to have a higher number of women are Arts, Entertainment & Recreation (96.3%), Health Care & Social Assistance (78.2%), and Educational Services (74.7%).

| Industry | Male | Female |
| Agriculture, Fishing & Hunting | 155 (92.8%) | 12 (7.2%) |
| Mining, Quarrying, & Extraction | 17 (89.5%) | 2 (10.5%) |
| Construction | 230 (96.6%) | 8 (3.4%) |
| Manufacturing | 446 (56.0%) | 351 (44.0%) |
| Wholesale Trade | 19 (100.0%) | 0 (0.0%) |
| Retail Trade | 238 (41.0%) | 342 (59.0%) |
| Transportation & Warehousing | 201 (82.7%) | 42 (17.3%) |
| Utilities | 120 (87.6%) | 17 (12.4%) |
| Information | 20 (57.1%) | 15 (42.9%) |
| Finance & Insurance | 38 (41.8%) | 53 (58.2%) |
| Real Estate, Rental & Leasing | 77 (67.5%) | 37 (32.5%) |
| Professional & Scientific | 116 (67.4%) | 56 (32.6%) |
| Enterprise Management | 0 (0.0%) | 0 (0.0%) |
| Administrative & Support | 387 (63.4%) | 223 (36.6%) |
| Educational Services | 314 (25.3%) | 926 (74.7%) |
| Health Care & Social Assistance | 182 (21.8%) | 654 (78.2%) |
| Arts, Entertainment & Recreation | 6 (3.7%) | 154 (96.3%) |
| Accommodation & Food Services | 252 (30.1%) | 584 (69.9%) |
| Public Administration | 143 (29.0%) | 350 (71.0%) |
| Total | 3,104 (43.9%) | 3,968 (56.1%) |
Education in Macon County
School Enrollment in Macon County
The most common levels of schooling among the 5,532 students in Macon County are college / undergraduate (3,131 | 56.6%), high school (782 | 14.1%), and middle school (678 | 12.3%).
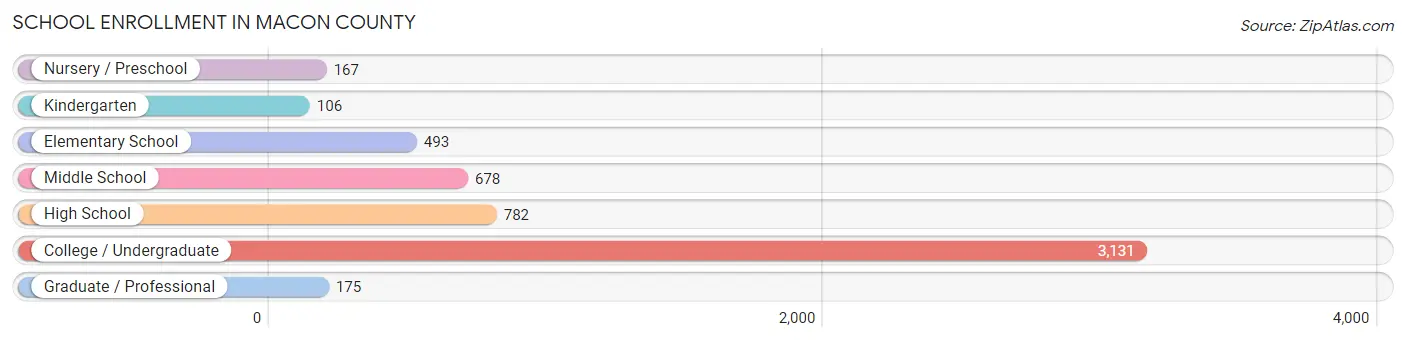
| School Level | # Students | % Students |
| Nursery / Preschool | 167 | 3.0% |
| Kindergarten | 106 | 1.9% |
| Elementary School | 493 | 8.9% |
| Middle School | 678 | 12.3% |
| High School | 782 | 14.1% |
| College / Undergraduate | 3,131 | 56.6% |
| Graduate / Professional | 175 | 3.2% |
| Total | 5,532 | 100.0% |
School Enrollment by Age by Funding Source in Macon County
Out of a total of 5,532 students who are enrolled in schools in Macon County, 2,141 (38.7%) attend a private institution, while the remaining 3,391 (61.3%) are enrolled in public schools. The age group of 20 to 24 year olds has the highest likelihood of being enrolled in private schools, with 1,035 (68.2% in the age bracket) enrolled. Conversely, the age group of 15 to 17 year olds has the lowest likelihood of being enrolled in a private school, with 504 (94.9% in the age bracket) attending a public institution.
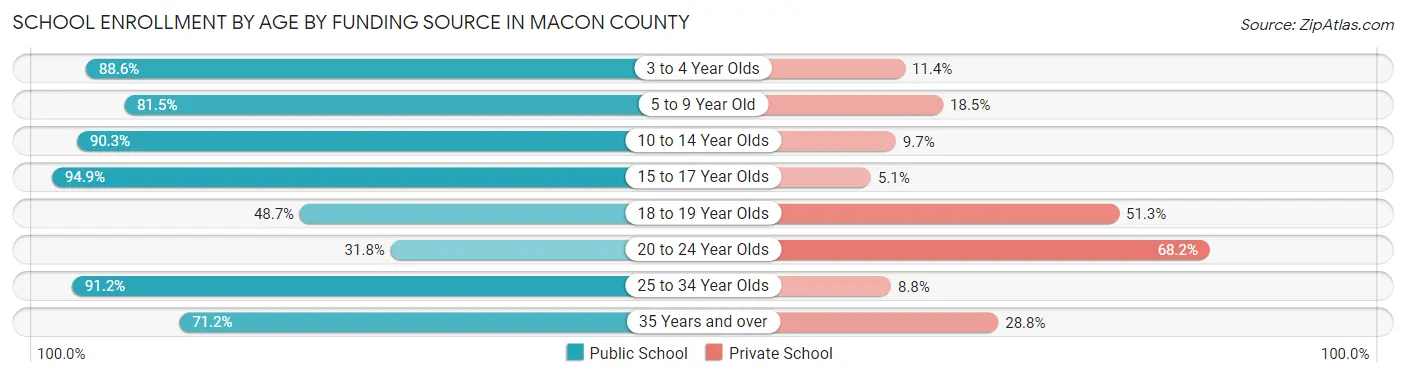
| Age Bracket | Public School | Private School |
| 3 to 4 Year Olds | 124 (88.6%) | 16 (11.4%) |
| 5 to 9 Year Old | 484 (81.5%) | 110 (18.5%) |
| 10 to 14 Year Olds | 714 (90.3%) | 77 (9.7%) |
| 15 to 17 Year Olds | 504 (94.9%) | 27 (5.1%) |
| 18 to 19 Year Olds | 777 (48.7%) | 818 (51.3%) |
| 20 to 24 Year Olds | 483 (31.8%) | 1,035 (68.2%) |
| 25 to 34 Year Olds | 217 (91.2%) | 21 (8.8%) |
| 35 Years and over | 89 (71.2%) | 36 (28.8%) |
| Total | 3,391 (61.3%) | 2,141 (38.7%) |
Educational Attainment by Field of Study in Macon County
Business (532 | 18.5%), arts & humanities (426 | 14.8%), social sciences (314 | 10.9%), education (297 | 10.3%), and bio, nature & agricultural (242 | 8.4%) are the most common fields of study among 2,871 individuals in Macon County who have obtained a bachelor's degree or higher.
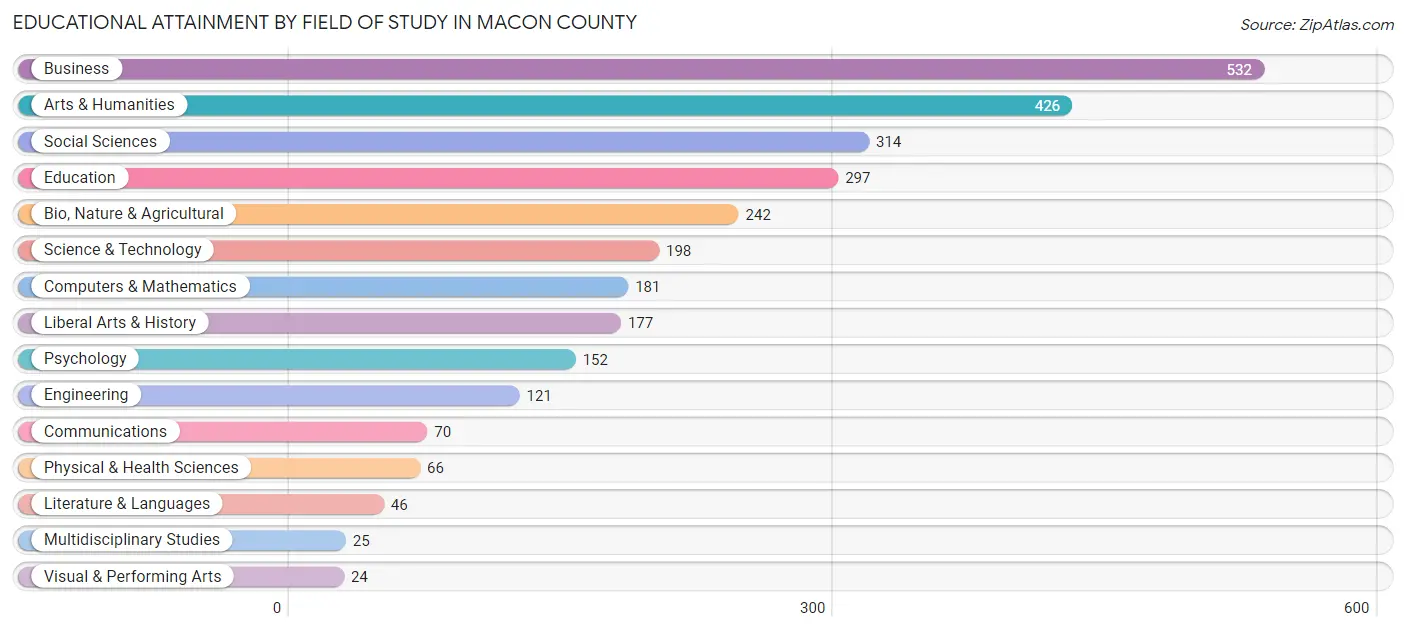
| Field of Study | # Graduates | % Graduates |
| Computers & Mathematics | 181 | 6.3% |
| Bio, Nature & Agricultural | 242 | 8.4% |
| Physical & Health Sciences | 66 | 2.3% |
| Psychology | 152 | 5.3% |
| Social Sciences | 314 | 10.9% |
| Engineering | 121 | 4.2% |
| Multidisciplinary Studies | 25 | 0.9% |
| Science & Technology | 198 | 6.9% |
| Business | 532 | 18.5% |
| Education | 297 | 10.3% |
| Literature & Languages | 46 | 1.6% |
| Liberal Arts & History | 177 | 6.2% |
| Visual & Performing Arts | 24 | 0.8% |
| Communications | 70 | 2.4% |
| Arts & Humanities | 426 | 14.8% |
| Total | 2,871 | 100.0% |
Transportation & Commute in Macon County
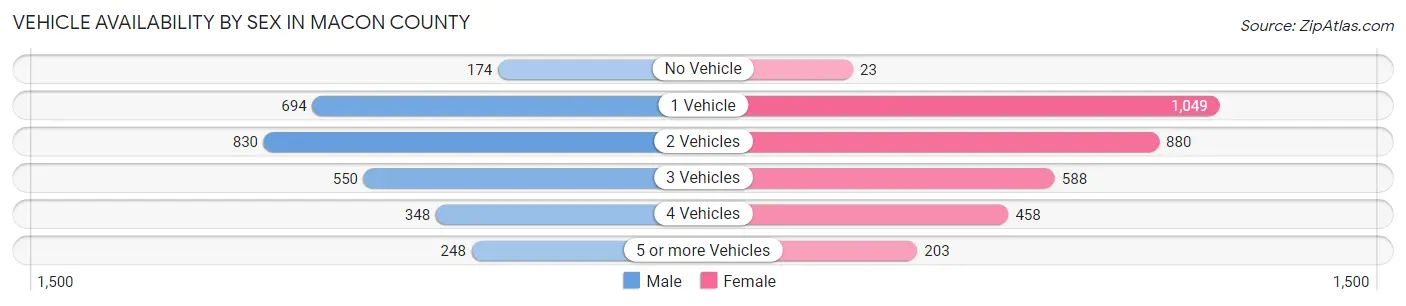
Vehicle Availability by Sex in Macon County
The most prevalent vehicle ownership categories in Macon County are males with 2 vehicles (830, accounting for 29.2%) and females with 2 vehicles (880, making up 25.9%).
| Vehicles Available | Male | Female |
| No Vehicle | 174 (6.1%) | 23 (0.7%) |
| 1 Vehicle | 694 (24.4%) | 1,049 (32.8%) |
| 2 Vehicles | 830 (29.2%) | 880 (27.5%) |
| 3 Vehicles | 550 (19.3%) | 588 (18.4%) |
| 4 Vehicles | 348 (12.2%) | 458 (14.3%) |
| 5 or more Vehicles | 248 (8.7%) | 203 (6.3%) |
| Total | 2,844 (100.0%) | 3,201 (100.0%) |
Commute Time in Macon County
The most frequently occuring commute durations in Macon County are 20 to 24 minutes (1,225 commuters, 19.0%), 30 to 34 minutes (988 commuters, 15.3%), and 10 to 14 minutes (978 commuters, 15.2%).

| Commute Time | # Commuters | % Commuters |
| Less than 5 Minutes | 249 | 3.9% |
| 5 to 9 Minutes | 886 | 13.8% |
| 10 to 14 Minutes | 978 | 15.2% |
| 15 to 19 Minutes | 676 | 10.5% |
| 20 to 24 Minutes | 1,225 | 19.0% |
| 25 to 29 Minutes | 313 | 4.9% |
| 30 to 34 Minutes | 988 | 15.3% |
| 35 to 39 Minutes | 138 | 2.1% |
| 40 to 44 Minutes | 187 | 2.9% |
| 45 to 59 Minutes | 445 | 6.9% |
| 60 to 89 Minutes | 247 | 3.8% |
| 90 or more Minutes | 112 | 1.7% |
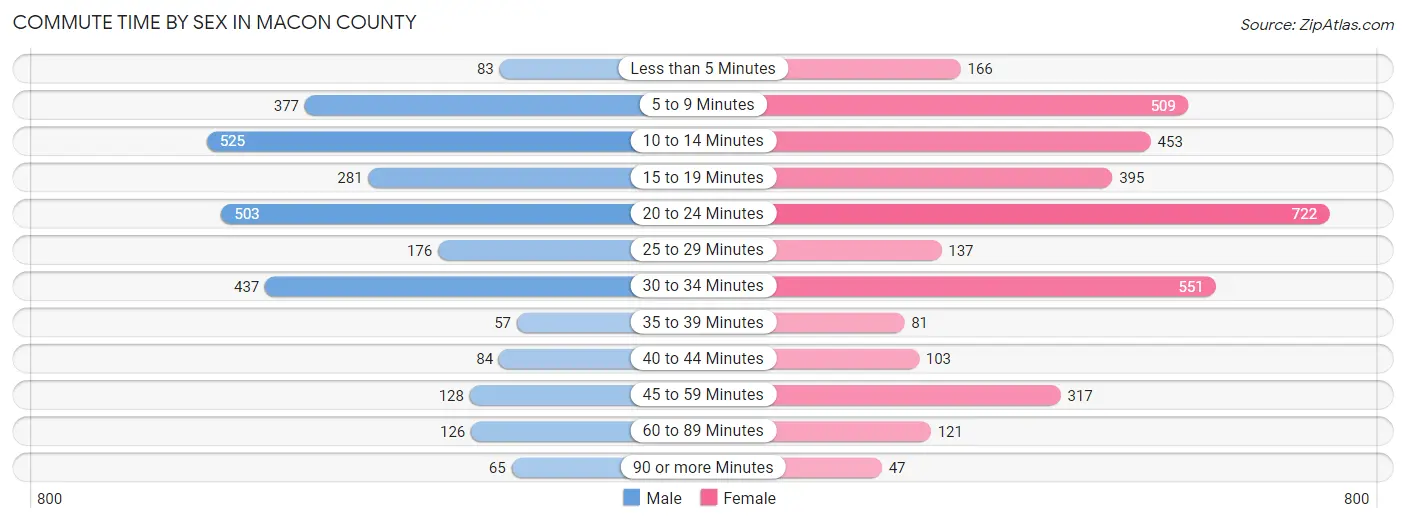
Commute Time by Sex in Macon County
The most common commute times in Macon County are 10 to 14 minutes (525 commuters, 18.5%) for males and 20 to 24 minutes (722 commuters, 20.0%) for females.
| Commute Time | Male | Female |
| Less than 5 Minutes | 83 (2.9%) | 166 (4.6%) |
| 5 to 9 Minutes | 377 (13.3%) | 509 (14.1%) |
| 10 to 14 Minutes | 525 (18.5%) | 453 (12.6%) |
| 15 to 19 Minutes | 281 (9.9%) | 395 (11.0%) |
| 20 to 24 Minutes | 503 (17.7%) | 722 (20.0%) |
| 25 to 29 Minutes | 176 (6.2%) | 137 (3.8%) |
| 30 to 34 Minutes | 437 (15.4%) | 551 (15.3%) |
| 35 to 39 Minutes | 57 (2.0%) | 81 (2.2%) |
| 40 to 44 Minutes | 84 (3.0%) | 103 (2.9%) |
| 45 to 59 Minutes | 128 (4.5%) | 317 (8.8%) |
| 60 to 89 Minutes | 126 (4.4%) | 121 (3.4%) |
| 90 or more Minutes | 65 (2.3%) | 47 (1.3%) |
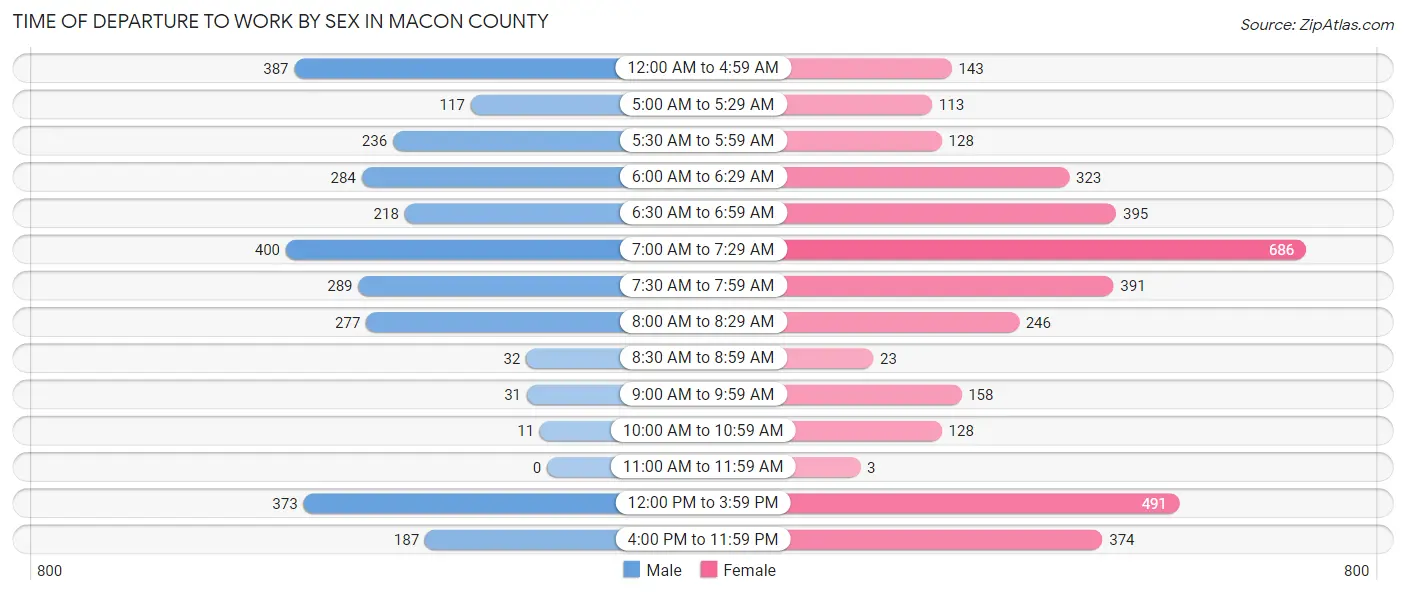
Time of Departure to Work by Sex in Macon County
The most frequent times of departure to work in Macon County are 7:00 AM to 7:29 AM (400, 14.1%) for males and 7:00 AM to 7:29 AM (686, 19.0%) for females.
| Time of Departure | Male | Female |
| 12:00 AM to 4:59 AM | 387 (13.6%) | 143 (4.0%) |
| 5:00 AM to 5:29 AM | 117 (4.1%) | 113 (3.1%) |
| 5:30 AM to 5:59 AM | 236 (8.3%) | 128 (3.5%) |
| 6:00 AM to 6:29 AM | 284 (10.0%) | 323 (9.0%) |
| 6:30 AM to 6:59 AM | 218 (7.7%) | 395 (11.0%) |
| 7:00 AM to 7:29 AM | 400 (14.1%) | 686 (19.0%) |
| 7:30 AM to 7:59 AM | 289 (10.2%) | 391 (10.9%) |
| 8:00 AM to 8:29 AM | 277 (9.8%) | 246 (6.8%) |
| 8:30 AM to 8:59 AM | 32 (1.1%) | 23 (0.6%) |
| 9:00 AM to 9:59 AM | 31 (1.1%) | 158 (4.4%) |
| 10:00 AM to 10:59 AM | 11 (0.4%) | 128 (3.5%) |
| 11:00 AM to 11:59 AM | 0 (0.0%) | 3 (0.1%) |
| 12:00 PM to 3:59 PM | 373 (13.1%) | 491 (13.6%) |
| 4:00 PM to 11:59 PM | 187 (6.6%) | 374 (10.4%) |
| Total | 2,842 (100.0%) | 3,602 (100.0%) |
Housing Occupancy in Macon County
Occupancy by Ownership in Macon County
Of the total 7,131 dwellings in Macon County, owner-occupied units account for 4,489 (62.9%), while renter-occupied units make up 2,642 (37.0%).

| Occupancy | # Housing Units | % Housing Units |
| Owner Occupied Housing Units | 4,489 | 62.9% |
| Renter-Occupied Housing Units | 2,642 | 37.0% |
| Total Occupied Housing Units | 7,131 | 100.0% |
Occupancy by Household Size in Macon County
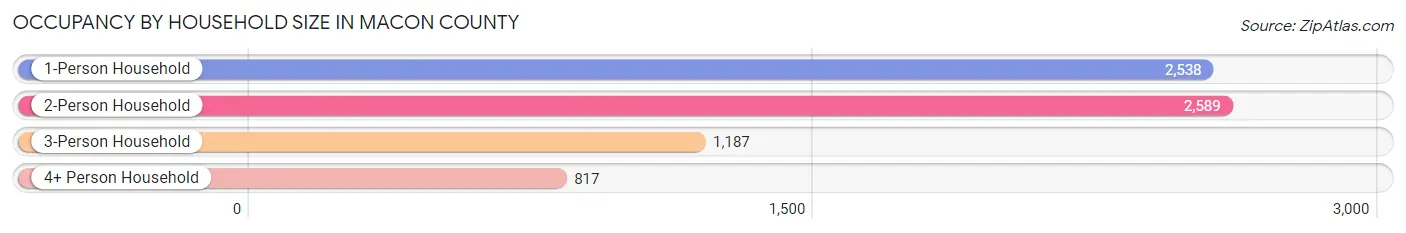
| Household Size | # Housing Units | % Housing Units |
| 1-Person Household | 2,538 | 35.6% |
| 2-Person Household | 2,589 | 36.3% |
| 3-Person Household | 1,187 | 16.7% |
| 4+ Person Household | 817 | 11.5% |
| Total Housing Units | 7,131 | 100.0% |
Occupancy by Ownership by Household Size in Macon County

| Household Size | Owner-occupied | Renter-occupied |
| 1-Person Household | 1,404 (55.3%) | 1,134 (44.7%) |
| 2-Person Household | 1,882 (72.7%) | 707 (27.3%) |
| 3-Person Household | 636 (53.6%) | 551 (46.4%) |
| 4+ Person Household | 567 (69.4%) | 250 (30.6%) |
| Total Housing Units | 4,489 (62.9%) | 2,642 (37.0%) |
Occupancy by Educational Attainment in Macon County

| Household Size | Owner-occupied | Renter-occupied |
| Less than High School | 587 (57.4%) | 435 (42.6%) |
| High School Diploma | 1,240 (63.0%) | 729 (37.0%) |
| College/Associate Degree | 1,428 (57.7%) | 1,049 (42.3%) |
| Bachelor's Degree or higher | 1,234 (74.2%) | 429 (25.8%) |
Occupancy by Age of Householder in Macon County

| Age Bracket | # Households | % Households |
| Under 35 Years | 1,213 | 17.0% |
| 35 to 44 Years | 708 | 9.9% |
| 45 to 54 Years | 1,113 | 15.6% |
| 55 to 64 Years | 1,563 | 21.9% |
| 65 to 74 Years | 1,464 | 20.5% |
| 75 to 84 Years | 796 | 11.2% |
| 85 Years and Over | 274 | 3.8% |
| Total | 7,131 | 100.0% |
Housing Finances in Macon County
Median Income by Occupancy in Macon County
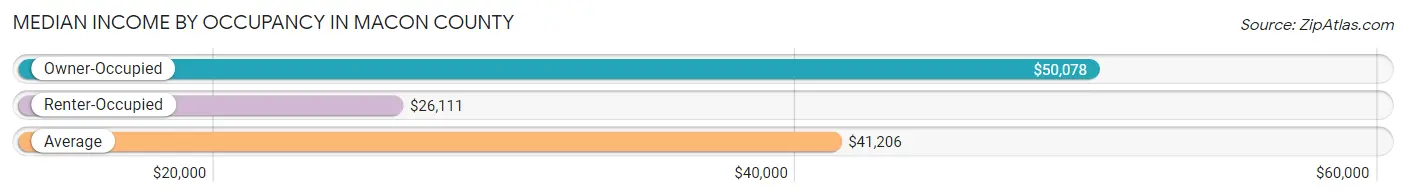
| Occupancy Type | # Households | Median Income |
| Owner-Occupied | 4,489 (62.9%) | $50,078 |
| Renter-Occupied | 2,642 (37.0%) | $26,111 |
| Average | 7,131 (100.0%) | $41,206 |
Occupancy by Householder Income Bracket in Macon County

| Income Bracket | Owner-occupied | Renter-occupied |
| Less than $5,000 | 183 (4.1%) | 361 (13.7%) |
| $5,000 to $9,999 | 140 (3.1%) | 184 (7.0%) |
| $10,000 to $14,999 | 173 (3.8%) | 314 (11.9%) |
| $15,000 to $19,999 | 311 (6.9%) | 268 (10.1%) |
| $20,000 to $24,999 | 240 (5.3%) | 138 (5.2%) |
| $25,000 to $34,999 | 481 (10.7%) | 327 (12.4%) |
| $35,000 to $49,999 | 714 (15.9%) | 286 (10.8%) |
| $50,000 to $74,999 | 705 (15.7%) | 424 (16.1%) |
| $75,000 to $99,999 | 575 (12.8%) | 215 (8.1%) |
| $100,000 to $149,999 | 575 (12.8%) | 107 (4.1%) |
| $150,000 or more | 392 (8.7%) | 18 (0.7%) |
| Total | 4,489 (100.0%) | 2,642 (100.0%) |
Monthly Housing Cost Tiers in Macon County

| Monthly Cost | Owner-occupied | Renter-occupied |
| Less than $300 | 615 (13.7%) | 195 (7.4%) |
| $300 to $499 | 1,259 (28.1%) | 253 (9.6%) |
| $500 to $799 | 956 (21.3%) | 824 (31.2%) |
| $800 to $999 | 592 (13.2%) | 314 (11.9%) |
| $1,000 to $1,499 | 594 (13.2%) | 270 (10.2%) |
| $1,500 to $1,999 | 274 (6.1%) | 74 (2.8%) |
| $2,000 to $2,499 | 70 (1.6%) | 6 (0.2%) |
| $2,500 to $2,999 | 96 (2.1%) | 0 (0.0%) |
| $3,000 or more | 33 (0.7%) | 0 (0.0%) |
| Total | 4,489 (100.0%) | 2,642 (100.0%) |
Physical Housing Characteristics in Macon County
Housing Structures in Macon County

| Structure Type | # Housing Units | % Housing Units |
| Single Unit, Detached | 4,482 | 62.8% |
| Single Unit, Attached | 35 | 0.5% |
| 2 Unit Apartments | 160 | 2.2% |
| 3 or 4 Unit Apartments | 308 | 4.3% |
| 5 to 9 Unit Apartments | 447 | 6.3% |
| 10 or more Apartments | 273 | 3.8% |
| Mobile Home / Other | 1,426 | 20.0% |
| Total | 7,131 | 100.0% |
Housing Structures by Occupancy in Macon County

| Structure Type | Owner-occupied | Renter-occupied |
| Single Unit, Detached | 3,362 (75.0%) | 1,120 (25.0%) |
| Single Unit, Attached | 14 (40.0%) | 21 (60.0%) |
| 2 Unit Apartments | 0 (0.0%) | 160 (100.0%) |
| 3 or 4 Unit Apartments | 0 (0.0%) | 308 (100.0%) |
| 5 to 9 Unit Apartments | 3 (0.7%) | 444 (99.3%) |
| 10 or more Apartments | 0 (0.0%) | 273 (100.0%) |
| Mobile Home / Other | 1,110 (77.8%) | 316 (22.2%) |
| Total | 4,489 (62.9%) | 2,642 (37.0%) |
Housing Structures by Number of Rooms in Macon County

| Number of Rooms | Owner-occupied | Renter-occupied |
| 1 Room | 9 (0.2%) | 38 (1.4%) |
| 2 or 3 Rooms | 39 (0.9%) | 360 (13.6%) |
| 4 or 5 Rooms | 919 (20.5%) | 1,090 (41.3%) |
| 6 or 7 Rooms | 2,320 (51.7%) | 863 (32.7%) |
| 8 or more Rooms | 1,202 (26.8%) | 291 (11.0%) |
| Total | 4,489 (100.0%) | 2,642 (100.0%) |
Housing Structure by Heating Type in Macon County
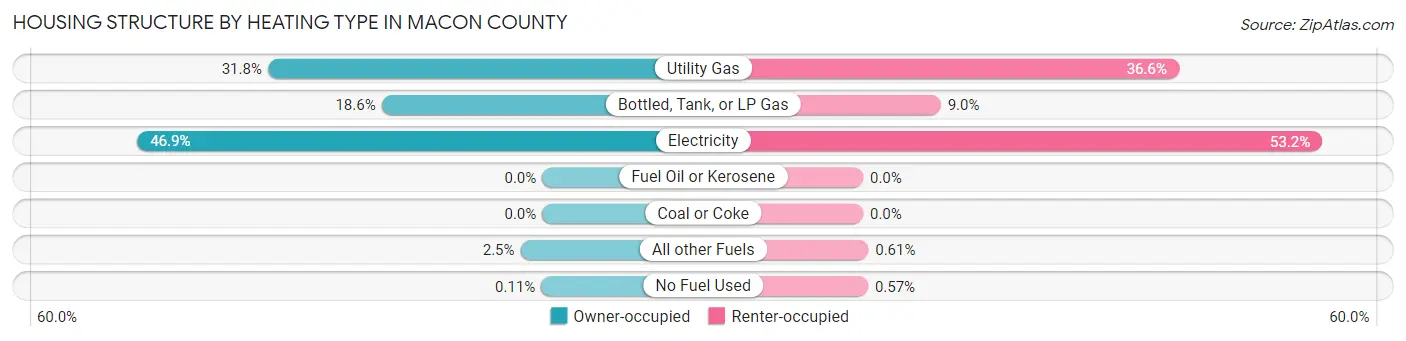
| Heating Type | Owner-occupied | Renter-occupied |
| Utility Gas | 1,428 (31.8%) | 967 (36.6%) |
| Bottled, Tank, or LP Gas | 836 (18.6%) | 238 (9.0%) |
| Electricity | 2,107 (46.9%) | 1,406 (53.2%) |
| Fuel Oil or Kerosene | 0 (0.0%) | 0 (0.0%) |
| Coal or Coke | 0 (0.0%) | 0 (0.0%) |
| All other Fuels | 113 (2.5%) | 16 (0.6%) |
| No Fuel Used | 5 (0.1%) | 15 (0.6%) |
| Total | 4,489 (100.0%) | 2,642 (100.0%) |
Household Vehicle Usage in Macon County

| Vehicles per Household | Owner-occupied | Renter-occupied |
| No Vehicle | 217 (4.8%) | 552 (20.9%) |
| 1 Vehicle | 1,397 (31.1%) | 1,244 (47.1%) |
| 2 Vehicles | 1,367 (30.4%) | 605 (22.9%) |
| 3 or more Vehicles | 1,508 (33.6%) | 241 (9.1%) |
| Total | 4,489 (100.0%) | 2,642 (100.0%) |
Real Estate & Mortgages in Macon County
Real Estate and Mortgage Overview in Macon County
| Characteristic | Without Mortgage | With Mortgage |
| Housing Units | 2,693 | 1,796 |
| Median Property Value | $91,800 | $97,300 |
| Median Household Income | $42,680 | $272 |
| Monthly Housing Costs | $432 | $33 |
| Real Estate Taxes | $388 | $546 |
Property Value by Mortgage Status in Macon County

| Property Value | Without Mortgage | With Mortgage |
| Less than $50,000 | 657 (24.4%) | 336 (18.7%) |
| $50,000 to $99,999 | 965 (35.8%) | 616 (34.3%) |
| $100,000 to $299,999 | 928 (34.5%) | 639 (35.6%) |
| $300,000 to $499,999 | 90 (3.3%) | 147 (8.2%) |
| $500,000 to $749,999 | 24 (0.9%) | 37 (2.1%) |
| $750,000 to $999,999 | 13 (0.5%) | 0 (0.0%) |
| $1,000,000 or more | 16 (0.6%) | 21 (1.2%) |
| Total | 2,693 (100.0%) | 1,796 (100.0%) |
Household Income by Mortgage Status in Macon County
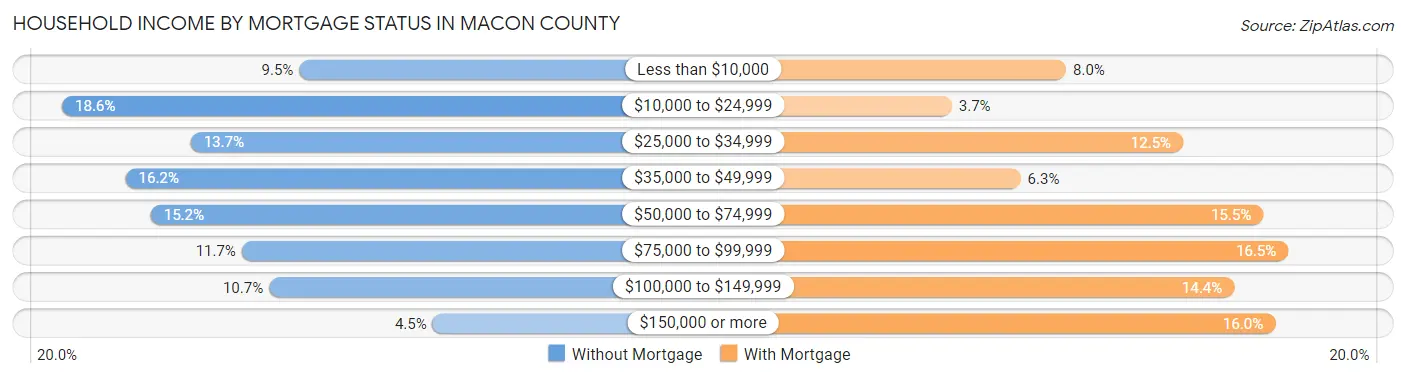
| Household Income | Without Mortgage | With Mortgage |
| Less than $10,000 | 257 (9.5%) | 144 (8.0%) |
| $10,000 to $24,999 | 500 (18.6%) | 66 (3.7%) |
| $25,000 to $34,999 | 368 (13.7%) | 224 (12.5%) |
| $35,000 to $49,999 | 435 (16.2%) | 113 (6.3%) |
| $50,000 to $74,999 | 409 (15.2%) | 279 (15.5%) |
| $75,000 to $99,999 | 316 (11.7%) | 296 (16.5%) |
| $100,000 to $149,999 | 288 (10.7%) | 259 (14.4%) |
| $150,000 or more | 120 (4.5%) | 287 (16.0%) |
| Total | 2,693 (100.0%) | 1,796 (100.0%) |
Property Value to Household Income Ratio in Macon County
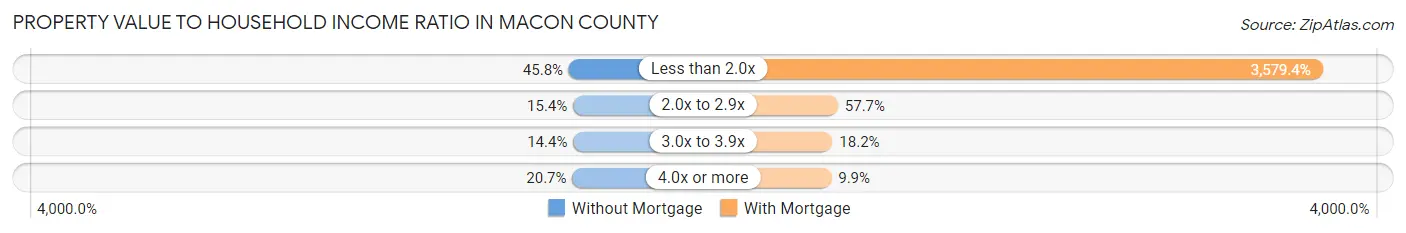
| Value-to-Income Ratio | Without Mortgage | With Mortgage |
| Less than 2.0x | 1,233 (45.8%) | 64,286 (3,579.4%) |
| 2.0x to 2.9x | 414 (15.4%) | 1,037 (57.7%) |
| 3.0x to 3.9x | 389 (14.4%) | 326 (18.1%) |
| 4.0x or more | 556 (20.6%) | 178 (9.9%) |
| Total | 2,693 (100.0%) | 1,796 (100.0%) |
Real Estate Taxes by Mortgage Status in Macon County
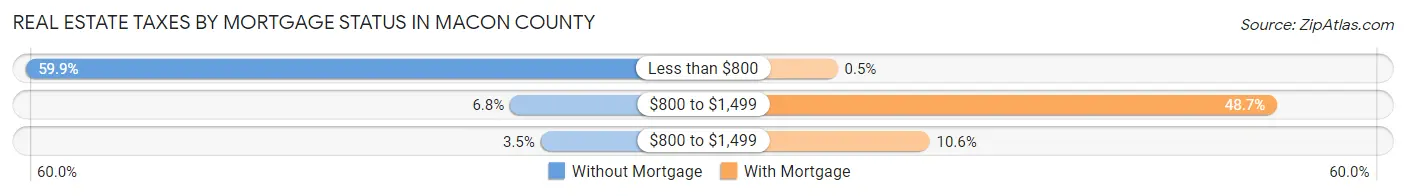
| Property Taxes | Without Mortgage | With Mortgage |
| Less than $800 | 1,614 (59.9%) | 9 (0.5%) |
| $800 to $1,499 | 183 (6.8%) | 874 (48.7%) |
| $800 to $1,499 | 93 (3.5%) | 190 (10.6%) |
| Total | 2,693 (100.0%) | 1,796 (100.0%) |
Health & Disability in Macon County
Health Insurance Coverage by Age in Macon County
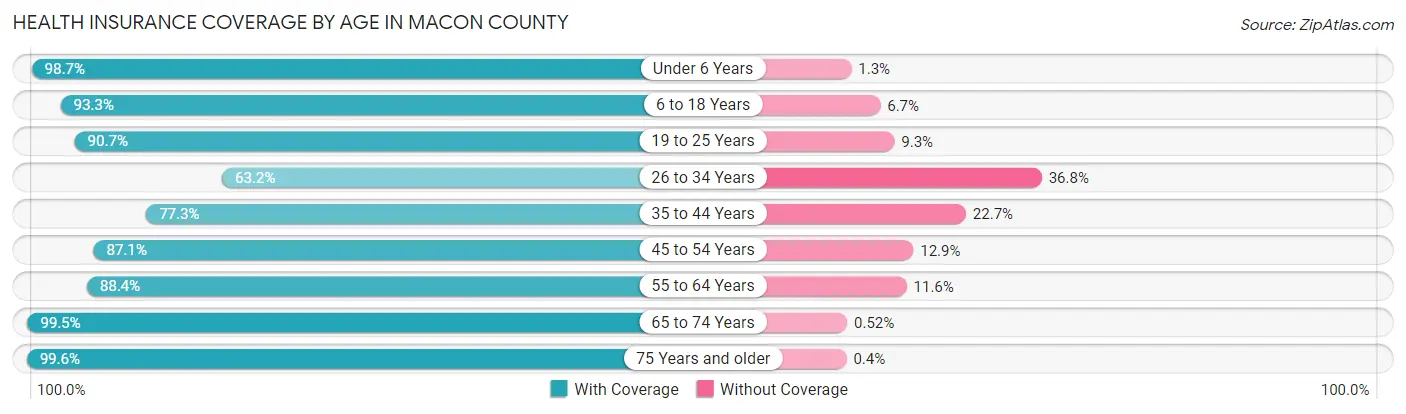
| Age Bracket | With Coverage | Without Coverage |
| Under 6 Years | 980 (98.7%) | 13 (1.3%) |
| 6 to 18 Years | 2,755 (93.3%) | 198 (6.7%) |
| 19 to 25 Years | 3,058 (90.7%) | 315 (9.3%) |
| 26 to 34 Years | 1,189 (63.2%) | 693 (36.8%) |
| 35 to 44 Years | 1,108 (77.3%) | 325 (22.7%) |
| 45 to 54 Years | 1,754 (87.1%) | 259 (12.9%) |
| 55 to 64 Years | 2,190 (88.4%) | 288 (11.6%) |
| 65 to 74 Years | 2,313 (99.5%) | 12 (0.5%) |
| 75 Years and older | 1,490 (99.6%) | 6 (0.4%) |
| Total | 16,837 (88.9%) | 2,109 (11.1%) |
Health Insurance Coverage by Citizenship Status in Macon County
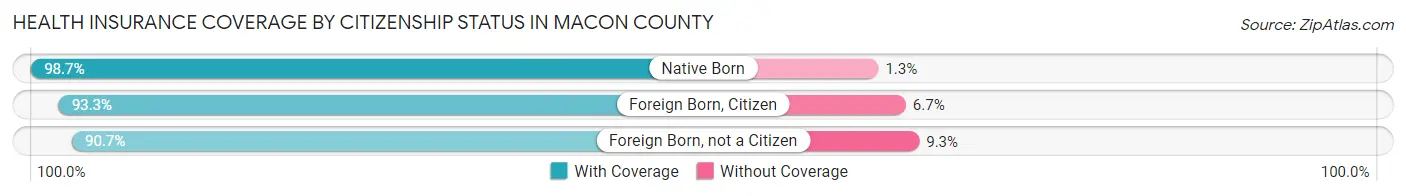
| Citizenship Status | With Coverage | Without Coverage |
| Native Born | 980 (98.7%) | 13 (1.3%) |
| Foreign Born, Citizen | 2,755 (93.3%) | 198 (6.7%) |
| Foreign Born, not a Citizen | 3,058 (90.7%) | 315 (9.3%) |
Health Insurance Coverage by Household Income in Macon County

| Household Income | With Coverage | Without Coverage |
| Under $25,000 | 3,803 (89.6%) | 442 (10.4%) |
| $25,000 to $49,999 | 3,043 (80.9%) | 716 (19.1%) |
| $50,000 to $74,999 | 2,473 (87.7%) | 346 (12.3%) |
| $75,000 to $99,999 | 1,908 (83.1%) | 389 (16.9%) |
| $100,000 and over | 3,288 (95.1%) | 170 (4.9%) |
Public vs Private Health Insurance Coverage by Age in Macon County
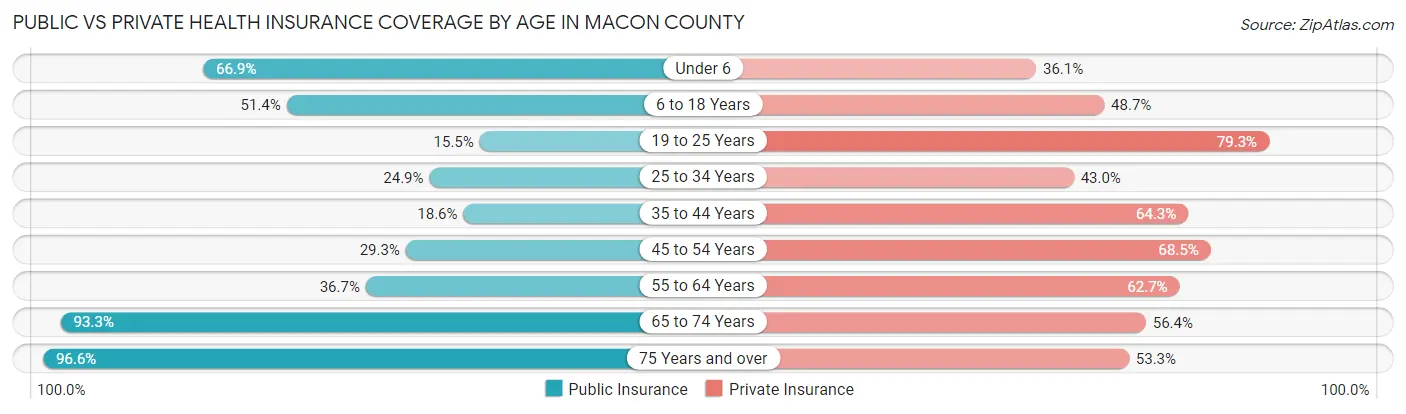
| Age Bracket | Public Insurance | Private Insurance |
| Under 6 | 664 (66.9%) | 358 (36.0%) |
| 6 to 18 Years | 1,517 (51.4%) | 1,438 (48.7%) |
| 19 to 25 Years | 524 (15.5%) | 2,674 (79.3%) |
| 25 to 34 Years | 468 (24.9%) | 810 (43.0%) |
| 35 to 44 Years | 266 (18.6%) | 921 (64.3%) |
| 45 to 54 Years | 589 (29.3%) | 1,378 (68.5%) |
| 55 to 64 Years | 909 (36.7%) | 1,553 (62.7%) |
| 65 to 74 Years | 2,170 (93.3%) | 1,312 (56.4%) |
| 75 Years and over | 1,445 (96.6%) | 797 (53.3%) |
| Total | 8,552 (45.1%) | 11,241 (59.3%) |
Disability Status by Sex by Age in Macon County
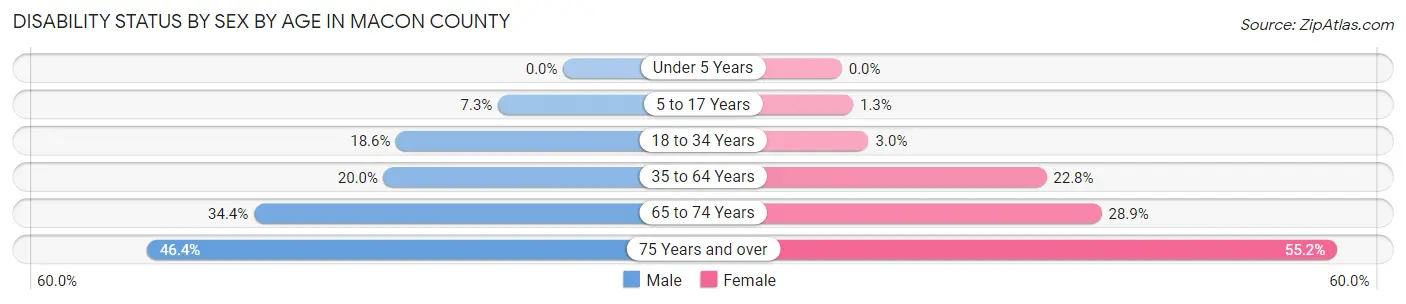
| Age Bracket | Male | Female |
| Under 5 Years | 0 (0.0%) | 0 (0.0%) |
| 5 to 17 Years | 83 (7.3%) | 14 (1.3%) |
| 18 to 34 Years | 510 (18.6%) | 99 (3.0%) |
| 35 to 64 Years | 548 (20.0%) | 725 (22.8%) |
| 65 to 74 Years | 352 (34.4%) | 377 (28.9%) |
| 75 Years and over | 249 (46.4%) | 529 (55.2%) |
Disability Class by Sex by Age in Macon County
Disability Class: Hearing Difficulty
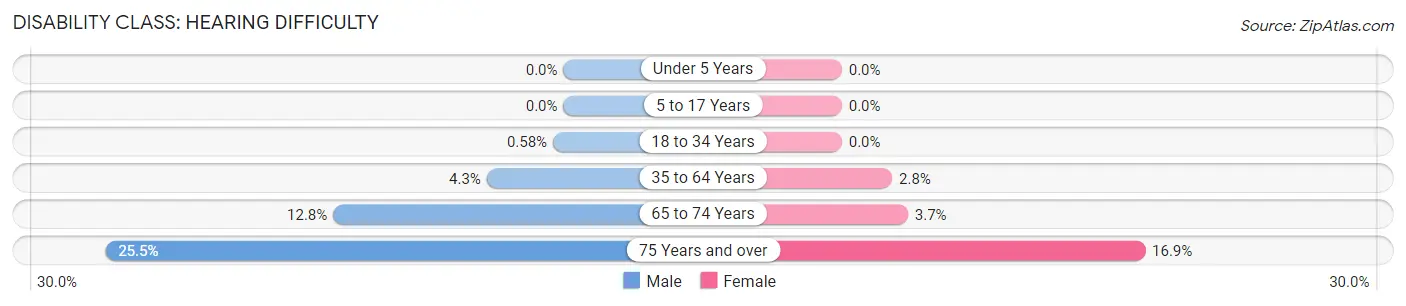
| Age Bracket | Male | Female |
| Under 5 Years | 0 (0.0%) | 0 (0.0%) |
| 5 to 17 Years | 0 (0.0%) | 0 (0.0%) |
| 18 to 34 Years | 16 (0.6%) | 0 (0.0%) |
| 35 to 64 Years | 117 (4.3%) | 89 (2.8%) |
| 65 to 74 Years | 131 (12.8%) | 48 (3.7%) |
| 75 Years and over | 137 (25.5%) | 162 (16.9%) |
Disability Class: Vision Difficulty
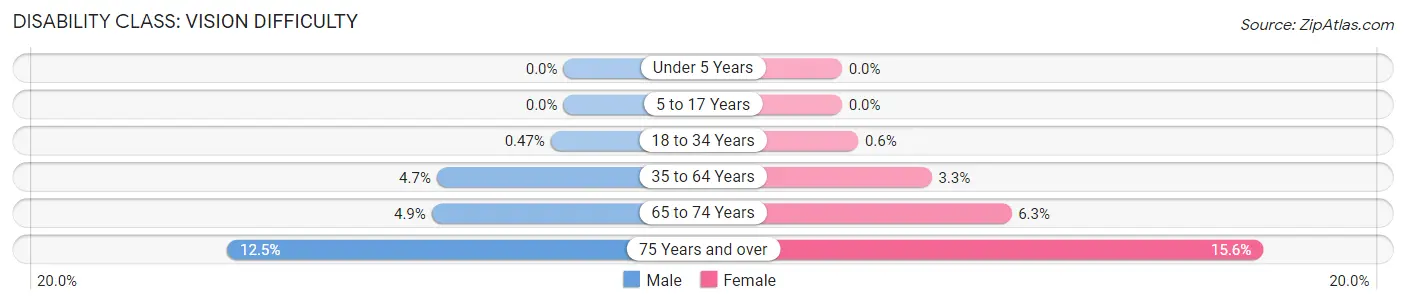
| Age Bracket | Male | Female |
| Under 5 Years | 0 (0.0%) | 0 (0.0%) |
| 5 to 17 Years | 0 (0.0%) | 0 (0.0%) |
| 18 to 34 Years | 13 (0.5%) | 20 (0.6%) |
| 35 to 64 Years | 129 (4.7%) | 106 (3.3%) |
| 65 to 74 Years | 50 (4.9%) | 82 (6.3%) |
| 75 Years and over | 67 (12.5%) | 150 (15.6%) |
Disability Class: Cognitive Difficulty

| Age Bracket | Male | Female |
| 5 to 17 Years | 66 (5.8%) | 14 (1.3%) |
| 18 to 34 Years | 472 (17.2%) | 46 (1.4%) |
| 35 to 64 Years | 199 (7.3%) | 204 (6.4%) |
| 65 to 74 Years | 56 (5.5%) | 42 (3.2%) |
| 75 Years and over | 99 (18.4%) | 208 (21.7%) |
Disability Class: Ambulatory Difficulty
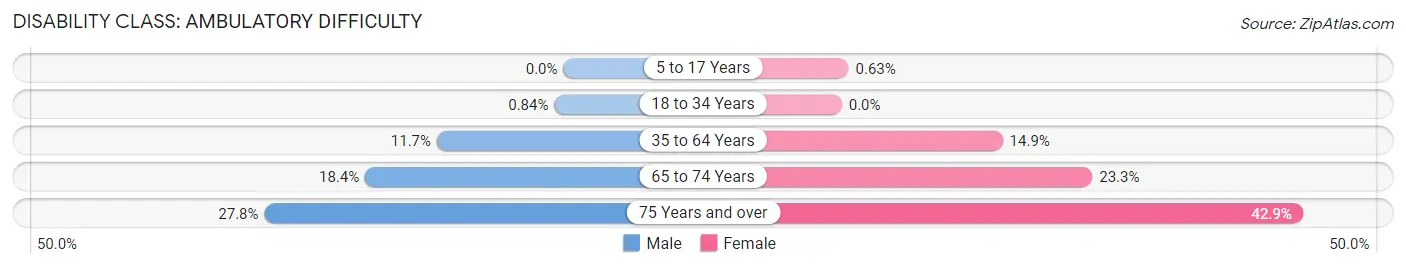
| Age Bracket | Male | Female |
| 5 to 17 Years | 0 (0.0%) | 7 (0.6%) |
| 18 to 34 Years | 23 (0.8%) | 0 (0.0%) |
| 35 to 64 Years | 322 (11.7%) | 475 (14.9%) |
| 65 to 74 Years | 188 (18.4%) | 303 (23.3%) |
| 75 Years and over | 149 (27.8%) | 411 (42.9%) |
Disability Class: Self-Care Difficulty

| Age Bracket | Male | Female |
| 5 to 17 Years | 0 (0.0%) | 7 (0.6%) |
| 18 to 34 Years | 0 (0.0%) | 0 (0.0%) |
| 35 to 64 Years | 115 (4.2%) | 112 (3.5%) |
| 65 to 74 Years | 41 (4.0%) | 44 (3.4%) |
| 75 Years and over | 35 (6.5%) | 120 (12.5%) |
Technology Access in Macon County
Computing Device Access in Macon County

| Device Type | # Households | % Households |
| Desktop or Laptop | 3,967 | 55.6% |
| Smartphone | 5,444 | 76.3% |
| Tablet | 3,326 | 46.6% |
| No Computing Device | 1,234 | 17.3% |
| Total | 7,131 | 100.0% |
Internet Access in Macon County

| Internet Type | # Households | % Households |
| Dial-Up Internet | 26 | 0.4% |
| Broadband Home | 3,068 | 43.0% |
| Cellular Data Only | 985 | 13.8% |
| Satellite Internet | 1,150 | 16.1% |
| No Internet | 2,036 | 28.5% |
| Total | 7,131 | 100.0% |
Macon County Summary
Macon County, Alabama is located in the southeastern part of the state and is part of the Black Belt region. It is bordered by Russell County to the north, Bullock County to the east, Lee County to the south, and Montgomery County to the west. The county seat is Tuskegee, and the county has a total area of 590 square miles. As of the 2010 census, the population was 21,452.
History
Macon County was established in 1832 from parts of Montgomery and Russell counties. It was named for Nathaniel Macon, a Revolutionary War hero and U.S. Senator from North Carolina. The county was originally part of the Creek Nation, and the area was home to the Creek Indians until the Indian Removal Act of 1830.
The county was home to several prominent African-American leaders, including Booker T. Washington, who founded the Tuskegee Institute in 1881. The institute was a major center of education for African-Americans in the South, and it was the site of the first African-American military pilot training program during World War II.
Geography
Macon County is located in the southeastern part of the state and is part of the Black Belt region. It is bordered by Russell County to the north, Bullock County to the east, Lee County to the south, and Montgomery County to the west. The county has a total area of 590 square miles, and the terrain is mostly flat with some rolling hills. The county is drained by the Tallapoosa River and its tributaries.
The climate is humid subtropical, with hot, humid summers and mild winters. The average annual temperature is 64°F, and the average annual precipitation is 52 inches.
Economy
Macon County’s economy is largely based on agriculture. The county is home to several large farms, and the major crops are cotton, corn, soybeans, and peanuts. The county also has a thriving timber industry, and there are several sawmills and wood-processing plants in the area.
The county is also home to several manufacturing plants, including a paper mill, a textile mill, and a furniture factory. The county is also home to the Tuskegee Institute, which is a major employer in the area.
Demographics
As of the 2010 census, the population of Macon County was 21,452. The population is 57.3% African-American, 37.7% White, 2.2% Hispanic, and 1.8% Asian. The median household income is $30,945, and the median home value is $77,400.
The county is served by the Macon County School System, which consists of seven elementary schools, two middle schools, and two high schools. The county is also home to the Tuskegee Institute, which is a major center of education for African-Americans in the South.
Common Questions
What is the Total Population of Macon County?
Total Population of Macon County is 19,198.
What is the Total Male Population of Macon County?
Total Male Population of Macon County is 8,865.
What is the Total Female Population of Macon County?
Total Female Population of Macon County is 10,333.
What is the Ratio of Males per 100 Females in Macon County?
There are 85.79 Males per 100 Females in Macon County.
What is the Ratio of Females per 100 Males in Macon County?
There are 116.56 Females per 100 Males in Macon County.
What is the Median Population Age in Macon County?
Median Population Age in Macon County is 37.8 Years.
What is the Average Family Size in Macon County
Average Family Size in Macon County is 3.0 People.
What is the Average Household Size in Macon County
Average Household Size in Macon County is 2.3 People.
What is Per Capita Income in Macon County?
Per Capita income in Macon County is $22,449.
What is the Median Family Income in Macon County?
Median Family Income in Macon County is $52,617.
What is the Median Household income in Macon County?
Median Household Income in Macon County is $41,206.
What is Income or Wage Gap in Macon County?
Income or Wage Gap in Macon County is 37.0%.
Women in Macon County earn 63.0 cents for every dollar earned by a man.
What is Family Income Deficit in Macon County?
Family Income Deficit in Macon County is $10,950.
Families that are below poverty line in Macon County earn $10,950 less on average than the poverty threshold level.
What is Inequality or Gini Index in Macon County?
Inequality or Gini Index in Macon County is 0.49.
How Large is the Labor Force in Macon County?
There are 8,179 People in the Labor Forcein in Macon County.
What is the Percentage of People in the Labor Force in Macon County?
49.8% of People are in the Labor Force in Macon County.
What is the Unemployment Rate in Macon County?
Unemployment Rate in Macon County is 12.5%.