Lamar County, AL
Lamar County Map
Lamar County Overview
13,885
TOTAL POPULATION
6,930
MALE POPULATION
6,955
FEMALE POPULATION
99.64
MALES / 100 FEMALES
100.36
FEMALES / 100 MALES
44.2
MEDIAN AGE
3.3
AVG FAMILY SIZE
2.6
AVG HOUSEHOLD SIZE
$24,794
PER CAPITA INCOME
$63,495
AVG FAMILY INCOME
$49,565
AVG HOUSEHOLD INCOME
24.8%
WAGE / INCOME GAP [ % ]
75.2¢/ $1
WAGE / INCOME GAP [ $ ]
$8,479
FAMILY INCOME DEFICIT
0.43
INEQUALITY / GINI INDEX
5,673
LABOR FORCE [ PEOPLE ]
51.1%
PERCENT IN LABOR FORCE
5.0%
UNEMPLOYMENT RATE
Lamar County Area Codes
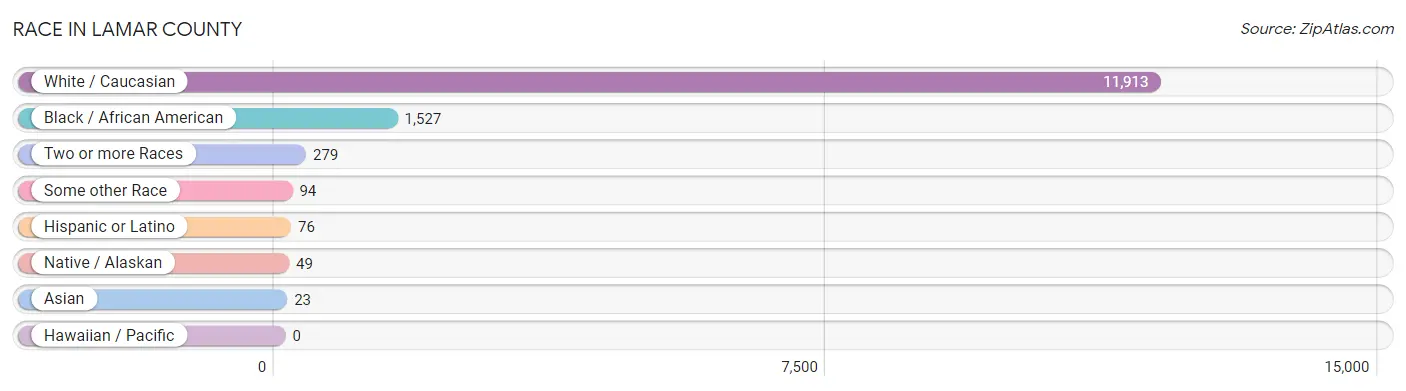
Race in Lamar County
The most populous races in Lamar County are White / Caucasian (11,913 | 85.8%), Black / African American (1,527 | 11.0%), and Two or more Races (279 | 2.0%).
| Race | # Population | % Population |
| Asian | 23 | 0.2% |
| Black / African American | 1,527 | 11.0% |
| Hawaiian / Pacific | 0 | 0.0% |
| Hispanic or Latino | 76 | 0.5% |
| Native / Alaskan | 49 | 0.4% |
| White / Caucasian | 11,913 | 85.8% |
| Two or more Races | 279 | 2.0% |
| Some other Race | 94 | 0.7% |
| Total | 13,885 | 100.0% |
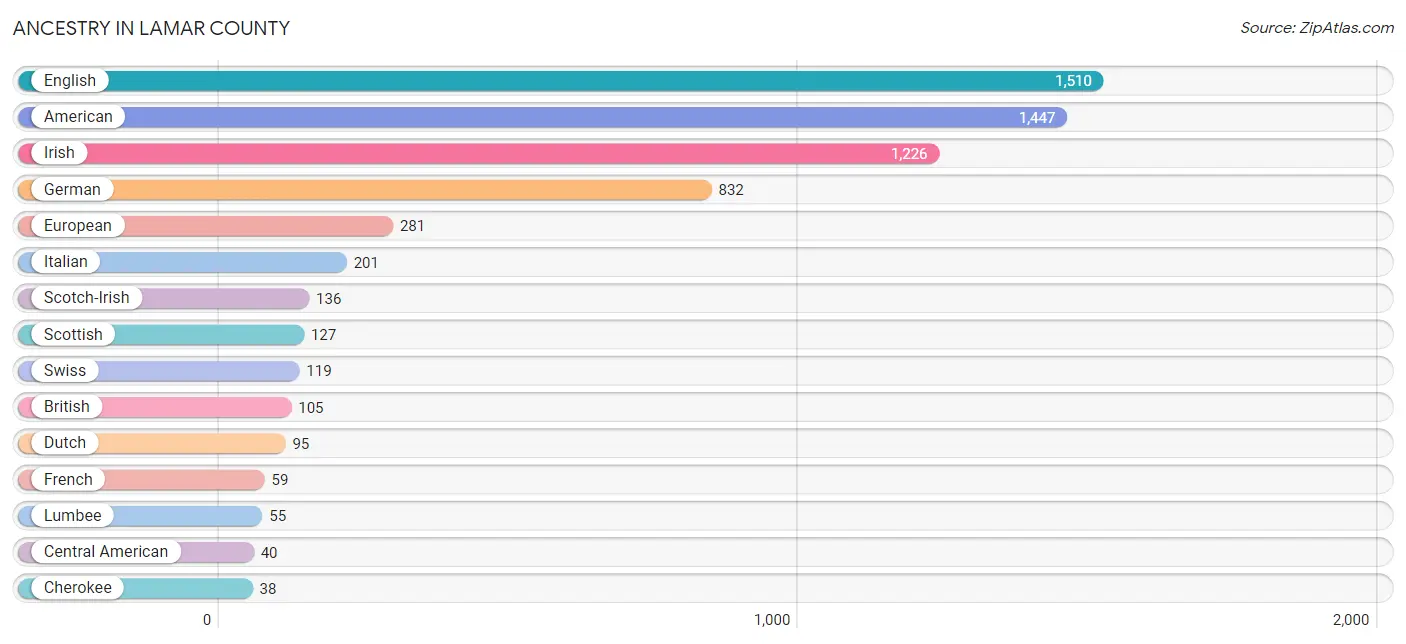
Ancestry in Lamar County
The most populous ancestries reported in Lamar County are English (1,510 | 10.9%), American (1,447 | 10.4%), Irish (1,226 | 8.8%), German (832 | 6.0%), and European (281 | 2.0%), together accounting for 38.1% of all Lamar County residents.
| Ancestry | # Population | % Population |
| African | 18 | 0.1% |
| American | 1,447 | 10.4% |
| Austrian | 2 | 0.0% |
| British | 105 | 0.8% |
| Central American | 40 | 0.3% |
| Cherokee | 38 | 0.3% |
| Chickasaw | 18 | 0.1% |
| Dutch | 95 | 0.7% |
| English | 1,510 | 10.9% |
| European | 281 | 2.0% |
| French | 59 | 0.4% |
| French Canadian | 15 | 0.1% |
| German | 832 | 6.0% |
| Greek | 15 | 0.1% |
| Guatemalan | 10 | 0.1% |
| Irish | 1,226 | 8.8% |
| Italian | 201 | 1.5% |
| Korean | 14 | 0.1% |
| Lumbee | 55 | 0.4% |
| Mexican | 6 | 0.0% |
| Norwegian | 37 | 0.3% |
| Pakistani | 5 | 0.0% |
| Portuguese | 8 | 0.1% |
| Salvadoran | 30 | 0.2% |
| Scandinavian | 24 | 0.2% |
| Scotch-Irish | 136 | 1.0% |
| Scottish | 127 | 0.9% |
| South American | 27 | 0.2% |
| Subsaharan African | 18 | 0.1% |
| Swiss | 119 | 0.9% |
| Thai | 7 | 0.1% |
| Venezuelan | 27 | 0.2% |
| Welsh | 9 | 0.1% | View All 33 Rows |
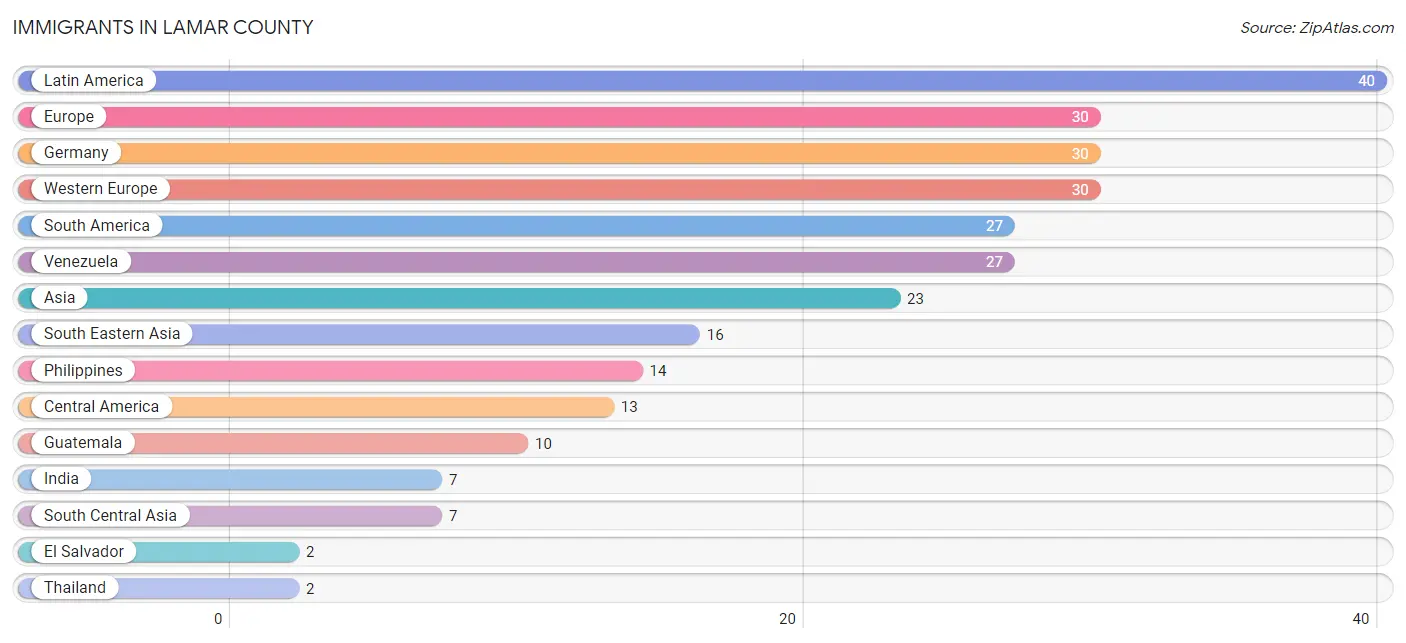
Immigrants in Lamar County
The most numerous immigrant groups reported in Lamar County came from Latin America (40 | 0.3%), Europe (30 | 0.2%), Germany (30 | 0.2%), Western Europe (30 | 0.2%), and South America (27 | 0.2%), together accounting for 1.1% of all Lamar County residents.
| Immigration Origin | # Population | % Population |
| Asia | 23 | 0.2% |
| Central America | 13 | 0.1% |
| El Salvador | 2 | 0.0% |
| Europe | 30 | 0.2% |
| Germany | 30 | 0.2% |
| Guatemala | 10 | 0.1% |
| India | 7 | 0.1% |
| Latin America | 40 | 0.3% |
| Mexico | 1 | 0.0% |
| Philippines | 14 | 0.1% |
| South America | 27 | 0.2% |
| South Central Asia | 7 | 0.1% |
| South Eastern Asia | 16 | 0.1% |
| Thailand | 2 | 0.0% |
| Venezuela | 27 | 0.2% |
| Western Europe | 30 | 0.2% | View All 16 Rows |
Sex and Age in Lamar County
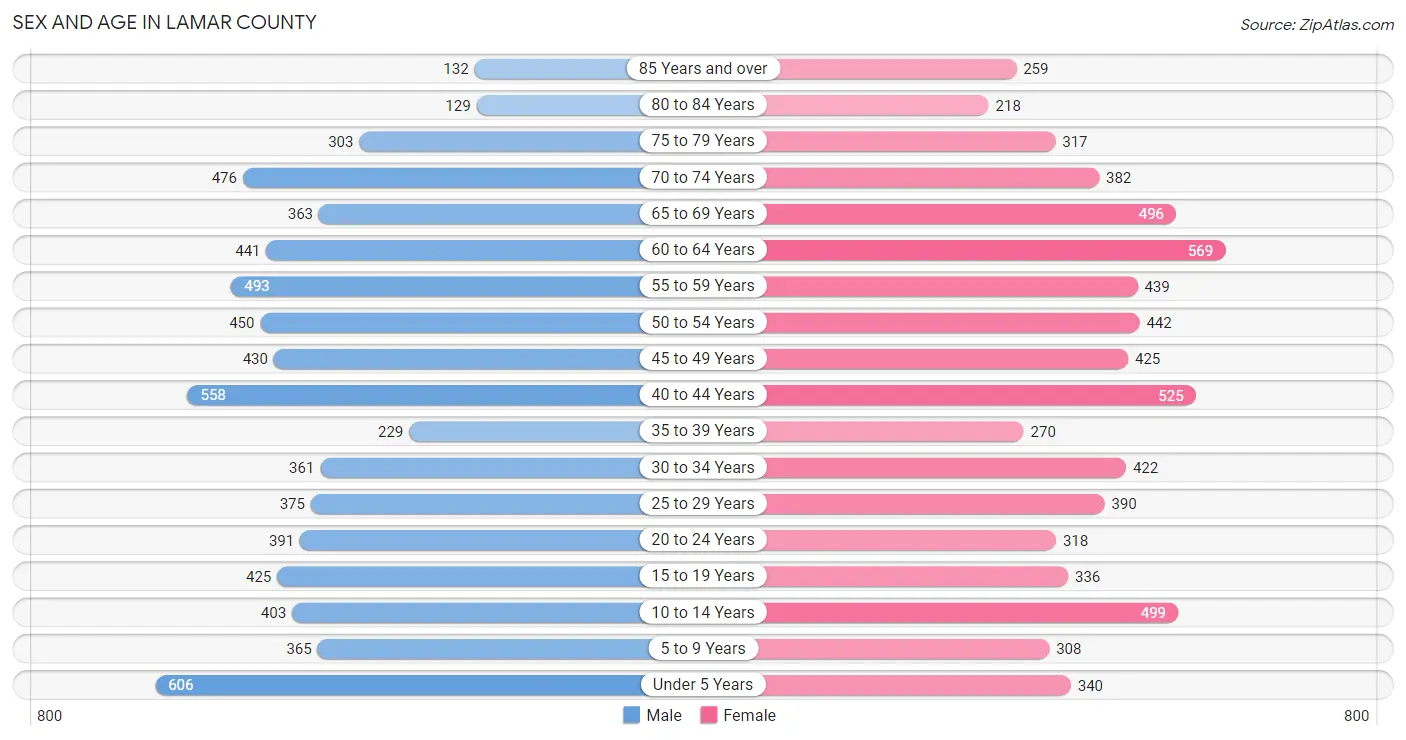
Sex and Age in Lamar County
The most populous age groups in Lamar County are Under 5 Years (606 | 8.7%) for men and 60 to 64 Years (569 | 8.2%) for women.
| Age Bracket | Male | Female |
| Under 5 Years | 606 (8.7%) | 340 (4.9%) |
| 5 to 9 Years | 365 (5.3%) | 308 (4.4%) |
| 10 to 14 Years | 403 (5.8%) | 499 (7.2%) |
| 15 to 19 Years | 425 (6.1%) | 336 (4.8%) |
| 20 to 24 Years | 391 (5.6%) | 318 (4.6%) |
| 25 to 29 Years | 375 (5.4%) | 390 (5.6%) |
| 30 to 34 Years | 361 (5.2%) | 422 (6.1%) |
| 35 to 39 Years | 229 (3.3%) | 270 (3.9%) |
| 40 to 44 Years | 558 (8.1%) | 525 (7.5%) |
| 45 to 49 Years | 430 (6.2%) | 425 (6.1%) |
| 50 to 54 Years | 450 (6.5%) | 442 (6.4%) |
| 55 to 59 Years | 493 (7.1%) | 439 (6.3%) |
| 60 to 64 Years | 441 (6.4%) | 569 (8.2%) |
| 65 to 69 Years | 363 (5.2%) | 496 (7.1%) |
| 70 to 74 Years | 476 (6.9%) | 382 (5.5%) |
| 75 to 79 Years | 303 (4.4%) | 317 (4.6%) |
| 80 to 84 Years | 129 (1.9%) | 218 (3.1%) |
| 85 Years and over | 132 (1.9%) | 259 (3.7%) |
| Total | 6,930 (100.0%) | 6,955 (100.0%) |
Families and Households in Lamar County
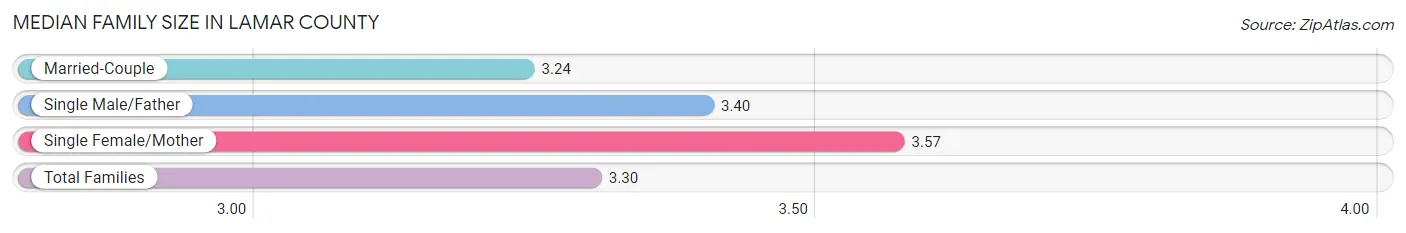
Median Family Size in Lamar County
The median family size in Lamar County is 3.30 persons per family, with single female/mother families (599 | 17.1%) accounting for the largest median family size of 3.57 persons per family. On the other hand, married-couple families (2,763 | 78.7%) represent the smallest median family size with 3.24 persons per family.
| Family Type | # Families | Family Size |
| Married-Couple | 2,763 (78.7%) | 3.24 |
| Single Male/Father | 148 (4.2%) | 3.40 |
| Single Female/Mother | 599 (17.1%) | 3.57 |
| Total Families | 3,510 (100.0%) | 3.30 |
Median Household Size in Lamar County
The median household size in Lamar County is 2.65 persons per household, with single male/father households (148 | 2.9%) accounting for the largest median household size of 4.11 persons per household. non-family households (1,658 | 32.1%) represent the smallest median household size with 1.16 persons per household.

| Household Type | # Households | Household Size |
| Married-Couple | 2,763 (53.5%) | 3.24 |
| Single Male/Father | 148 (2.9%) | 4.11 |
| Single Female/Mother | 599 (11.6%) | 3.70 |
| Non-family | 1,658 (32.1%) | 1.16 |
| Total Households | 5,168 (100.0%) | 2.65 |
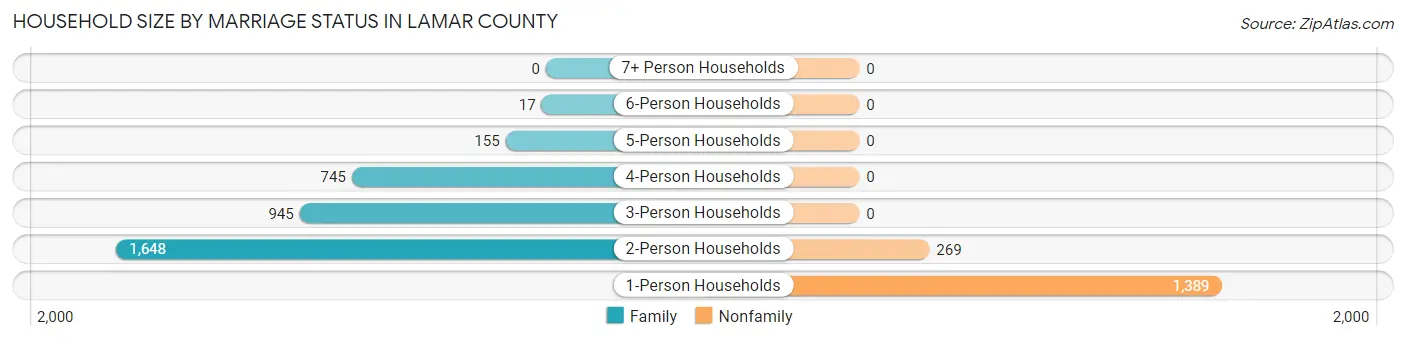
Household Size by Marriage Status in Lamar County
Out of a total of 5,168 households in Lamar County, 3,510 (67.9%) are family households, while 1,658 (32.1%) are nonfamily households. The most numerous type of family households are 2-person households, comprising 1,648, and the most common type of nonfamily households are 1-person households, comprising 1,389.
| Household Size | Family Households | Nonfamily Households |
| 1-Person Households | - | 1,389 (26.9%) |
| 2-Person Households | 1,648 (31.9%) | 269 (5.2%) |
| 3-Person Households | 945 (18.3%) | 0 (0.0%) |
| 4-Person Households | 745 (14.4%) | 0 (0.0%) |
| 5-Person Households | 155 (3.0%) | 0 (0.0%) |
| 6-Person Households | 17 (0.3%) | 0 (0.0%) |
| 7+ Person Households | 0 (0.0%) | 0 (0.0%) |
| Total | 3,510 (67.9%) | 1,658 (32.1%) |
Female Fertility in Lamar County
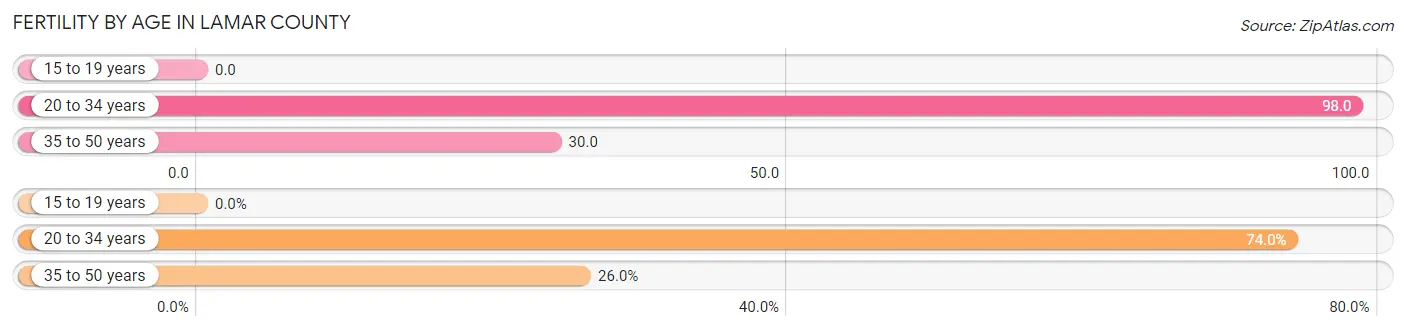
Fertility by Age in Lamar County
Average fertility rate in Lamar County is 54.0 births per 1,000 women. Women in the age bracket of 20 to 34 years have the highest fertility rate with 98.0 births per 1,000 women. Women in the age bracket of 20 to 34 years acount for 74.0% of all women with births.
| Age Bracket | Women with Births | Births / 1,000 Women |
| 15 to 19 years | 0 (0.0%) | 0.0 |
| 20 to 34 years | 111 (74.0%) | 98.0 |
| 35 to 50 years | 39 (26.0%) | 30.0 |
| Total | 150 (100.0%) | 54.0 |
Fertility by Age by Marriage Status in Lamar County
40.0% of women with births (150) in Lamar County are married. The highest percentage of unmarried women with births falls into 20 to 34 years age bracket with 63.1% of them unmarried at the time of birth, while the lowest percentage of unmarried women with births belong to 35 to 50 years age bracket with 51.3% of them unmarried.
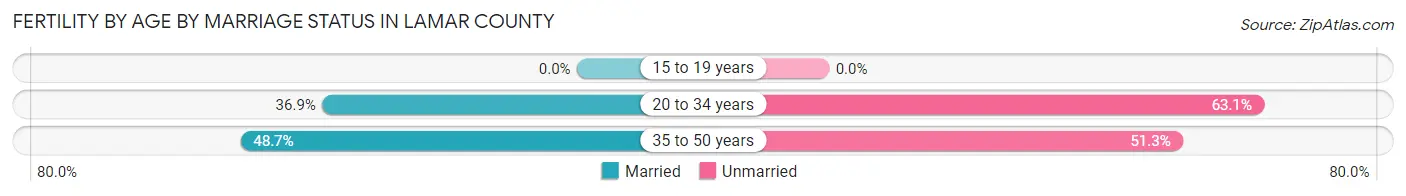
| Age Bracket | Married | Unmarried |
| 15 to 19 years | 0 (0.0%) | 0 (0.0%) |
| 20 to 34 years | 41 (36.9%) | 70 (63.1%) |
| 35 to 50 years | 19 (48.7%) | 20 (51.3%) |
| Total | 60 (40.0%) | 90 (60.0%) |
Fertility by Education in Lamar County
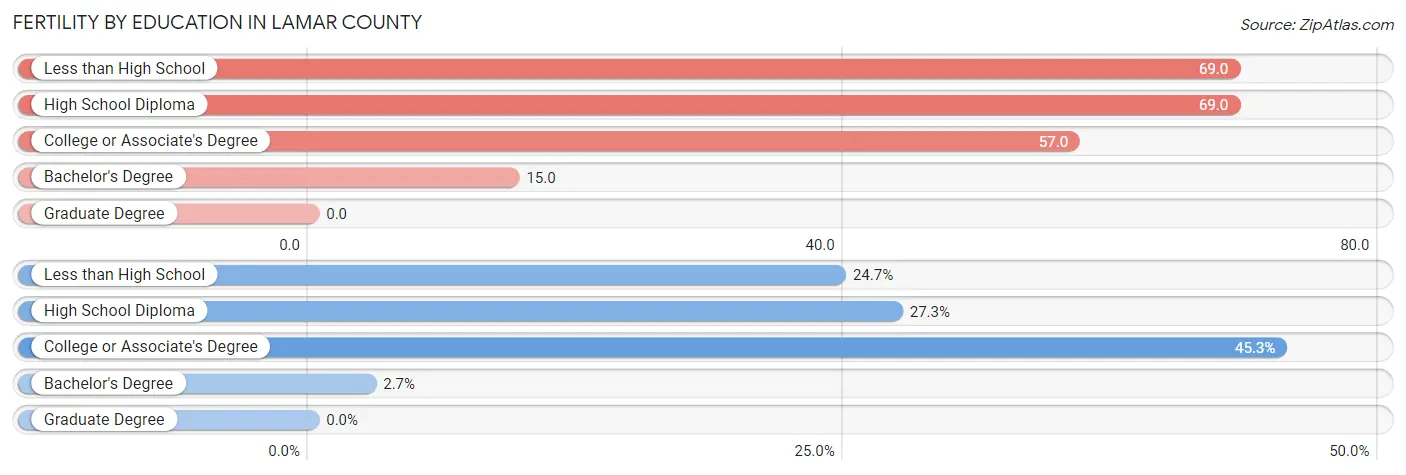
| Educational Attainment | Women with Births | Births / 1,000 Women |
| Less than High School | 37 (24.7%) | 69.0 |
| High School Diploma | 41 (27.3%) | 69.0 |
| College or Associate's Degree | 68 (45.3%) | 57.0 |
| Bachelor's Degree | 4 (2.7%) | 15.0 |
| Graduate Degree | 0 (0.0%) | 0.0 |
| Total | 150 (100.0%) | 54.0 |
Fertility by Education by Marriage Status in Lamar County
60.0% of women with births in Lamar County are unmarried. Women with the educational attainment of bachelor's degree are most likely to be married with 100.0% of them married at childbirth, while women with the educational attainment of less than high school are least likely to be married with 100.0% of them unmarried at childbirth.
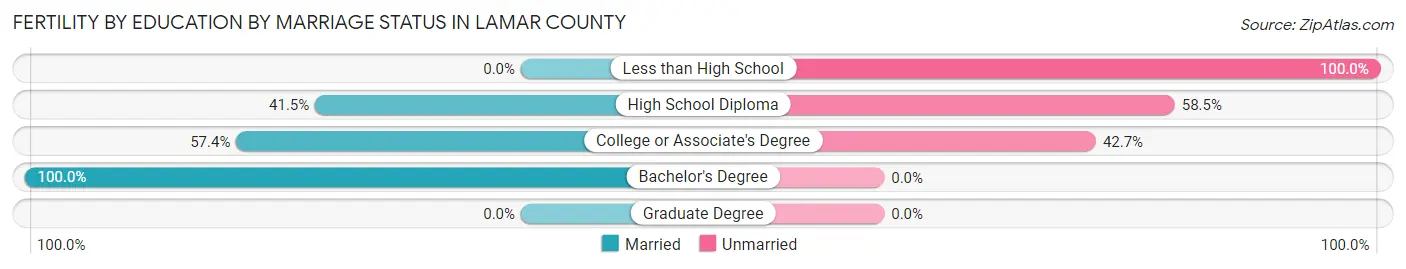
| Educational Attainment | Married | Unmarried |
| Less than High School | 0 (0.0%) | 37 (100.0%) |
| High School Diploma | 17 (41.5%) | 24 (58.5%) |
| College or Associate's Degree | 39 (57.4%) | 29 (42.6%) |
| Bachelor's Degree | 4 (100.0%) | 0 (0.0%) |
| Graduate Degree | 0 (0.0%) | 0 (0.0%) |
| Total | 60 (40.0%) | 90 (60.0%) |
Income in Lamar County
Income Overview in Lamar County
Per Capita Income in Lamar County is $24,794, while median incomes of families and households are $63,495 and $49,565 respectively.
| Characteristic | Number | Measure |
| Per Capita Income | 13,885 | $24,794 |
| Median Family Income | 3,510 | $63,495 |
| Mean Family Income | 3,510 | $76,257 |
| Median Household Income | 5,168 | $49,565 |
| Mean Household Income | 5,168 | $62,422 |
| Income Deficit | 3,510 | $8,479 |
| Wage / Income Gap (%) | 13,885 | 24.83% |
| Wage / Income Gap ($) | 13,885 | 75.17¢ per $1 |
| Gini / Inequality Index | 13,885 | 0.43 |
Earnings by Sex in Lamar County
Average Earnings in Lamar County are $34,095, $39,583 for men and $29,754 for women, a difference of 24.8%.
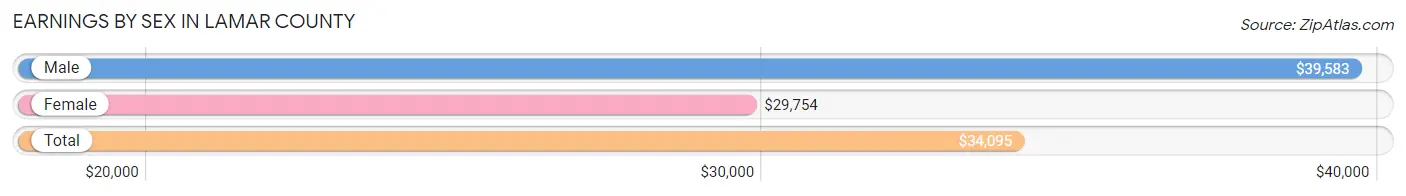
| Sex | Number | Average Earnings |
| Male | 3,168 (54.4%) | $39,583 |
| Female | 2,656 (45.6%) | $29,754 |
| Total | 5,824 (100.0%) | $34,095 |
Earnings by Sex by Income Bracket in Lamar County
The most common earnings brackets in Lamar County are $30,000 to $34,999 for men (456 | 14.4%) and $55,000 to $64,999 for women (369 | 13.9%).
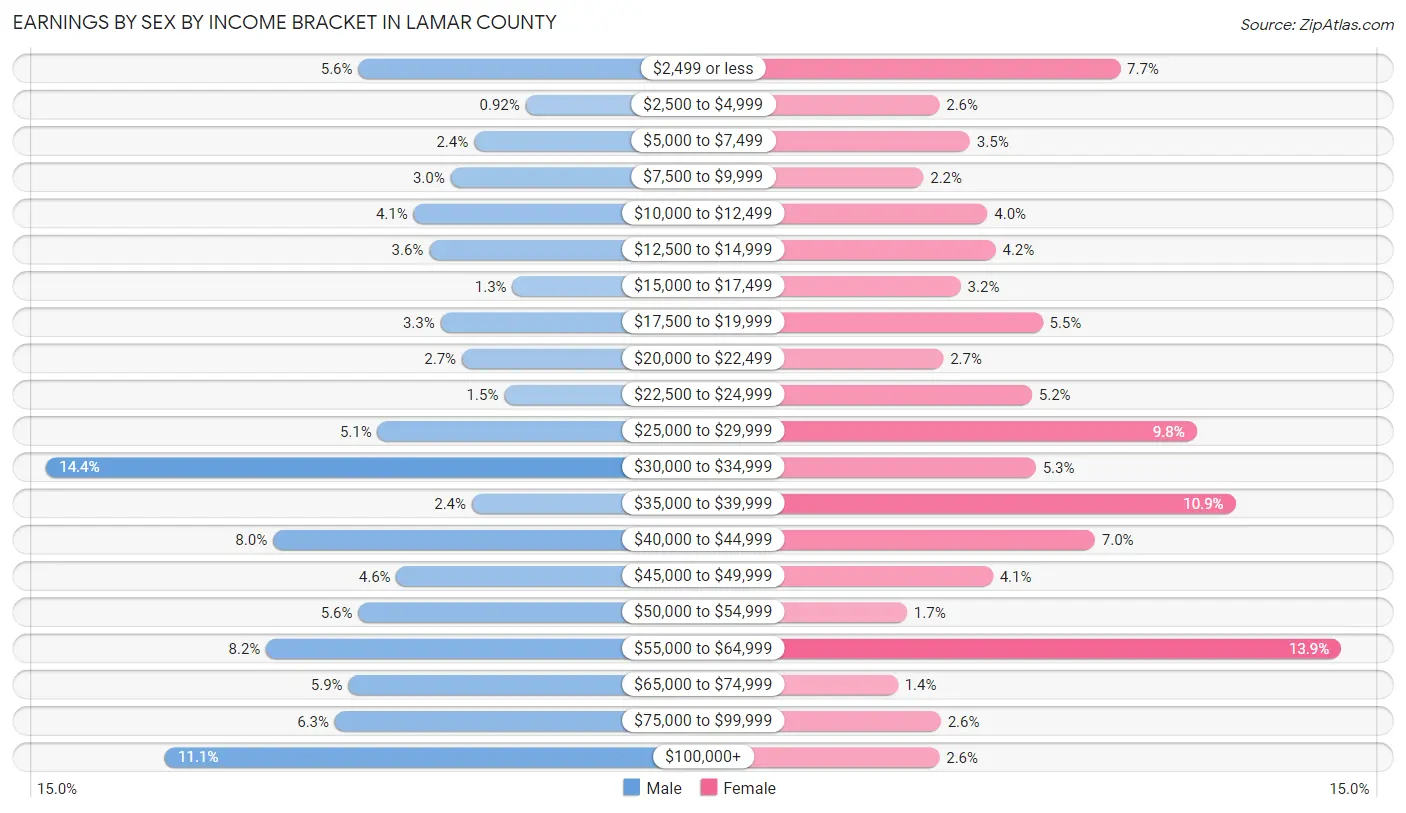
| Income | Male | Female |
| $2,499 or less | 178 (5.6%) | 204 (7.7%) |
| $2,500 to $4,999 | 29 (0.9%) | 69 (2.6%) |
| $5,000 to $7,499 | 75 (2.4%) | 92 (3.5%) |
| $7,500 to $9,999 | 96 (3.0%) | 57 (2.1%) |
| $10,000 to $12,499 | 129 (4.1%) | 105 (4.0%) |
| $12,500 to $14,999 | 115 (3.6%) | 111 (4.2%) |
| $15,000 to $17,499 | 41 (1.3%) | 85 (3.2%) |
| $17,500 to $19,999 | 105 (3.3%) | 146 (5.5%) |
| $20,000 to $22,499 | 86 (2.7%) | 72 (2.7%) |
| $22,500 to $24,999 | 48 (1.5%) | 138 (5.2%) |
| $25,000 to $29,999 | 161 (5.1%) | 261 (9.8%) |
| $30,000 to $34,999 | 456 (14.4%) | 141 (5.3%) |
| $35,000 to $39,999 | 77 (2.4%) | 290 (10.9%) |
| $40,000 to $44,999 | 254 (8.0%) | 185 (7.0%) |
| $45,000 to $49,999 | 144 (4.5%) | 109 (4.1%) |
| $50,000 to $54,999 | 178 (5.6%) | 45 (1.7%) |
| $55,000 to $64,999 | 260 (8.2%) | 369 (13.9%) |
| $65,000 to $74,999 | 187 (5.9%) | 38 (1.4%) |
| $75,000 to $99,999 | 199 (6.3%) | 70 (2.6%) |
| $100,000+ | 350 (11.1%) | 69 (2.6%) |
| Total | 3,168 (100.0%) | 2,656 (100.0%) |
Earnings by Sex by Educational Attainment in Lamar County
Average earnings in Lamar County are $42,133 for men and $34,488 for women, a difference of 18.1%. Men with an educational attainment of graduate degree enjoy the highest average annual earnings of $112,623, while those with less than high school education earn the least with $21,420. Women with an educational attainment of graduate degree earn the most with the average annual earnings of $61,576, while those with less than high school education have the smallest earnings of $13,378.
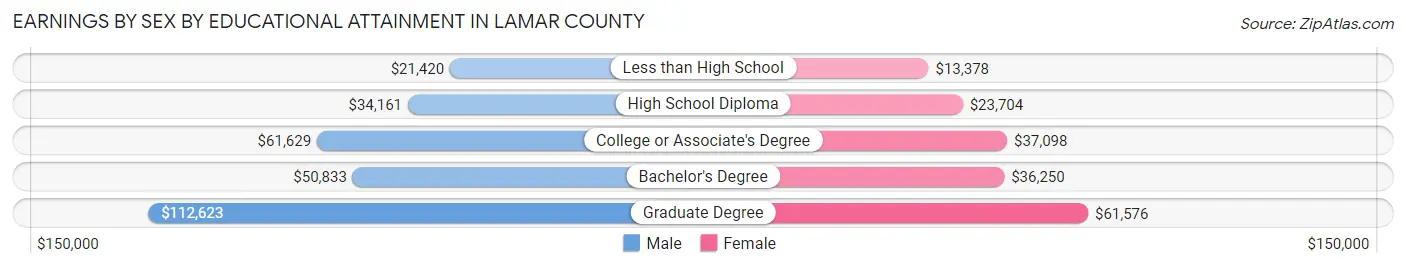
| Educational Attainment | Male Income | Female Income |
| Less than High School | $21,420 | $13,378 |
| High School Diploma | $34,161 | $23,704 |
| College or Associate's Degree | $61,629 | $37,098 |
| Bachelor's Degree | $50,833 | $36,250 |
| Graduate Degree | $112,623 | $61,576 |
| Total | $42,133 | $34,488 |
Family Income in Lamar County
Family Income Brackets in Lamar County
According to the Lamar County family income data, there are 783 families falling into the $100,000 to $149,999 income range, which is the most common income bracket and makes up 22.3% of all families. Conversely, the $10,000 to $14,999 income bracket is the least frequent group with only 77 families (2.2%) belonging to this category.

| Income Bracket | # Families | % Families |
| Less than $10,000 | 119 | 3.4% |
| $10,000 to $14,999 | 77 | 2.2% |
| $15,000 to $24,999 | 225 | 6.4% |
| $25,000 to $34,999 | 379 | 10.8% |
| $35,000 to $49,999 | 495 | 14.1% |
| $50,000 to $74,999 | 769 | 21.9% |
| $75,000 to $99,999 | 393 | 11.2% |
| $100,000 to $149,999 | 783 | 22.3% |
| $150,000 to $199,999 | 190 | 5.4% |
| $200,000+ | 84 | 2.4% |
Family Income by Famaliy Size in Lamar County
5-person families (155 | 4.4%) account for the highest median family income in Lamar County with $94,938 per family, while 3-person families (928 | 26.4%) have the highest median income of $28,081 per family member.
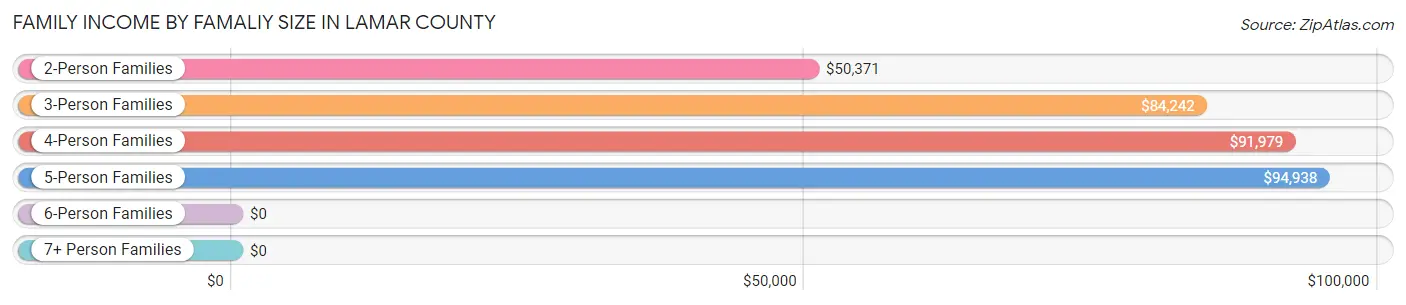
| Income Bracket | # Families | Median Income |
| 2-Person Families | 1,741 (49.6%) | $50,371 |
| 3-Person Families | 928 (26.4%) | $84,242 |
| 4-Person Families | 669 (19.1%) | $91,979 |
| 5-Person Families | 155 (4.4%) | $94,938 |
| 6-Person Families | 17 (0.5%) | $0 |
| 7+ Person Families | 0 (0.0%) | $0 |
| Total | 3,510 (100.0%) | $63,495 |
Family Income by Number of Earners in Lamar County
The median family income in Lamar County is $63,495, with families comprising 3+ earners (307) having the highest median family income of $106,125, while families with no earners (902) have the lowest median family income of $35,296, accounting for 8.7% and 25.7% of families, respectively.
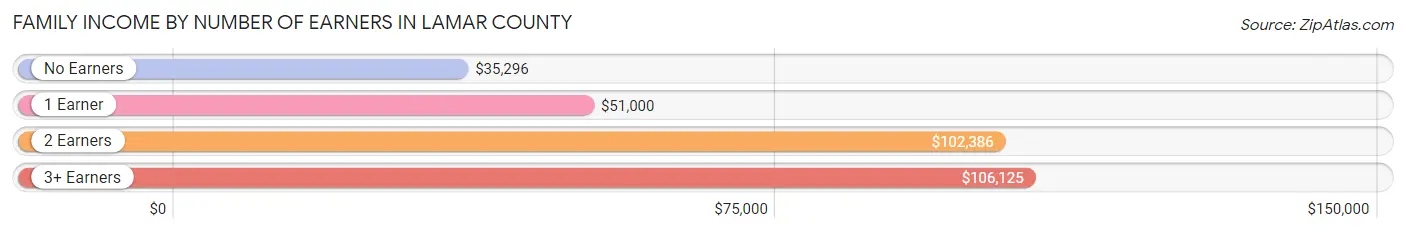
| Number of Earners | # Families | Median Income |
| No Earners | 902 (25.7%) | $35,296 |
| 1 Earner | 1,104 (31.5%) | $51,000 |
| 2 Earners | 1,197 (34.1%) | $102,386 |
| 3+ Earners | 307 (8.7%) | $106,125 |
| Total | 3,510 (100.0%) | $63,495 |
Household Income in Lamar County
Household Income Brackets in Lamar County
With 1,023 households falling in the category, the $50,000 to $74,999 income range is the most frequent in Lamar County, accounting for 19.8% of all households. In contrast, only 93 households (1.8%) fall into the $200,000+ income bracket, making it the least populous group.
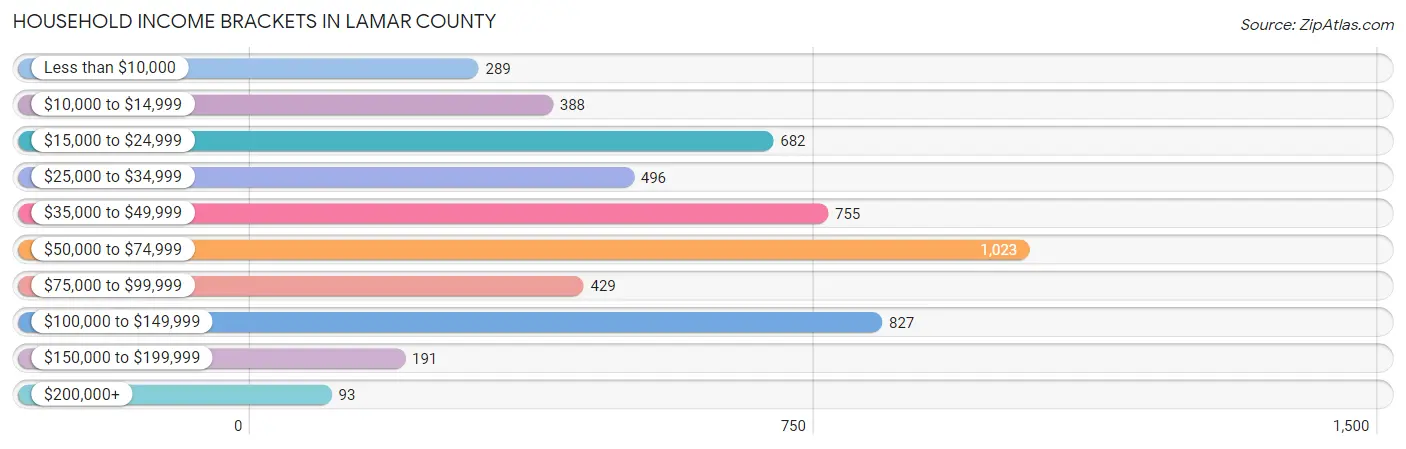
| Income Bracket | # Households | % Households |
| Less than $10,000 | 289 | 5.6% |
| $10,000 to $14,999 | 388 | 7.5% |
| $15,000 to $24,999 | 682 | 13.2% |
| $25,000 to $34,999 | 496 | 9.6% |
| $35,000 to $49,999 | 755 | 14.6% |
| $50,000 to $74,999 | 1,023 | 19.8% |
| $75,000 to $99,999 | 429 | 8.3% |
| $100,000 to $149,999 | 827 | 16.0% |
| $150,000 to $199,999 | 191 | 3.7% |
| $200,000+ | 93 | 1.8% |
Household Income by Householder Age in Lamar County
The median household income in Lamar County is $49,565, with the highest median household income of $63,218 found in the 45 to 64 years age bracket for the primary householder. A total of 1,691 households (32.7%) fall into this category. Meanwhile, the 65+ years age bracket for the primary householder has the lowest median household income of $31,773, with 1,906 households (36.9%) in this group.

| Income Bracket | # Households | Median Income |
| 15 to 24 Years | 136 (2.6%) | $51,098 |
| 25 to 44 Years | 1,435 (27.8%) | $62,488 |
| 45 to 64 Years | 1,691 (32.7%) | $63,218 |
| 65+ Years | 1,906 (36.9%) | $31,773 |
| Total | 5,168 (100.0%) | $49,565 |
Poverty in Lamar County
Income Below Poverty by Sex and Age in Lamar County
With 14.3% poverty level for males and 16.4% for females among the residents of Lamar County, under 5 year old males and 12 to 14 year old females are the most vulnerable to poverty, with 156 males (25.7%) and 121 females (38.3%) in their respective age groups living below the poverty level.

| Age Bracket | Male | Female |
| Under 5 Years | 156 (25.7%) | 17 (5.0%) |
| 5 Years | 10 (23.8%) | 2 (18.2%) |
| 6 to 11 Years | 66 (14.2%) | 80 (16.7%) |
| 12 to 14 Years | 24 (9.2%) | 121 (38.3%) |
| 15 Years | 0 (0.0%) | 18 (16.5%) |
| 16 and 17 Years | 0 (0.0%) | 17 (14.2%) |
| 18 to 24 Years | 100 (18.9%) | 18 (4.2%) |
| 25 to 34 Years | 16 (2.2%) | 190 (23.8%) |
| 35 to 44 Years | 143 (18.6%) | 185 (23.3%) |
| 45 to 54 Years | 86 (9.9%) | 100 (11.8%) |
| 55 to 64 Years | 208 (22.4%) | 146 (14.5%) |
| 65 to 74 Years | 103 (12.3%) | 125 (14.4%) |
| 75 Years and over | 69 (12.6%) | 107 (14.2%) |
| Total | 981 (14.3%) | 1,126 (16.4%) |
Income Above Poverty by Sex and Age in Lamar County
According to the poverty statistics in Lamar County, males aged 15 years and females aged 18 to 24 years are the age groups that are most secure financially, with 100.0% of males and 95.8% of females in these age groups living above the poverty line.
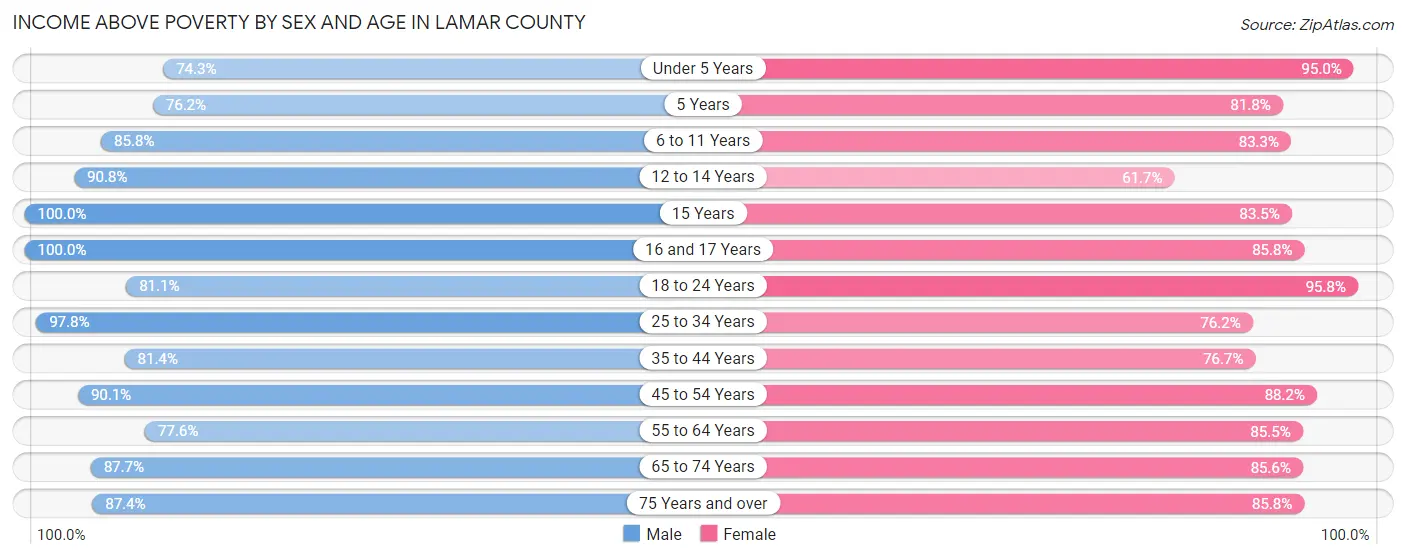
| Age Bracket | Male | Female |
| Under 5 Years | 450 (74.3%) | 323 (95.0%) |
| 5 Years | 32 (76.2%) | 9 (81.8%) |
| 6 to 11 Years | 399 (85.8%) | 400 (83.3%) |
| 12 to 14 Years | 237 (90.8%) | 195 (61.7%) |
| 15 Years | 153 (100.0%) | 91 (83.5%) |
| 16 and 17 Years | 123 (100.0%) | 103 (85.8%) |
| 18 to 24 Years | 430 (81.1%) | 407 (95.8%) |
| 25 to 34 Years | 720 (97.8%) | 609 (76.2%) |
| 35 to 44 Years | 627 (81.4%) | 610 (76.7%) |
| 45 to 54 Years | 782 (90.1%) | 744 (88.1%) |
| 55 to 64 Years | 722 (77.6%) | 861 (85.5%) |
| 65 to 74 Years | 736 (87.7%) | 740 (85.6%) |
| 75 Years and over | 480 (87.4%) | 646 (85.8%) |
| Total | 5,891 (85.7%) | 5,738 (83.6%) |
Income Below Poverty Among Married-Couple Families in Lamar County
The poverty statistics for married-couple families in Lamar County show that 4.4% or 122 of the total 2,763 families live below the poverty line. Families with 3 or 4 children have the highest poverty rate of 27.5%, comprising of 28 families. On the other hand, families with no children have the lowest poverty rate of 3.0%, which includes 50 families.
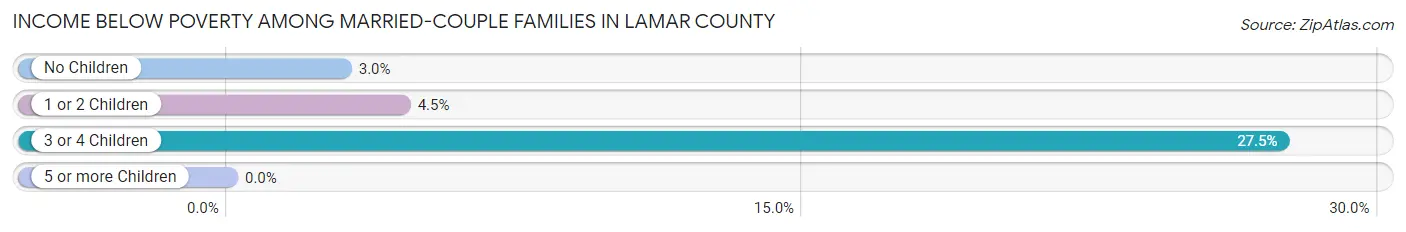
| Children | Above Poverty | Below Poverty |
| No Children | 1,635 (97.0%) | 50 (3.0%) |
| 1 or 2 Children | 932 (95.5%) | 44 (4.5%) |
| 3 or 4 Children | 74 (72.6%) | 28 (27.5%) |
| 5 or more Children | 0 (0.0%) | 0 (0.0%) |
| Total | 2,641 (95.6%) | 122 (4.4%) |
Income Below Poverty Among Single-Parent Households in Lamar County
According to the poverty data in Lamar County, 18.2% or 27 single-father households and 28.2% or 169 single-mother households are living below the poverty line. Among single-father households, those with no children have the highest poverty rate, with 25 households (24.3%) experiencing poverty. Likewise, among single-mother households, those with 1 or 2 children have the highest poverty rate, with 86 households (32.1%) falling below the poverty line.
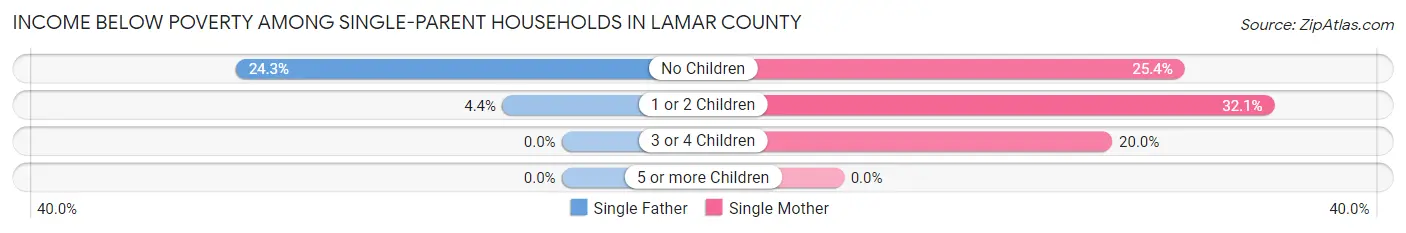
| Children | Single Father | Single Mother |
| No Children | 25 (24.3%) | 79 (25.4%) |
| 1 or 2 Children | 2 (4.4%) | 86 (32.1%) |
| 3 or 4 Children | 0 (0.0%) | 4 (20.0%) |
| 5 or more Children | 0 (0.0%) | 0 (0.0%) |
| Total | 27 (18.2%) | 169 (28.2%) |
Income Below Poverty Among Married-Couple vs Single-Parent Households in Lamar County
The poverty data for Lamar County shows that 122 of the married-couple family households (4.4%) and 196 of the single-parent households (26.2%) are living below the poverty level. Within the married-couple family households, those with 3 or 4 children have the highest poverty rate, with 28 households (27.5%) falling below the poverty line. Among the single-parent households, those with 1 or 2 children have the highest poverty rate, with 88 household (28.1%) living below poverty.
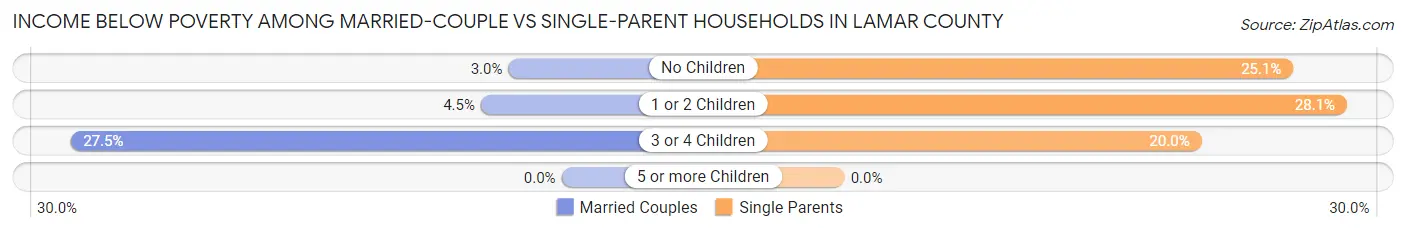
| Children | Married-Couple Families | Single-Parent Households |
| No Children | 50 (3.0%) | 104 (25.1%) |
| 1 or 2 Children | 44 (4.5%) | 88 (28.1%) |
| 3 or 4 Children | 28 (27.5%) | 4 (20.0%) |
| 5 or more Children | 0 (0.0%) | 0 (0.0%) |
| Total | 122 (4.4%) | 196 (26.2%) |
Employment Characteristics in Lamar County
Employment by Class of Employer in Lamar County
Among the 5,222 employed individuals in Lamar County, private company employees (3,719 | 71.2%), not-for-profit organizations (393 | 7.5%), and local government employees (360 | 6.9%) make up the most common classes of employment.
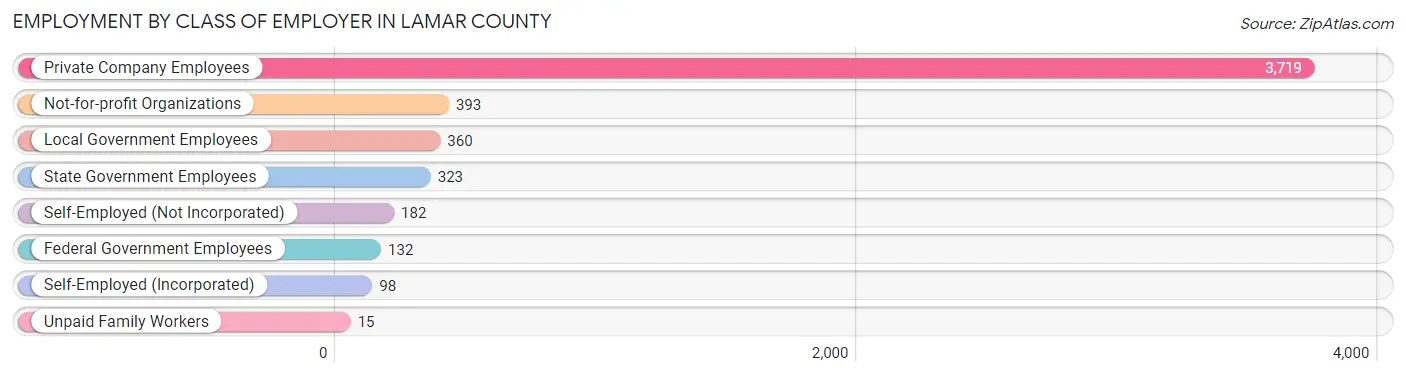
| Employer Class | # Employees | % Employees |
| Private Company Employees | 3,719 | 71.2% |
| Self-Employed (Incorporated) | 98 | 1.9% |
| Self-Employed (Not Incorporated) | 182 | 3.5% |
| Not-for-profit Organizations | 393 | 7.5% |
| Local Government Employees | 360 | 6.9% |
| State Government Employees | 323 | 6.2% |
| Federal Government Employees | 132 | 2.5% |
| Unpaid Family Workers | 15 | 0.3% |
| Total | 5,222 | 100.0% |
Employment Status by Age in Lamar County
According to the labor force statistics for Lamar County, out of the total population over 16 years of age (11,102), 51.1% or 5,673 individuals are in the labor force, with 5.0% or 284 of them unemployed. The age group with the highest labor force participation rate is 35 to 44 years, with 81.1% or 1,283 individuals in the labor force. Within the labor force, the 16 to 19 years age range has the highest percentage of unemployed individuals, with 19.3% or 39 of them being unemployed.
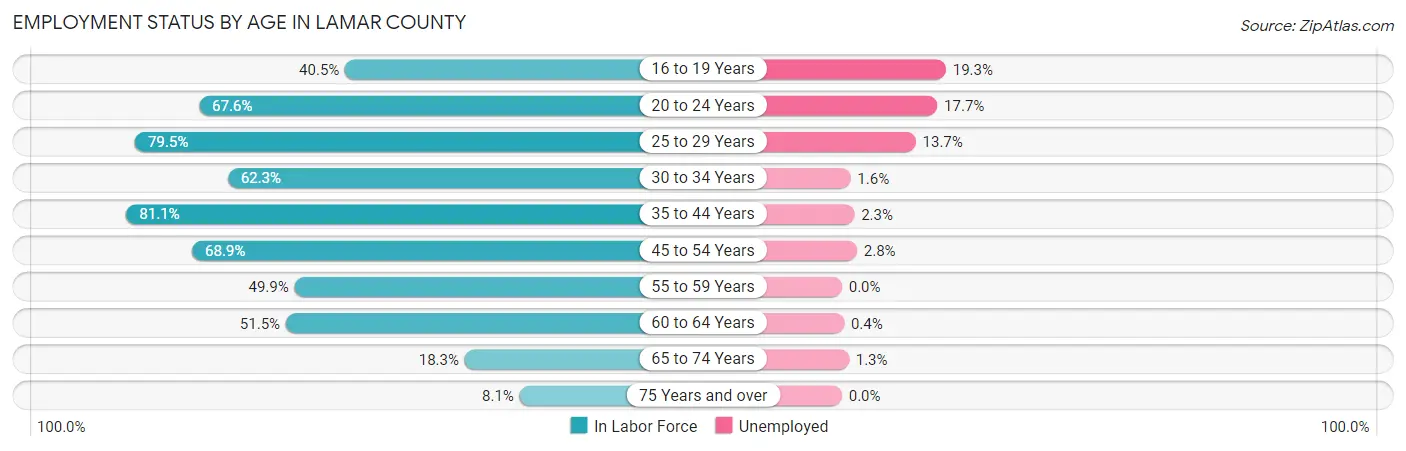
| Age Bracket | In Labor Force | Unemployed |
| 16 to 19 Years | 202 (40.5%) | 39 (19.3%) |
| 20 to 24 Years | 479 (67.6%) | 85 (17.7%) |
| 25 to 29 Years | 608 (79.5%) | 83 (13.7%) |
| 30 to 34 Years | 488 (62.3%) | 8 (1.6%) |
| 35 to 44 Years | 1,283 (81.1%) | 30 (2.3%) |
| 45 to 54 Years | 1,204 (68.9%) | 34 (2.8%) |
| 55 to 59 Years | 465 (49.9%) | 0 (0.0%) |
| 60 to 64 Years | 520 (51.5%) | 2 (0.4%) |
| 65 to 74 Years | 314 (18.3%) | 4 (1.3%) |
| 75 Years and over | 110 (8.1%) | 0 (0.0%) |
| Total | 5,673 (51.1%) | 284 (5.0%) |
Employment Status by Educational Attainment in Lamar County
According to labor force statistics for Lamar County, 67.0% of individuals (4,569) out of the total population between 25 and 64 years of age (6,819) are in the labor force, with 3.4% or 155 of them being unemployed. The group with the highest labor force participation rate are those with the educational attainment of bachelor's degree or higher, with 84.7% or 720 individuals in the labor force. Within the labor force, individuals with high school diploma education have the highest percentage of unemployment, with 7.3% or 133 of them being unemployed.
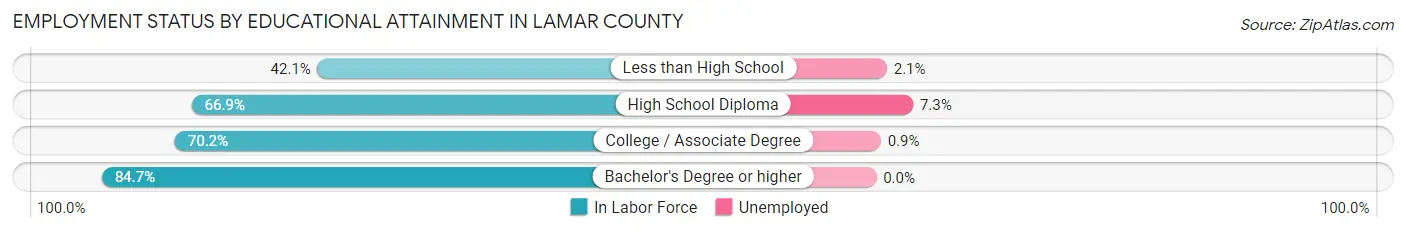
| Educational Attainment | In Labor Force | Unemployed |
| Less than High School | 376 (42.1%) | 19 (2.1%) |
| High School Diploma | 1,828 (66.9%) | 200 (7.3%) |
| College / Associate Degree | 1,644 (70.2%) | 21 (0.9%) |
| Bachelor's Degree or higher | 720 (84.7%) | 0 (0.0%) |
| Total | 4,569 (67.0%) | 232 (3.4%) |
Employment Occupations by Sex in Lamar County
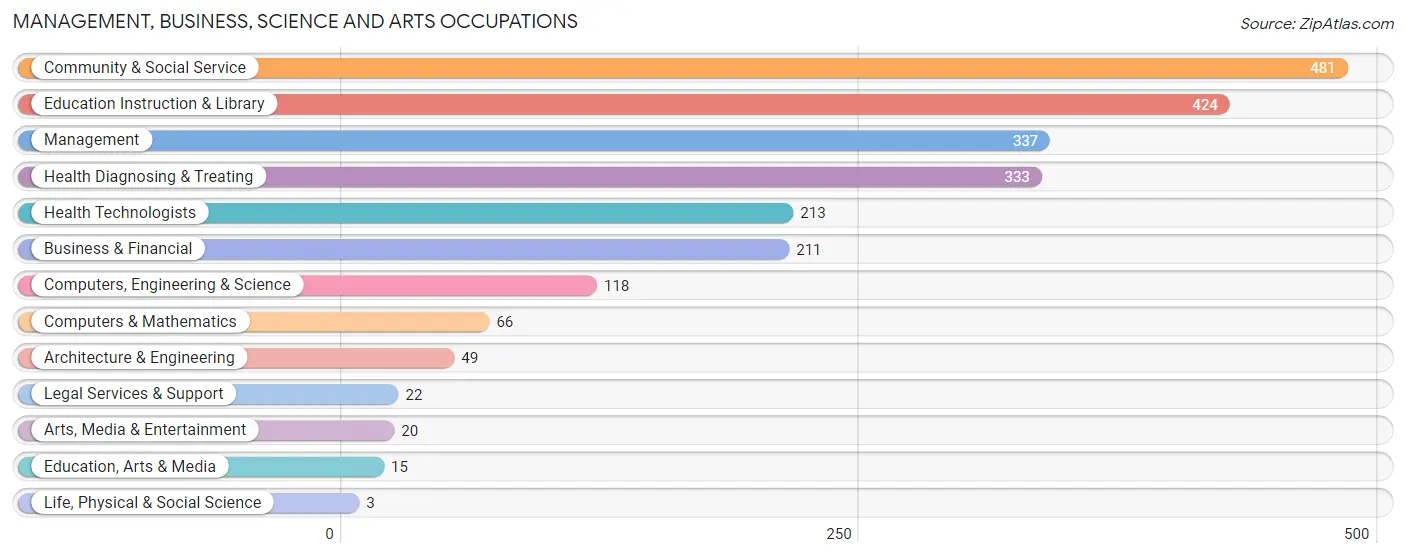
Management, Business, Science and Arts Occupations
The most common Management, Business, Science and Arts occupations in Lamar County are Community & Social Service (481 | 8.9%), Education Instruction & Library (424 | 7.9%), Management (337 | 6.3%), Health Diagnosing & Treating (333 | 6.2%), and Health Technologists (213 | 4.0%).
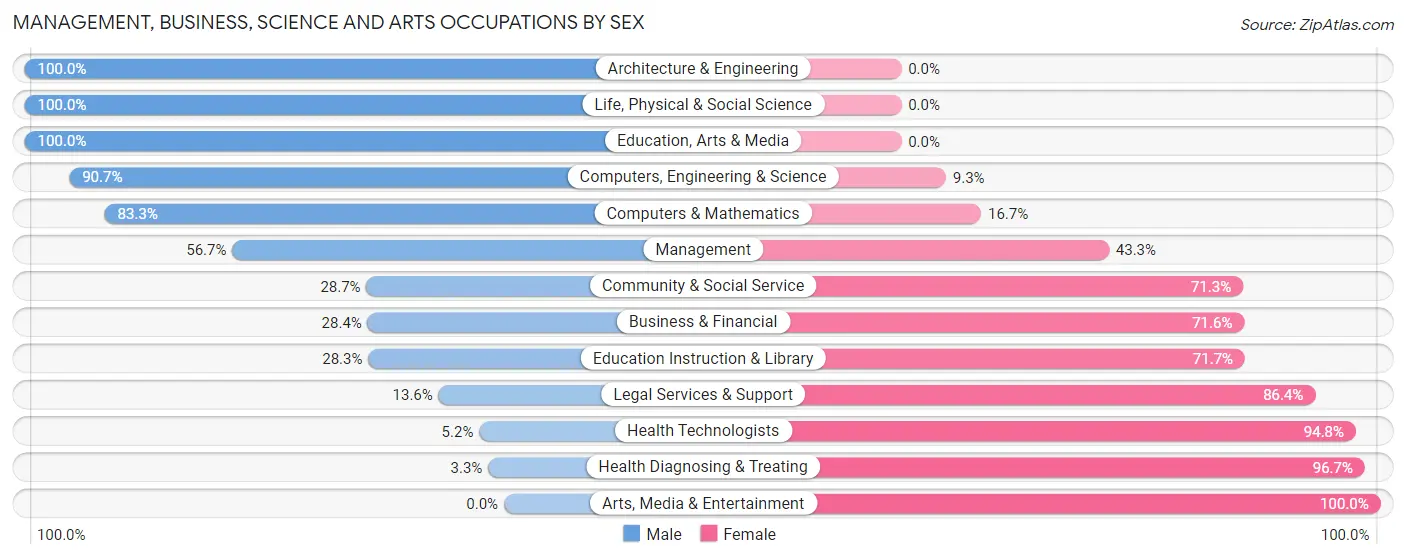
Management, Business, Science and Arts Occupations by Sex
Within the Management, Business, Science and Arts occupations in Lamar County, the most male-oriented occupations are Architecture & Engineering (100.0%), Life, Physical & Social Science (100.0%), and Education, Arts & Media (100.0%), while the most female-oriented occupations are Arts, Media & Entertainment (100.0%), Health Diagnosing & Treating (96.7%), and Health Technologists (94.8%).
| Occupation | Male | Female |
| Management | 191 (56.7%) | 146 (43.3%) |
| Business & Financial | 60 (28.4%) | 151 (71.6%) |
| Computers, Engineering & Science | 107 (90.7%) | 11 (9.3%) |
| Computers & Mathematics | 55 (83.3%) | 11 (16.7%) |
| Architecture & Engineering | 49 (100.0%) | 0 (0.0%) |
| Life, Physical & Social Science | 3 (100.0%) | 0 (0.0%) |
| Community & Social Service | 138 (28.7%) | 343 (71.3%) |
| Education, Arts & Media | 15 (100.0%) | 0 (0.0%) |
| Legal Services & Support | 3 (13.6%) | 19 (86.4%) |
| Education Instruction & Library | 120 (28.3%) | 304 (71.7%) |
| Arts, Media & Entertainment | 0 (0.0%) | 20 (100.0%) |
| Health Diagnosing & Treating | 11 (3.3%) | 322 (96.7%) |
| Health Technologists | 11 (5.2%) | 202 (94.8%) |
| Total (Category) | 507 (34.3%) | 973 (65.7%) |
| Total (Overall) | 2,925 (54.4%) | 2,456 (45.6%) |
Services Occupations
The most common Services occupations in Lamar County are Cleaning & Maintenance (301 | 5.6%), Personal Care & Service (192 | 3.6%), Healthcare Support (78 | 1.5%), Security & Protection (65 | 1.2%), and Food Preparation & Serving (65 | 1.2%).

Services Occupations by Sex
Within the Services occupations in Lamar County, the most male-oriented occupations are Security & Protection (100.0%), Firefighting & Prevention (100.0%), and Law Enforcement (100.0%), while the most female-oriented occupations are Healthcare Support (100.0%), Personal Care & Service (96.4%), and Food Preparation & Serving (52.3%).

| Occupation | Male | Female |
| Healthcare Support | 0 (0.0%) | 78 (100.0%) |
| Security & Protection | 65 (100.0%) | 0 (0.0%) |
| Firefighting & Prevention | 3 (100.0%) | 0 (0.0%) |
| Law Enforcement | 62 (100.0%) | 0 (0.0%) |
| Food Preparation & Serving | 31 (47.7%) | 34 (52.3%) |
| Cleaning & Maintenance | 199 (66.1%) | 102 (33.9%) |
| Personal Care & Service | 7 (3.6%) | 185 (96.4%) |
| Total (Category) | 302 (43.1%) | 399 (56.9%) |
| Total (Overall) | 2,925 (54.4%) | 2,456 (45.6%) |
Sales and Office Occupations
The most common Sales and Office occupations in Lamar County are Office & Administration (574 | 10.7%), and Sales & Related (504 | 9.4%).

Sales and Office Occupations by Sex

| Occupation | Male | Female |
| Sales & Related | 159 (31.6%) | 345 (68.4%) |
| Office & Administration | 44 (7.7%) | 530 (92.3%) |
| Total (Category) | 203 (18.8%) | 875 (81.2%) |
| Total (Overall) | 2,925 (54.4%) | 2,456 (45.6%) |
Natural Resources, Construction and Maintenance Occupations
The most common Natural Resources, Construction and Maintenance occupations in Lamar County are Installation, Maintenance & Repair (303 | 5.6%), Construction & Extraction (210 | 3.9%), and Farming, Fishing & Forestry (16 | 0.3%).

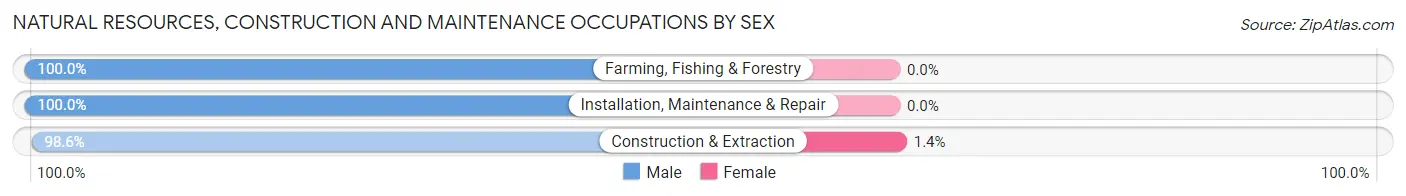
Natural Resources, Construction and Maintenance Occupations by Sex
| Occupation | Male | Female |
| Farming, Fishing & Forestry | 16 (100.0%) | 0 (0.0%) |
| Construction & Extraction | 207 (98.6%) | 3 (1.4%) |
| Installation, Maintenance & Repair | 303 (100.0%) | 0 (0.0%) |
| Total (Category) | 526 (99.4%) | 3 (0.6%) |
| Total (Overall) | 2,925 (54.4%) | 2,456 (45.6%) |
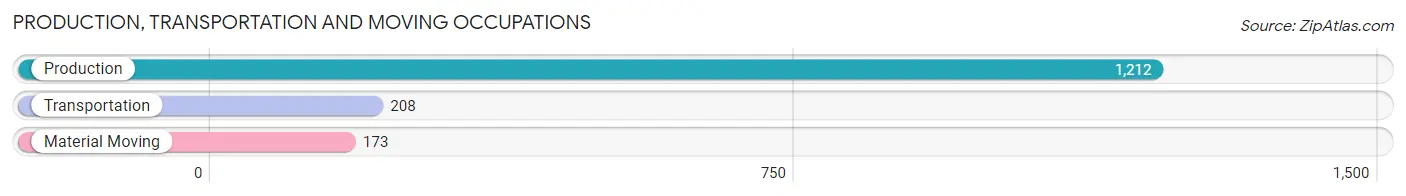
Production, Transportation and Moving Occupations
The most common Production, Transportation and Moving occupations in Lamar County are Production (1,212 | 22.5%), Transportation (208 | 3.9%), and Material Moving (173 | 3.2%).
Production, Transportation and Moving Occupations by Sex
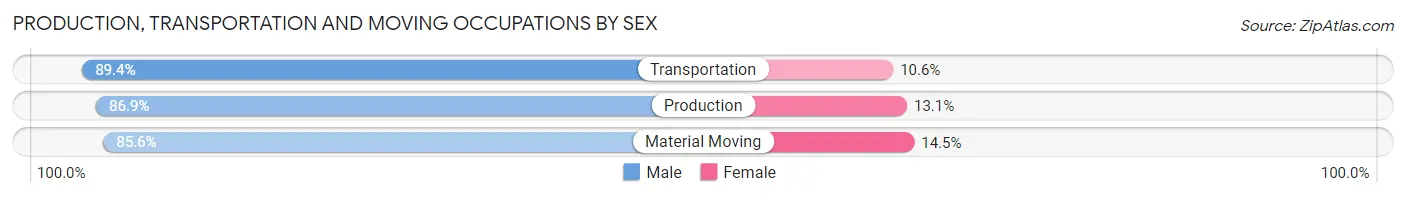
| Occupation | Male | Female |
| Production | 1,053 (86.9%) | 159 (13.1%) |
| Transportation | 186 (89.4%) | 22 (10.6%) |
| Material Moving | 148 (85.6%) | 25 (14.4%) |
| Total (Category) | 1,387 (87.1%) | 206 (12.9%) |
| Total (Overall) | 2,925 (54.4%) | 2,456 (45.6%) |
Employment Industries by Sex in Lamar County
Employment Industries in Lamar County
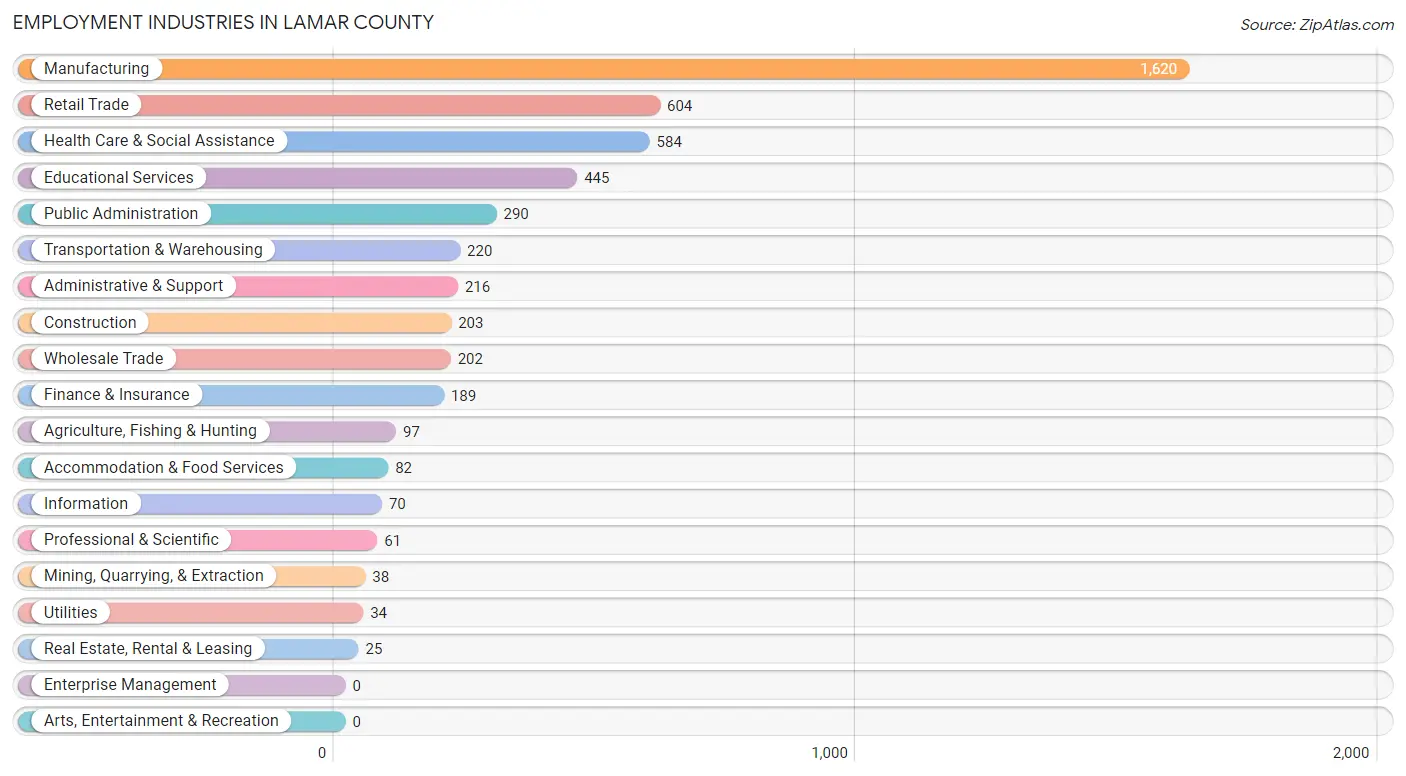
The major employment industries in Lamar County include Manufacturing (1,620 | 30.1%), Retail Trade (604 | 11.2%), Health Care & Social Assistance (584 | 10.8%), Educational Services (445 | 8.3%), and Public Administration (290 | 5.4%).
Employment Industries by Sex in Lamar County
The Lamar County industries that see more men than women are Mining, Quarrying, & Extraction (100.0%), Real Estate, Rental & Leasing (100.0%), and Manufacturing (86.1%), whereas the industries that tend to have a higher number of women are Health Care & Social Assistance (97.6%), Finance & Insurance (85.7%), and Accommodation & Food Services (68.3%).
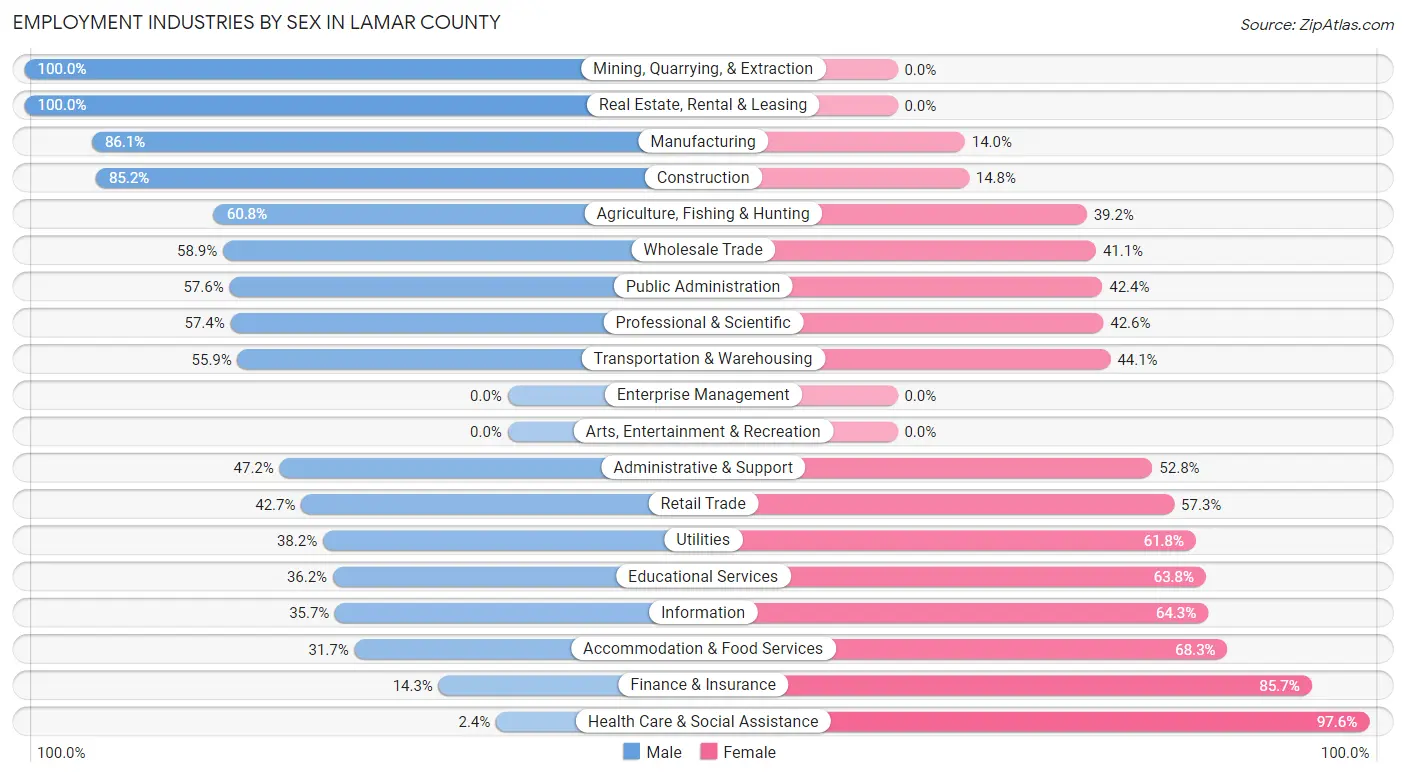
| Industry | Male | Female |
| Agriculture, Fishing & Hunting | 59 (60.8%) | 38 (39.2%) |
| Mining, Quarrying, & Extraction | 38 (100.0%) | 0 (0.0%) |
| Construction | 173 (85.2%) | 30 (14.8%) |
| Manufacturing | 1,394 (86.1%) | 226 (14.0%) |
| Wholesale Trade | 119 (58.9%) | 83 (41.1%) |
| Retail Trade | 258 (42.7%) | 346 (57.3%) |
| Transportation & Warehousing | 123 (55.9%) | 97 (44.1%) |
| Utilities | 13 (38.2%) | 21 (61.8%) |
| Information | 25 (35.7%) | 45 (64.3%) |
| Finance & Insurance | 27 (14.3%) | 162 (85.7%) |
| Real Estate, Rental & Leasing | 25 (100.0%) | 0 (0.0%) |
| Professional & Scientific | 35 (57.4%) | 26 (42.6%) |
| Enterprise Management | 0 (0.0%) | 0 (0.0%) |
| Administrative & Support | 102 (47.2%) | 114 (52.8%) |
| Educational Services | 161 (36.2%) | 284 (63.8%) |
| Health Care & Social Assistance | 14 (2.4%) | 570 (97.6%) |
| Arts, Entertainment & Recreation | 0 (0.0%) | 0 (0.0%) |
| Accommodation & Food Services | 26 (31.7%) | 56 (68.3%) |
| Public Administration | 167 (57.6%) | 123 (42.4%) |
| Total | 2,925 (54.4%) | 2,456 (45.6%) |
Education in Lamar County
School Enrollment in Lamar County
The most common levels of schooling among the 2,719 students in Lamar County are middle school (759 | 27.9%), high school (685 | 25.2%), and elementary school (558 | 20.5%).

| School Level | # Students | % Students |
| Nursery / Preschool | 206 | 7.6% |
| Kindergarten | 50 | 1.8% |
| Elementary School | 558 | 20.5% |
| Middle School | 759 | 27.9% |
| High School | 685 | 25.2% |
| College / Undergraduate | 433 | 15.9% |
| Graduate / Professional | 28 | 1.0% |
| Total | 2,719 | 100.0% |
School Enrollment by Age by Funding Source in Lamar County
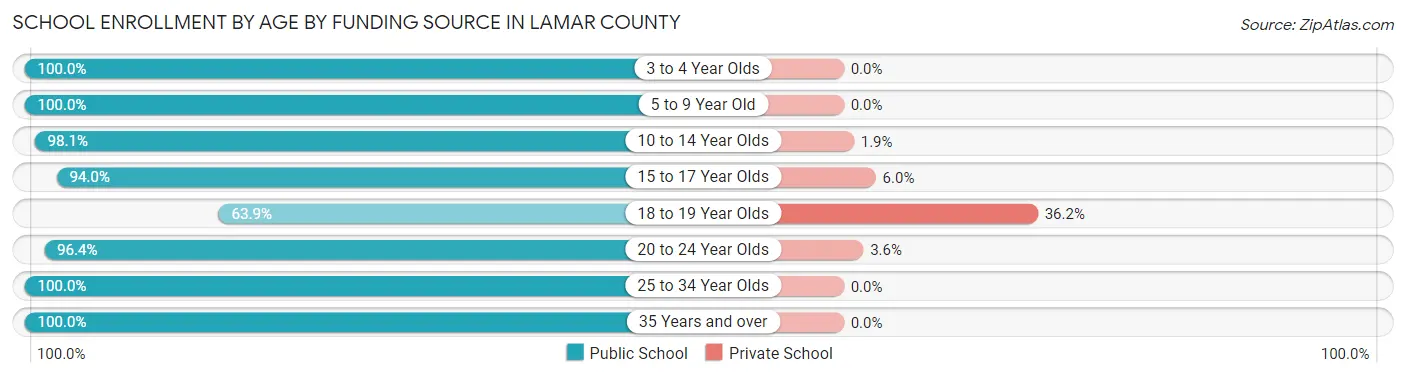
Out of a total of 2,719 students who are enrolled in schools in Lamar County, 98 (3.6%) attend a private institution, while the remaining 2,621 (96.4%) are enrolled in public schools. The age group of 18 to 19 year olds has the highest likelihood of being enrolled in private schools, with 47 (36.1% in the age bracket) enrolled. Conversely, the age group of 3 to 4 year olds has the lowest likelihood of being enrolled in a private school, with 197 (100.0% in the age bracket) attending a public institution.
| Age Bracket | Public School | Private School |
| 3 to 4 Year Olds | 197 (100.0%) | 0 (0.0%) |
| 5 to 9 Year Old | 569 (100.0%) | 0 (0.0%) |
| 10 to 14 Year Olds | 885 (98.1%) | 17 (1.9%) |
| 15 to 17 Year Olds | 410 (94.0%) | 26 (6.0%) |
| 18 to 19 Year Olds | 83 (63.8%) | 47 (36.1%) |
| 20 to 24 Year Olds | 212 (96.4%) | 8 (3.6%) |
| 25 to 34 Year Olds | 179 (100.0%) | 0 (0.0%) |
| 35 Years and over | 86 (100.0%) | 0 (0.0%) |
| Total | 2,621 (96.4%) | 98 (3.6%) |
Educational Attainment by Field of Study in Lamar County
Education (333 | 31.4%), business (289 | 27.2%), science & technology (99 | 9.3%), arts & humanities (90 | 8.5%), and bio, nature & agricultural (77 | 7.3%) are the most common fields of study among 1,061 individuals in Lamar County who have obtained a bachelor's degree or higher.

| Field of Study | # Graduates | % Graduates |
| Computers & Mathematics | 7 | 0.7% |
| Bio, Nature & Agricultural | 77 | 7.3% |
| Physical & Health Sciences | 18 | 1.7% |
| Psychology | 24 | 2.3% |
| Social Sciences | 23 | 2.2% |
| Engineering | 13 | 1.2% |
| Multidisciplinary Studies | 0 | 0.0% |
| Science & Technology | 99 | 9.3% |
| Business | 289 | 27.2% |
| Education | 333 | 31.4% |
| Literature & Languages | 32 | 3.0% |
| Liberal Arts & History | 56 | 5.3% |
| Visual & Performing Arts | 0 | 0.0% |
| Communications | 0 | 0.0% |
| Arts & Humanities | 90 | 8.5% |
| Total | 1,061 | 100.0% |
Transportation & Commute in Lamar County
Vehicle Availability by Sex in Lamar County
The most prevalent vehicle ownership categories in Lamar County are males with 2 vehicles (945, accounting for 32.6%) and females with 2 vehicles (715, making up 40.7%).
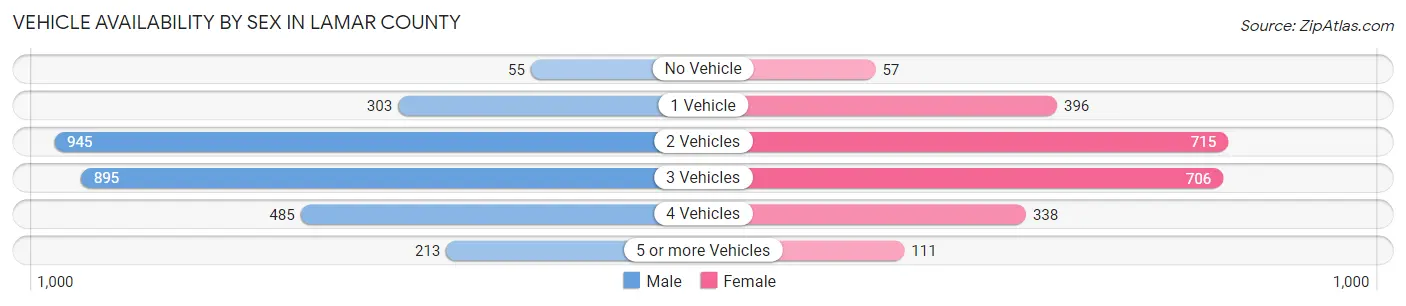
| Vehicles Available | Male | Female |
| No Vehicle | 55 (1.9%) | 57 (2.5%) |
| 1 Vehicle | 303 (10.5%) | 396 (17.1%) |
| 2 Vehicles | 945 (32.6%) | 715 (30.8%) |
| 3 Vehicles | 895 (30.9%) | 706 (30.4%) |
| 4 Vehicles | 485 (16.8%) | 338 (14.5%) |
| 5 or more Vehicles | 213 (7.3%) | 111 (4.8%) |
| Total | 2,896 (100.0%) | 2,323 (100.0%) |
Commute Time in Lamar County
The most frequently occuring commute durations in Lamar County are 20 to 24 minutes (755 commuters, 15.0%), 5 to 9 minutes (675 commuters, 13.4%), and 30 to 34 minutes (629 commuters, 12.5%).
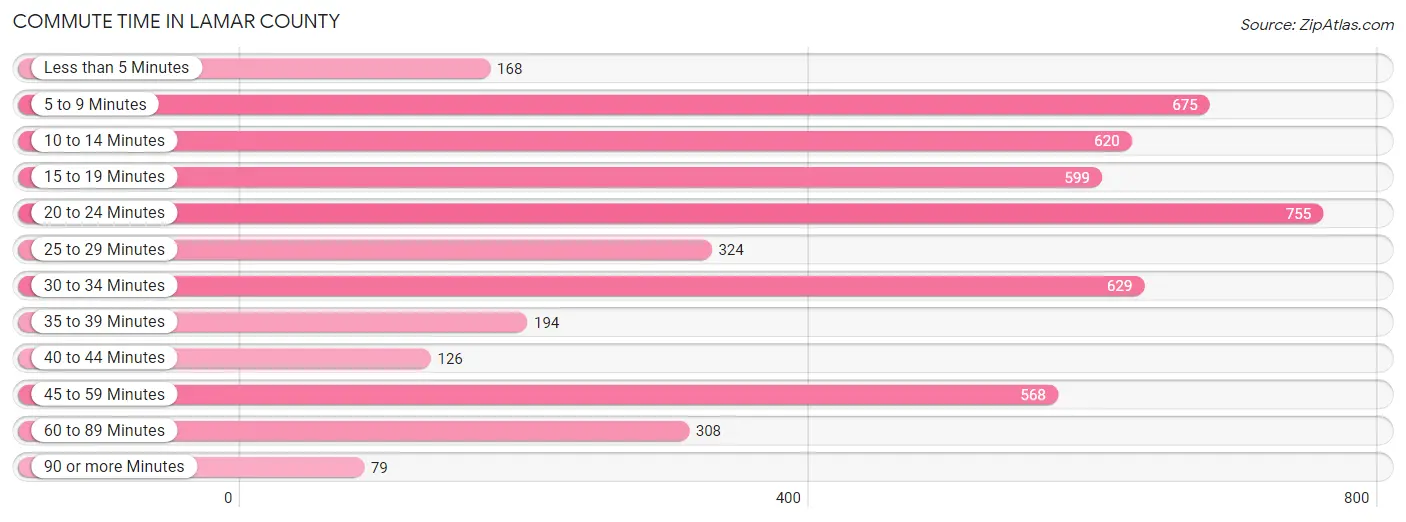
| Commute Time | # Commuters | % Commuters |
| Less than 5 Minutes | 168 | 3.3% |
| 5 to 9 Minutes | 675 | 13.4% |
| 10 to 14 Minutes | 620 | 12.3% |
| 15 to 19 Minutes | 599 | 11.9% |
| 20 to 24 Minutes | 755 | 15.0% |
| 25 to 29 Minutes | 324 | 6.4% |
| 30 to 34 Minutes | 629 | 12.5% |
| 35 to 39 Minutes | 194 | 3.8% |
| 40 to 44 Minutes | 126 | 2.5% |
| 45 to 59 Minutes | 568 | 11.3% |
| 60 to 89 Minutes | 308 | 6.1% |
| 90 or more Minutes | 79 | 1.6% |
Commute Time by Sex in Lamar County
The most common commute times in Lamar County are 20 to 24 minutes (476 commuters, 17.0%) for males and 15 to 19 minutes (353 commuters, 15.8%) for females.
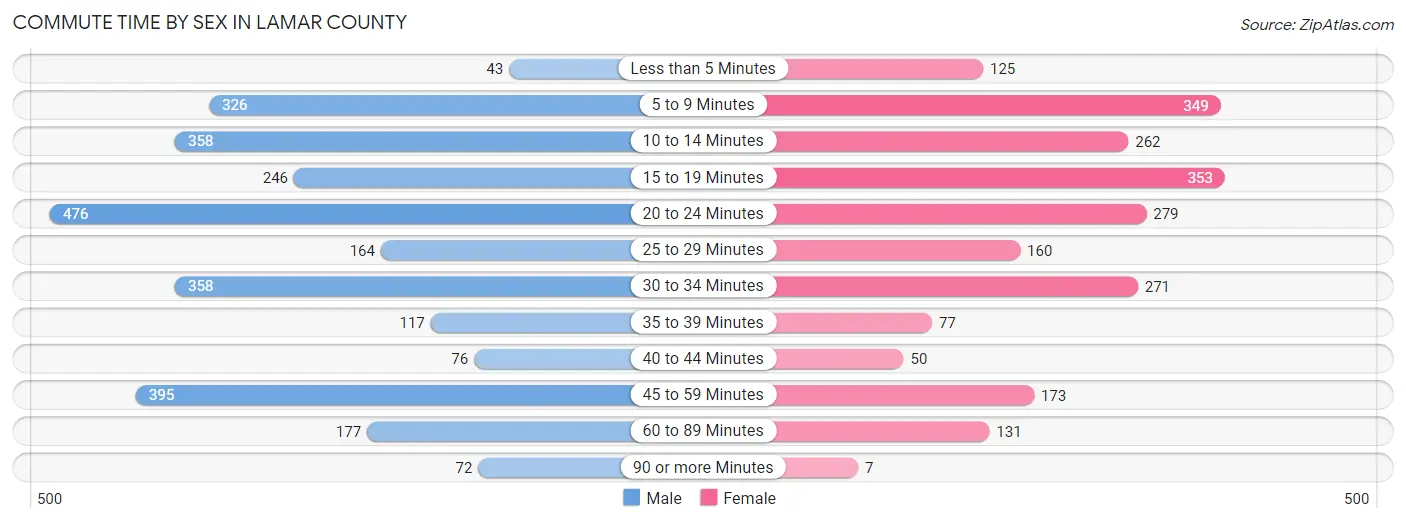
| Commute Time | Male | Female |
| Less than 5 Minutes | 43 (1.5%) | 125 (5.6%) |
| 5 to 9 Minutes | 326 (11.6%) | 349 (15.6%) |
| 10 to 14 Minutes | 358 (12.8%) | 262 (11.7%) |
| 15 to 19 Minutes | 246 (8.8%) | 353 (15.8%) |
| 20 to 24 Minutes | 476 (17.0%) | 279 (12.5%) |
| 25 to 29 Minutes | 164 (5.8%) | 160 (7.1%) |
| 30 to 34 Minutes | 358 (12.8%) | 271 (12.1%) |
| 35 to 39 Minutes | 117 (4.2%) | 77 (3.4%) |
| 40 to 44 Minutes | 76 (2.7%) | 50 (2.2%) |
| 45 to 59 Minutes | 395 (14.1%) | 173 (7.7%) |
| 60 to 89 Minutes | 177 (6.3%) | 131 (5.9%) |
| 90 or more Minutes | 72 (2.6%) | 7 (0.3%) |
Time of Departure to Work by Sex in Lamar County
The most frequent times of departure to work in Lamar County are 7:00 AM to 7:29 AM (427, 15.2%) for males and 7:00 AM to 7:29 AM (564, 25.2%) for females.
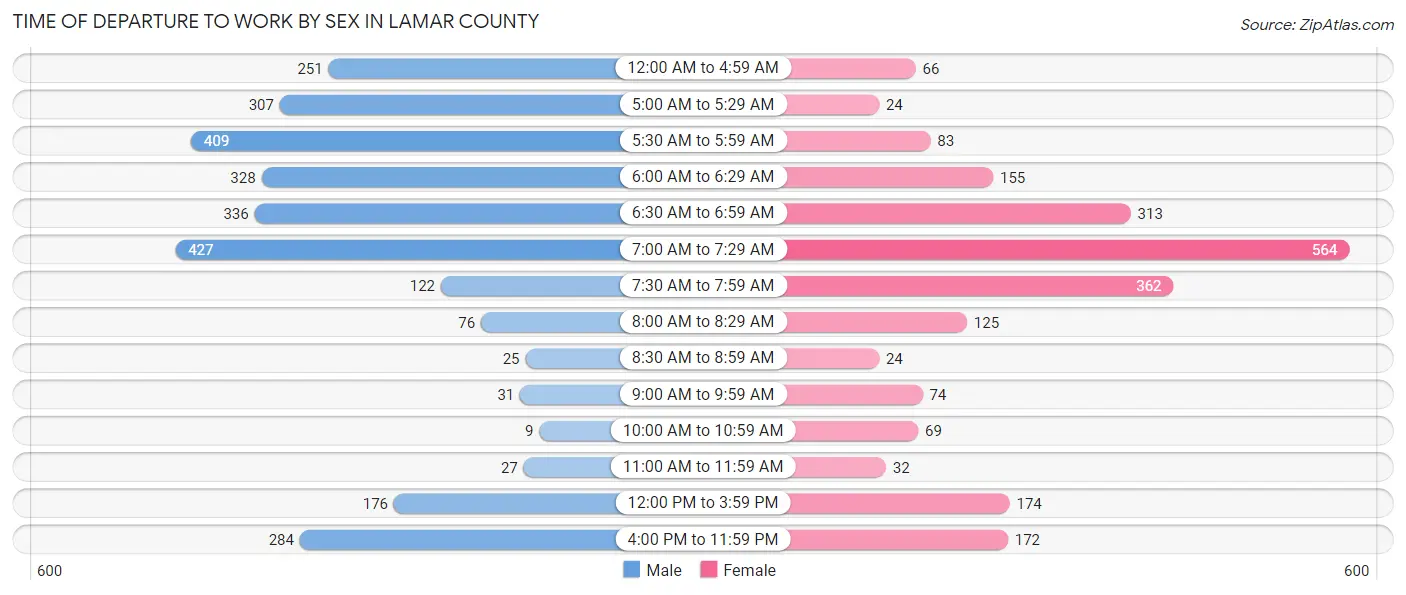
| Time of Departure | Male | Female |
| 12:00 AM to 4:59 AM | 251 (8.9%) | 66 (2.9%) |
| 5:00 AM to 5:29 AM | 307 (10.9%) | 24 (1.1%) |
| 5:30 AM to 5:59 AM | 409 (14.6%) | 83 (3.7%) |
| 6:00 AM to 6:29 AM | 328 (11.7%) | 155 (6.9%) |
| 6:30 AM to 6:59 AM | 336 (12.0%) | 313 (14.0%) |
| 7:00 AM to 7:29 AM | 427 (15.2%) | 564 (25.2%) |
| 7:30 AM to 7:59 AM | 122 (4.3%) | 362 (16.2%) |
| 8:00 AM to 8:29 AM | 76 (2.7%) | 125 (5.6%) |
| 8:30 AM to 8:59 AM | 25 (0.9%) | 24 (1.1%) |
| 9:00 AM to 9:59 AM | 31 (1.1%) | 74 (3.3%) |
| 10:00 AM to 10:59 AM | 9 (0.3%) | 69 (3.1%) |
| 11:00 AM to 11:59 AM | 27 (1.0%) | 32 (1.4%) |
| 12:00 PM to 3:59 PM | 176 (6.3%) | 174 (7.8%) |
| 4:00 PM to 11:59 PM | 284 (10.1%) | 172 (7.7%) |
| Total | 2,808 (100.0%) | 2,237 (100.0%) |
Housing Occupancy in Lamar County
Occupancy by Ownership in Lamar County
Of the total 5,168 dwellings in Lamar County, owner-occupied units account for 3,858 (74.7%), while renter-occupied units make up 1,310 (25.4%).
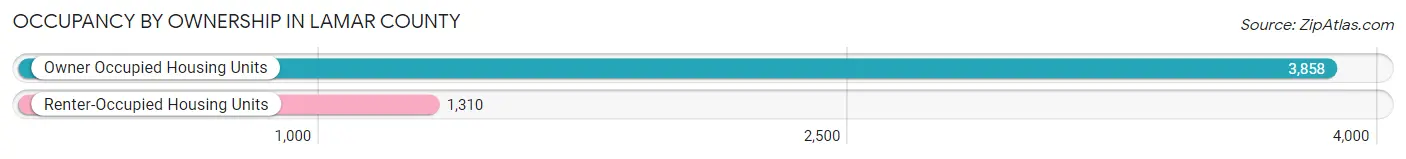
| Occupancy | # Housing Units | % Housing Units |
| Owner Occupied Housing Units | 3,858 | 74.7% |
| Renter-Occupied Housing Units | 1,310 | 25.4% |
| Total Occupied Housing Units | 5,168 | 100.0% |
Occupancy by Household Size in Lamar County
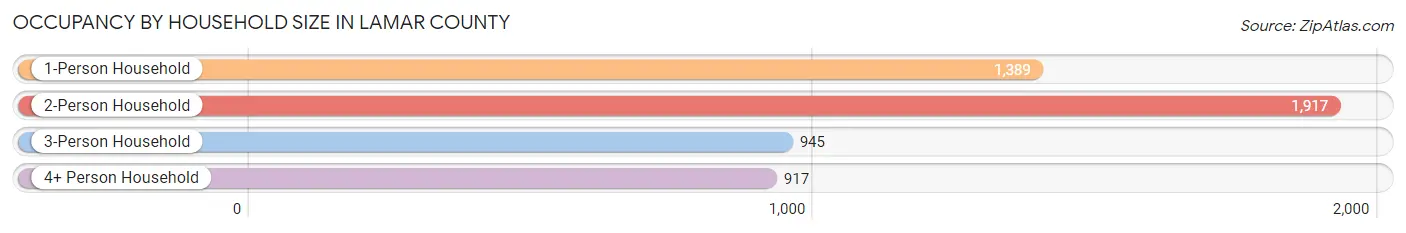
| Household Size | # Housing Units | % Housing Units |
| 1-Person Household | 1,389 | 26.9% |
| 2-Person Household | 1,917 | 37.1% |
| 3-Person Household | 945 | 18.3% |
| 4+ Person Household | 917 | 17.7% |
| Total Housing Units | 5,168 | 100.0% |
Occupancy by Ownership by Household Size in Lamar County

| Household Size | Owner-occupied | Renter-occupied |
| 1-Person Household | 789 (56.8%) | 600 (43.2%) |
| 2-Person Household | 1,501 (78.3%) | 416 (21.7%) |
| 3-Person Household | 736 (77.9%) | 209 (22.1%) |
| 4+ Person Household | 832 (90.7%) | 85 (9.3%) |
| Total Housing Units | 3,858 (74.7%) | 1,310 (25.4%) |
Occupancy by Educational Attainment in Lamar County
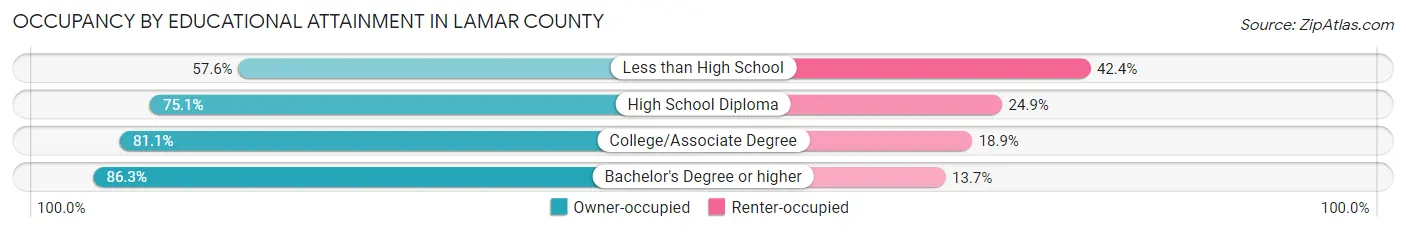
| Household Size | Owner-occupied | Renter-occupied |
| Less than High School | 621 (57.6%) | 457 (42.4%) |
| High School Diploma | 1,362 (75.1%) | 451 (24.9%) |
| College/Associate Degree | 1,395 (81.1%) | 326 (18.9%) |
| Bachelor's Degree or higher | 480 (86.3%) | 76 (13.7%) |
Occupancy by Age of Householder in Lamar County
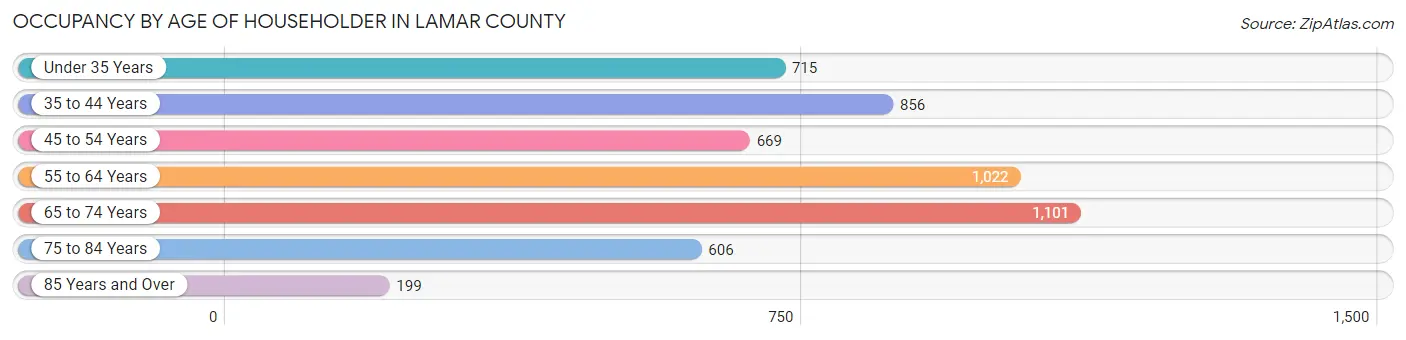
| Age Bracket | # Households | % Households |
| Under 35 Years | 715 | 13.8% |
| 35 to 44 Years | 856 | 16.6% |
| 45 to 54 Years | 669 | 13.0% |
| 55 to 64 Years | 1,022 | 19.8% |
| 65 to 74 Years | 1,101 | 21.3% |
| 75 to 84 Years | 606 | 11.7% |
| 85 Years and Over | 199 | 3.8% |
| Total | 5,168 | 100.0% |
Housing Finances in Lamar County
Median Income by Occupancy in Lamar County
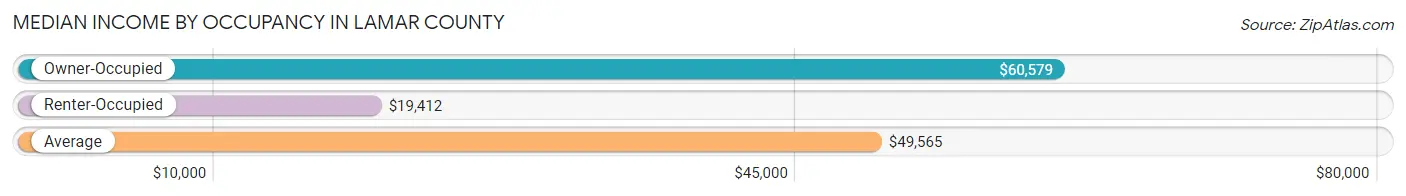
| Occupancy Type | # Households | Median Income |
| Owner-Occupied | 3,858 (74.7%) | $60,579 |
| Renter-Occupied | 1,310 (25.4%) | $19,412 |
| Average | 5,168 (100.0%) | $49,565 |
Occupancy by Householder Income Bracket in Lamar County
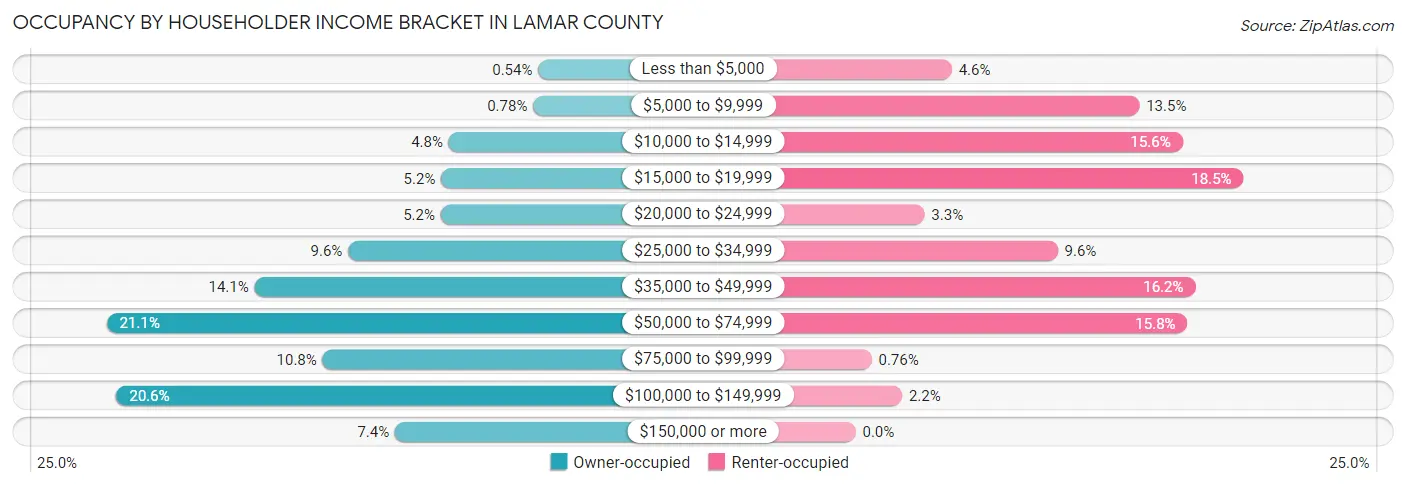
| Income Bracket | Owner-occupied | Renter-occupied |
| Less than $5,000 | 21 (0.5%) | 60 (4.6%) |
| $5,000 to $9,999 | 30 (0.8%) | 177 (13.5%) |
| $10,000 to $14,999 | 185 (4.8%) | 204 (15.6%) |
| $15,000 to $19,999 | 199 (5.2%) | 242 (18.5%) |
| $20,000 to $24,999 | 200 (5.2%) | 43 (3.3%) |
| $25,000 to $34,999 | 370 (9.6%) | 126 (9.6%) |
| $35,000 to $49,999 | 542 (14.1%) | 212 (16.2%) |
| $50,000 to $74,999 | 814 (21.1%) | 207 (15.8%) |
| $75,000 to $99,999 | 417 (10.8%) | 10 (0.8%) |
| $100,000 to $149,999 | 796 (20.6%) | 29 (2.2%) |
| $150,000 or more | 284 (7.4%) | 0 (0.0%) |
| Total | 3,858 (100.0%) | 1,310 (100.0%) |
Monthly Housing Cost Tiers in Lamar County
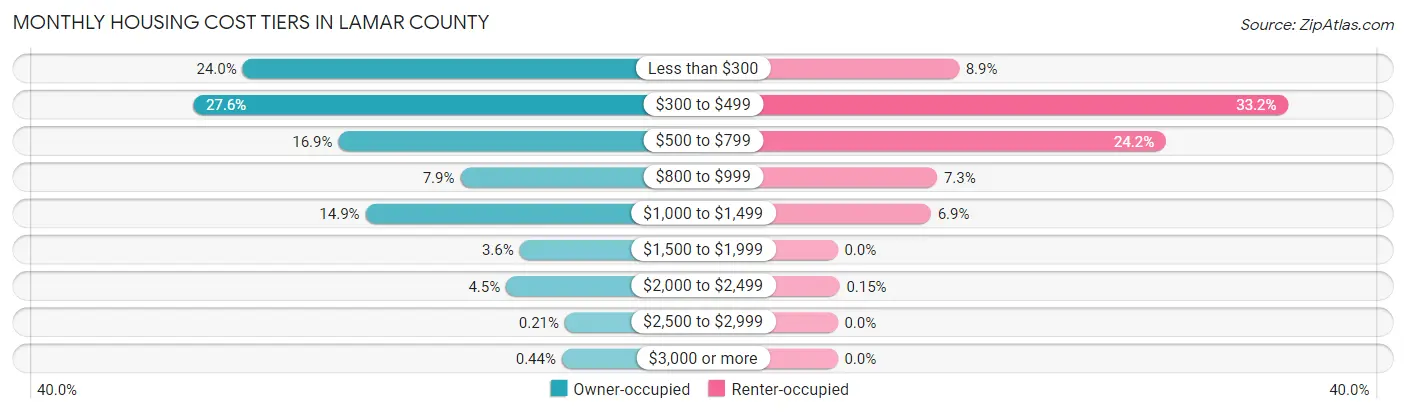
| Monthly Cost | Owner-occupied | Renter-occupied |
| Less than $300 | 924 (23.9%) | 117 (8.9%) |
| $300 to $499 | 1,065 (27.6%) | 435 (33.2%) |
| $500 to $799 | 652 (16.9%) | 317 (24.2%) |
| $800 to $999 | 305 (7.9%) | 96 (7.3%) |
| $1,000 to $1,499 | 575 (14.9%) | 90 (6.9%) |
| $1,500 to $1,999 | 137 (3.5%) | 0 (0.0%) |
| $2,000 to $2,499 | 175 (4.5%) | 2 (0.2%) |
| $2,500 to $2,999 | 8 (0.2%) | 0 (0.0%) |
| $3,000 or more | 17 (0.4%) | 0 (0.0%) |
| Total | 3,858 (100.0%) | 1,310 (100.0%) |
Physical Housing Characteristics in Lamar County
Housing Structures in Lamar County

| Structure Type | # Housing Units | % Housing Units |
| Single Unit, Detached | 3,554 | 68.8% |
| Single Unit, Attached | 42 | 0.8% |
| 2 Unit Apartments | 285 | 5.5% |
| 3 or 4 Unit Apartments | 125 | 2.4% |
| 5 to 9 Unit Apartments | 74 | 1.4% |
| 10 or more Apartments | 81 | 1.6% |
| Mobile Home / Other | 1,007 | 19.5% |
| Total | 5,168 | 100.0% |
Housing Structures by Occupancy in Lamar County

| Structure Type | Owner-occupied | Renter-occupied |
| Single Unit, Detached | 3,004 (84.5%) | 550 (15.5%) |
| Single Unit, Attached | 29 (69.1%) | 13 (30.9%) |
| 2 Unit Apartments | 0 (0.0%) | 285 (100.0%) |
| 3 or 4 Unit Apartments | 0 (0.0%) | 125 (100.0%) |
| 5 to 9 Unit Apartments | 0 (0.0%) | 74 (100.0%) |
| 10 or more Apartments | 0 (0.0%) | 81 (100.0%) |
| Mobile Home / Other | 825 (81.9%) | 182 (18.1%) |
| Total | 3,858 (74.7%) | 1,310 (25.4%) |
Housing Structures by Number of Rooms in Lamar County
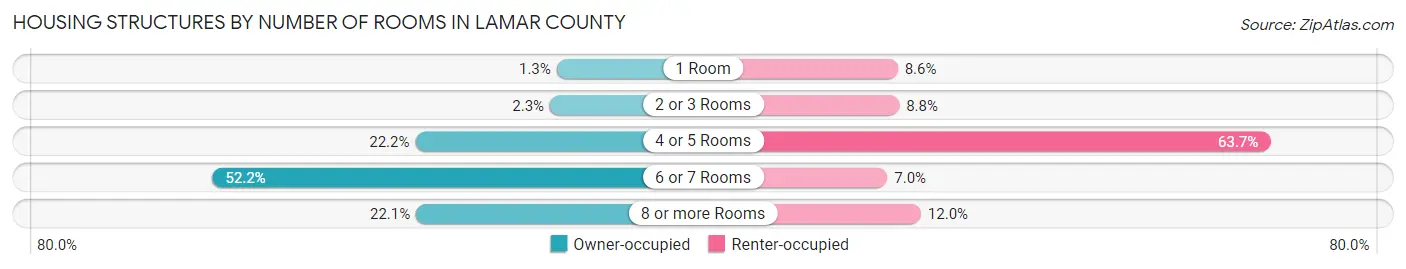
| Number of Rooms | Owner-occupied | Renter-occupied |
| 1 Room | 49 (1.3%) | 112 (8.6%) |
| 2 or 3 Rooms | 87 (2.3%) | 115 (8.8%) |
| 4 or 5 Rooms | 856 (22.2%) | 834 (63.7%) |
| 6 or 7 Rooms | 2,014 (52.2%) | 92 (7.0%) |
| 8 or more Rooms | 852 (22.1%) | 157 (12.0%) |
| Total | 3,858 (100.0%) | 1,310 (100.0%) |
Housing Structure by Heating Type in Lamar County
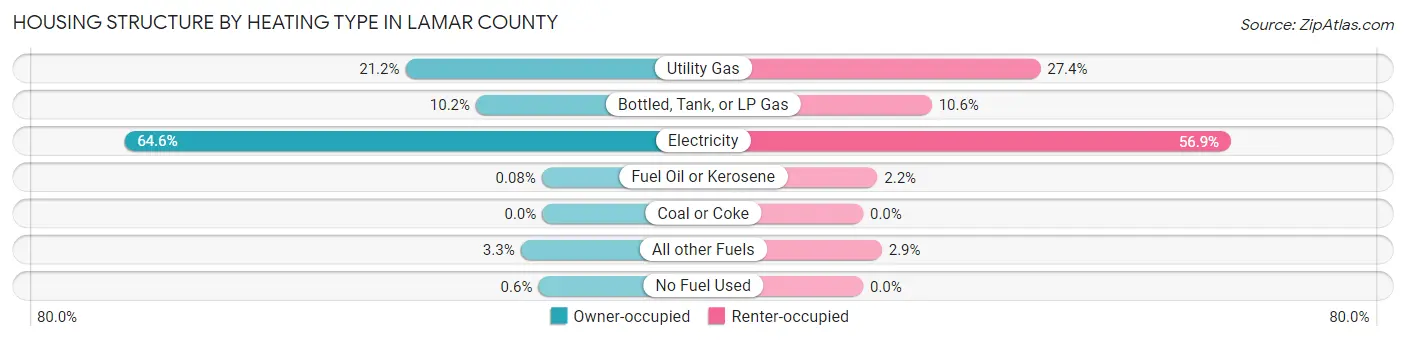
| Heating Type | Owner-occupied | Renter-occupied |
| Utility Gas | 816 (21.1%) | 359 (27.4%) |
| Bottled, Tank, or LP Gas | 395 (10.2%) | 139 (10.6%) |
| Electricity | 2,492 (64.6%) | 745 (56.9%) |
| Fuel Oil or Kerosene | 3 (0.1%) | 29 (2.2%) |
| Coal or Coke | 0 (0.0%) | 0 (0.0%) |
| All other Fuels | 129 (3.3%) | 38 (2.9%) |
| No Fuel Used | 23 (0.6%) | 0 (0.0%) |
| Total | 3,858 (100.0%) | 1,310 (100.0%) |
Household Vehicle Usage in Lamar County
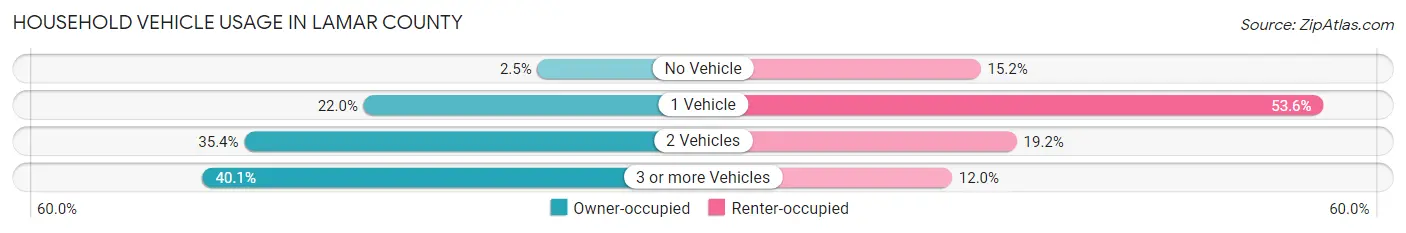
| Vehicles per Household | Owner-occupied | Renter-occupied |
| No Vehicle | 98 (2.5%) | 199 (15.2%) |
| 1 Vehicle | 849 (22.0%) | 702 (53.6%) |
| 2 Vehicles | 1,365 (35.4%) | 252 (19.2%) |
| 3 or more Vehicles | 1,546 (40.1%) | 157 (12.0%) |
| Total | 3,858 (100.0%) | 1,310 (100.0%) |
Real Estate & Mortgages in Lamar County
Real Estate and Mortgage Overview in Lamar County
| Characteristic | Without Mortgage | With Mortgage |
| Housing Units | 2,419 | 1,439 |
| Median Property Value | $96,500 | $123,100 |
| Median Household Income | $46,250 | $163 |
| Monthly Housing Costs | $355 | $0 |
| Real Estate Taxes | $199 | $202 |
Property Value by Mortgage Status in Lamar County
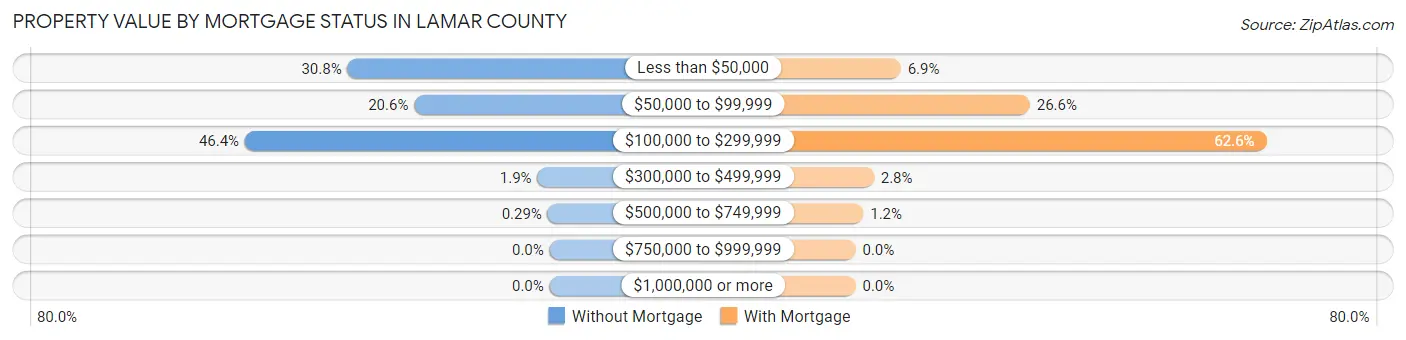
| Property Value | Without Mortgage | With Mortgage |
| Less than $50,000 | 745 (30.8%) | 99 (6.9%) |
| $50,000 to $99,999 | 499 (20.6%) | 382 (26.6%) |
| $100,000 to $299,999 | 1,123 (46.4%) | 901 (62.6%) |
| $300,000 to $499,999 | 45 (1.9%) | 40 (2.8%) |
| $500,000 to $749,999 | 7 (0.3%) | 17 (1.2%) |
| $750,000 to $999,999 | 0 (0.0%) | 0 (0.0%) |
| $1,000,000 or more | 0 (0.0%) | 0 (0.0%) |
| Total | 2,419 (100.0%) | 1,439 (100.0%) |
Household Income by Mortgage Status in Lamar County
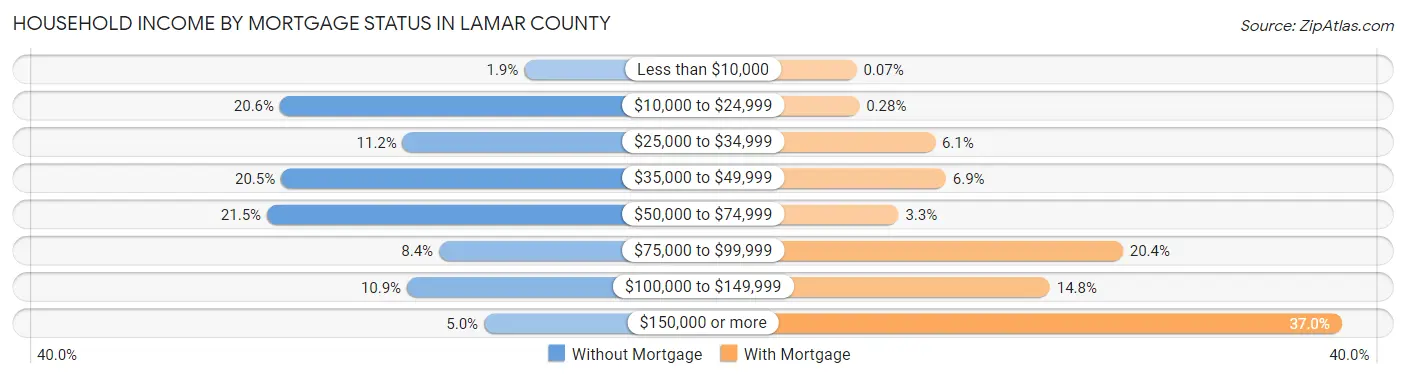
| Household Income | Without Mortgage | With Mortgage |
| Less than $10,000 | 47 (1.9%) | 1 (0.1%) |
| $10,000 to $24,999 | 497 (20.5%) | 4 (0.3%) |
| $25,000 to $34,999 | 271 (11.2%) | 87 (6.0%) |
| $35,000 to $49,999 | 495 (20.5%) | 99 (6.9%) |
| $50,000 to $74,999 | 521 (21.5%) | 47 (3.3%) |
| $75,000 to $99,999 | 204 (8.4%) | 293 (20.4%) |
| $100,000 to $149,999 | 263 (10.9%) | 213 (14.8%) |
| $150,000 or more | 121 (5.0%) | 533 (37.0%) |
| Total | 2,419 (100.0%) | 1,439 (100.0%) |
Property Value to Household Income Ratio in Lamar County
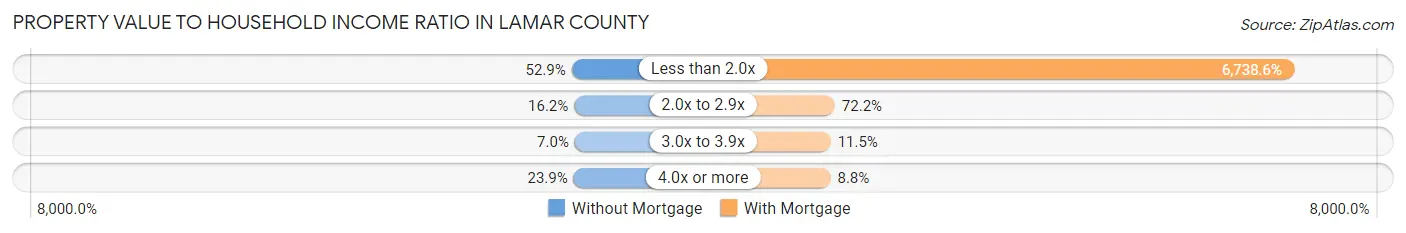
| Value-to-Income Ratio | Without Mortgage | With Mortgage |
| Less than 2.0x | 1,279 (52.9%) | 96,969 (6,738.6%) |
| 2.0x to 2.9x | 391 (16.2%) | 1,039 (72.2%) |
| 3.0x to 3.9x | 170 (7.0%) | 165 (11.5%) |
| 4.0x or more | 577 (23.8%) | 127 (8.8%) |
| Total | 2,419 (100.0%) | 1,439 (100.0%) |
Real Estate Taxes by Mortgage Status in Lamar County
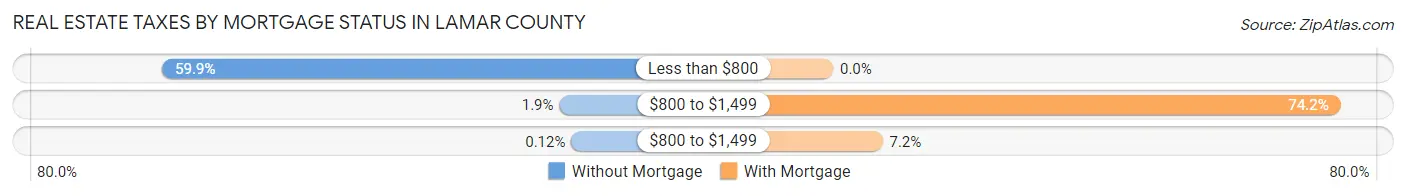
| Property Taxes | Without Mortgage | With Mortgage |
| Less than $800 | 1,449 (59.9%) | 0 (0.0%) |
| $800 to $1,499 | 45 (1.9%) | 1,067 (74.2%) |
| $800 to $1,499 | 3 (0.1%) | 104 (7.2%) |
| Total | 2,419 (100.0%) | 1,439 (100.0%) |
Health & Disability in Lamar County
Health Insurance Coverage by Age in Lamar County
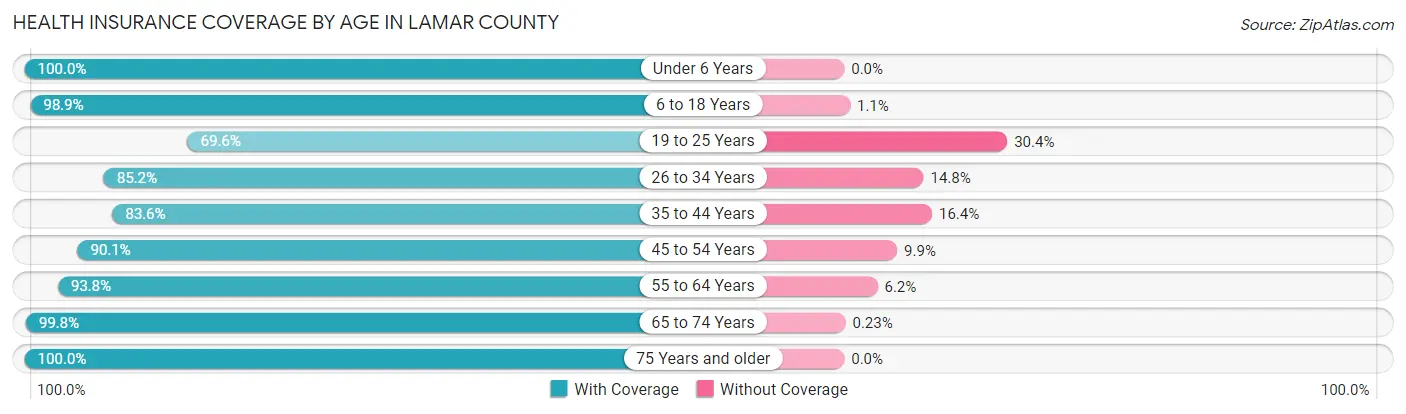
| Age Bracket | With Coverage | Without Coverage |
| Under 6 Years | 999 (100.0%) | 0 (0.0%) |
| 6 to 18 Years | 2,136 (98.9%) | 23 (1.1%) |
| 19 to 25 Years | 694 (69.6%) | 303 (30.4%) |
| 26 to 34 Years | 1,159 (85.2%) | 201 (14.8%) |
| 35 to 44 Years | 1,309 (83.6%) | 256 (16.4%) |
| 45 to 54 Years | 1,536 (90.1%) | 168 (9.9%) |
| 55 to 64 Years | 1,817 (93.8%) | 120 (6.2%) |
| 65 to 74 Years | 1,700 (99.8%) | 4 (0.2%) |
| 75 Years and older | 1,302 (100.0%) | 0 (0.0%) |
| Total | 12,652 (92.2%) | 1,075 (7.8%) |
Health Insurance Coverage by Citizenship Status in Lamar County
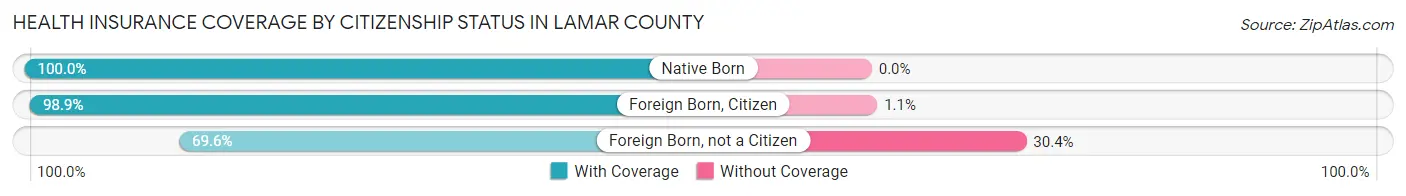
| Citizenship Status | With Coverage | Without Coverage |
| Native Born | 999 (100.0%) | 0 (0.0%) |
| Foreign Born, Citizen | 2,136 (98.9%) | 23 (1.1%) |
| Foreign Born, not a Citizen | 694 (69.6%) | 303 (30.4%) |
Health Insurance Coverage by Household Income in Lamar County

| Household Income | With Coverage | Without Coverage |
| Under $25,000 | 2,022 (90.5%) | 211 (9.5%) |
| $25,000 to $49,999 | 2,709 (86.0%) | 442 (14.0%) |
| $50,000 to $74,999 | 2,755 (91.9%) | 244 (8.1%) |
| $75,000 to $99,999 | 1,316 (96.8%) | 43 (3.2%) |
| $100,000 and over | 3,832 (96.7%) | 131 (3.3%) |
Public vs Private Health Insurance Coverage by Age in Lamar County
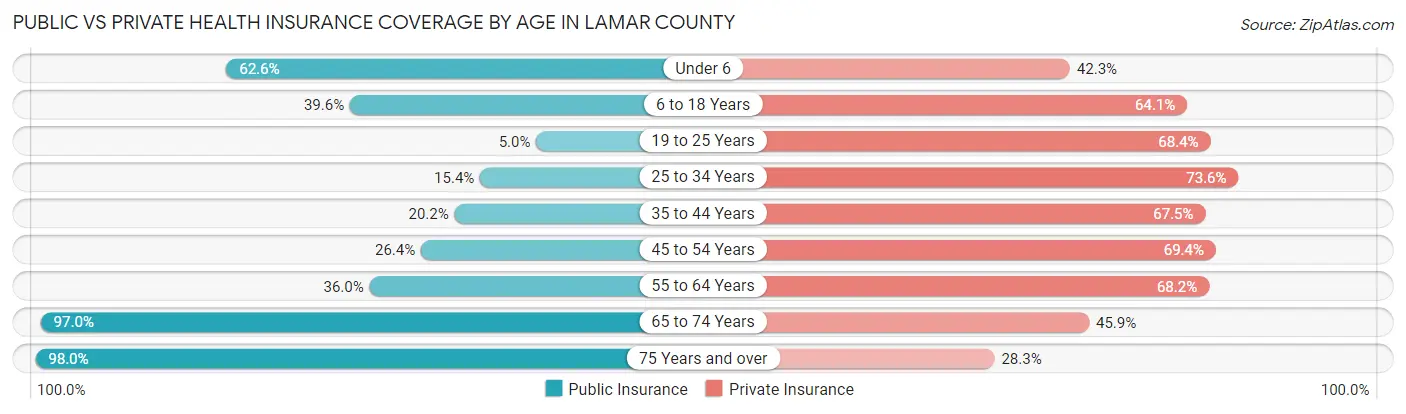
| Age Bracket | Public Insurance | Private Insurance |
| Under 6 | 625 (62.6%) | 423 (42.3%) |
| 6 to 18 Years | 855 (39.6%) | 1,384 (64.1%) |
| 19 to 25 Years | 50 (5.0%) | 682 (68.4%) |
| 25 to 34 Years | 210 (15.4%) | 1,001 (73.6%) |
| 35 to 44 Years | 316 (20.2%) | 1,056 (67.5%) |
| 45 to 54 Years | 450 (26.4%) | 1,183 (69.4%) |
| 55 to 64 Years | 697 (36.0%) | 1,320 (68.1%) |
| 65 to 74 Years | 1,653 (97.0%) | 782 (45.9%) |
| 75 Years and over | 1,276 (98.0%) | 369 (28.3%) |
| Total | 6,132 (44.7%) | 8,200 (59.7%) |
Disability Status by Sex by Age in Lamar County
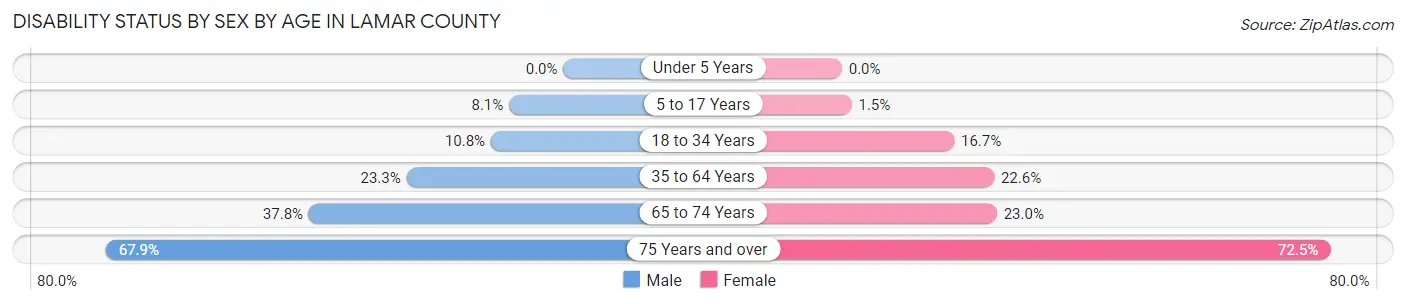
| Age Bracket | Male | Female |
| Under 5 Years | 0 (0.0%) | 0 (0.0%) |
| 5 to 17 Years | 84 (8.1%) | 15 (1.5%) |
| 18 to 34 Years | 136 (10.7%) | 204 (16.7%) |
| 35 to 64 Years | 596 (23.3%) | 598 (22.6%) |
| 65 to 74 Years | 317 (37.8%) | 199 (23.0%) |
| 75 Years and over | 373 (67.9%) | 546 (72.5%) |
Disability Class by Sex by Age in Lamar County
Disability Class: Hearing Difficulty
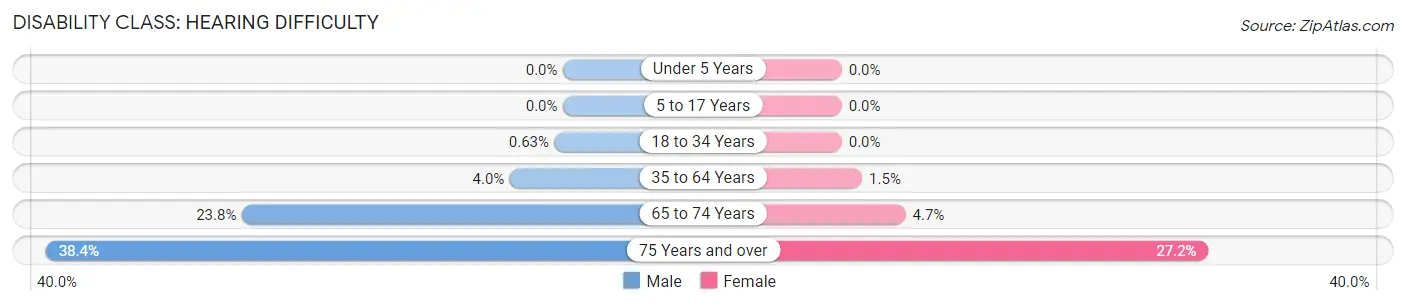
| Age Bracket | Male | Female |
| Under 5 Years | 0 (0.0%) | 0 (0.0%) |
| 5 to 17 Years | 0 (0.0%) | 0 (0.0%) |
| 18 to 34 Years | 8 (0.6%) | 0 (0.0%) |
| 35 to 64 Years | 101 (4.0%) | 40 (1.5%) |
| 65 to 74 Years | 200 (23.8%) | 41 (4.7%) |
| 75 Years and over | 211 (38.4%) | 205 (27.2%) |
Disability Class: Vision Difficulty
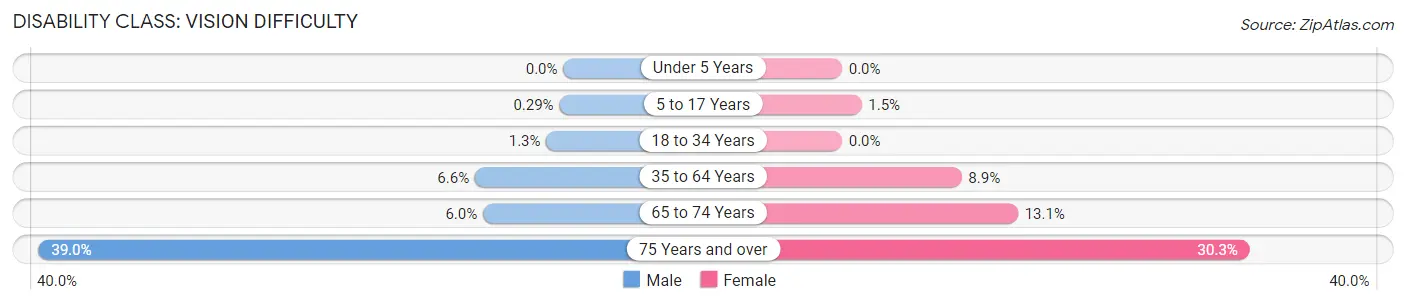
| Age Bracket | Male | Female |
| Under 5 Years | 0 (0.0%) | 0 (0.0%) |
| 5 to 17 Years | 3 (0.3%) | 15 (1.5%) |
| 18 to 34 Years | 16 (1.3%) | 0 (0.0%) |
| 35 to 64 Years | 168 (6.6%) | 235 (8.9%) |
| 65 to 74 Years | 50 (6.0%) | 113 (13.1%) |
| 75 Years and over | 214 (39.0%) | 228 (30.3%) |
Disability Class: Cognitive Difficulty
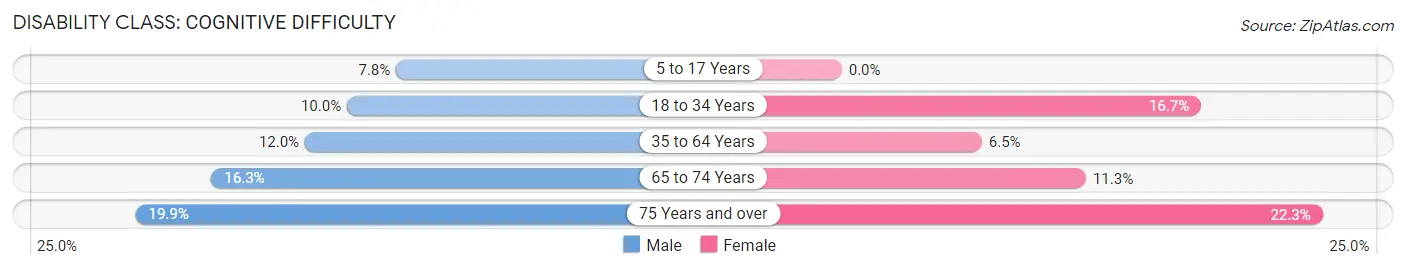
| Age Bracket | Male | Female |
| 5 to 17 Years | 81 (7.8%) | 0 (0.0%) |
| 18 to 34 Years | 127 (10.0%) | 204 (16.7%) |
| 35 to 64 Years | 307 (12.0%) | 172 (6.5%) |
| 65 to 74 Years | 137 (16.3%) | 98 (11.3%) |
| 75 Years and over | 109 (19.9%) | 168 (22.3%) |
Disability Class: Ambulatory Difficulty
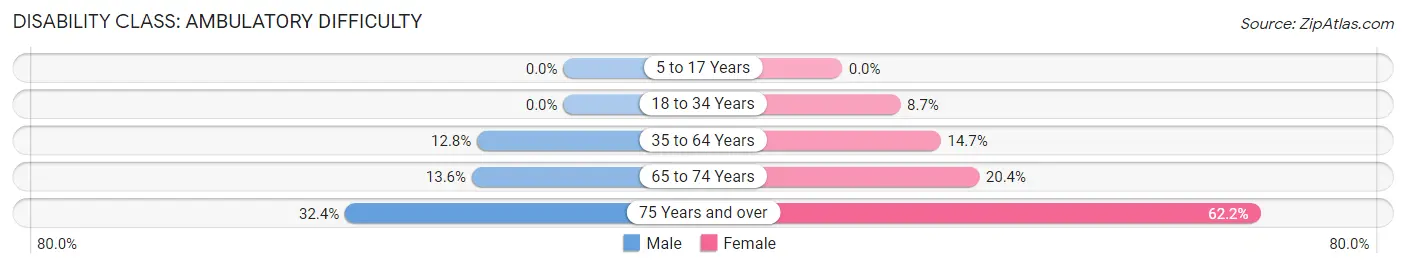
| Age Bracket | Male | Female |
| 5 to 17 Years | 0 (0.0%) | 0 (0.0%) |
| 18 to 34 Years | 0 (0.0%) | 106 (8.7%) |
| 35 to 64 Years | 328 (12.8%) | 388 (14.7%) |
| 65 to 74 Years | 114 (13.6%) | 176 (20.3%) |
| 75 Years and over | 178 (32.4%) | 468 (62.2%) |
Disability Class: Self-Care Difficulty
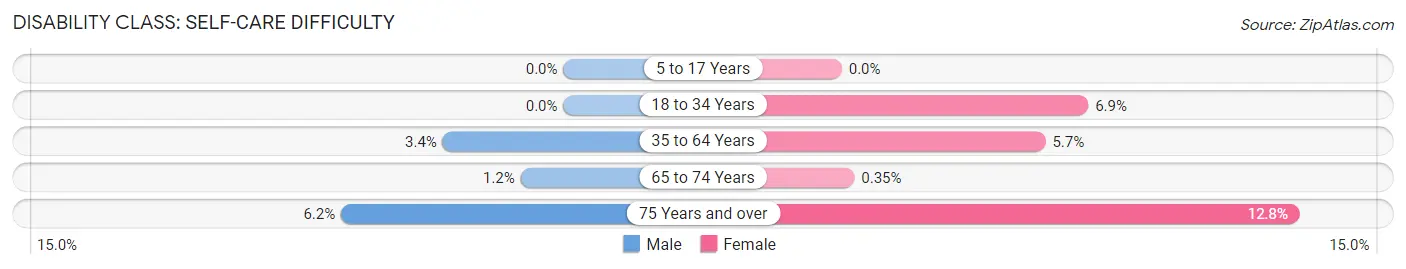
| Age Bracket | Male | Female |
| 5 to 17 Years | 0 (0.0%) | 0 (0.0%) |
| 18 to 34 Years | 0 (0.0%) | 84 (6.9%) |
| 35 to 64 Years | 86 (3.4%) | 150 (5.7%) |
| 65 to 74 Years | 10 (1.2%) | 3 (0.4%) |
| 75 Years and over | 34 (6.2%) | 96 (12.8%) |
Technology Access in Lamar County
Computing Device Access in Lamar County

| Device Type | # Households | % Households |
| Desktop or Laptop | 3,025 | 58.5% |
| Smartphone | 3,851 | 74.5% |
| Tablet | 2,285 | 44.2% |
| No Computing Device | 1,000 | 19.4% |
| Total | 5,168 | 100.0% |
Internet Access in Lamar County
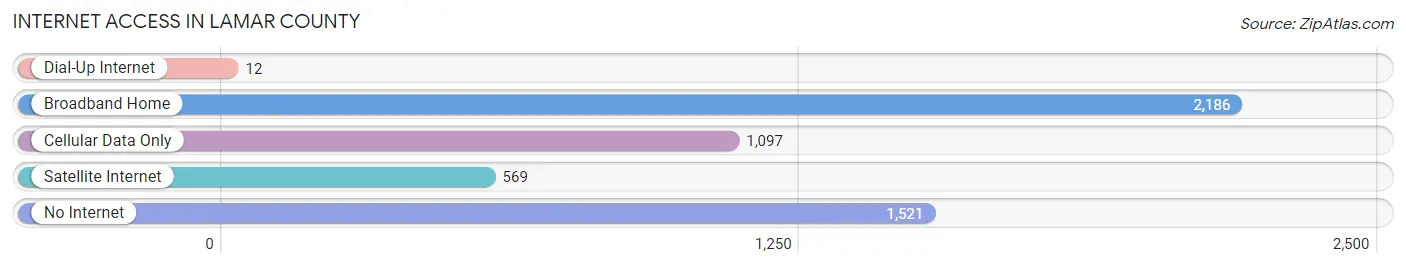
| Internet Type | # Households | % Households |
| Dial-Up Internet | 12 | 0.2% |
| Broadband Home | 2,186 | 42.3% |
| Cellular Data Only | 1,097 | 21.2% |
| Satellite Internet | 569 | 11.0% |
| No Internet | 1,521 | 29.4% |
| Total | 5,168 | 100.0% |
Lamar County Summary
Lamar County, Alabama is located in the northwest corner of the state, and is bordered by Marion County to the north, Fayette County to the east, Pickens County to the south, and Mississippi to the west. The county seat is Vernon, and the largest city is Sulligent. The population of Lamar County was 14,564 in the 2010 census, and the population density was 43.3 people per square mile.
The geography of Lamar County is mostly flat, with some rolling hills in the northern part of the county. The terrain is mostly covered in pine and hardwood forests, with some open fields and pastures. The county is drained by the Tombigbee River, which forms the western border of the county.
The economy of Lamar County is largely based on agriculture, with the main crops being cotton, corn, soybeans, and wheat. The county also has a large timber industry, and there are several manufacturing plants in the area. The county is also home to several small businesses, including restaurants, retail stores, and service providers.
The demographics of Lamar County are mostly white, with African Americans making up about 20% of the population. The median household income in the county is $37,000, and the median home value is $90,000. The unemployment rate in the county is 6.2%, which is slightly higher than the national average.
The county is served by the Lamar County School System, which consists of seven elementary schools, two middle schools, and one high school. The county also has several private schools, including Lamar Academy and Lamar Christian School.
Lamar County is home to several attractions, including the Lamar County Historical Museum, the Lamar County Courthouse, and the Lamar County Fairgrounds. The county is also home to several parks, including Lamar County Park, Lamar County Nature Preserve, and Lamar County State Park.
Lamar County is a great place to live, work, and play. The county has a rich history, a strong economy, and a diverse population. With its beautiful scenery, friendly people, and great amenities, Lamar County is a great place to call home.
Common Questions
What is the Total Population of Lamar County?
Total Population of Lamar County is 13,885.
What is the Total Male Population of Lamar County?
Total Male Population of Lamar County is 6,930.
What is the Total Female Population of Lamar County?
Total Female Population of Lamar County is 6,955.
What is the Ratio of Males per 100 Females in Lamar County?
There are 99.64 Males per 100 Females in Lamar County.
What is the Ratio of Females per 100 Males in Lamar County?
There are 100.36 Females per 100 Males in Lamar County.
What is the Median Population Age in Lamar County?
Median Population Age in Lamar County is 44.2 Years.
What is the Average Family Size in Lamar County
Average Family Size in Lamar County is 3.3 People.
What is the Average Household Size in Lamar County
Average Household Size in Lamar County is 2.6 People.
What is Per Capita Income in Lamar County?
Per Capita income in Lamar County is $24,794.
What is the Median Family Income in Lamar County?
Median Family Income in Lamar County is $63,495.
What is the Median Household income in Lamar County?
Median Household Income in Lamar County is $49,565.
What is Income or Wage Gap in Lamar County?
Income or Wage Gap in Lamar County is 24.8%.
Women in Lamar County earn 75.2 cents for every dollar earned by a man.
What is Family Income Deficit in Lamar County?
Family Income Deficit in Lamar County is $8,479.
Families that are below poverty line in Lamar County earn $8,479 less on average than the poverty threshold level.
What is Inequality or Gini Index in Lamar County?
Inequality or Gini Index in Lamar County is 0.43.
How Large is the Labor Force in Lamar County?
There are 5,673 People in the Labor Forcein in Lamar County.
What is the Percentage of People in the Labor Force in Lamar County?
51.1% of People are in the Labor Force in Lamar County.
What is the Unemployment Rate in Lamar County?
Unemployment Rate in Lamar County is 5.0%.