Hale County, AL
Hale County Map
Hale County Overview
14,742
TOTAL POPULATION
7,020
MALE POPULATION
7,722
FEMALE POPULATION
90.91
MALES / 100 FEMALES
110.00
FEMALES / 100 MALES
40.5
MEDIAN AGE
3.7
AVG FAMILY SIZE
2.7
AVG HOUSEHOLD SIZE
$23,690
PER CAPITA INCOME
$64,661
AVG FAMILY INCOME
$35,851
AVG HOUSEHOLD INCOME
37.3%
WAGE / INCOME GAP [ % ]
62.7¢/ $1
WAGE / INCOME GAP [ $ ]
$7,675
FAMILY INCOME DEFICIT
0.51
INEQUALITY / GINI INDEX
5,900
LABOR FORCE [ PEOPLE ]
50.9%
PERCENT IN LABOR FORCE
7.6%
UNEMPLOYMENT RATE
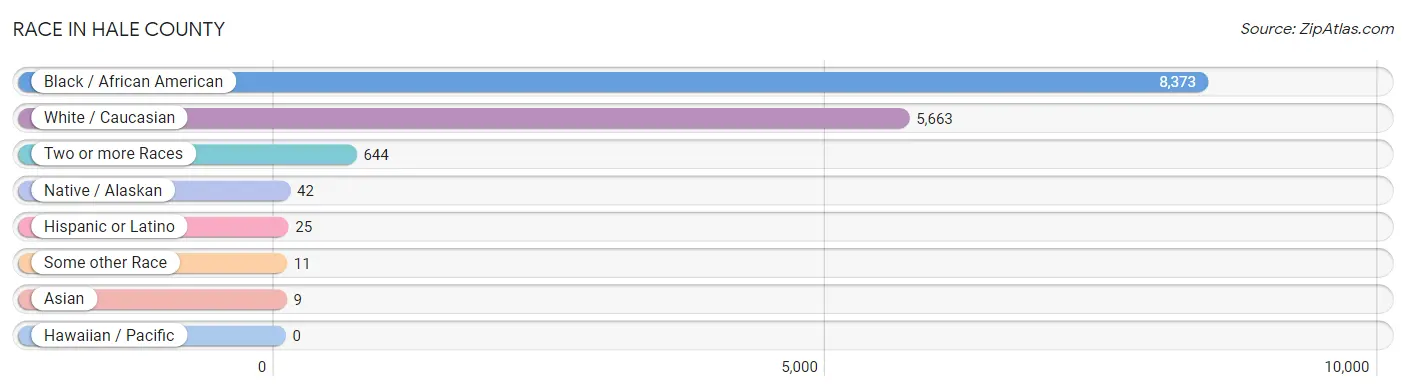
Race in Hale County
The most populous races in Hale County are Black / African American (8,373 | 56.8%), White / Caucasian (5,663 | 38.4%), and Two or more Races (644 | 4.4%).
| Race | # Population | % Population |
| Asian | 9 | 0.1% |
| Black / African American | 8,373 | 56.8% |
| Hawaiian / Pacific | 0 | 0.0% |
| Hispanic or Latino | 25 | 0.2% |
| Native / Alaskan | 42 | 0.3% |
| White / Caucasian | 5,663 | 38.4% |
| Two or more Races | 644 | 4.4% |
| Some other Race | 11 | 0.1% |
| Total | 14,742 | 100.0% |
Ancestry in Hale County
The most populous ancestries reported in Hale County are English (911 | 6.2%), Irish (745 | 5.1%), American (680 | 4.6%), German (491 | 3.3%), and Welsh (222 | 1.5%), together accounting for 20.7% of all Hale County residents.

| Ancestry | # Population | % Population |
| African | 28 | 0.2% |
| American | 680 | 4.6% |
| Apache | 42 | 0.3% |
| Austrian | 5 | 0.0% |
| British | 18 | 0.1% |
| Burmese | 9 | 0.1% |
| Central American | 11 | 0.1% |
| Creek | 18 | 0.1% |
| Dutch | 51 | 0.4% |
| English | 911 | 6.2% |
| European | 64 | 0.4% |
| French | 81 | 0.5% |
| French Canadian | 3 | 0.0% |
| German | 491 | 3.3% |
| Greek | 107 | 0.7% |
| Honduran | 11 | 0.1% |
| Hungarian | 6 | 0.0% |
| Indian (Asian) | 124 | 0.8% |
| Irish | 745 | 5.1% |
| Italian | 16 | 0.1% |
| Jamaican | 5 | 0.0% |
| Nigerian | 15 | 0.1% |
| Norwegian | 14 | 0.1% |
| Polish | 29 | 0.2% |
| Russian | 12 | 0.1% |
| Scandinavian | 71 | 0.5% |
| Scotch-Irish | 88 | 0.6% |
| Scottish | 88 | 0.6% |
| Spanish | 14 | 0.1% |
| Subsaharan African | 43 | 0.3% |
| Swiss | 13 | 0.1% |
| Welsh | 222 | 1.5% | View All 32 Rows |
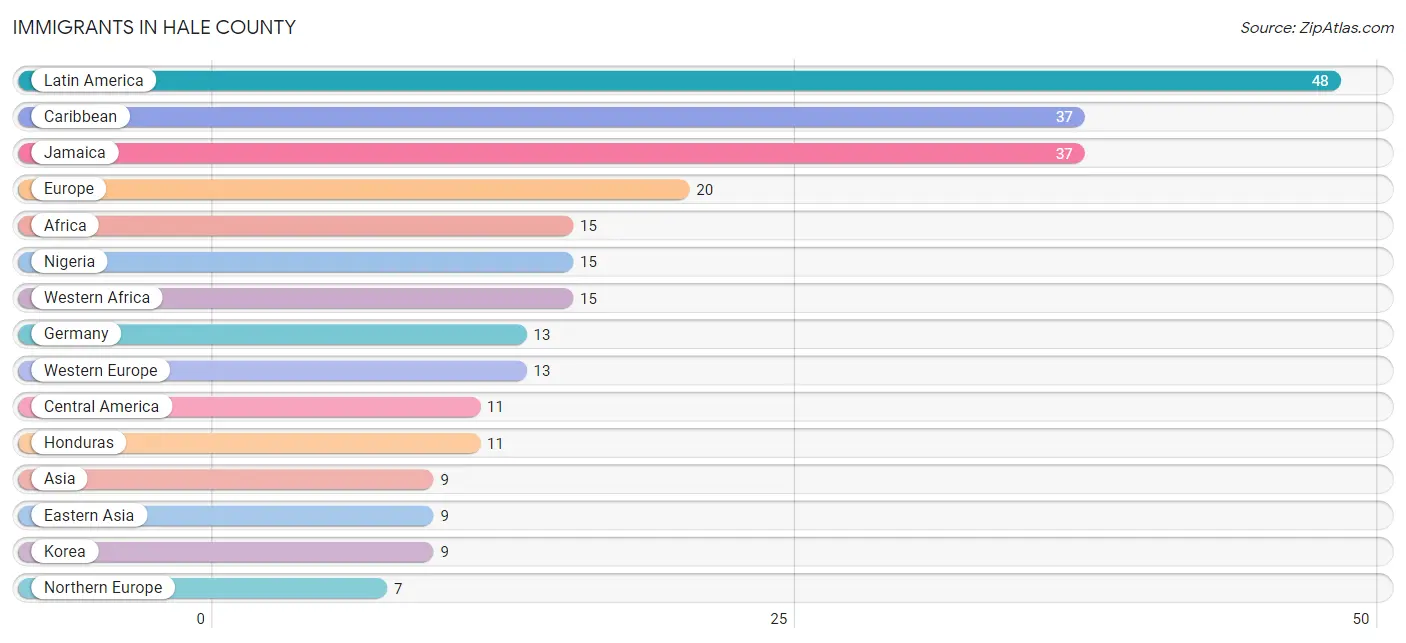
Immigrants in Hale County
The most numerous immigrant groups reported in Hale County came from Latin America (48 | 0.3%), Caribbean (37 | 0.3%), Jamaica (37 | 0.3%), Europe (20 | 0.1%), and Africa (15 | 0.1%), together accounting for 1.1% of all Hale County residents.
| Immigration Origin | # Population | % Population |
| Africa | 15 | 0.1% |
| Asia | 9 | 0.1% |
| Caribbean | 37 | 0.3% |
| Central America | 11 | 0.1% |
| Eastern Asia | 9 | 0.1% |
| Europe | 20 | 0.1% |
| Germany | 13 | 0.1% |
| Honduras | 11 | 0.1% |
| Jamaica | 37 | 0.3% |
| Korea | 9 | 0.1% |
| Latin America | 48 | 0.3% |
| Nigeria | 15 | 0.1% |
| Northern Europe | 7 | 0.1% |
| Scotland | 7 | 0.1% |
| Western Africa | 15 | 0.1% |
| Western Europe | 13 | 0.1% | View All 16 Rows |
Sex and Age in Hale County
Sex and Age in Hale County
The most populous age groups in Hale County are 5 to 9 Years (608 | 8.7%) for men and 5 to 9 Years (782 | 10.1%) for women.

| Age Bracket | Male | Female |
| Under 5 Years | 486 (6.9%) | 482 (6.2%) |
| 5 to 9 Years | 608 (8.7%) | 782 (10.1%) |
| 10 to 14 Years | 424 (6.0%) | 222 (2.9%) |
| 15 to 19 Years | 522 (7.4%) | 294 (3.8%) |
| 20 to 24 Years | 401 (5.7%) | 541 (7.0%) |
| 25 to 29 Years | 401 (5.7%) | 462 (6.0%) |
| 30 to 34 Years | 413 (5.9%) | 614 (8.0%) |
| 35 to 39 Years | 395 (5.6%) | 264 (3.4%) |
| 40 to 44 Years | 382 (5.4%) | 466 (6.0%) |
| 45 to 49 Years | 309 (4.4%) | 418 (5.4%) |
| 50 to 54 Years | 389 (5.5%) | 456 (5.9%) |
| 55 to 59 Years | 552 (7.9%) | 503 (6.5%) |
| 60 to 64 Years | 450 (6.4%) | 603 (7.8%) |
| 65 to 69 Years | 540 (7.7%) | 464 (6.0%) |
| 70 to 74 Years | 349 (5.0%) | 419 (5.4%) |
| 75 to 79 Years | 135 (1.9%) | 269 (3.5%) |
| 80 to 84 Years | 121 (1.7%) | 226 (2.9%) |
| 85 Years and over | 143 (2.0%) | 237 (3.1%) |
| Total | 7,020 (100.0%) | 7,722 (100.0%) |
Families and Households in Hale County
Median Family Size in Hale County
The median family size in Hale County is 3.71 persons per family, with single female/mother families (744 | 23.6%) accounting for the largest median family size of 5.11 persons per family. On the other hand, married-couple families (2,128 | 67.4%) represent the smallest median family size with 3.15 persons per family.

| Family Type | # Families | Family Size |
| Married-Couple | 2,128 (67.4%) | 3.15 |
| Single Male/Father | 286 (9.1%) | 4.23 |
| Single Female/Mother | 744 (23.6%) | 5.11 |
| Total Families | 3,158 (100.0%) | 3.71 |
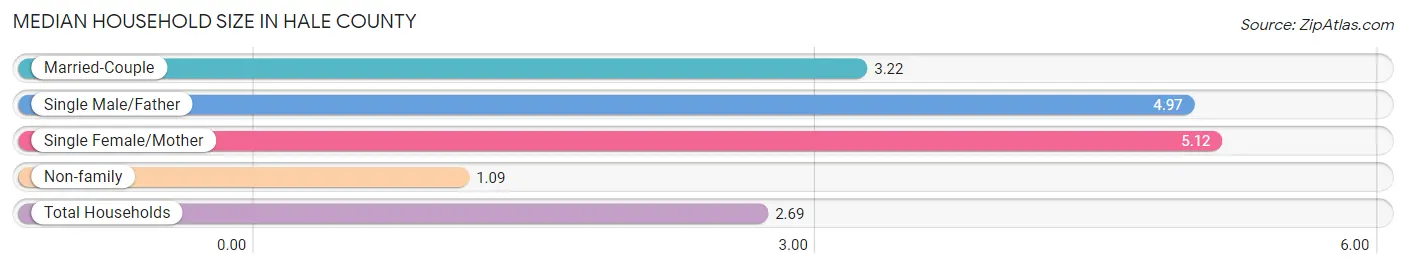
Median Household Size in Hale County
The median household size in Hale County is 2.69 persons per household, with single female/mother households (744 | 13.8%) accounting for the largest median household size of 5.12 persons per household. non-family households (2,245 | 41.5%) represent the smallest median household size with 1.09 persons per household.
| Household Type | # Households | Household Size |
| Married-Couple | 2,128 (39.4%) | 3.22 |
| Single Male/Father | 286 (5.3%) | 4.97 |
| Single Female/Mother | 744 (13.8%) | 5.12 |
| Non-family | 2,245 (41.5%) | 1.09 |
| Total Households | 5,403 (100.0%) | 2.69 |
Household Size by Marriage Status in Hale County
Out of a total of 5,403 households in Hale County, 3,158 (58.5%) are family households, while 2,245 (41.5%) are nonfamily households. The most numerous type of family households are 2-person households, comprising 1,733, and the most common type of nonfamily households are 1-person households, comprising 2,000.
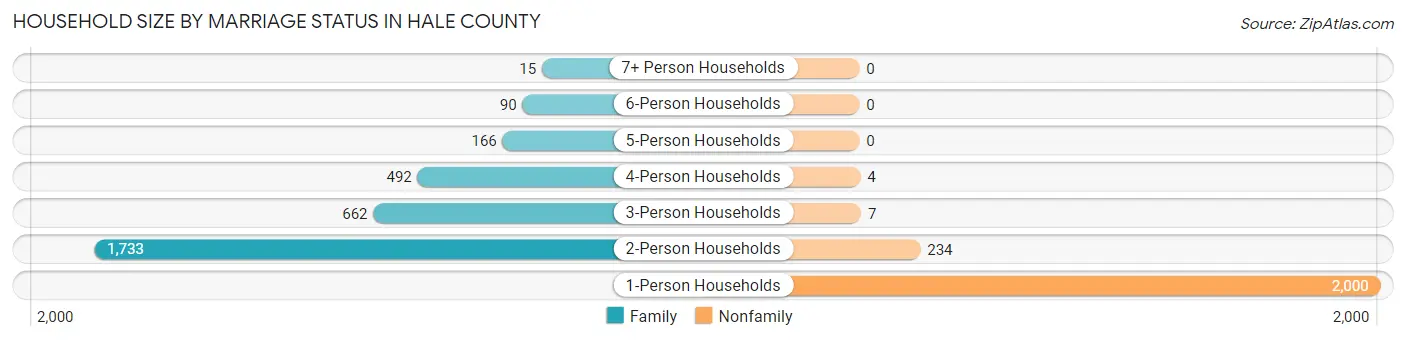
| Household Size | Family Households | Nonfamily Households |
| 1-Person Households | - | 2,000 (37.0%) |
| 2-Person Households | 1,733 (32.1%) | 234 (4.3%) |
| 3-Person Households | 662 (12.2%) | 7 (0.1%) |
| 4-Person Households | 492 (9.1%) | 4 (0.1%) |
| 5-Person Households | 166 (3.1%) | 0 (0.0%) |
| 6-Person Households | 90 (1.7%) | 0 (0.0%) |
| 7+ Person Households | 15 (0.3%) | 0 (0.0%) |
| Total | 3,158 (58.5%) | 2,245 (41.5%) |
Female Fertility in Hale County
Fertility by Age in Hale County
Average fertility rate in Hale County is 25.0 births per 1,000 women. Women in the age bracket of 20 to 34 years have the highest fertility rate with 43.0 births per 1,000 women. Women in the age bracket of 20 to 34 years acount for 90.9% of all women with births.
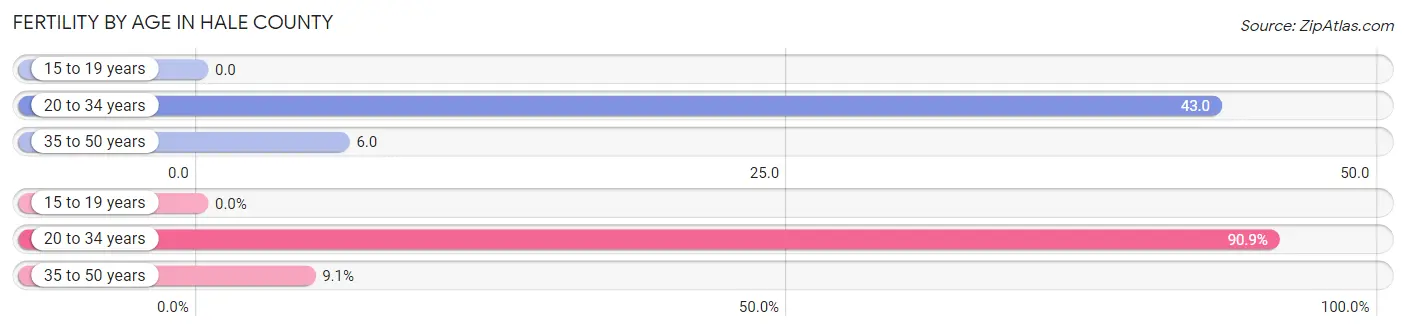
| Age Bracket | Women with Births | Births / 1,000 Women |
| 15 to 19 years | 0 (0.0%) | 0.0 |
| 20 to 34 years | 70 (90.9%) | 43.0 |
| 35 to 50 years | 7 (9.1%) | 6.0 |
| Total | 77 (100.0%) | 25.0 |
Fertility by Age by Marriage Status in Hale County
45.5% of women with births (77) in Hale County are married. The highest percentage of unmarried women with births falls into 35 to 50 years age bracket with 100.0% of them unmarried at the time of birth, while the lowest percentage of unmarried women with births belong to 20 to 34 years age bracket with 50.0% of them unmarried.
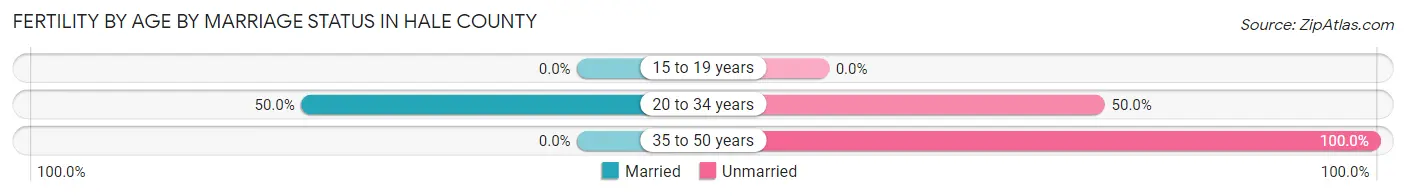
| Age Bracket | Married | Unmarried |
| 15 to 19 years | 0 (0.0%) | 0 (0.0%) |
| 20 to 34 years | 35 (50.0%) | 35 (50.0%) |
| 35 to 50 years | 0 (0.0%) | 7 (100.0%) |
| Total | 35 (45.5%) | 42 (54.5%) |
Fertility by Education in Hale County
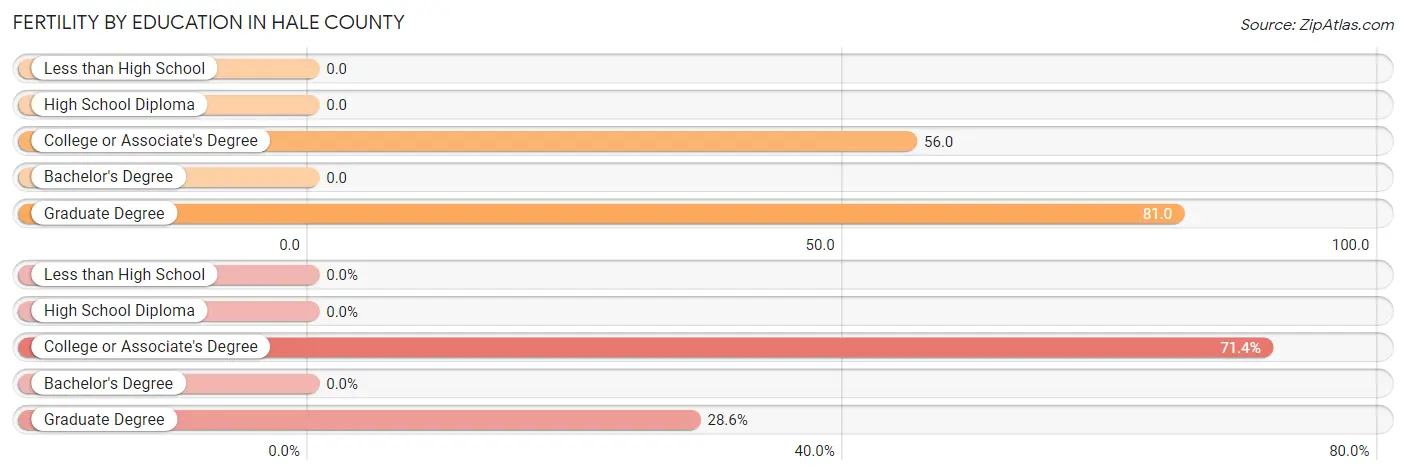
| Educational Attainment | Women with Births | Births / 1,000 Women |
| Less than High School | 0 (0.0%) | 0.0 |
| High School Diploma | 0 (0.0%) | 0.0 |
| College or Associate's Degree | 55 (71.4%) | 56.0 |
| Bachelor's Degree | 0 (0.0%) | 0.0 |
| Graduate Degree | 22 (28.6%) | 81.0 |
| Total | 77 (100.0%) | 25.0 |
Fertility by Education by Marriage Status in Hale County
54.5% of women with births in Hale County are unmarried. Women with the educational attainment of graduate degree are most likely to be married with 100.0% of them married at childbirth, while women with the educational attainment of college or associate's degree are least likely to be married with 76.4% of them unmarried at childbirth.
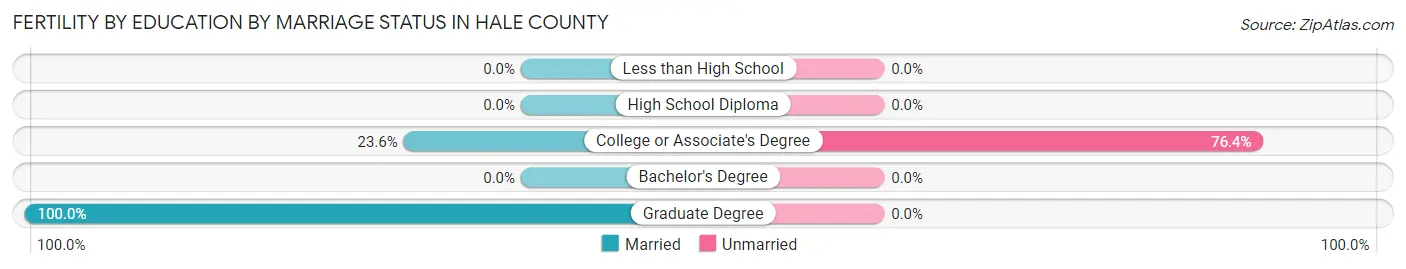
| Educational Attainment | Married | Unmarried |
| Less than High School | 0 (0.0%) | 0 (0.0%) |
| High School Diploma | 0 (0.0%) | 0 (0.0%) |
| College or Associate's Degree | 13 (23.6%) | 42 (76.4%) |
| Bachelor's Degree | 0 (0.0%) | 0 (0.0%) |
| Graduate Degree | 22 (100.0%) | 0 (0.0%) |
| Total | 35 (45.5%) | 42 (54.5%) |
Income in Hale County
Income Overview in Hale County
Per Capita Income in Hale County is $23,690, while median incomes of families and households are $64,661 and $35,851 respectively.
| Characteristic | Number | Measure |
| Per Capita Income | 14,742 | $23,690 |
| Median Family Income | 3,158 | $64,661 |
| Mean Family Income | 3,158 | $75,915 |
| Median Household Income | 5,403 | $35,851 |
| Mean Household Income | 5,403 | $59,052 |
| Income Deficit | 3,158 | $7,675 |
| Wage / Income Gap (%) | 14,742 | 37.27% |
| Wage / Income Gap ($) | 14,742 | 62.73¢ per $1 |
| Gini / Inequality Index | 14,742 | 0.51 |
Earnings by Sex in Hale County
Average Earnings in Hale County are $30,695, $38,402 for men and $24,091 for women, a difference of 37.3%.
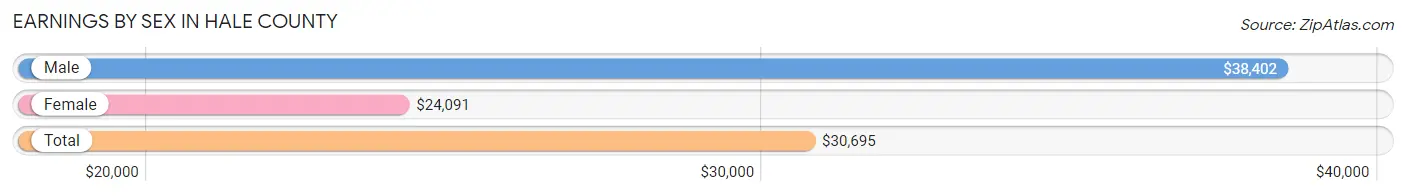
| Sex | Number | Average Earnings |
| Male | 2,980 (49.8%) | $38,402 |
| Female | 3,000 (50.2%) | $24,091 |
| Total | 5,980 (100.0%) | $30,695 |
Earnings by Sex by Income Bracket in Hale County
The most common earnings brackets in Hale County are $55,000 to $64,999 for men (264 | 8.9%) and $12,500 to $14,999 for women (387 | 12.9%).
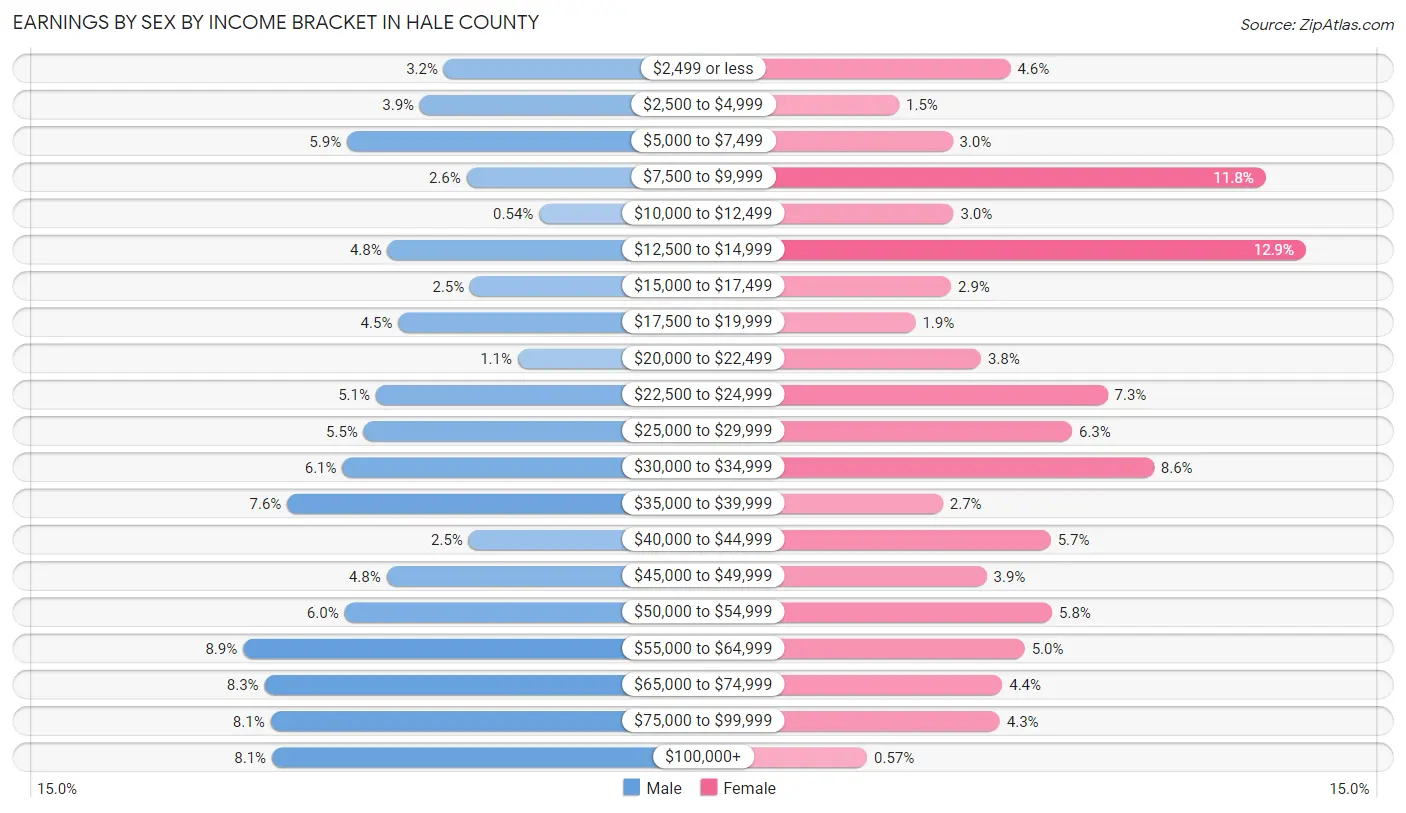
| Income | Male | Female |
| $2,499 or less | 96 (3.2%) | 138 (4.6%) |
| $2,500 to $4,999 | 116 (3.9%) | 44 (1.5%) |
| $5,000 to $7,499 | 177 (5.9%) | 89 (3.0%) |
| $7,500 to $9,999 | 77 (2.6%) | 353 (11.8%) |
| $10,000 to $12,499 | 16 (0.5%) | 90 (3.0%) |
| $12,500 to $14,999 | 143 (4.8%) | 387 (12.9%) |
| $15,000 to $17,499 | 74 (2.5%) | 88 (2.9%) |
| $17,500 to $19,999 | 134 (4.5%) | 58 (1.9%) |
| $20,000 to $22,499 | 34 (1.1%) | 113 (3.8%) |
| $22,500 to $24,999 | 153 (5.1%) | 220 (7.3%) |
| $25,000 to $29,999 | 163 (5.5%) | 190 (6.3%) |
| $30,000 to $34,999 | 181 (6.1%) | 259 (8.6%) |
| $35,000 to $39,999 | 227 (7.6%) | 81 (2.7%) |
| $40,000 to $44,999 | 75 (2.5%) | 172 (5.7%) |
| $45,000 to $49,999 | 144 (4.8%) | 118 (3.9%) |
| $50,000 to $54,999 | 179 (6.0%) | 173 (5.8%) |
| $55,000 to $64,999 | 264 (8.9%) | 150 (5.0%) |
| $65,000 to $74,999 | 246 (8.3%) | 131 (4.4%) |
| $75,000 to $99,999 | 241 (8.1%) | 129 (4.3%) |
| $100,000+ | 240 (8.1%) | 17 (0.6%) |
| Total | 2,980 (100.0%) | 3,000 (100.0%) |
Earnings by Sex by Educational Attainment in Hale County
Average earnings in Hale County are $48,285 for men and $29,388 for women, a difference of 39.1%. Men with an educational attainment of bachelor's degree enjoy the highest average annual earnings of $65,595, while those with college or associate's degree education earn the least with $48,793. Women with an educational attainment of graduate degree earn the most with the average annual earnings of $53,000, while those with less than high school education have the smallest earnings of $8,958.
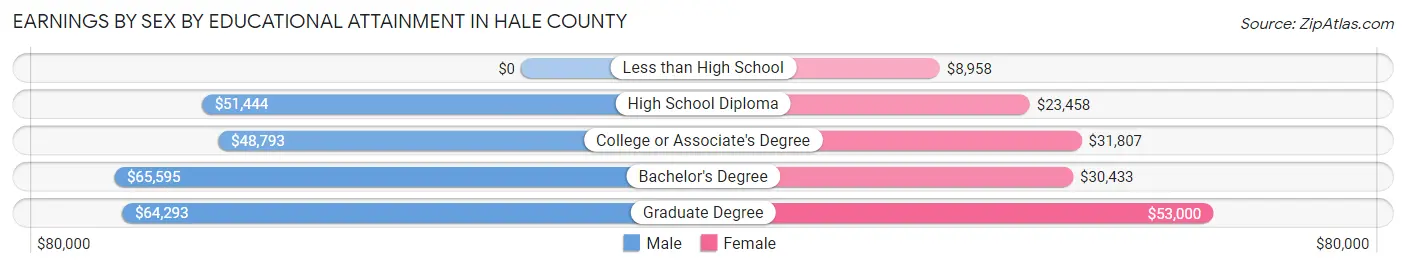
| Educational Attainment | Male Income | Female Income |
| Less than High School | - | - |
| High School Diploma | $51,444 | $23,458 |
| College or Associate's Degree | $48,793 | $31,807 |
| Bachelor's Degree | $65,595 | $30,433 |
| Graduate Degree | $64,293 | $53,000 |
| Total | $48,285 | $29,388 |
Family Income in Hale County
Family Income Brackets in Hale County
According to the Hale County family income data, there are 534 families falling into the $75,000 to $99,999 income range, which is the most common income bracket and makes up 16.9% of all families. Conversely, the less than $10,000 income bracket is the least frequent group with only 41 families (1.3%) belonging to this category.

| Income Bracket | # Families | % Families |
| Less than $10,000 | 41 | 1.3% |
| $10,000 to $14,999 | 240 | 7.6% |
| $15,000 to $24,999 | 379 | 12.0% |
| $25,000 to $34,999 | 385 | 12.2% |
| $35,000 to $49,999 | 300 | 9.5% |
| $50,000 to $74,999 | 474 | 15.0% |
| $75,000 to $99,999 | 534 | 16.9% |
| $100,000 to $149,999 | 512 | 16.2% |
| $150,000 to $199,999 | 139 | 4.4% |
| $200,000+ | 155 | 4.9% |
Family Income by Famaliy Size in Hale County
6-person families (105 | 3.3%) account for the highest median family income in Hale County with $118,219 per family, while 2-person families (1,836 | 58.1%) have the highest median income of $30,199 per family member.

| Income Bracket | # Families | Median Income |
| 2-Person Families | 1,836 (58.1%) | $60,398 |
| 3-Person Families | 637 (20.2%) | $49,904 |
| 4-Person Families | 477 (15.1%) | $82,188 |
| 5-Person Families | 103 (3.3%) | $102,542 |
| 6-Person Families | 105 (3.3%) | $118,219 |
| 7+ Person Families | 0 (0.0%) | $0 |
| Total | 3,158 (100.0%) | $64,661 |
Family Income by Number of Earners in Hale County
The median family income in Hale County is $64,661, with families comprising 3+ earners (317) having the highest median family income of $121,205, while families with no earners (890) have the lowest median family income of $27,292, accounting for 10.0% and 28.2% of families, respectively.

| Number of Earners | # Families | Median Income |
| No Earners | 890 (28.2%) | $27,292 |
| 1 Earner | 1,018 (32.2%) | $43,750 |
| 2 Earners | 933 (29.5%) | $89,646 |
| 3+ Earners | 317 (10.0%) | $121,205 |
| Total | 3,158 (100.0%) | $64,661 |
Household Income in Hale County
Household Income Brackets in Hale County
With 956 households falling in the category, the $15,000 to $24,999 income range is the most frequent in Hale County, accounting for 17.7% of all households. In contrast, only 151 households (2.8%) fall into the $150,000 to $199,999 income bracket, making it the least populous group.

| Income Bracket | # Households | % Households |
| Less than $10,000 | 502 | 9.3% |
| $10,000 to $14,999 | 675 | 12.5% |
| $15,000 to $24,999 | 956 | 17.7% |
| $25,000 to $34,999 | 540 | 10.0% |
| $35,000 to $49,999 | 508 | 9.4% |
| $50,000 to $74,999 | 702 | 13.0% |
| $75,000 to $99,999 | 643 | 11.9% |
| $100,000 to $149,999 | 546 | 10.1% |
| $150,000 to $199,999 | 151 | 2.8% |
| $200,000+ | 173 | 3.2% |
Household Income by Householder Age in Hale County
The median household income in Hale County is $35,851, with the highest median household income of $53,516 found in the 45 to 64 years age bracket for the primary householder. A total of 2,044 households (37.8%) fall into this category. Meanwhile, the 15 to 24 years age bracket for the primary householder has the lowest median household income of $0, with 36 households (0.7%) in this group.
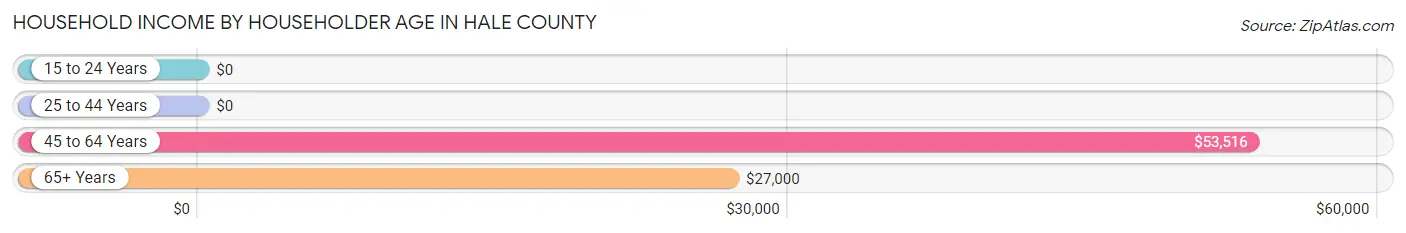
| Income Bracket | # Households | Median Income |
| 15 to 24 Years | 36 (0.7%) | $0 |
| 25 to 44 Years | 1,353 (25.0%) | $0 |
| 45 to 64 Years | 2,044 (37.8%) | $53,516 |
| 65+ Years | 1,970 (36.5%) | $27,000 |
| Total | 5,403 (100.0%) | $35,851 |
Poverty in Hale County
Income Below Poverty by Sex and Age in Hale County
With 24.2% poverty level for males and 25.7% for females among the residents of Hale County, under 5 year old males and 6 to 11 year old females are the most vulnerable to poverty, with 309 males (64.2%) and 357 females (59.6%) in their respective age groups living below the poverty level.

| Age Bracket | Male | Female |
| Under 5 Years | 309 (64.2%) | 171 (35.5%) |
| 5 Years | 9 (22.0%) | 53 (21.7%) |
| 6 to 11 Years | 220 (35.0%) | 357 (59.6%) |
| 12 to 14 Years | 0 (0.0%) | 11 (7.5%) |
| 15 Years | 0 (0.0%) | 35 (47.9%) |
| 16 and 17 Years | 71 (37.6%) | 0 (0.0%) |
| 18 to 24 Years | 42 (6.5%) | 136 (20.7%) |
| 25 to 34 Years | 380 (46.8%) | 386 (36.1%) |
| 35 to 44 Years | 97 (12.5%) | 100 (13.8%) |
| 45 to 54 Years | 147 (21.6%) | 121 (13.8%) |
| 55 to 64 Years | 117 (11.8%) | 233 (21.3%) |
| 65 to 74 Years | 246 (28.1%) | 179 (21.1%) |
| 75 Years and over | 23 (6.2%) | 170 (25.5%) |
| Total | 1,661 (24.2%) | 1,952 (25.7%) |
Income Above Poverty by Sex and Age in Hale County
According to the poverty statistics in Hale County, males aged 12 to 14 years and females aged 16 and 17 years are the age groups that are most secure financially, with 100.0% of males and 100.0% of females in these age groups living above the poverty line.
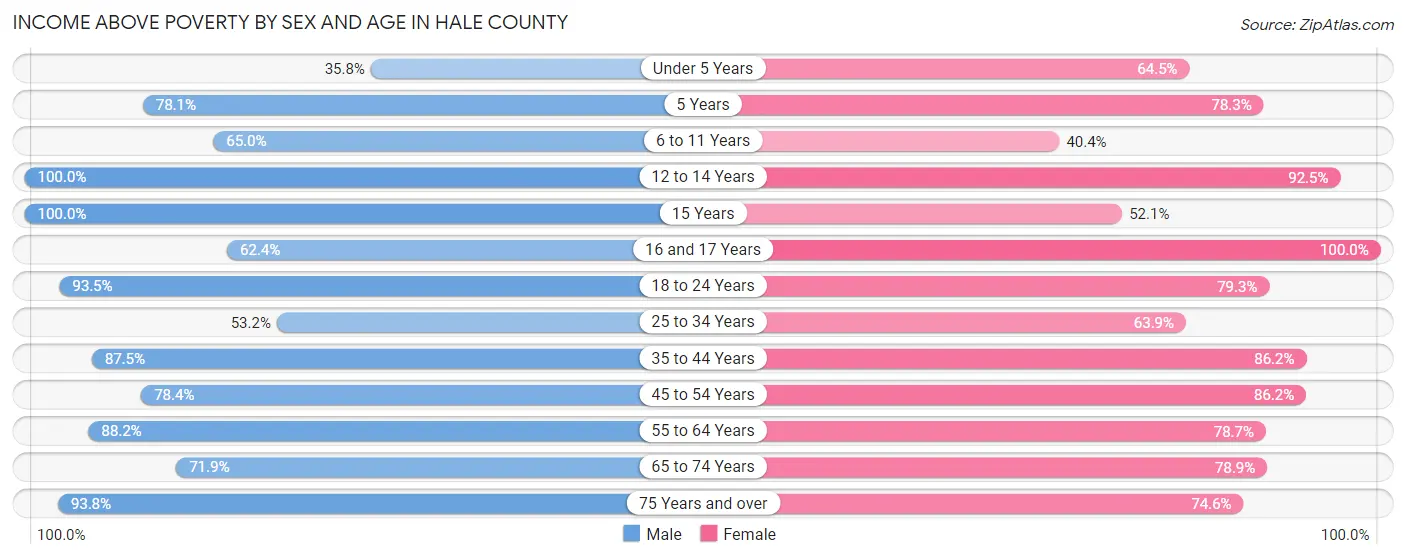
| Age Bracket | Male | Female |
| Under 5 Years | 172 (35.8%) | 311 (64.5%) |
| 5 Years | 32 (78.0%) | 191 (78.3%) |
| 6 to 11 Years | 408 (65.0%) | 242 (40.4%) |
| 12 to 14 Years | 298 (100.0%) | 136 (92.5%) |
| 15 Years | 74 (100.0%) | 38 (52.0%) |
| 16 and 17 Years | 118 (62.4%) | 104 (100.0%) |
| 18 to 24 Years | 608 (93.5%) | 522 (79.3%) |
| 25 to 34 Years | 432 (53.2%) | 682 (63.9%) |
| 35 to 44 Years | 680 (87.5%) | 625 (86.2%) |
| 45 to 54 Years | 532 (78.3%) | 753 (86.2%) |
| 55 to 64 Years | 870 (88.1%) | 861 (78.7%) |
| 65 to 74 Years | 628 (71.9%) | 671 (78.9%) |
| 75 Years and over | 349 (93.8%) | 498 (74.6%) |
| Total | 5,201 (75.8%) | 5,634 (74.3%) |
Income Below Poverty Among Married-Couple Families in Hale County
The poverty statistics for married-couple families in Hale County show that 11.6% or 247 of the total 2,128 families live below the poverty line. Families with 1 or 2 children have the highest poverty rate of 22.5%, comprising of 128 families. On the other hand, families with 3 or 4 children have the lowest poverty rate of 0.0%, which includes 0 families.
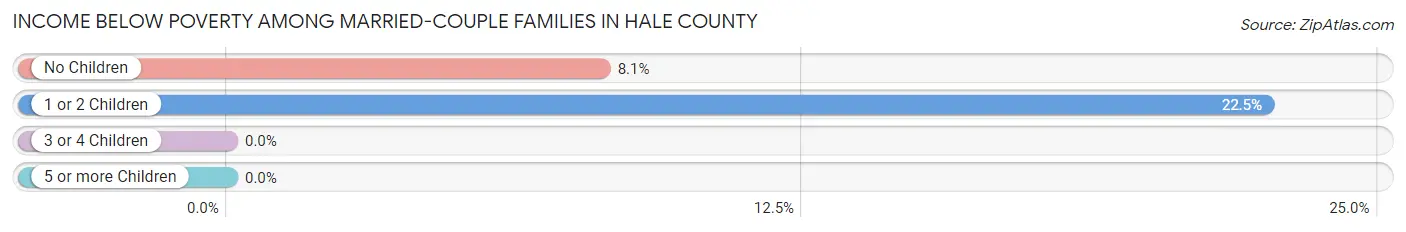
| Children | Above Poverty | Below Poverty |
| No Children | 1,348 (91.9%) | 119 (8.1%) |
| 1 or 2 Children | 440 (77.5%) | 128 (22.5%) |
| 3 or 4 Children | 93 (100.0%) | 0 (0.0%) |
| 5 or more Children | 0 (0.0%) | 0 (0.0%) |
| Total | 1,881 (88.4%) | 247 (11.6%) |
Income Below Poverty Among Single-Parent Households in Hale County
According to the poverty data in Hale County, 12.6% or 36 single-father households and 32.5% or 242 single-mother households are living below the poverty line. Among single-father households, those with 1 or 2 children have the highest poverty rate, with 35 households (27.6%) experiencing poverty. Likewise, among single-mother households, those with 3 or 4 children have the highest poverty rate, with 42 households (56.0%) falling below the poverty line.
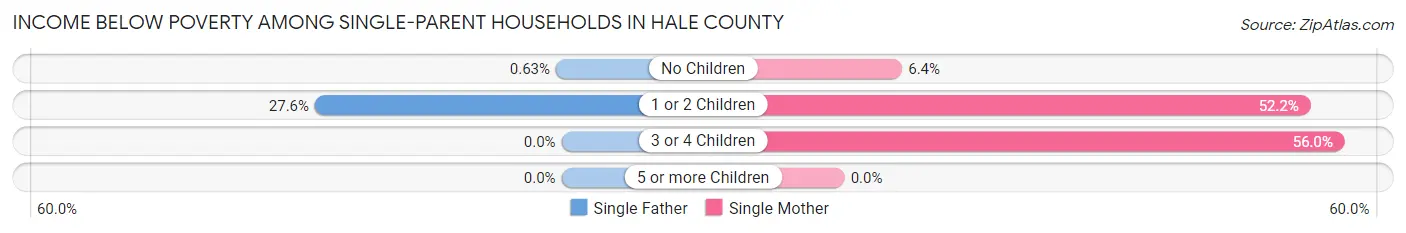
| Children | Single Father | Single Mother |
| No Children | 1 (0.6%) | 21 (6.4%) |
| 1 or 2 Children | 35 (27.6%) | 179 (52.2%) |
| 3 or 4 Children | 0 (0.0%) | 42 (56.0%) |
| 5 or more Children | 0 (0.0%) | 0 (0.0%) |
| Total | 36 (12.6%) | 242 (32.5%) |
Income Below Poverty Among Married-Couple vs Single-Parent Households in Hale County
The poverty data for Hale County shows that 247 of the married-couple family households (11.6%) and 278 of the single-parent households (27.0%) are living below the poverty level. Within the married-couple family households, those with 1 or 2 children have the highest poverty rate, with 128 households (22.5%) falling below the poverty line. Among the single-parent households, those with 3 or 4 children have the highest poverty rate, with 42 household (56.0%) living below poverty.

| Children | Married-Couple Families | Single-Parent Households |
| No Children | 119 (8.1%) | 22 (4.5%) |
| 1 or 2 Children | 128 (22.5%) | 214 (45.5%) |
| 3 or 4 Children | 0 (0.0%) | 42 (56.0%) |
| 5 or more Children | 0 (0.0%) | 0 (0.0%) |
| Total | 247 (11.6%) | 278 (27.0%) |
Employment Characteristics in Hale County
Employment by Class of Employer in Hale County
Among the 5,358 employed individuals in Hale County, private company employees (3,575 | 66.7%), state government employees (583 | 10.9%), and local government employees (340 | 6.4%) make up the most common classes of employment.

| Employer Class | # Employees | % Employees |
| Private Company Employees | 3,575 | 66.7% |
| Self-Employed (Incorporated) | 267 | 5.0% |
| Self-Employed (Not Incorporated) | 260 | 4.9% |
| Not-for-profit Organizations | 257 | 4.8% |
| Local Government Employees | 340 | 6.4% |
| State Government Employees | 583 | 10.9% |
| Federal Government Employees | 76 | 1.4% |
| Unpaid Family Workers | 0 | 0.0% |
| Total | 5,358 | 100.0% |
Employment Status by Age in Hale County
According to the labor force statistics for Hale County, out of the total population over 16 years of age (11,591), 50.9% or 5,900 individuals are in the labor force, with 7.6% or 448 of them unemployed. The age group with the highest labor force participation rate is 30 to 34 years, with 87.6% or 900 individuals in the labor force. Within the labor force, the 20 to 24 years age range has the highest percentage of unemployed individuals, with 14.0% or 101 of them being unemployed.
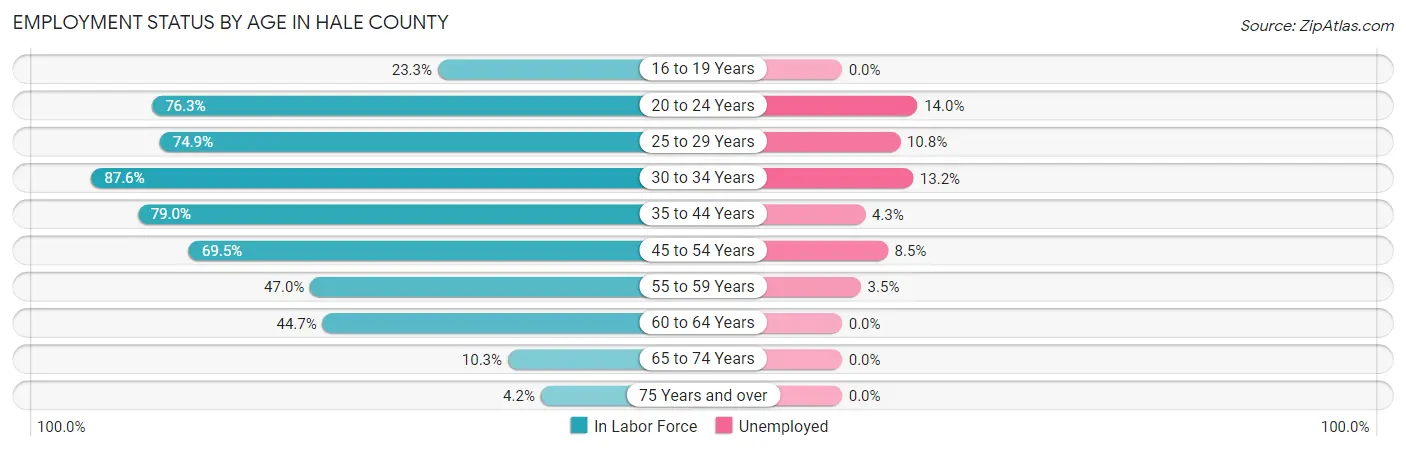
| Age Bracket | In Labor Force | Unemployed |
| 16 to 19 Years | 156 (23.3%) | 0 (0.0%) |
| 20 to 24 Years | 719 (76.3%) | 101 (14.0%) |
| 25 to 29 Years | 646 (74.9%) | 70 (10.8%) |
| 30 to 34 Years | 900 (87.6%) | 119 (13.2%) |
| 35 to 44 Years | 1,191 (79.0%) | 51 (4.3%) |
| 45 to 54 Years | 1,093 (69.5%) | 93 (8.5%) |
| 55 to 59 Years | 496 (47.0%) | 17 (3.5%) |
| 60 to 64 Years | 471 (44.7%) | 0 (0.0%) |
| 65 to 74 Years | 183 (10.3%) | 0 (0.0%) |
| 75 Years and over | 48 (4.2%) | 0 (0.0%) |
| Total | 5,900 (50.9%) | 448 (7.6%) |
Employment Status by Educational Attainment in Hale County
According to labor force statistics for Hale County, 67.8% of individuals (4,798) out of the total population between 25 and 64 years of age (7,077) are in the labor force, with 7.3% or 350 of them being unemployed. The group with the highest labor force participation rate are those with the educational attainment of bachelor's degree or higher, with 87.2% or 1,080 individuals in the labor force. Within the labor force, individuals with high school diploma education have the highest percentage of unemployment, with 13.3% or 206 of them being unemployed.
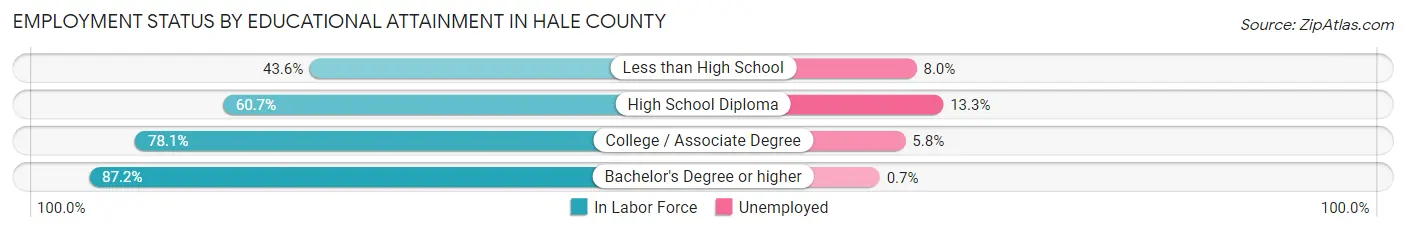
| Educational Attainment | In Labor Force | Unemployed |
| Less than High School | 503 (43.6%) | 92 (8.0%) |
| High School Diploma | 1,546 (60.7%) | 339 (13.3%) |
| College / Associate Degree | 1,670 (78.1%) | 124 (5.8%) |
| Bachelor's Degree or higher | 1,080 (87.2%) | 9 (0.7%) |
| Total | 4,798 (67.8%) | 517 (7.3%) |
Employment Occupations by Sex in Hale County
Management, Business, Science and Arts Occupations
The most common Management, Business, Science and Arts occupations in Hale County are Health Diagnosing & Treating (515 | 9.5%), Community & Social Service (483 | 8.9%), Management (435 | 8.0%), Computers, Engineering & Science (435 | 8.0%), and Education Instruction & Library (424 | 7.8%).

Management, Business, Science and Arts Occupations by Sex
Within the Management, Business, Science and Arts occupations in Hale County, the most male-oriented occupations are Architecture & Engineering (100.0%), Arts, Media & Entertainment (100.0%), and Management (66.0%), while the most female-oriented occupations are Computers & Mathematics (95.0%), Health Diagnosing & Treating (95.0%), and Health Technologists (92.4%).
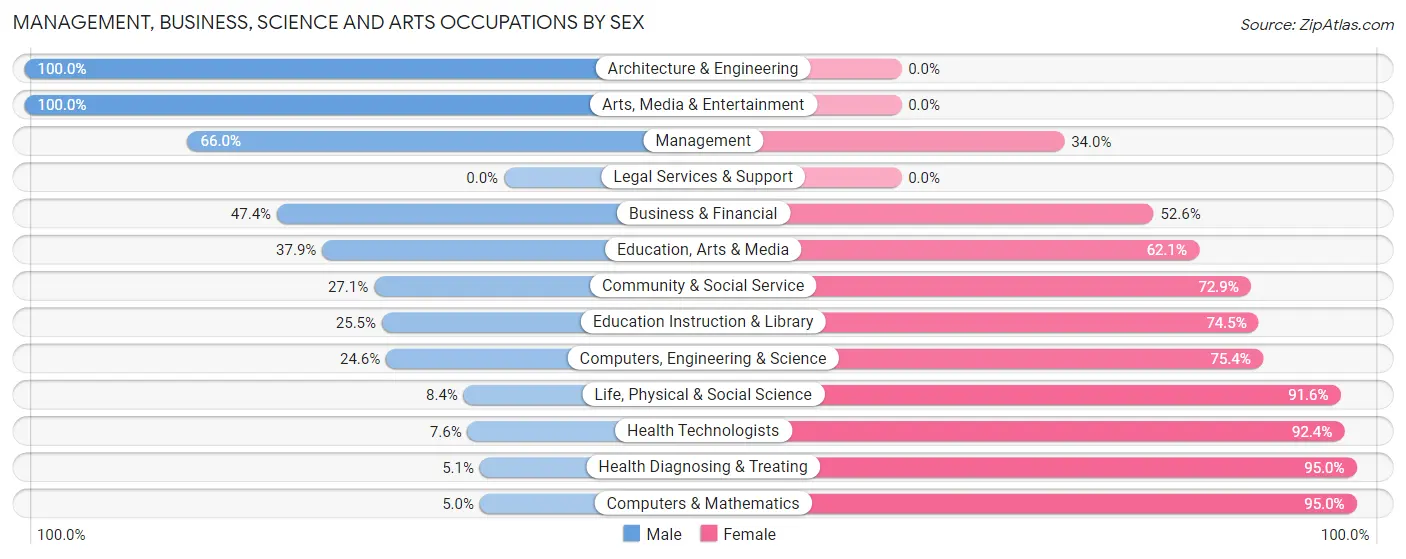
| Occupation | Male | Female |
| Management | 287 (66.0%) | 148 (34.0%) |
| Business & Financial | 90 (47.4%) | 100 (52.6%) |
| Computers, Engineering & Science | 107 (24.6%) | 328 (75.4%) |
| Computers & Mathematics | 7 (5.0%) | 132 (95.0%) |
| Architecture & Engineering | 82 (100.0%) | 0 (0.0%) |
| Life, Physical & Social Science | 18 (8.4%) | 196 (91.6%) |
| Community & Social Service | 131 (27.1%) | 352 (72.9%) |
| Education, Arts & Media | 22 (37.9%) | 36 (62.1%) |
| Legal Services & Support | 0 (0.0%) | 0 (0.0%) |
| Education Instruction & Library | 108 (25.5%) | 316 (74.5%) |
| Arts, Media & Entertainment | 1 (100.0%) | 0 (0.0%) |
| Health Diagnosing & Treating | 26 (5.1%) | 489 (95.0%) |
| Health Technologists | 21 (7.6%) | 255 (92.4%) |
| Total (Category) | 641 (31.1%) | 1,417 (68.9%) |
| Total (Overall) | 2,630 (48.4%) | 2,803 (51.6%) |
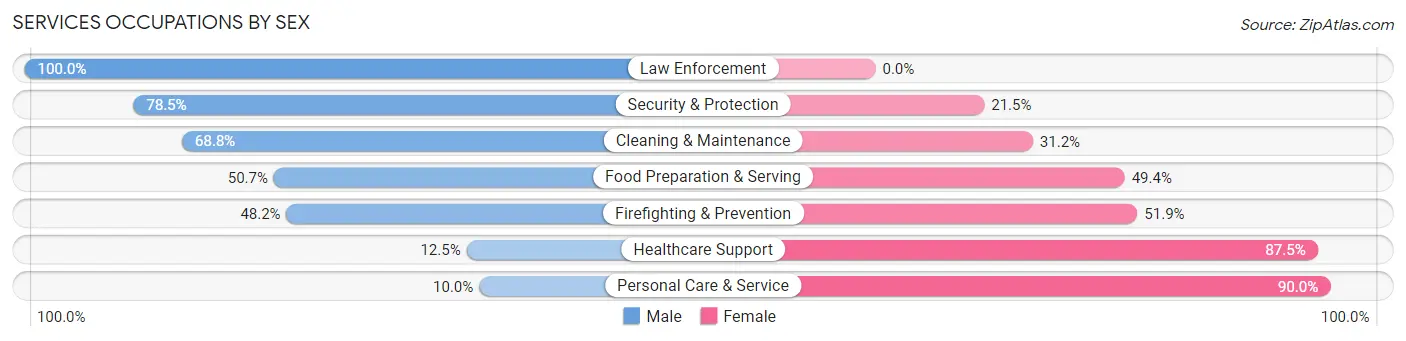
Services Occupations
The most common Services occupations in Hale County are Food Preparation & Serving (464 | 8.5%), Personal Care & Service (210 | 3.9%), Cleaning & Maintenance (138 | 2.5%), Healthcare Support (112 | 2.1%), and Security & Protection (65 | 1.2%).
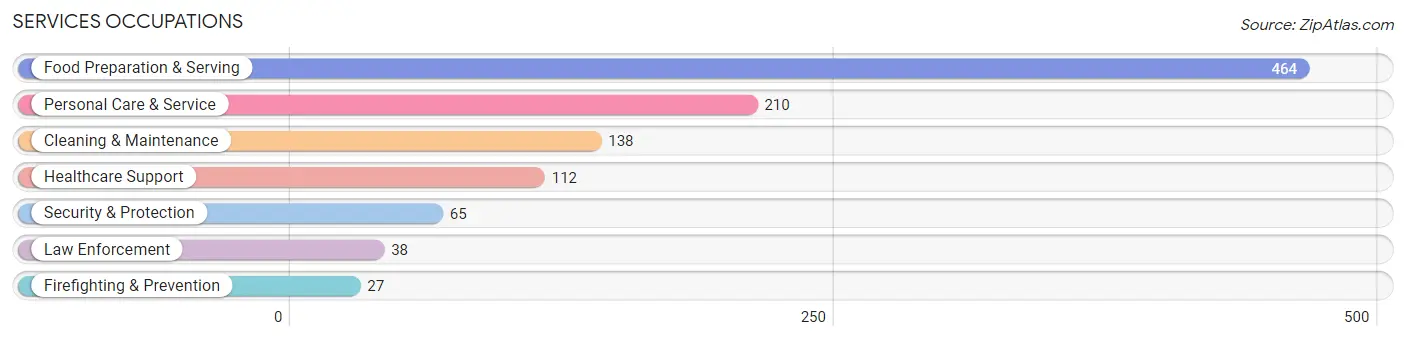
Services Occupations by Sex
Within the Services occupations in Hale County, the most male-oriented occupations are Law Enforcement (100.0%), Security & Protection (78.5%), and Cleaning & Maintenance (68.8%), while the most female-oriented occupations are Personal Care & Service (90.0%), Healthcare Support (87.5%), and Firefighting & Prevention (51.8%).
| Occupation | Male | Female |
| Healthcare Support | 14 (12.5%) | 98 (87.5%) |
| Security & Protection | 51 (78.5%) | 14 (21.5%) |
| Firefighting & Prevention | 13 (48.1%) | 14 (51.8%) |
| Law Enforcement | 38 (100.0%) | 0 (0.0%) |
| Food Preparation & Serving | 235 (50.6%) | 229 (49.3%) |
| Cleaning & Maintenance | 95 (68.8%) | 43 (31.2%) |
| Personal Care & Service | 21 (10.0%) | 189 (90.0%) |
| Total (Category) | 416 (42.1%) | 573 (57.9%) |
| Total (Overall) | 2,630 (48.4%) | 2,803 (51.6%) |
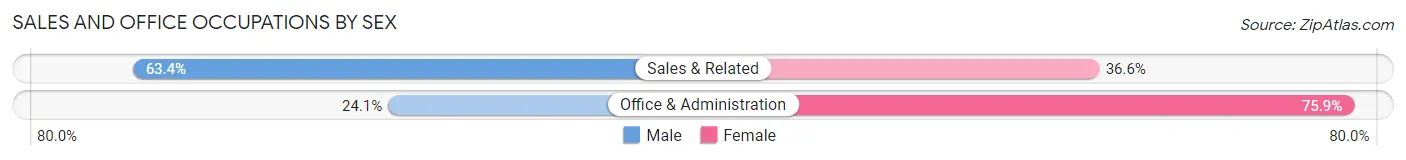
Sales and Office Occupations
The most common Sales and Office occupations in Hale County are Office & Administration (469 | 8.6%), and Sales & Related (464 | 8.5%).

Sales and Office Occupations by Sex
| Occupation | Male | Female |
| Sales & Related | 294 (63.4%) | 170 (36.6%) |
| Office & Administration | 113 (24.1%) | 356 (75.9%) |
| Total (Category) | 407 (43.6%) | 526 (56.4%) |
| Total (Overall) | 2,630 (48.4%) | 2,803 (51.6%) |
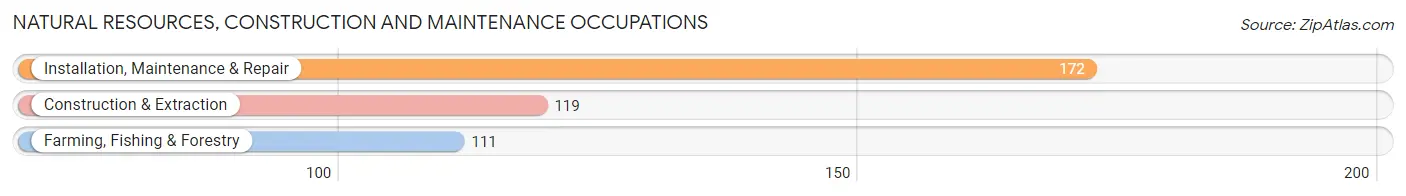
Natural Resources, Construction and Maintenance Occupations
The most common Natural Resources, Construction and Maintenance occupations in Hale County are Installation, Maintenance & Repair (172 | 3.2%), Construction & Extraction (119 | 2.2%), and Farming, Fishing & Forestry (111 | 2.0%).
Natural Resources, Construction and Maintenance Occupations by Sex

| Occupation | Male | Female |
| Farming, Fishing & Forestry | 107 (96.4%) | 4 (3.6%) |
| Construction & Extraction | 119 (100.0%) | 0 (0.0%) |
| Installation, Maintenance & Repair | 150 (87.2%) | 22 (12.8%) |
| Total (Category) | 376 (93.5%) | 26 (6.5%) |
| Total (Overall) | 2,630 (48.4%) | 2,803 (51.6%) |
Production, Transportation and Moving Occupations
The most common Production, Transportation and Moving occupations in Hale County are Production (457 | 8.4%), Material Moving (314 | 5.8%), and Transportation (280 | 5.1%).

Production, Transportation and Moving Occupations by Sex

| Occupation | Male | Female |
| Production | 284 (62.1%) | 173 (37.9%) |
| Transportation | 238 (85.0%) | 42 (15.0%) |
| Material Moving | 268 (85.4%) | 46 (14.6%) |
| Total (Category) | 790 (75.2%) | 261 (24.8%) |
| Total (Overall) | 2,630 (48.4%) | 2,803 (51.6%) |
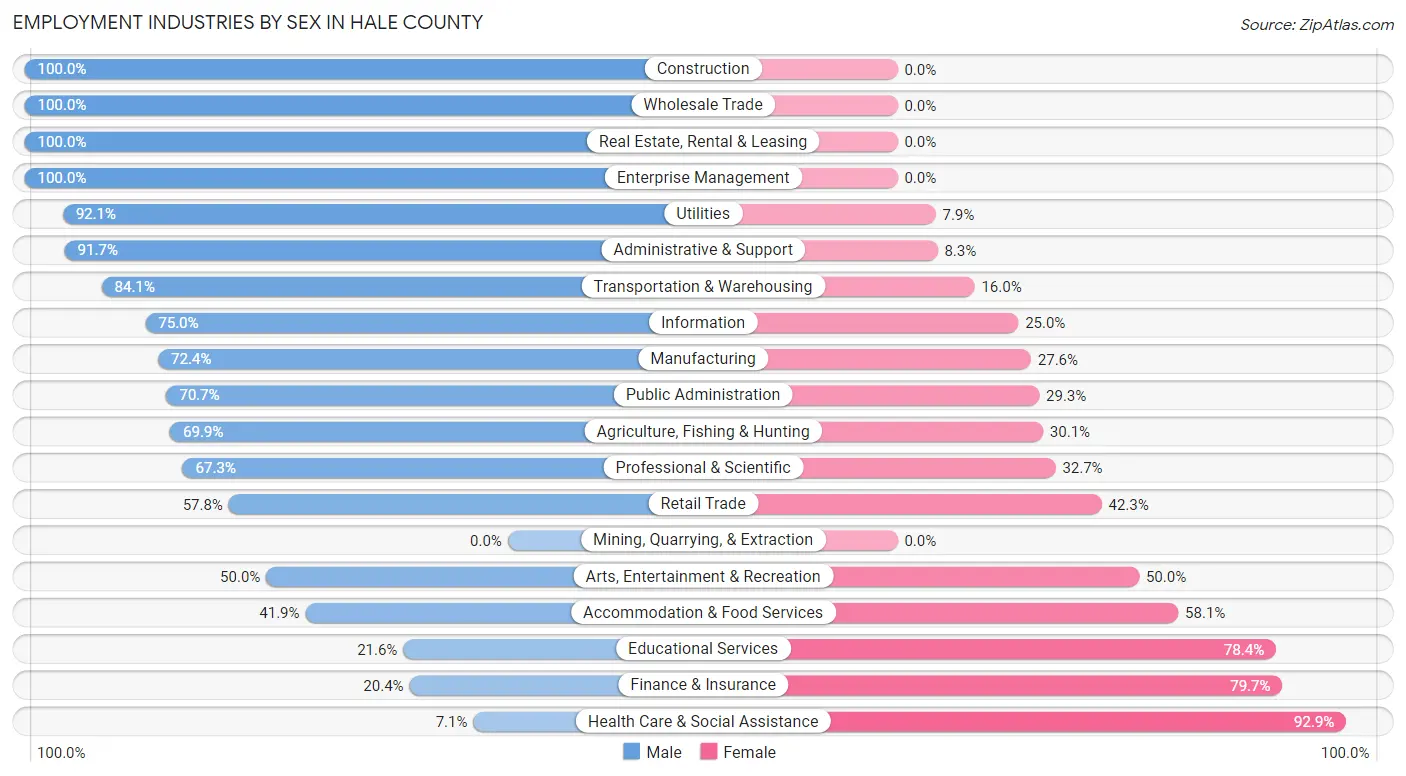
Employment Industries by Sex in Hale County
Employment Industries in Hale County
The major employment industries in Hale County include Health Care & Social Assistance (997 | 18.3%), Manufacturing (956 | 17.6%), Retail Trade (781 | 14.4%), Educational Services (610 | 11.2%), and Accommodation & Food Services (561 | 10.3%).

Employment Industries by Sex in Hale County
The Hale County industries that see more men than women are Construction (100.0%), Wholesale Trade (100.0%), and Real Estate, Rental & Leasing (100.0%), whereas the industries that tend to have a higher number of women are Health Care & Social Assistance (92.9%), Finance & Insurance (79.6%), and Educational Services (78.4%).
| Industry | Male | Female |
| Agriculture, Fishing & Hunting | 130 (69.9%) | 56 (30.1%) |
| Mining, Quarrying, & Extraction | 0 (0.0%) | 0 (0.0%) |
| Construction | 148 (100.0%) | 0 (0.0%) |
| Manufacturing | 692 (72.4%) | 264 (27.6%) |
| Wholesale Trade | 29 (100.0%) | 0 (0.0%) |
| Retail Trade | 451 (57.8%) | 330 (42.2%) |
| Transportation & Warehousing | 216 (84.1%) | 41 (16.0%) |
| Utilities | 35 (92.1%) | 3 (7.9%) |
| Information | 9 (75.0%) | 3 (25.0%) |
| Finance & Insurance | 23 (20.3%) | 90 (79.6%) |
| Real Estate, Rental & Leasing | 4 (100.0%) | 0 (0.0%) |
| Professional & Scientific | 72 (67.3%) | 35 (32.7%) |
| Enterprise Management | 7 (100.0%) | 0 (0.0%) |
| Administrative & Support | 166 (91.7%) | 15 (8.3%) |
| Educational Services | 132 (21.6%) | 478 (78.4%) |
| Health Care & Social Assistance | 71 (7.1%) | 926 (92.9%) |
| Arts, Entertainment & Recreation | 8 (50.0%) | 8 (50.0%) |
| Accommodation & Food Services | 235 (41.9%) | 326 (58.1%) |
| Public Administration | 106 (70.7%) | 44 (29.3%) |
| Total | 2,630 (48.4%) | 2,803 (51.6%) |
Education in Hale County
School Enrollment in Hale County
The most common levels of schooling among the 3,218 students in Hale County are elementary school (799 | 24.8%), high school (740 | 23.0%), and kindergarten (575 | 17.9%).

| School Level | # Students | % Students |
| Nursery / Preschool | 137 | 4.3% |
| Kindergarten | 575 | 17.9% |
| Elementary School | 799 | 24.8% |
| Middle School | 410 | 12.7% |
| High School | 740 | 23.0% |
| College / Undergraduate | 481 | 14.9% |
| Graduate / Professional | 76 | 2.4% |
| Total | 3,218 | 100.0% |
School Enrollment by Age by Funding Source in Hale County
Out of a total of 3,218 students who are enrolled in schools in Hale County, 422 (13.1%) attend a private institution, while the remaining 2,796 (86.9%) are enrolled in public schools. The age group of 5 to 9 year old has the highest likelihood of being enrolled in private schools, with 287 (21.6% in the age bracket) enrolled. Conversely, the age group of 18 to 19 year olds has the lowest likelihood of being enrolled in a private school, with 227 (100.0% in the age bracket) attending a public institution.
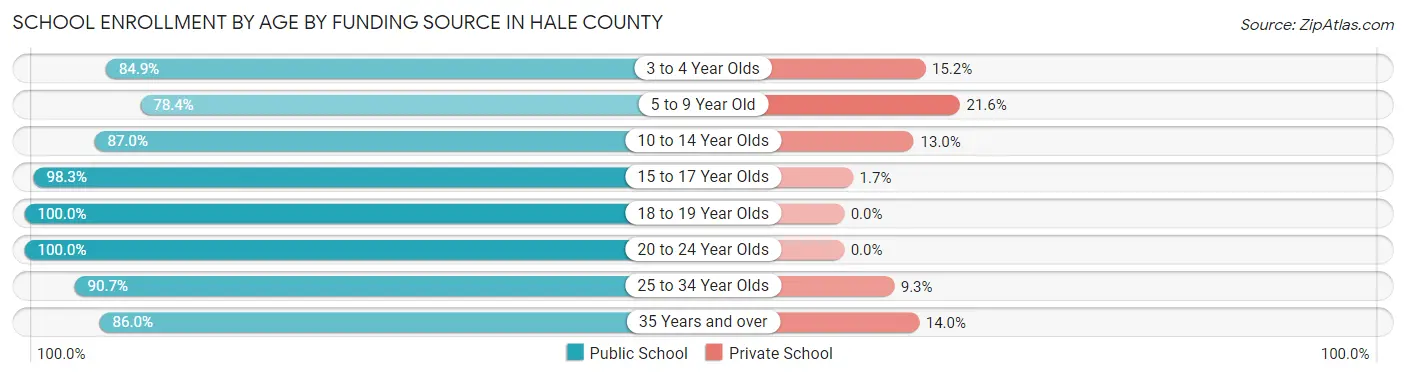
| Age Bracket | Public School | Private School |
| 3 to 4 Year Olds | 84 (84.9%) | 15 (15.1%) |
| 5 to 9 Year Old | 1,043 (78.4%) | 287 (21.6%) |
| 10 to 14 Year Olds | 534 (87.0%) | 80 (13.0%) |
| 15 to 17 Year Olds | 412 (98.3%) | 7 (1.7%) |
| 18 to 19 Year Olds | 227 (100.0%) | 0 (0.0%) |
| 20 to 24 Year Olds | 261 (100.0%) | 0 (0.0%) |
| 25 to 34 Year Olds | 68 (90.7%) | 7 (9.3%) |
| 35 Years and over | 166 (86.0%) | 27 (14.0%) |
| Total | 2,796 (86.9%) | 422 (13.1%) |
Educational Attainment by Field of Study in Hale County
Education (397 | 22.8%), business (291 | 16.7%), science & technology (269 | 15.4%), bio, nature & agricultural (250 | 14.3%), and arts & humanities (124 | 7.1%) are the most common fields of study among 1,742 individuals in Hale County who have obtained a bachelor's degree or higher.

| Field of Study | # Graduates | % Graduates |
| Computers & Mathematics | 58 | 3.3% |
| Bio, Nature & Agricultural | 250 | 14.3% |
| Physical & Health Sciences | 7 | 0.4% |
| Psychology | 19 | 1.1% |
| Social Sciences | 87 | 5.0% |
| Engineering | 115 | 6.6% |
| Multidisciplinary Studies | 24 | 1.4% |
| Science & Technology | 269 | 15.4% |
| Business | 291 | 16.7% |
| Education | 397 | 22.8% |
| Literature & Languages | 41 | 2.4% |
| Liberal Arts & History | 20 | 1.1% |
| Visual & Performing Arts | 40 | 2.3% |
| Communications | 0 | 0.0% |
| Arts & Humanities | 124 | 7.1% |
| Total | 1,742 | 100.0% |
Transportation & Commute in Hale County
Vehicle Availability by Sex in Hale County
The most prevalent vehicle ownership categories in Hale County are males with 2 vehicles (1,012, accounting for 38.8%) and females with 2 vehicles (741, making up 36.8%).
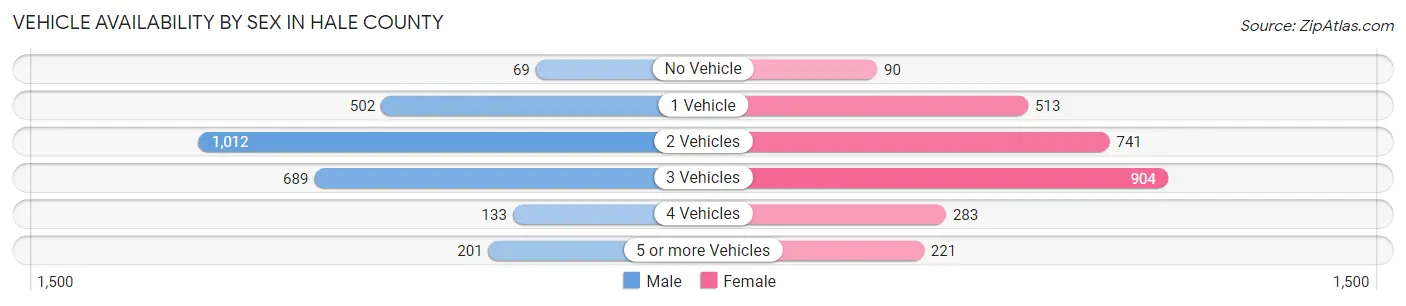
| Vehicles Available | Male | Female |
| No Vehicle | 69 (2.6%) | 90 (3.3%) |
| 1 Vehicle | 502 (19.3%) | 513 (18.6%) |
| 2 Vehicles | 1,012 (38.8%) | 741 (26.9%) |
| 3 Vehicles | 689 (26.4%) | 904 (32.9%) |
| 4 Vehicles | 133 (5.1%) | 283 (10.3%) |
| 5 or more Vehicles | 201 (7.7%) | 221 (8.0%) |
| Total | 2,606 (100.0%) | 2,752 (100.0%) |
Commute Time in Hale County
The most frequently occuring commute durations in Hale County are 30 to 34 minutes (797 commuters, 15.2%), 20 to 24 minutes (775 commuters, 14.8%), and 45 to 59 minutes (754 commuters, 14.4%).
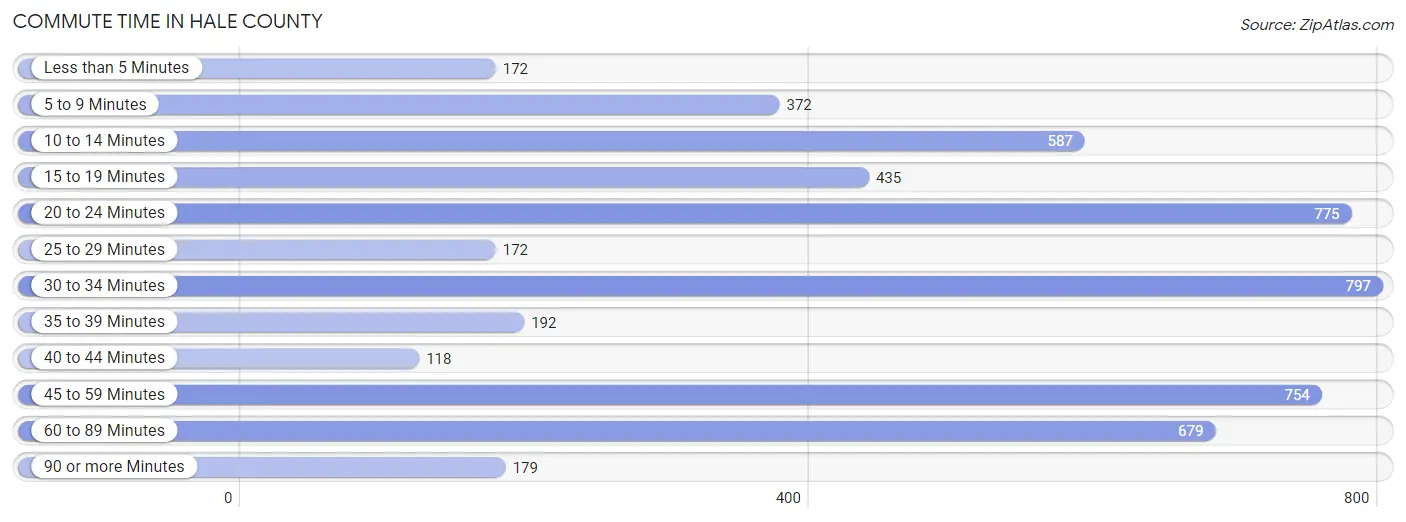
| Commute Time | # Commuters | % Commuters |
| Less than 5 Minutes | 172 | 3.3% |
| 5 to 9 Minutes | 372 | 7.1% |
| 10 to 14 Minutes | 587 | 11.2% |
| 15 to 19 Minutes | 435 | 8.3% |
| 20 to 24 Minutes | 775 | 14.8% |
| 25 to 29 Minutes | 172 | 3.3% |
| 30 to 34 Minutes | 797 | 15.2% |
| 35 to 39 Minutes | 192 | 3.7% |
| 40 to 44 Minutes | 118 | 2.3% |
| 45 to 59 Minutes | 754 | 14.4% |
| 60 to 89 Minutes | 679 | 13.0% |
| 90 or more Minutes | 179 | 3.4% |
Commute Time by Sex in Hale County
The most common commute times in Hale County are 60 to 89 minutes (439 commuters, 17.3%) for males and 20 to 24 minutes (438 commuters, 16.3%) for females.

| Commute Time | Male | Female |
| Less than 5 Minutes | 70 (2.8%) | 102 (3.8%) |
| 5 to 9 Minutes | 116 (4.6%) | 256 (9.5%) |
| 10 to 14 Minutes | 156 (6.1%) | 431 (16.0%) |
| 15 to 19 Minutes | 281 (11.1%) | 154 (5.7%) |
| 20 to 24 Minutes | 337 (13.3%) | 438 (16.3%) |
| 25 to 29 Minutes | 65 (2.6%) | 107 (4.0%) |
| 30 to 34 Minutes | 397 (15.6%) | 400 (14.9%) |
| 35 to 39 Minutes | 134 (5.3%) | 58 (2.2%) |
| 40 to 44 Minutes | 31 (1.2%) | 87 (3.2%) |
| 45 to 59 Minutes | 386 (15.2%) | 368 (13.7%) |
| 60 to 89 Minutes | 439 (17.3%) | 240 (8.9%) |
| 90 or more Minutes | 131 (5.1%) | 48 (1.8%) |
Time of Departure to Work by Sex in Hale County
The most frequent times of departure to work in Hale County are 7:00 AM to 7:29 AM (497, 19.5%) for males and 4:00 PM to 11:59 PM (392, 14.6%) for females.
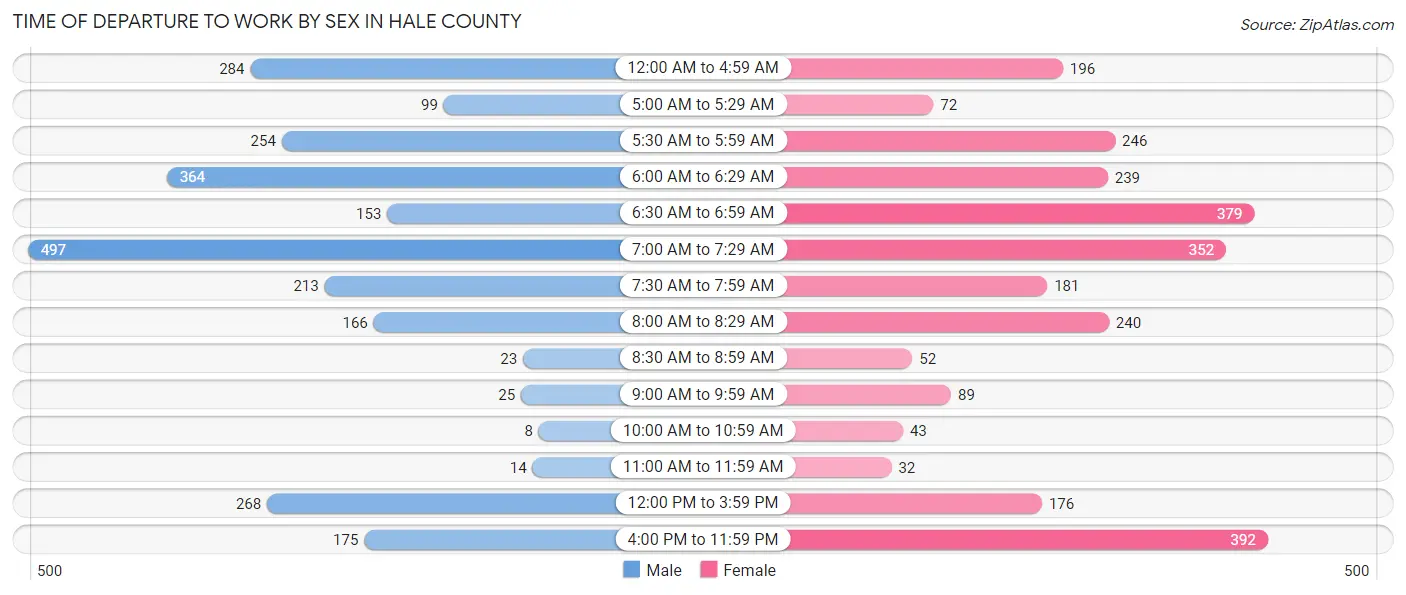
| Time of Departure | Male | Female |
| 12:00 AM to 4:59 AM | 284 (11.2%) | 196 (7.3%) |
| 5:00 AM to 5:29 AM | 99 (3.9%) | 72 (2.7%) |
| 5:30 AM to 5:59 AM | 254 (10.0%) | 246 (9.1%) |
| 6:00 AM to 6:29 AM | 364 (14.3%) | 239 (8.9%) |
| 6:30 AM to 6:59 AM | 153 (6.0%) | 379 (14.1%) |
| 7:00 AM to 7:29 AM | 497 (19.5%) | 352 (13.1%) |
| 7:30 AM to 7:59 AM | 213 (8.4%) | 181 (6.7%) |
| 8:00 AM to 8:29 AM | 166 (6.5%) | 240 (8.9%) |
| 8:30 AM to 8:59 AM | 23 (0.9%) | 52 (1.9%) |
| 9:00 AM to 9:59 AM | 25 (1.0%) | 89 (3.3%) |
| 10:00 AM to 10:59 AM | 8 (0.3%) | 43 (1.6%) |
| 11:00 AM to 11:59 AM | 14 (0.5%) | 32 (1.2%) |
| 12:00 PM to 3:59 PM | 268 (10.5%) | 176 (6.6%) |
| 4:00 PM to 11:59 PM | 175 (6.9%) | 392 (14.6%) |
| Total | 2,543 (100.0%) | 2,689 (100.0%) |
Housing Occupancy in Hale County
Occupancy by Ownership in Hale County
Of the total 5,403 dwellings in Hale County, owner-occupied units account for 4,187 (77.5%), while renter-occupied units make up 1,216 (22.5%).
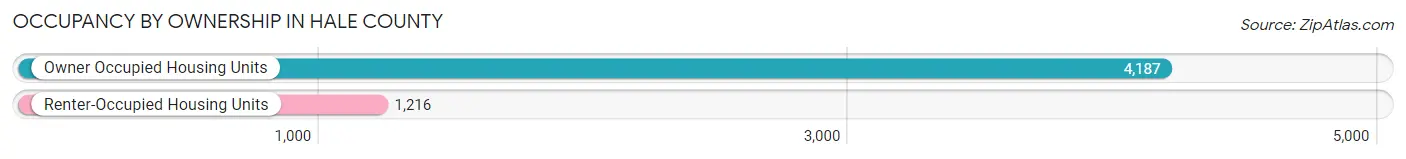
| Occupancy | # Housing Units | % Housing Units |
| Owner Occupied Housing Units | 4,187 | 77.5% |
| Renter-Occupied Housing Units | 1,216 | 22.5% |
| Total Occupied Housing Units | 5,403 | 100.0% |
Occupancy by Household Size in Hale County
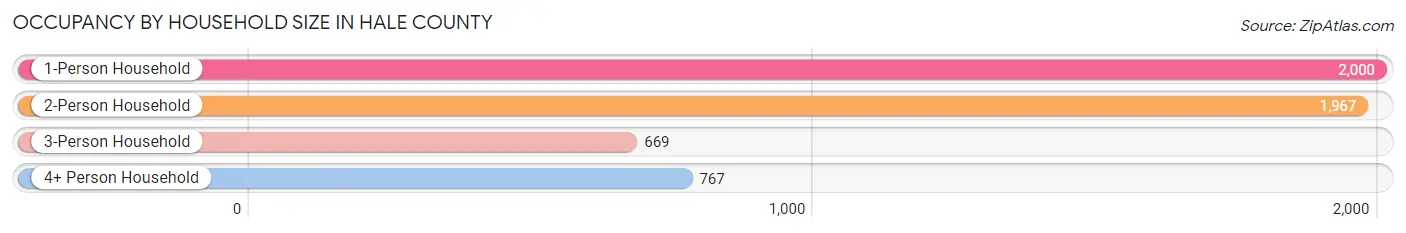
| Household Size | # Housing Units | % Housing Units |
| 1-Person Household | 2,000 | 37.0% |
| 2-Person Household | 1,967 | 36.4% |
| 3-Person Household | 669 | 12.4% |
| 4+ Person Household | 767 | 14.2% |
| Total Housing Units | 5,403 | 100.0% |
Occupancy by Ownership by Household Size in Hale County

| Household Size | Owner-occupied | Renter-occupied |
| 1-Person Household | 1,363 (68.1%) | 637 (31.9%) |
| 2-Person Household | 1,624 (82.6%) | 343 (17.4%) |
| 3-Person Household | 638 (95.4%) | 31 (4.6%) |
| 4+ Person Household | 562 (73.3%) | 205 (26.7%) |
| Total Housing Units | 4,187 (77.5%) | 1,216 (22.5%) |
Occupancy by Educational Attainment in Hale County
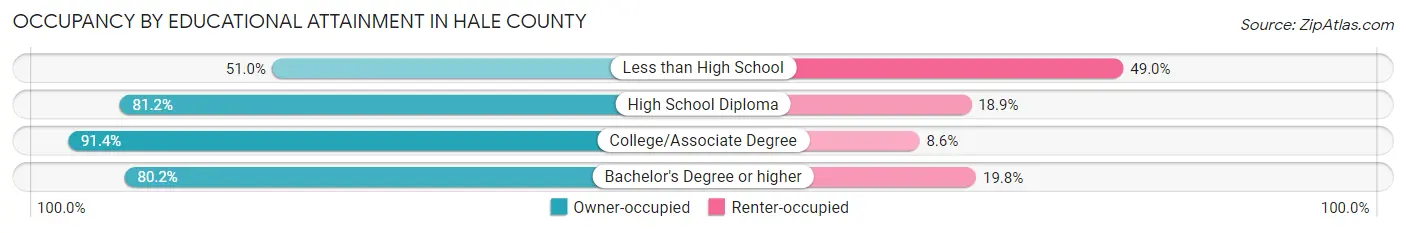
| Household Size | Owner-occupied | Renter-occupied |
| Less than High School | 564 (51.0%) | 542 (49.0%) |
| High School Diploma | 1,718 (81.1%) | 399 (18.9%) |
| College/Associate Degree | 1,277 (91.4%) | 120 (8.6%) |
| Bachelor's Degree or higher | 628 (80.2%) | 155 (19.8%) |
Occupancy by Age of Householder in Hale County

| Age Bracket | # Households | % Households |
| Under 35 Years | 657 | 12.2% |
| 35 to 44 Years | 732 | 13.6% |
| 45 to 54 Years | 852 | 15.8% |
| 55 to 64 Years | 1,192 | 22.1% |
| 65 to 74 Years | 1,189 | 22.0% |
| 75 to 84 Years | 524 | 9.7% |
| 85 Years and Over | 257 | 4.8% |
| Total | 5,403 | 100.0% |
Housing Finances in Hale County
Median Income by Occupancy in Hale County
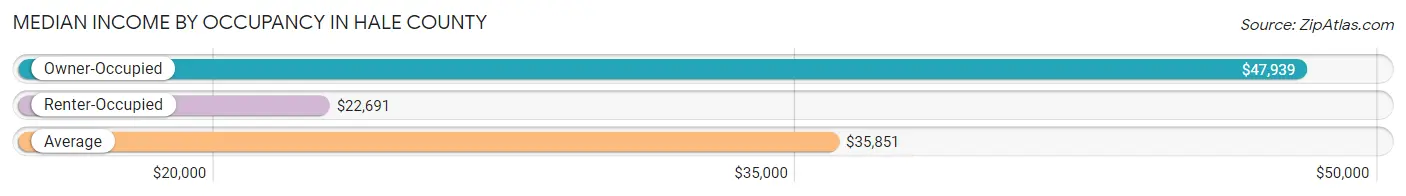
| Occupancy Type | # Households | Median Income |
| Owner-Occupied | 4,187 (77.5%) | $47,939 |
| Renter-Occupied | 1,216 (22.5%) | $22,691 |
| Average | 5,403 (100.0%) | $35,851 |
Occupancy by Householder Income Bracket in Hale County
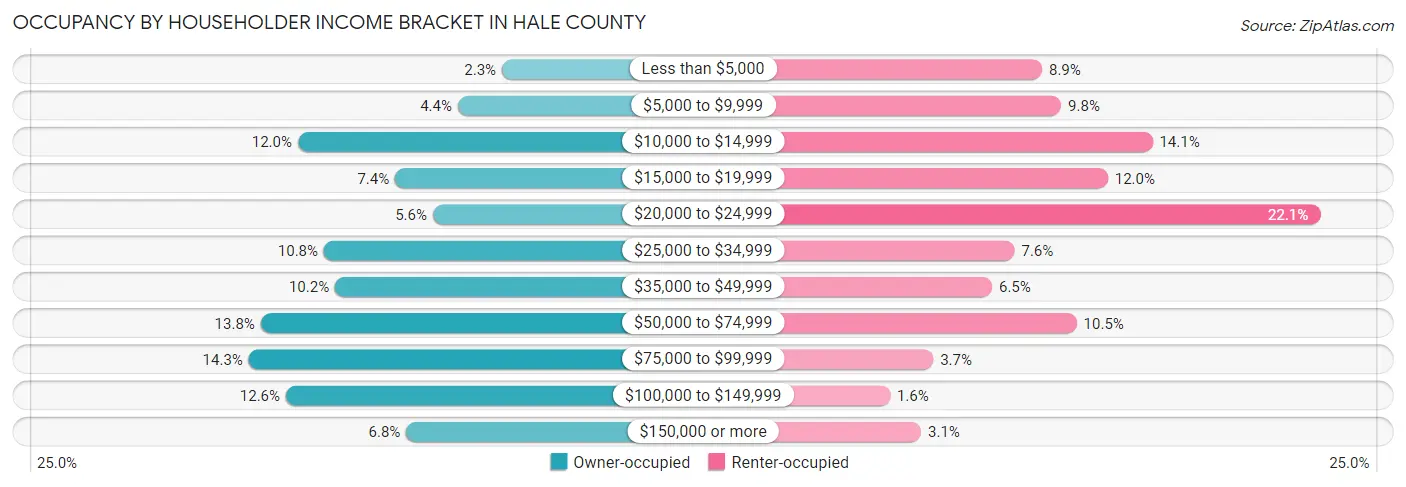
| Income Bracket | Owner-occupied | Renter-occupied |
| Less than $5,000 | 95 (2.3%) | 108 (8.9%) |
| $5,000 to $9,999 | 183 (4.4%) | 119 (9.8%) |
| $10,000 to $14,999 | 502 (12.0%) | 172 (14.1%) |
| $15,000 to $19,999 | 308 (7.4%) | 146 (12.0%) |
| $20,000 to $24,999 | 233 (5.6%) | 269 (22.1%) |
| $25,000 to $34,999 | 450 (10.7%) | 92 (7.6%) |
| $35,000 to $49,999 | 428 (10.2%) | 79 (6.5%) |
| $50,000 to $74,999 | 576 (13.8%) | 128 (10.5%) |
| $75,000 to $99,999 | 600 (14.3%) | 45 (3.7%) |
| $100,000 to $149,999 | 526 (12.6%) | 20 (1.6%) |
| $150,000 or more | 286 (6.8%) | 38 (3.1%) |
| Total | 4,187 (100.0%) | 1,216 (100.0%) |
Monthly Housing Cost Tiers in Hale County

| Monthly Cost | Owner-occupied | Renter-occupied |
| Less than $300 | 749 (17.9%) | 101 (8.3%) |
| $300 to $499 | 1,251 (29.9%) | 147 (12.1%) |
| $500 to $799 | 680 (16.2%) | 446 (36.7%) |
| $800 to $999 | 483 (11.5%) | 96 (7.9%) |
| $1,000 to $1,499 | 788 (18.8%) | 171 (14.1%) |
| $1,500 to $1,999 | 148 (3.5%) | 0 (0.0%) |
| $2,000 to $2,499 | 78 (1.9%) | 0 (0.0%) |
| $2,500 to $2,999 | 0 (0.0%) | 0 (0.0%) |
| $3,000 or more | 10 (0.2%) | 0 (0.0%) |
| Total | 4,187 (100.0%) | 1,216 (100.0%) |
Physical Housing Characteristics in Hale County
Housing Structures in Hale County
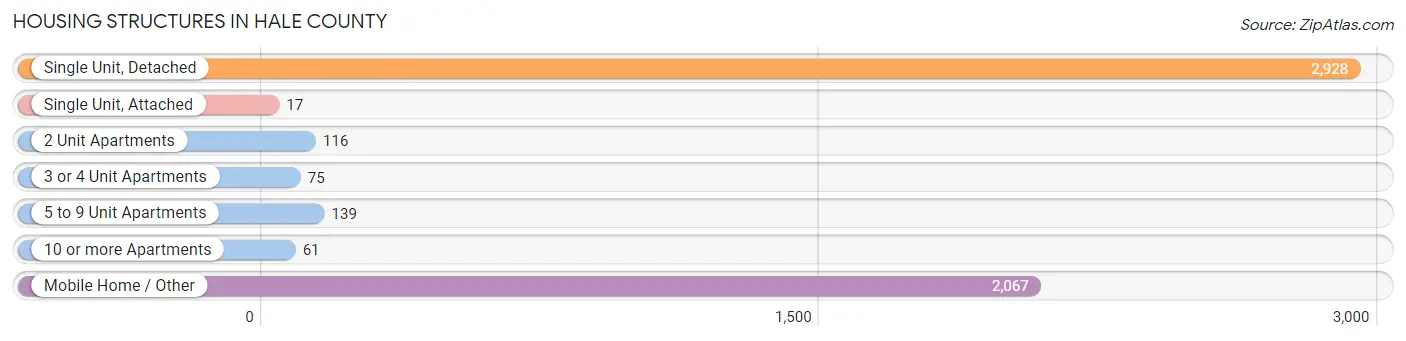
| Structure Type | # Housing Units | % Housing Units |
| Single Unit, Detached | 2,928 | 54.2% |
| Single Unit, Attached | 17 | 0.3% |
| 2 Unit Apartments | 116 | 2.1% |
| 3 or 4 Unit Apartments | 75 | 1.4% |
| 5 to 9 Unit Apartments | 139 | 2.6% |
| 10 or more Apartments | 61 | 1.1% |
| Mobile Home / Other | 2,067 | 38.3% |
| Total | 5,403 | 100.0% |
Housing Structures by Occupancy in Hale County
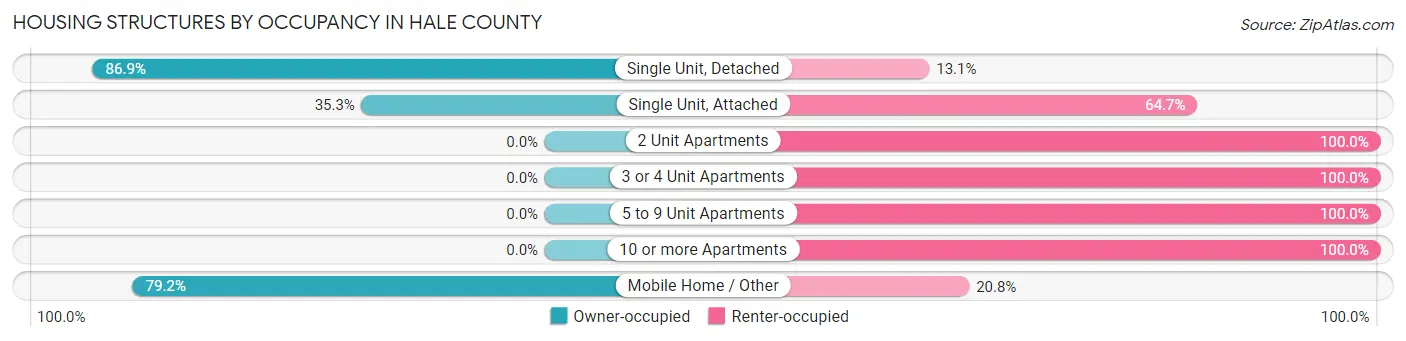
| Structure Type | Owner-occupied | Renter-occupied |
| Single Unit, Detached | 2,544 (86.9%) | 384 (13.1%) |
| Single Unit, Attached | 6 (35.3%) | 11 (64.7%) |
| 2 Unit Apartments | 0 (0.0%) | 116 (100.0%) |
| 3 or 4 Unit Apartments | 0 (0.0%) | 75 (100.0%) |
| 5 to 9 Unit Apartments | 0 (0.0%) | 139 (100.0%) |
| 10 or more Apartments | 0 (0.0%) | 61 (100.0%) |
| Mobile Home / Other | 1,637 (79.2%) | 430 (20.8%) |
| Total | 4,187 (77.5%) | 1,216 (22.5%) |
Housing Structures by Number of Rooms in Hale County
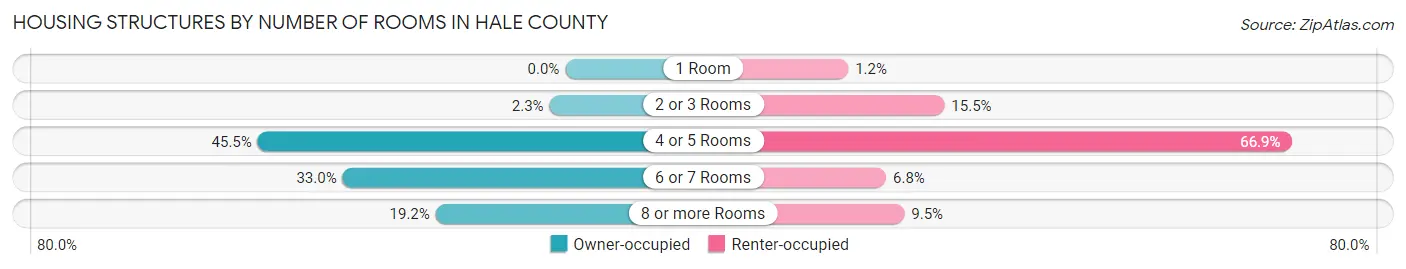
| Number of Rooms | Owner-occupied | Renter-occupied |
| 1 Room | 0 (0.0%) | 15 (1.2%) |
| 2 or 3 Rooms | 98 (2.3%) | 188 (15.5%) |
| 4 or 5 Rooms | 1,906 (45.5%) | 814 (66.9%) |
| 6 or 7 Rooms | 1,380 (33.0%) | 83 (6.8%) |
| 8 or more Rooms | 803 (19.2%) | 116 (9.5%) |
| Total | 4,187 (100.0%) | 1,216 (100.0%) |
Housing Structure by Heating Type in Hale County
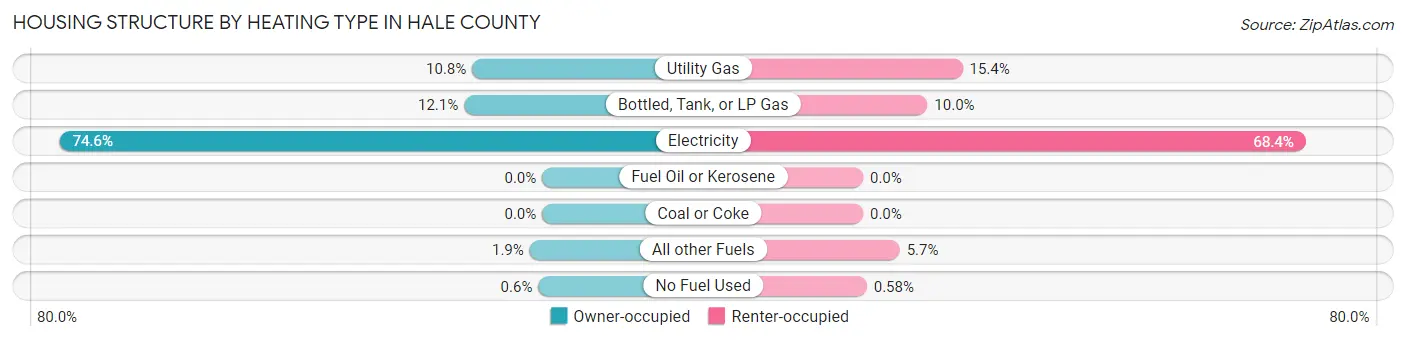
| Heating Type | Owner-occupied | Renter-occupied |
| Utility Gas | 453 (10.8%) | 187 (15.4%) |
| Bottled, Tank, or LP Gas | 505 (12.1%) | 121 (10.0%) |
| Electricity | 3,123 (74.6%) | 832 (68.4%) |
| Fuel Oil or Kerosene | 0 (0.0%) | 0 (0.0%) |
| Coal or Coke | 0 (0.0%) | 0 (0.0%) |
| All other Fuels | 81 (1.9%) | 69 (5.7%) |
| No Fuel Used | 25 (0.6%) | 7 (0.6%) |
| Total | 4,187 (100.0%) | 1,216 (100.0%) |
Household Vehicle Usage in Hale County
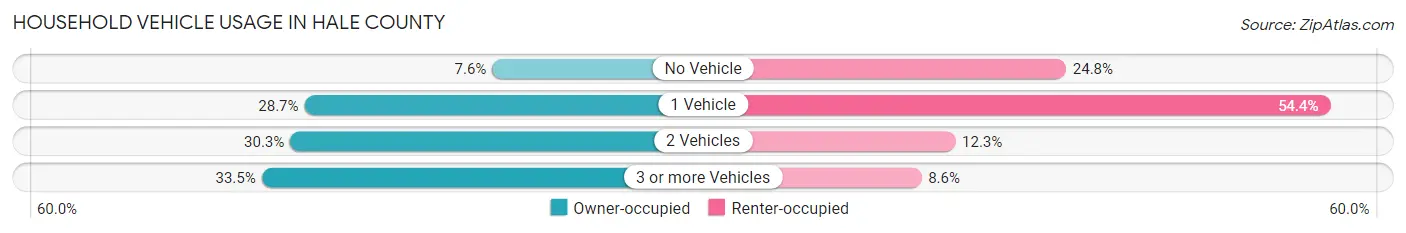
| Vehicles per Household | Owner-occupied | Renter-occupied |
| No Vehicle | 319 (7.6%) | 301 (24.7%) |
| 1 Vehicle | 1,200 (28.7%) | 661 (54.4%) |
| 2 Vehicles | 1,267 (30.3%) | 150 (12.3%) |
| 3 or more Vehicles | 1,401 (33.5%) | 104 (8.6%) |
| Total | 4,187 (100.0%) | 1,216 (100.0%) |
Real Estate & Mortgages in Hale County
Real Estate and Mortgage Overview in Hale County
| Characteristic | Without Mortgage | With Mortgage |
| Housing Units | 2,549 | 1,638 |
| Median Property Value | $93,900 | $131,400 |
| Median Household Income | $36,845 | $153 |
| Monthly Housing Costs | $374 | $10 |
| Real Estate Taxes | $318 | $329 |
Property Value by Mortgage Status in Hale County

| Property Value | Without Mortgage | With Mortgage |
| Less than $50,000 | 666 (26.1%) | 269 (16.4%) |
| $50,000 to $99,999 | 641 (25.2%) | 409 (25.0%) |
| $100,000 to $299,999 | 862 (33.8%) | 785 (47.9%) |
| $300,000 to $499,999 | 293 (11.5%) | 150 (9.2%) |
| $500,000 to $749,999 | 46 (1.8%) | 25 (1.5%) |
| $750,000 to $999,999 | 0 (0.0%) | 0 (0.0%) |
| $1,000,000 or more | 41 (1.6%) | 0 (0.0%) |
| Total | 2,549 (100.0%) | 1,638 (100.0%) |
Household Income by Mortgage Status in Hale County
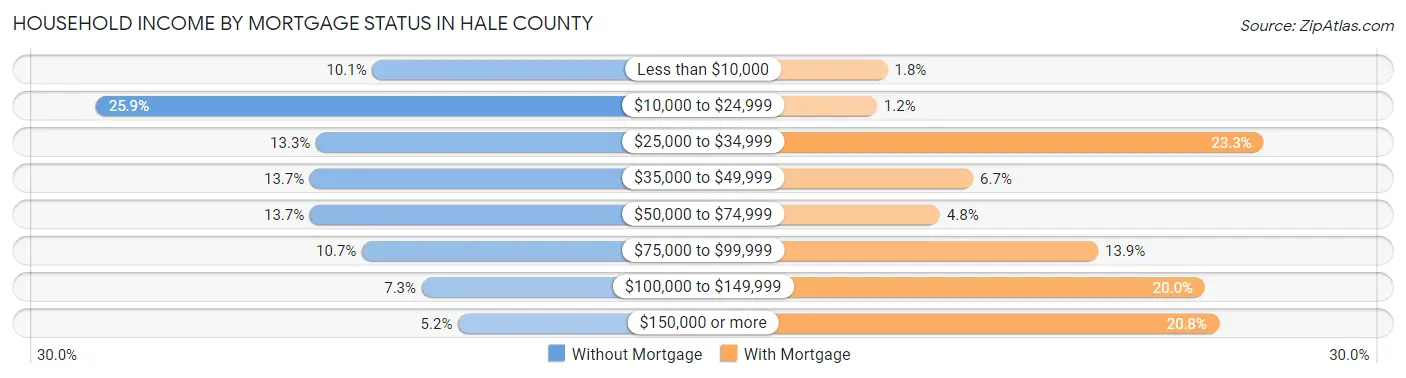
| Household Income | Without Mortgage | With Mortgage |
| Less than $10,000 | 258 (10.1%) | 30 (1.8%) |
| $10,000 to $24,999 | 661 (25.9%) | 20 (1.2%) |
| $25,000 to $34,999 | 340 (13.3%) | 382 (23.3%) |
| $35,000 to $49,999 | 349 (13.7%) | 110 (6.7%) |
| $50,000 to $74,999 | 349 (13.7%) | 79 (4.8%) |
| $75,000 to $99,999 | 273 (10.7%) | 227 (13.9%) |
| $100,000 to $149,999 | 186 (7.3%) | 327 (20.0%) |
| $150,000 or more | 133 (5.2%) | 340 (20.8%) |
| Total | 2,549 (100.0%) | 1,638 (100.0%) |
Property Value to Household Income Ratio in Hale County

| Value-to-Income Ratio | Without Mortgage | With Mortgage |
| Less than 2.0x | 1,108 (43.5%) | 75,076 (4,583.4%) |
| 2.0x to 2.9x | 322 (12.6%) | 711 (43.4%) |
| 3.0x to 3.9x | 124 (4.9%) | 373 (22.8%) |
| 4.0x or more | 943 (37.0%) | 154 (9.4%) |
| Total | 2,549 (100.0%) | 1,638 (100.0%) |
Real Estate Taxes by Mortgage Status in Hale County
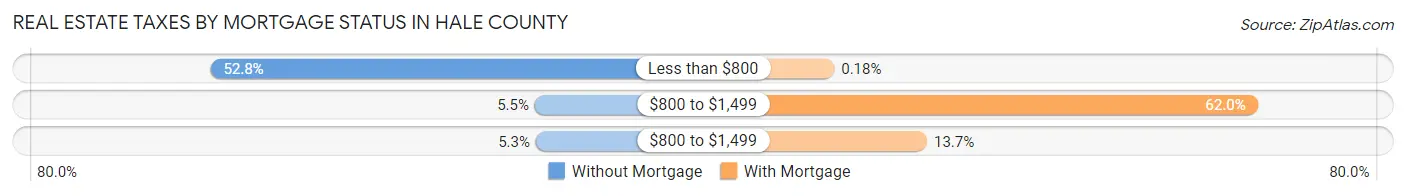
| Property Taxes | Without Mortgage | With Mortgage |
| Less than $800 | 1,347 (52.8%) | 3 (0.2%) |
| $800 to $1,499 | 139 (5.4%) | 1,016 (62.0%) |
| $800 to $1,499 | 135 (5.3%) | 225 (13.7%) |
| Total | 2,549 (100.0%) | 1,638 (100.0%) |
Health & Disability in Hale County
Health Insurance Coverage by Age in Hale County
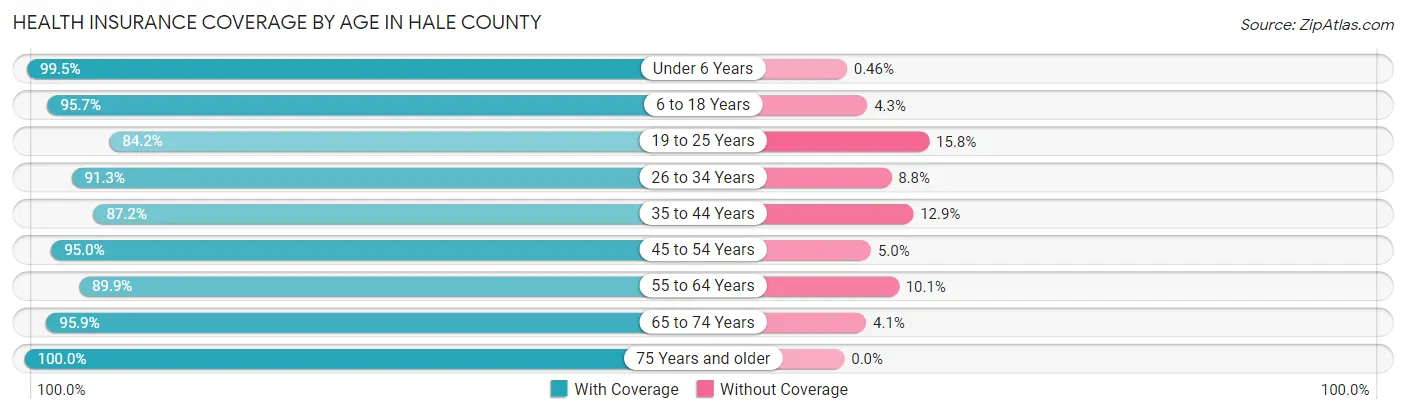
| Age Bracket | With Coverage | Without Coverage |
| Under 6 Years | 1,307 (99.5%) | 6 (0.5%) |
| 6 to 18 Years | 2,242 (95.7%) | 100 (4.3%) |
| 19 to 25 Years | 1,144 (84.2%) | 215 (15.8%) |
| 26 to 34 Years | 1,471 (91.2%) | 141 (8.7%) |
| 35 to 44 Years | 1,309 (87.2%) | 193 (12.9%) |
| 45 to 54 Years | 1,472 (95.0%) | 77 (5.0%) |
| 55 to 64 Years | 1,862 (89.9%) | 210 (10.1%) |
| 65 to 74 Years | 1,654 (95.9%) | 70 (4.1%) |
| 75 Years and older | 1,040 (100.0%) | 0 (0.0%) |
| Total | 13,501 (93.0%) | 1,012 (7.0%) |
Health Insurance Coverage by Citizenship Status in Hale County
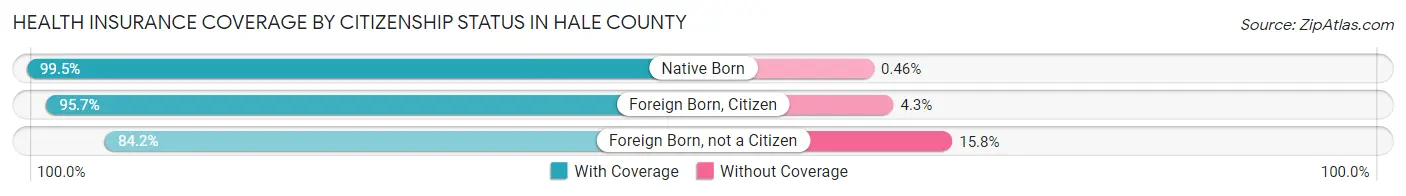
| Citizenship Status | With Coverage | Without Coverage |
| Native Born | 1,307 (99.5%) | 6 (0.5%) |
| Foreign Born, Citizen | 2,242 (95.7%) | 100 (4.3%) |
| Foreign Born, not a Citizen | 1,144 (84.2%) | 215 (15.8%) |
Health Insurance Coverage by Household Income in Hale County
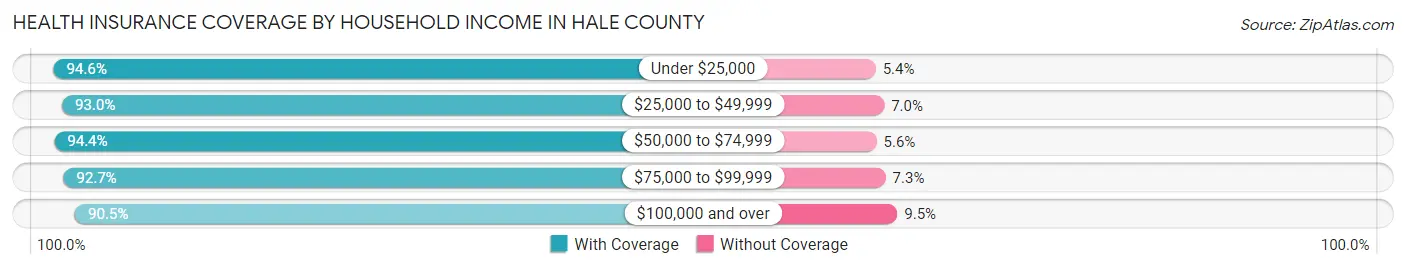
| Household Income | With Coverage | Without Coverage |
| Under $25,000 | 3,943 (94.6%) | 226 (5.4%) |
| $25,000 to $49,999 | 2,532 (93.0%) | 191 (7.0%) |
| $50,000 to $74,999 | 2,029 (94.4%) | 120 (5.6%) |
| $75,000 to $99,999 | 1,808 (92.7%) | 142 (7.3%) |
| $100,000 and over | 3,183 (90.5%) | 333 (9.5%) |
Public vs Private Health Insurance Coverage by Age in Hale County
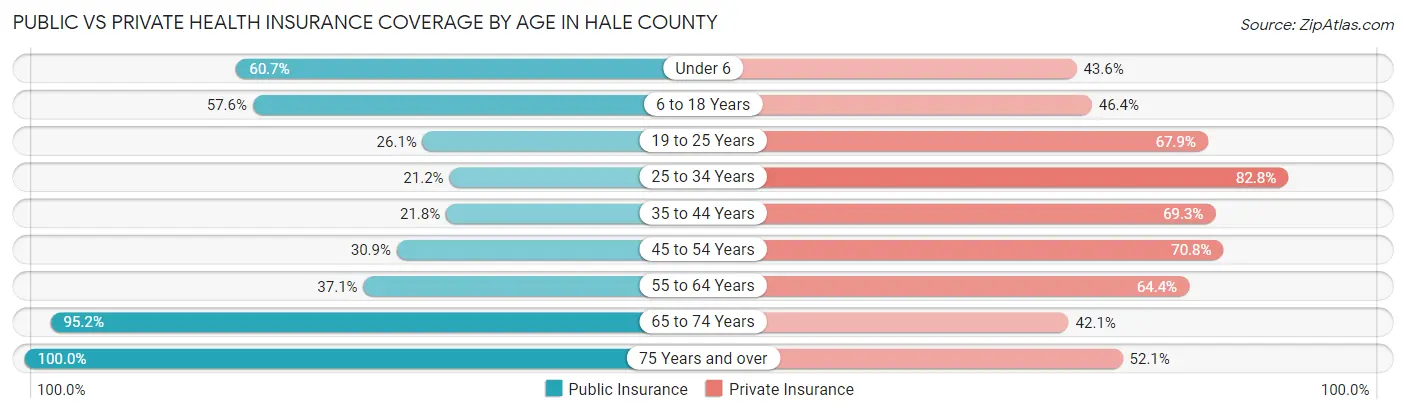
| Age Bracket | Public Insurance | Private Insurance |
| Under 6 | 797 (60.7%) | 572 (43.6%) |
| 6 to 18 Years | 1,350 (57.6%) | 1,087 (46.4%) |
| 19 to 25 Years | 355 (26.1%) | 923 (67.9%) |
| 25 to 34 Years | 341 (21.1%) | 1,335 (82.8%) |
| 35 to 44 Years | 327 (21.8%) | 1,041 (69.3%) |
| 45 to 54 Years | 479 (30.9%) | 1,097 (70.8%) |
| 55 to 64 Years | 769 (37.1%) | 1,335 (64.4%) |
| 65 to 74 Years | 1,641 (95.2%) | 726 (42.1%) |
| 75 Years and over | 1,040 (100.0%) | 542 (52.1%) |
| Total | 7,099 (48.9%) | 8,658 (59.7%) |
Disability Status by Sex by Age in Hale County
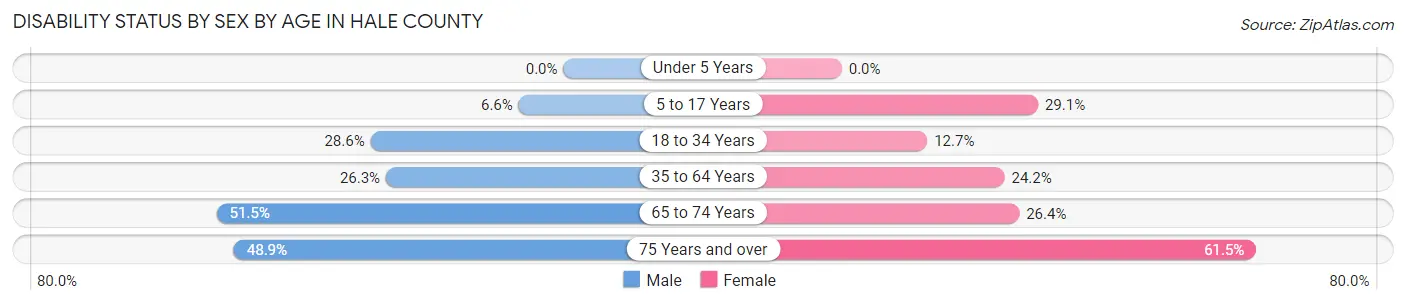
| Age Bracket | Male | Female |
| Under 5 Years | 0 (0.0%) | 0 (0.0%) |
| 5 to 17 Years | 86 (6.6%) | 344 (29.1%) |
| 18 to 34 Years | 417 (28.6%) | 219 (12.7%) |
| 35 to 64 Years | 640 (26.3%) | 651 (24.2%) |
| 65 to 74 Years | 450 (51.5%) | 224 (26.4%) |
| 75 Years and over | 182 (48.9%) | 411 (61.5%) |
Disability Class by Sex by Age in Hale County
Disability Class: Hearing Difficulty

| Age Bracket | Male | Female |
| Under 5 Years | 0 (0.0%) | 0 (0.0%) |
| 5 to 17 Years | 0 (0.0%) | 0 (0.0%) |
| 18 to 34 Years | 0 (0.0%) | 18 (1.0%) |
| 35 to 64 Years | 164 (6.8%) | 45 (1.7%) |
| 65 to 74 Years | 240 (27.5%) | 47 (5.5%) |
| 75 Years and over | 78 (21.0%) | 175 (26.2%) |
Disability Class: Vision Difficulty
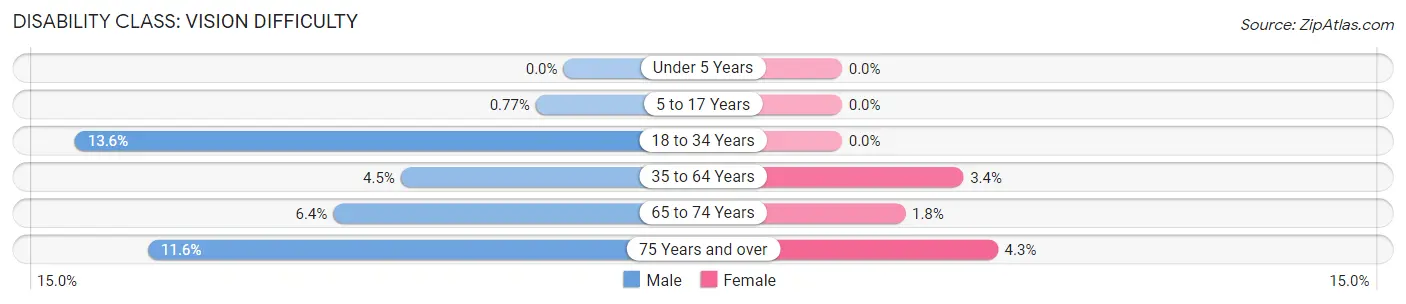
| Age Bracket | Male | Female |
| Under 5 Years | 0 (0.0%) | 0 (0.0%) |
| 5 to 17 Years | 10 (0.8%) | 0 (0.0%) |
| 18 to 34 Years | 198 (13.6%) | 0 (0.0%) |
| 35 to 64 Years | 110 (4.5%) | 91 (3.4%) |
| 65 to 74 Years | 56 (6.4%) | 15 (1.8%) |
| 75 Years and over | 43 (11.6%) | 29 (4.3%) |
Disability Class: Cognitive Difficulty
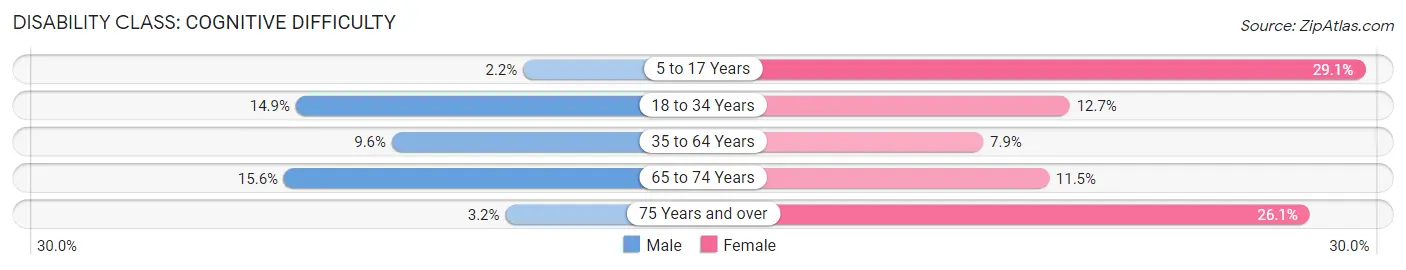
| Age Bracket | Male | Female |
| 5 to 17 Years | 29 (2.2%) | 344 (29.1%) |
| 18 to 34 Years | 217 (14.9%) | 219 (12.7%) |
| 35 to 64 Years | 232 (9.6%) | 212 (7.9%) |
| 65 to 74 Years | 136 (15.6%) | 98 (11.5%) |
| 75 Years and over | 12 (3.2%) | 174 (26.1%) |
Disability Class: Ambulatory Difficulty

| Age Bracket | Male | Female |
| 5 to 17 Years | 47 (3.6%) | 0 (0.0%) |
| 18 to 34 Years | 37 (2.5%) | 0 (0.0%) |
| 35 to 64 Years | 335 (13.8%) | 454 (16.9%) |
| 65 to 74 Years | 226 (25.9%) | 161 (18.9%) |
| 75 Years and over | 87 (23.4%) | 258 (38.6%) |
Disability Class: Self-Care Difficulty
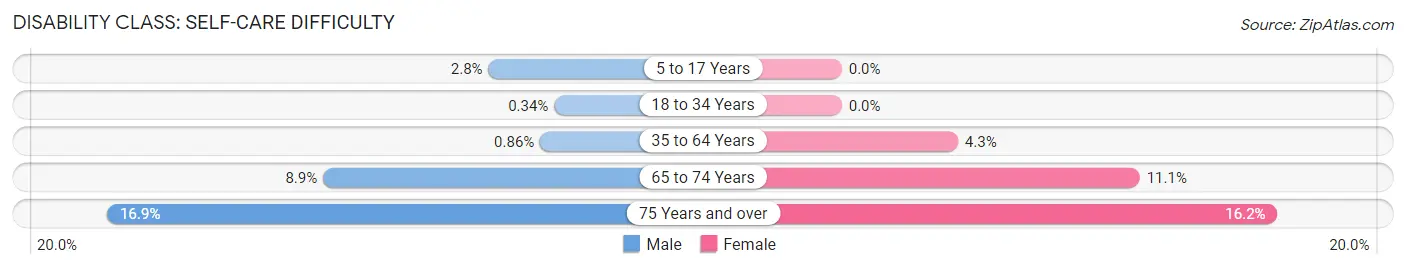
| Age Bracket | Male | Female |
| 5 to 17 Years | 36 (2.8%) | 0 (0.0%) |
| 18 to 34 Years | 5 (0.3%) | 0 (0.0%) |
| 35 to 64 Years | 21 (0.9%) | 116 (4.3%) |
| 65 to 74 Years | 78 (8.9%) | 94 (11.1%) |
| 75 Years and over | 63 (16.9%) | 108 (16.2%) |
Technology Access in Hale County
Computing Device Access in Hale County

| Device Type | # Households | % Households |
| Desktop or Laptop | 2,466 | 45.6% |
| Smartphone | 4,017 | 74.4% |
| Tablet | 2,410 | 44.6% |
| No Computing Device | 1,107 | 20.5% |
| Total | 5,403 | 100.0% |
Internet Access in Hale County
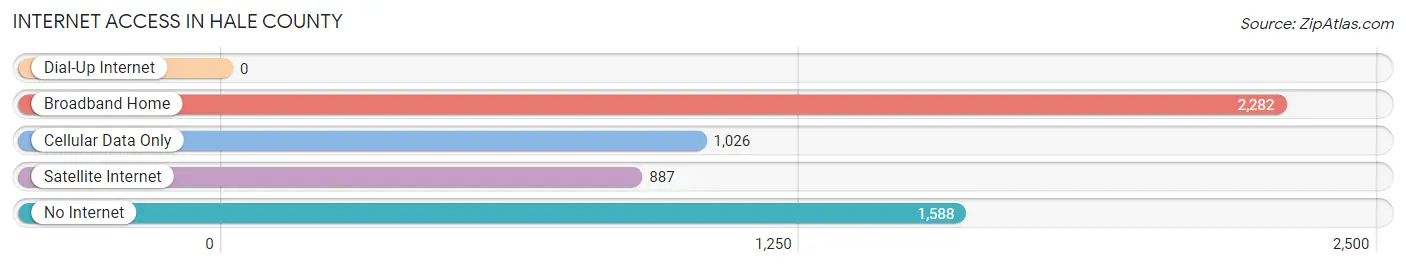
| Internet Type | # Households | % Households |
| Dial-Up Internet | 0 | 0.0% |
| Broadband Home | 2,282 | 42.2% |
| Cellular Data Only | 1,026 | 19.0% |
| Satellite Internet | 887 | 16.4% |
| No Internet | 1,588 | 29.4% |
| Total | 5,403 | 100.0% |
Hale County Summary
Hale County is located in the west-central part of the state of Alabama, in the United States. It is bordered by Tuscaloosa County to the north, Bibb County to the east, Perry County to the south, and Sumter County to the west. The county seat is Greensboro, and the largest city is Moundville.
History
Hale County was established in 1867, and was named for Confederate Colonel Stephen F. Hale. The county was formed from parts of Greene, Marengo, and Tuscaloosa counties. The first settlers in the area were Native Americans, who were later joined by European settlers in the early 19th century. The county was largely agricultural, with cotton being the main crop.
Geography
Hale County covers an area of 645 square miles, and is located in the Black Belt region of Alabama. The terrain is mostly flat, with some rolling hills in the northern part of the county. The main waterway is the Tombigbee River, which forms the western border of the county. Other major waterways include the Sipsey River, the Mulberry Fork, and the Locust Fork.
The climate of Hale County is humid subtropical, with hot, humid summers and mild winters. The average annual temperature is around 64°F, and the average annual precipitation is around 50 inches.
Economy
The economy of Hale County is largely based on agriculture. The main crops are cotton, soybeans, corn, and peanuts. Other important agricultural products include hay, wheat, and sorghum. The county also has a thriving timber industry, and is home to several manufacturing plants.
Demographics
As of the 2010 census, the population of Hale County was 15,760. The racial makeup of the county was 68.3% White, 29.2% Black or African American, 0.3% Native American, 0.2% Asian, 0.1% Pacific Islander, 0.7% from other races, and 1.4% from two or more races. The median household income was $31,945, and the median family income was $39,945.
Hale County is home to a large number of churches, representing a variety of denominations. The largest religious group is the Southern Baptist Convention, followed by the United Methodist Church, the Church of God, and the Church of Christ. The county also has a large number of private schools, including several Christian schools.
Common Questions
What is the Total Population of Hale County?
Total Population of Hale County is 14,742.
What is the Total Male Population of Hale County?
Total Male Population of Hale County is 7,020.
What is the Total Female Population of Hale County?
Total Female Population of Hale County is 7,722.
What is the Ratio of Males per 100 Females in Hale County?
There are 90.91 Males per 100 Females in Hale County.
What is the Ratio of Females per 100 Males in Hale County?
There are 110.00 Females per 100 Males in Hale County.
What is the Median Population Age in Hale County?
Median Population Age in Hale County is 40.5 Years.
What is the Average Family Size in Hale County
Average Family Size in Hale County is 3.7 People.
What is the Average Household Size in Hale County
Average Household Size in Hale County is 2.7 People.
What is Per Capita Income in Hale County?
Per Capita income in Hale County is $23,690.
What is the Median Family Income in Hale County?
Median Family Income in Hale County is $64,661.
What is the Median Household income in Hale County?
Median Household Income in Hale County is $35,851.
What is Income or Wage Gap in Hale County?
Income or Wage Gap in Hale County is 37.3%.
Women in Hale County earn 62.7 cents for every dollar earned by a man.
What is Family Income Deficit in Hale County?
Family Income Deficit in Hale County is $7,675.
Families that are below poverty line in Hale County earn $7,675 less on average than the poverty threshold level.
What is Inequality or Gini Index in Hale County?
Inequality or Gini Index in Hale County is 0.51.
How Large is the Labor Force in Hale County?
There are 5,900 People in the Labor Forcein in Hale County.
What is the Percentage of People in the Labor Force in Hale County?
50.9% of People are in the Labor Force in Hale County.
What is the Unemployment Rate in Hale County?
Unemployment Rate in Hale County is 7.6%.