Greene County, AL
Greene County Map
Greene County Overview
7,706
TOTAL POPULATION
3,707
MALE POPULATION
3,999
FEMALE POPULATION
92.70
MALES / 100 FEMALES
107.88
FEMALES / 100 MALES
41.1
MEDIAN AGE
4.1
AVG FAMILY SIZE
2.6
AVG HOUSEHOLD SIZE
$20,862
PER CAPITA INCOME
$53,019
AVG FAMILY INCOME
$32,796
AVG HOUSEHOLD INCOME
18.6%
WAGE / INCOME GAP [ % ]
81.4¢/ $1
WAGE / INCOME GAP [ $ ]
$6,413
FAMILY INCOME DEFICIT
0.47
INEQUALITY / GINI INDEX
2,467
LABOR FORCE [ PEOPLE ]
40.3%
PERCENT IN LABOR FORCE
4.5%
UNEMPLOYMENT RATE
Greene County Area Codes
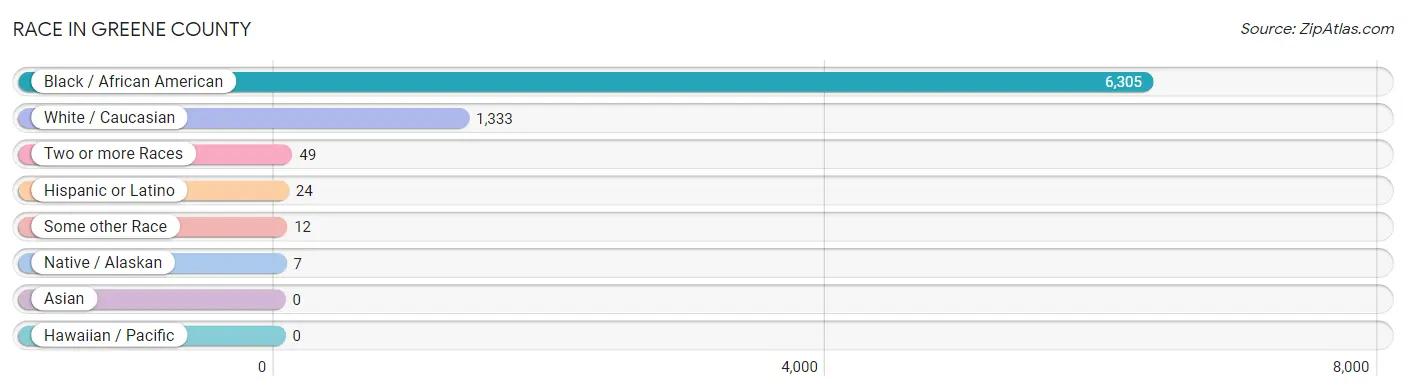
Race in Greene County
The most populous races in Greene County are Black / African American (6,305 | 81.8%), White / Caucasian (1,333 | 17.3%), and Two or more Races (49 | 0.6%).
| Race | # Population | % Population |
| Asian | 0 | 0.0% |
| Black / African American | 6,305 | 81.8% |
| Hawaiian / Pacific | 0 | 0.0% |
| Hispanic or Latino | 24 | 0.3% |
| Native / Alaskan | 7 | 0.1% |
| White / Caucasian | 1,333 | 17.3% |
| Two or more Races | 49 | 0.6% |
| Some other Race | 12 | 0.2% |
| Total | 7,706 | 100.0% |
Ancestry in Greene County
The most populous ancestries reported in Greene County are American (276 | 3.6%), Irish (169 | 2.2%), English (132 | 1.7%), German (125 | 1.6%), and Subsaharan African (83 | 1.1%), together accounting for 10.2% of all Greene County residents.

| Ancestry | # Population | % Population |
| African | 6 | 0.1% |
| American | 276 | 3.6% |
| British | 25 | 0.3% |
| Colombian | 1 | 0.0% |
| Dominican | 5 | 0.1% |
| Dutch | 13 | 0.2% |
| English | 132 | 1.7% |
| French | 18 | 0.2% |
| German | 125 | 1.6% |
| Irish | 169 | 2.2% |
| Italian | 8 | 0.1% |
| Korean | 44 | 0.6% |
| Mexican | 18 | 0.2% |
| Nigerian | 77 | 1.0% |
| Scotch-Irish | 14 | 0.2% |
| Scottish | 34 | 0.4% |
| South American | 1 | 0.0% |
| Subsaharan African | 83 | 1.1% | View All 18 Rows |
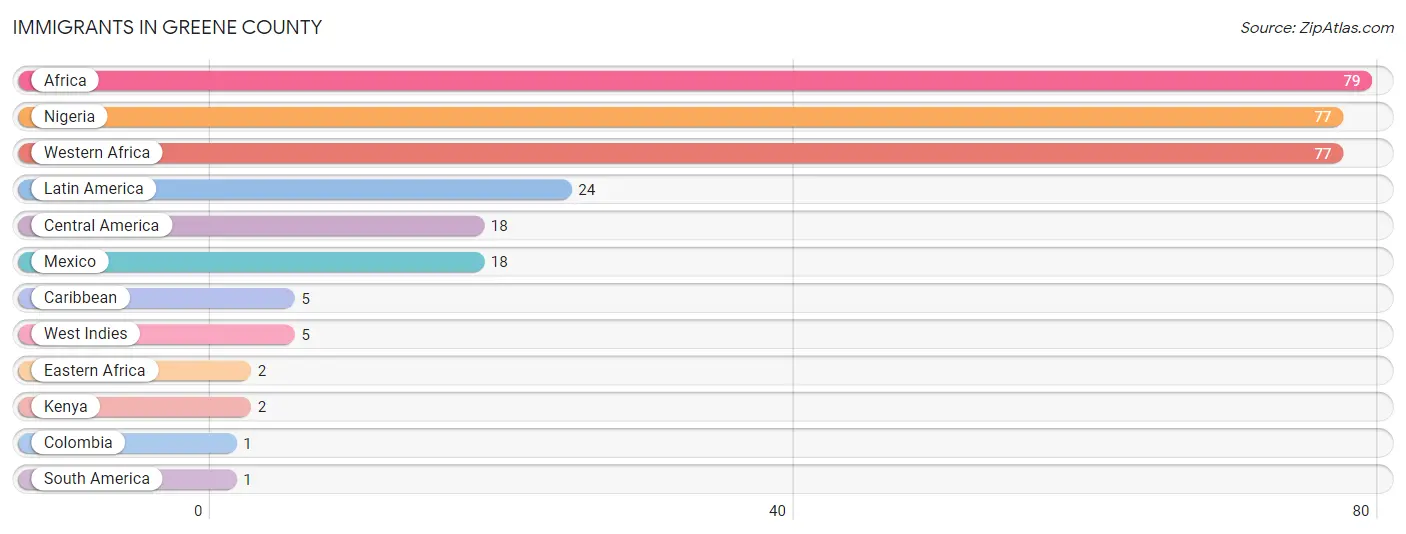
Immigrants in Greene County
The most numerous immigrant groups reported in Greene County came from Africa (79 | 1.0%), Nigeria (77 | 1.0%), Western Africa (77 | 1.0%), Latin America (24 | 0.3%), and Central America (18 | 0.2%), together accounting for 3.6% of all Greene County residents.
| Immigration Origin | # Population | % Population |
| Africa | 79 | 1.0% |
| Caribbean | 5 | 0.1% |
| Central America | 18 | 0.2% |
| Colombia | 1 | 0.0% |
| Eastern Africa | 2 | 0.0% |
| Kenya | 2 | 0.0% |
| Latin America | 24 | 0.3% |
| Mexico | 18 | 0.2% |
| Nigeria | 77 | 1.0% |
| South America | 1 | 0.0% |
| West Indies | 5 | 0.1% |
| Western Africa | 77 | 1.0% | View All 12 Rows |
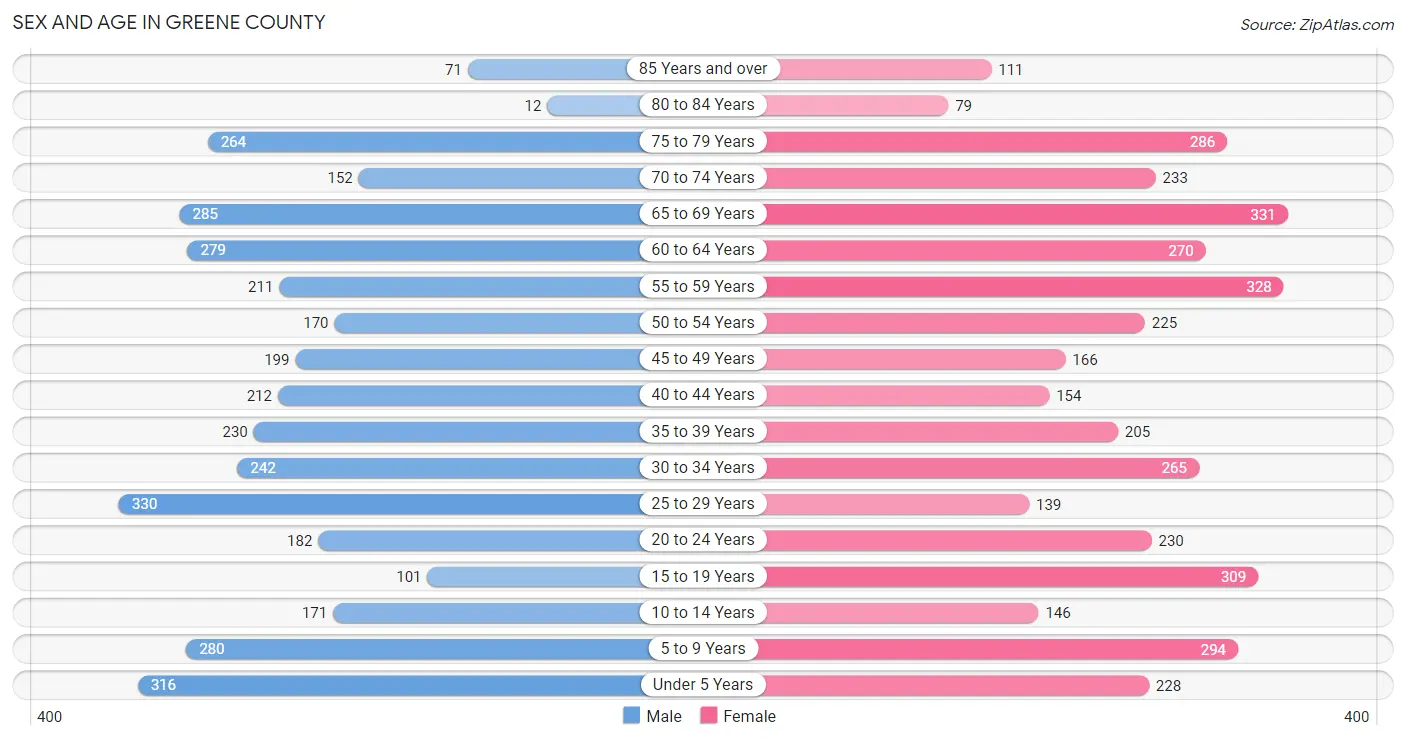
Sex and Age in Greene County
Sex and Age in Greene County
The most populous age groups in Greene County are 25 to 29 Years (330 | 8.9%) for men and 65 to 69 Years (331 | 8.3%) for women.
| Age Bracket | Male | Female |
| Under 5 Years | 316 (8.5%) | 228 (5.7%) |
| 5 to 9 Years | 280 (7.5%) | 294 (7.3%) |
| 10 to 14 Years | 171 (4.6%) | 146 (3.6%) |
| 15 to 19 Years | 101 (2.7%) | 309 (7.7%) |
| 20 to 24 Years | 182 (4.9%) | 230 (5.8%) |
| 25 to 29 Years | 330 (8.9%) | 139 (3.5%) |
| 30 to 34 Years | 242 (6.5%) | 265 (6.6%) |
| 35 to 39 Years | 230 (6.2%) | 205 (5.1%) |
| 40 to 44 Years | 212 (5.7%) | 154 (3.8%) |
| 45 to 49 Years | 199 (5.4%) | 166 (4.2%) |
| 50 to 54 Years | 170 (4.6%) | 225 (5.6%) |
| 55 to 59 Years | 211 (5.7%) | 328 (8.2%) |
| 60 to 64 Years | 279 (7.5%) | 270 (6.8%) |
| 65 to 69 Years | 285 (7.7%) | 331 (8.3%) |
| 70 to 74 Years | 152 (4.1%) | 233 (5.8%) |
| 75 to 79 Years | 264 (7.1%) | 286 (7.1%) |
| 80 to 84 Years | 12 (0.3%) | 79 (2.0%) |
| 85 Years and over | 71 (1.9%) | 111 (2.8%) |
| Total | 3,707 (100.0%) | 3,999 (100.0%) |
Families and Households in Greene County
Median Family Size in Greene County
The median family size in Greene County is 4.09 persons per family, with single male/father families (76 | 5.1%) accounting for the largest median family size of 7.53 persons per family. On the other hand, married-couple families (872 | 58.6%) represent the smallest median family size with 3.06 persons per family.

| Family Type | # Families | Family Size |
| Married-Couple | 872 (58.6%) | 3.06 |
| Single Male/Father | 76 (5.1%) | 7.53 |
| Single Female/Mother | 541 (36.3%) | 5.28 |
| Total Families | 1,489 (100.0%) | 4.09 |
Median Household Size in Greene County
The median household size in Greene County is 2.64 persons per household, with single male/father households (76 | 2.6%) accounting for the largest median household size of 7.84 persons per household. non-family households (1,383 | 48.1%) represent the smallest median household size with 1.04 persons per household.
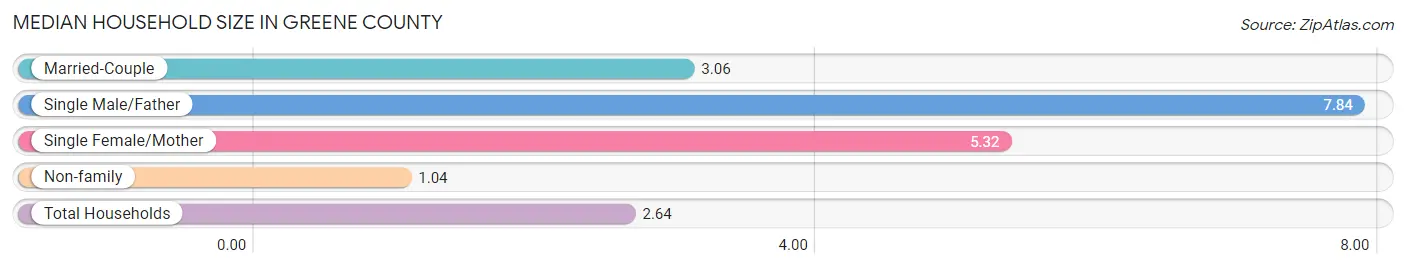
| Household Type | # Households | Household Size |
| Married-Couple | 872 (30.4%) | 3.06 |
| Single Male/Father | 76 (2.6%) | 7.84 |
| Single Female/Mother | 541 (18.8%) | 5.32 |
| Non-family | 1,383 (48.1%) | 1.04 |
| Total Households | 2,872 (100.0%) | 2.64 |
Household Size by Marriage Status in Greene County
Out of a total of 2,872 households in Greene County, 1,489 (51.8%) are family households, while 1,383 (48.1%) are nonfamily households. The most numerous type of family households are 2-person households, comprising 797, and the most common type of nonfamily households are 1-person households, comprising 1,373.
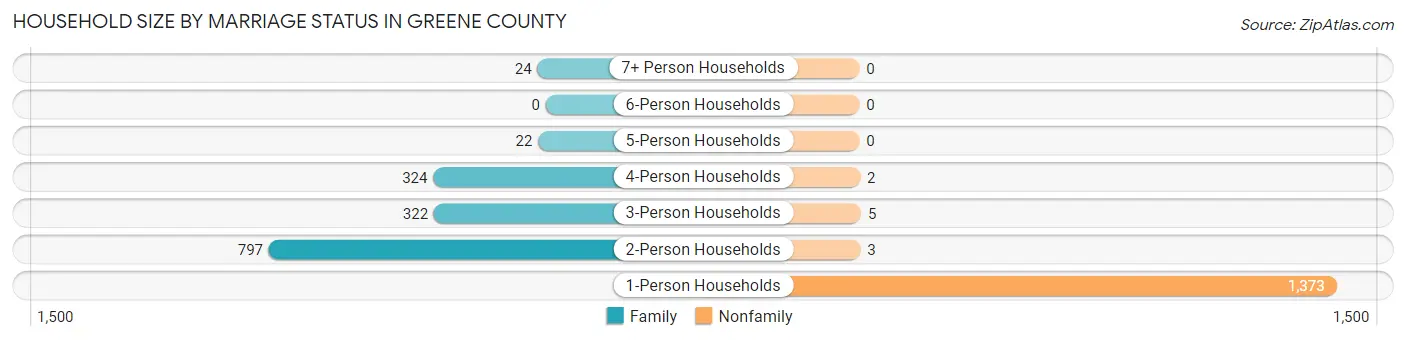
| Household Size | Family Households | Nonfamily Households |
| 1-Person Households | - | 1,373 (47.8%) |
| 2-Person Households | 797 (27.8%) | 3 (0.1%) |
| 3-Person Households | 322 (11.2%) | 5 (0.2%) |
| 4-Person Households | 324 (11.3%) | 2 (0.1%) |
| 5-Person Households | 22 (0.8%) | 0 (0.0%) |
| 6-Person Households | 0 (0.0%) | 0 (0.0%) |
| 7+ Person Households | 24 (0.8%) | 0 (0.0%) |
| Total | 1,489 (51.8%) | 1,383 (48.1%) |
Female Fertility in Greene County
Fertility by Age in Greene County
Average fertility rate in Greene County is 18.0 births per 1,000 women. Women in the age bracket of 20 to 34 years have the highest fertility rate with 46.0 births per 1,000 women. Women in the age bracket of 20 to 34 years acount for 100.0% of all women with births.

| Age Bracket | Women with Births | Births / 1,000 Women |
| 15 to 19 years | 0 (0.0%) | 0.0 |
| 20 to 34 years | 29 (100.0%) | 46.0 |
| 35 to 50 years | 0 (0.0%) | 0.0 |
| Total | 29 (100.0%) | 18.0 |
Fertility by Age by Marriage Status in Greene County
72.4% of women with births (29) in Greene County are married. The highest percentage of unmarried women with births falls into 20 to 34 years age bracket with 27.6% of them unmarried at the time of birth, while the lowest percentage of unmarried women with births belong to 20 to 34 years age bracket with 27.6% of them unmarried.
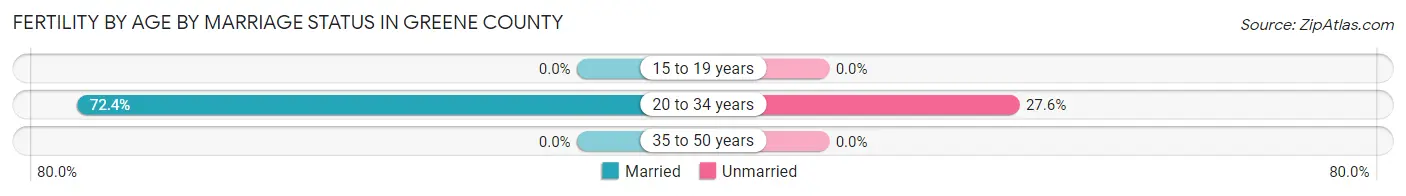
| Age Bracket | Married | Unmarried |
| 15 to 19 years | 0 (0.0%) | 0 (0.0%) |
| 20 to 34 years | 21 (72.4%) | 8 (27.6%) |
| 35 to 50 years | 0 (0.0%) | 0 (0.0%) |
| Total | 21 (72.4%) | 8 (27.6%) |
Fertility by Education in Greene County

| Educational Attainment | Women with Births | Births / 1,000 Women |
| Less than High School | 0 (0.0%) | 0.0 |
| High School Diploma | 8 (27.6%) | 20.0 |
| College or Associate's Degree | 0 (0.0%) | 0.0 |
| Bachelor's Degree | 0 (0.0%) | 0.0 |
| Graduate Degree | 21 (72.4%) | 488.0 |
| Total | 29 (100.0%) | 18.0 |
Fertility by Education by Marriage Status in Greene County
27.6% of women with births in Greene County are unmarried. Women with the educational attainment of graduate degree are most likely to be married with 100.0% of them married at childbirth, while women with the educational attainment of high school diploma are least likely to be married with 100.0% of them unmarried at childbirth.
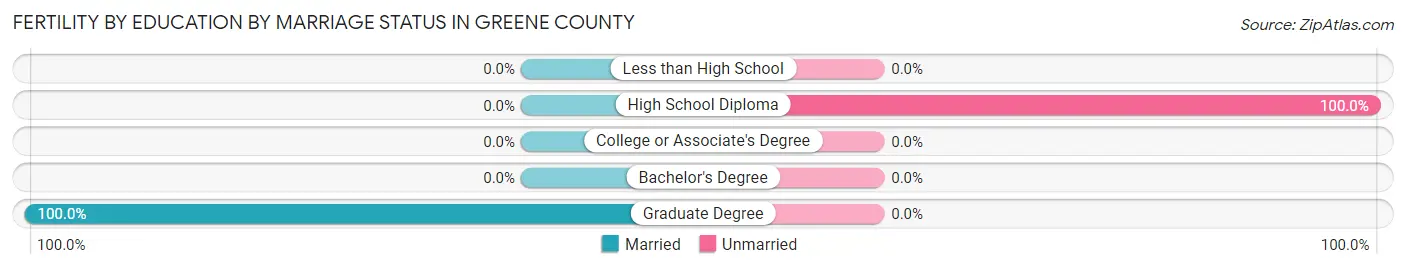
| Educational Attainment | Married | Unmarried |
| Less than High School | 0 (0.0%) | 0 (0.0%) |
| High School Diploma | 0 (0.0%) | 8 (100.0%) |
| College or Associate's Degree | 0 (0.0%) | 0 (0.0%) |
| Bachelor's Degree | 0 (0.0%) | 0 (0.0%) |
| Graduate Degree | 21 (100.0%) | 0 (0.0%) |
| Total | 21 (72.4%) | 8 (27.6%) |
Income in Greene County
Income Overview in Greene County
Per Capita Income in Greene County is $20,862, while median incomes of families and households are $53,019 and $32,796 respectively.
| Characteristic | Number | Measure |
| Per Capita Income | 7,706 | $20,862 |
| Median Family Income | 1,489 | $53,019 |
| Mean Family Income | 1,489 | $65,788 |
| Median Household Income | 2,872 | $32,796 |
| Mean Household Income | 2,872 | $48,095 |
| Income Deficit | 1,489 | $6,413 |
| Wage / Income Gap (%) | 7,706 | 18.55% |
| Wage / Income Gap ($) | 7,706 | 81.45¢ per $1 |
| Gini / Inequality Index | 7,706 | 0.47 |
Earnings by Sex in Greene County
Average Earnings in Greene County are $29,792, $32,183 for men and $26,213 for women, a difference of 18.5%.

| Sex | Number | Average Earnings |
| Male | 1,473 (58.5%) | $32,183 |
| Female | 1,044 (41.5%) | $26,213 |
| Total | 2,517 (100.0%) | $29,792 |
Earnings by Sex by Income Bracket in Greene County
The most common earnings brackets in Greene County are $30,000 to $34,999 for men (265 | 18.0%) and $25,000 to $29,999 for women (187 | 17.9%).
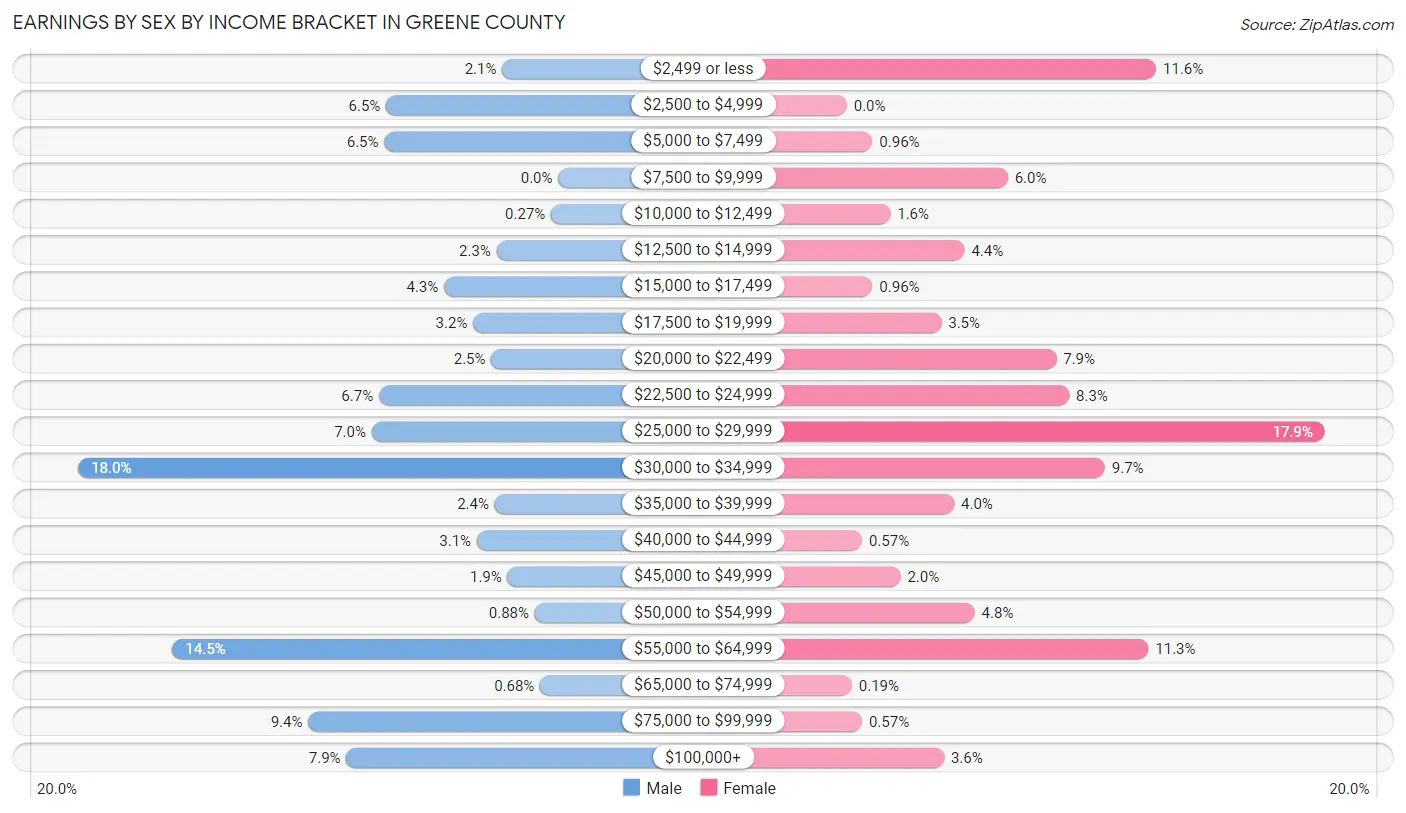
| Income | Male | Female |
| $2,499 or less | 31 (2.1%) | 121 (11.6%) |
| $2,500 to $4,999 | 95 (6.5%) | 0 (0.0%) |
| $5,000 to $7,499 | 96 (6.5%) | 10 (1.0%) |
| $7,500 to $9,999 | 0 (0.0%) | 63 (6.0%) |
| $10,000 to $12,499 | 4 (0.3%) | 17 (1.6%) |
| $12,500 to $14,999 | 34 (2.3%) | 46 (4.4%) |
| $15,000 to $17,499 | 63 (4.3%) | 10 (1.0%) |
| $17,500 to $19,999 | 47 (3.2%) | 37 (3.5%) |
| $20,000 to $22,499 | 37 (2.5%) | 82 (7.9%) |
| $22,500 to $24,999 | 99 (6.7%) | 87 (8.3%) |
| $25,000 to $29,999 | 103 (7.0%) | 187 (17.9%) |
| $30,000 to $34,999 | 265 (18.0%) | 101 (9.7%) |
| $35,000 to $39,999 | 35 (2.4%) | 42 (4.0%) |
| $40,000 to $44,999 | 45 (3.0%) | 6 (0.6%) |
| $45,000 to $49,999 | 28 (1.9%) | 21 (2.0%) |
| $50,000 to $54,999 | 13 (0.9%) | 50 (4.8%) |
| $55,000 to $64,999 | 213 (14.5%) | 118 (11.3%) |
| $65,000 to $74,999 | 10 (0.7%) | 2 (0.2%) |
| $75,000 to $99,999 | 138 (9.4%) | 6 (0.6%) |
| $100,000+ | 117 (7.9%) | 38 (3.6%) |
| Total | 1,473 (100.0%) | 1,044 (100.0%) |
Earnings by Sex by Educational Attainment in Greene County
Average earnings in Greene County are $33,718 for men and $26,399 for women, a difference of 21.7%. Men with an educational attainment of graduate degree enjoy the highest average annual earnings of $83,524, while those with high school diploma education earn the least with $21,622. Women with an educational attainment of graduate degree earn the most with the average annual earnings of $39,167, while those with bachelor's degree education have the smallest earnings of $2,499.

| Educational Attainment | Male Income | Female Income |
| Less than High School | $40,313 | $9,495 |
| High School Diploma | $21,622 | $26,845 |
| College or Associate's Degree | $41,731 | $25,882 |
| Bachelor's Degree | $59,583 | $2,499 |
| Graduate Degree | $83,524 | $39,167 |
| Total | $33,718 | $26,399 |
Family Income in Greene County
Family Income Brackets in Greene County
According to the Greene County family income data, there are 305 families falling into the $50,000 to $74,999 income range, which is the most common income bracket and makes up 20.5% of all families. Conversely, the less than $10,000 income bracket is the least frequent group with only 21 families (1.4%) belonging to this category.
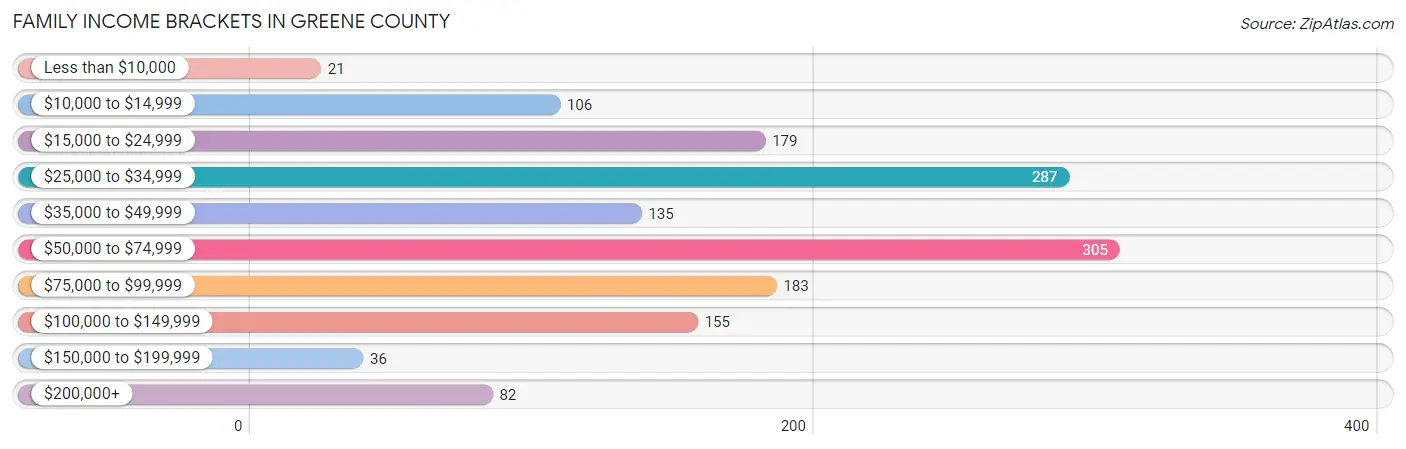
| Income Bracket | # Families | % Families |
| Less than $10,000 | 21 | 1.4% |
| $10,000 to $14,999 | 106 | 7.1% |
| $15,000 to $24,999 | 179 | 12.0% |
| $25,000 to $34,999 | 287 | 19.3% |
| $35,000 to $49,999 | 135 | 9.1% |
| $50,000 to $74,999 | 305 | 20.5% |
| $75,000 to $99,999 | 183 | 12.3% |
| $100,000 to $149,999 | 155 | 10.4% |
| $150,000 to $199,999 | 36 | 2.4% |
| $200,000+ | 82 | 5.5% |
Family Income by Famaliy Size in Greene County
2-person families (807 | 54.2%) account for the highest median family income in Greene County with $57,401 per family, while 2-person families (807 | 54.2%) have the highest median income of $28,700 per family member.
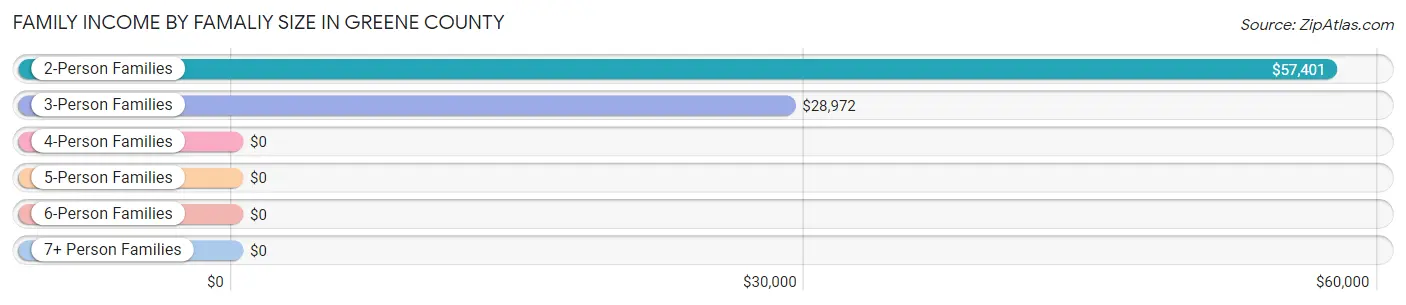
| Income Bracket | # Families | Median Income |
| 2-Person Families | 807 (54.2%) | $57,401 |
| 3-Person Families | 319 (21.4%) | $28,972 |
| 4-Person Families | 327 (22.0%) | $0 |
| 5-Person Families | 12 (0.8%) | $0 |
| 6-Person Families | 0 (0.0%) | $0 |
| 7+ Person Families | 24 (1.6%) | $0 |
| Total | 1,489 (100.0%) | $53,019 |
Family Income by Number of Earners in Greene County

| Number of Earners | # Families | Median Income |
| No Earners | 548 (36.8%) | $29,444 |
| 1 Earner | 489 (32.8%) | $38,750 |
| 2 Earners | 420 (28.2%) | $93,993 |
| 3+ Earners | 32 (2.1%) | $0 |
| Total | 1,489 (100.0%) | $53,019 |
Household Income in Greene County
Household Income Brackets in Greene County
With 623 households falling in the category, the $25,000 to $34,999 income range is the most frequent in Greene County, accounting for 21.7% of all households. In contrast, only 37 households (1.3%) fall into the $150,000 to $199,999 income bracket, making it the least populous group.

| Income Bracket | # Households | % Households |
| Less than $10,000 | 181 | 6.3% |
| $10,000 to $14,999 | 480 | 16.7% |
| $15,000 to $24,999 | 376 | 13.1% |
| $25,000 to $34,999 | 623 | 21.7% |
| $35,000 to $49,999 | 210 | 7.3% |
| $50,000 to $74,999 | 439 | 15.3% |
| $75,000 to $99,999 | 290 | 10.1% |
| $100,000 to $149,999 | 155 | 5.4% |
| $150,000 to $199,999 | 37 | 1.3% |
| $200,000+ | 83 | 2.9% |
Household Income by Householder Age in Greene County
The median household income in Greene County is $32,796, with the highest median household income of $33,270 found in the 65+ years age bracket for the primary householder. A total of 1,251 households (43.6%) fall into this category. Meanwhile, the 15 to 24 years age bracket for the primary householder has the lowest median household income of $0, with 4 households (0.1%) in this group.
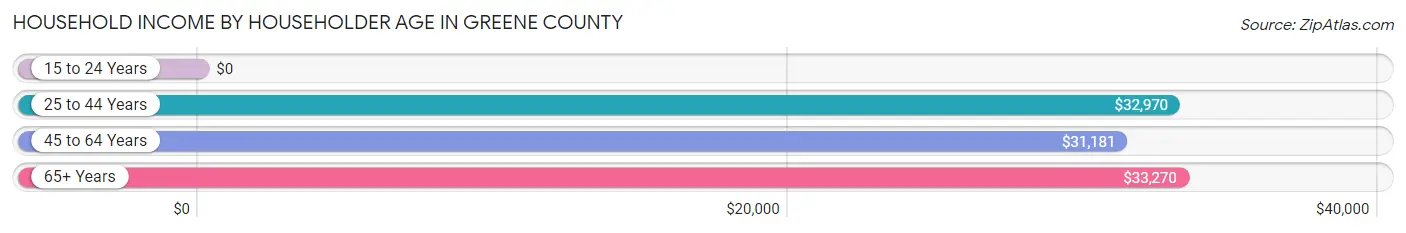
| Income Bracket | # Households | Median Income |
| 15 to 24 Years | 4 (0.1%) | $0 |
| 25 to 44 Years | 545 (19.0%) | $32,970 |
| 45 to 64 Years | 1,072 (37.3%) | $31,181 |
| 65+ Years | 1,251 (43.6%) | $33,270 |
| Total | 2,872 (100.0%) | $32,796 |
Poverty in Greene County
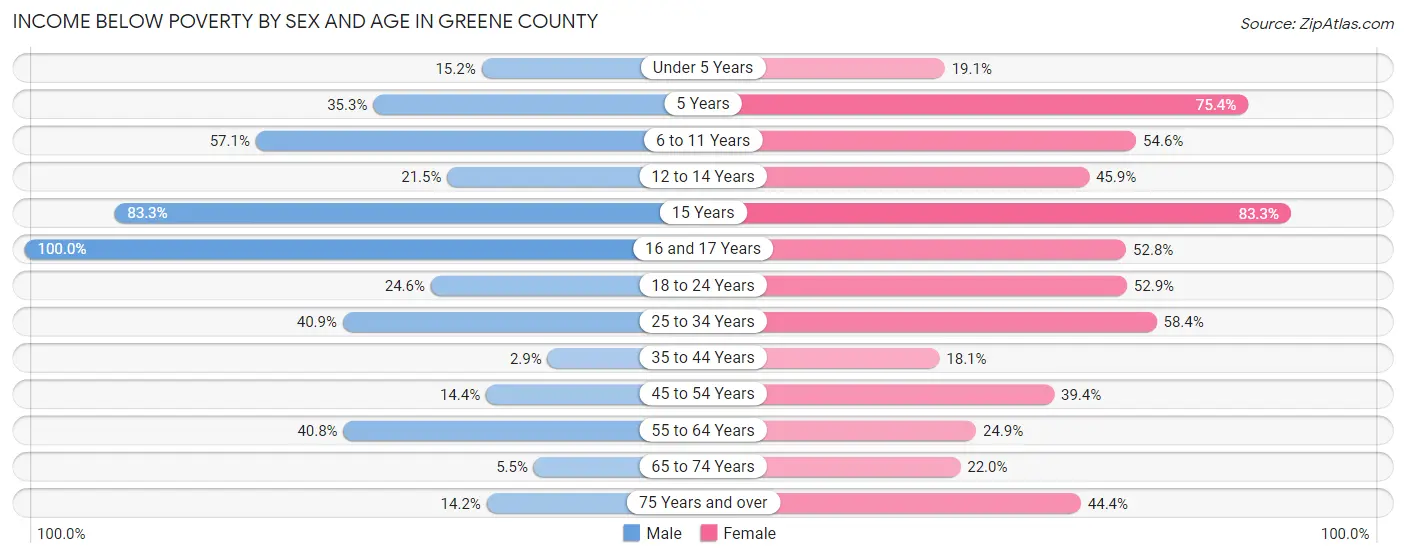
Income Below Poverty by Sex and Age in Greene County
With 26.4% poverty level for males and 39.0% for females among the residents of Greene County, 16 and 17 year old males and 15 year old females are the most vulnerable to poverty, with 75 males (100.0%) and 120 females (83.3%) in their respective age groups living below the poverty level.
| Age Bracket | Male | Female |
| Under 5 Years | 48 (15.2%) | 43 (19.1%) |
| 5 Years | 12 (35.3%) | 46 (75.4%) |
| 6 to 11 Years | 201 (57.1%) | 153 (54.6%) |
| 12 to 14 Years | 14 (21.5%) | 39 (45.9%) |
| 15 Years | 5 (83.3%) | 120 (83.3%) |
| 16 and 17 Years | 75 (100.0%) | 19 (52.8%) |
| 18 to 24 Years | 47 (24.6%) | 190 (52.9%) |
| 25 to 34 Years | 230 (40.9%) | 236 (58.4%) |
| 35 to 44 Years | 13 (2.9%) | 65 (18.1%) |
| 45 to 54 Years | 53 (14.4%) | 154 (39.4%) |
| 55 to 64 Years | 200 (40.8%) | 149 (24.9%) |
| 65 to 74 Years | 24 (5.5%) | 119 (22.0%) |
| 75 Years and over | 48 (14.2%) | 201 (44.4%) |
| Total | 970 (26.4%) | 1,534 (39.0%) |
Income Above Poverty by Sex and Age in Greene County
According to the poverty statistics in Greene County, males aged 35 to 44 years and females aged 35 to 44 years are the age groups that are most secure financially, with 97.1% of males and 81.9% of females in these age groups living above the poverty line.

| Age Bracket | Male | Female |
| Under 5 Years | 268 (84.8%) | 182 (80.9%) |
| 5 Years | 22 (64.7%) | 15 (24.6%) |
| 6 to 11 Years | 151 (42.9%) | 127 (45.4%) |
| 12 to 14 Years | 51 (78.5%) | 46 (54.1%) |
| 15 Years | 1 (16.7%) | 24 (16.7%) |
| 16 and 17 Years | 0 (0.0%) | 17 (47.2%) |
| 18 to 24 Years | 144 (75.4%) | 169 (47.1%) |
| 25 to 34 Years | 332 (59.1%) | 168 (41.6%) |
| 35 to 44 Years | 429 (97.1%) | 294 (81.9%) |
| 45 to 54 Years | 316 (85.6%) | 237 (60.6%) |
| 55 to 64 Years | 290 (59.2%) | 449 (75.1%) |
| 65 to 74 Years | 413 (94.5%) | 422 (78.0%) |
| 75 Years and over | 289 (85.8%) | 252 (55.6%) |
| Total | 2,706 (73.6%) | 2,402 (61.0%) |
Income Below Poverty Among Married-Couple Families in Greene County
The poverty statistics for married-couple families in Greene County show that 15.5% or 135 of the total 872 families live below the poverty line. Families with no children have the highest poverty rate of 16.4%, comprising of 109 families. On the other hand, families with 1 or 2 children have the lowest poverty rate of 12.6%, which includes 26 families.

| Children | Above Poverty | Below Poverty |
| No Children | 557 (83.6%) | 109 (16.4%) |
| 1 or 2 Children | 180 (87.4%) | 26 (12.6%) |
| 3 or 4 Children | 0 (0.0%) | 0 (0.0%) |
| 5 or more Children | 0 (0.0%) | 0 (0.0%) |
| Total | 737 (84.5%) | 135 (15.5%) |
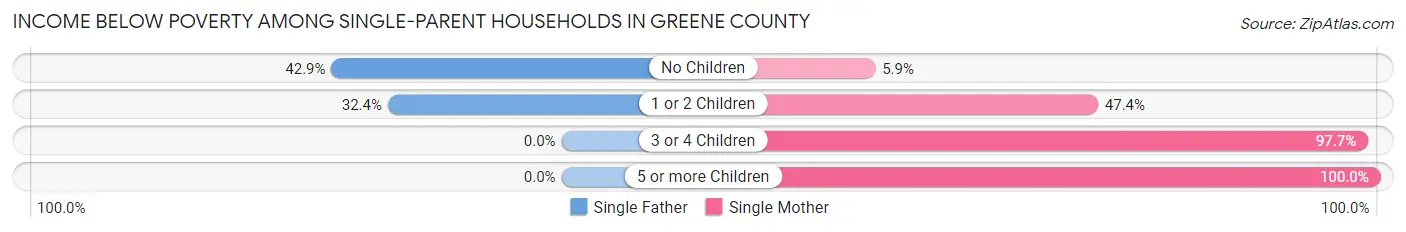
Income Below Poverty Among Single-Parent Households in Greene County
According to the poverty data in Greene County, 38.2% or 29 single-father households and 43.2% or 234 single-mother households are living below the poverty line. Among single-father households, those with no children have the highest poverty rate, with 18 households (42.9%) experiencing poverty. Likewise, among single-mother households, those with 5 or more children have the highest poverty rate, with 24 households (100.0%) falling below the poverty line.
| Children | Single Father | Single Mother |
| No Children | 18 (42.9%) | 11 (5.9%) |
| 1 or 2 Children | 11 (32.4%) | 116 (47.3%) |
| 3 or 4 Children | 0 (0.0%) | 83 (97.7%) |
| 5 or more Children | 0 (0.0%) | 24 (100.0%) |
| Total | 29 (38.2%) | 234 (43.2%) |
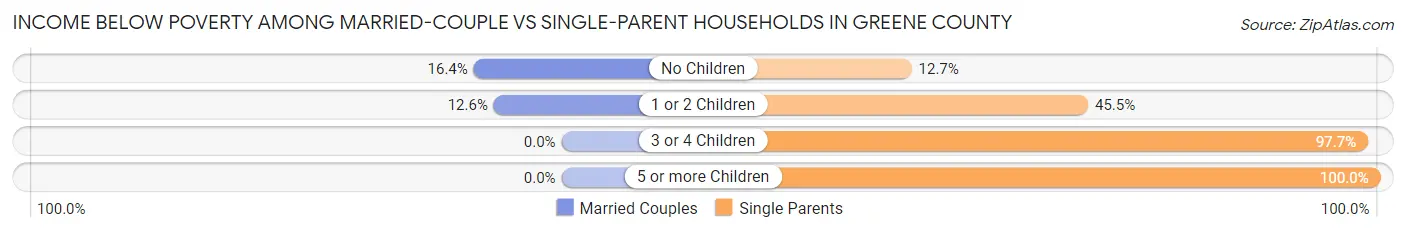
Income Below Poverty Among Married-Couple vs Single-Parent Households in Greene County
The poverty data for Greene County shows that 135 of the married-couple family households (15.5%) and 263 of the single-parent households (42.6%) are living below the poverty level. Within the married-couple family households, those with no children have the highest poverty rate, with 109 households (16.4%) falling below the poverty line. Among the single-parent households, those with 5 or more children have the highest poverty rate, with 24 household (100.0%) living below poverty.
| Children | Married-Couple Families | Single-Parent Households |
| No Children | 109 (16.4%) | 29 (12.7%) |
| 1 or 2 Children | 26 (12.6%) | 127 (45.5%) |
| 3 or 4 Children | 0 (0.0%) | 83 (97.7%) |
| 5 or more Children | 0 (0.0%) | 24 (100.0%) |
| Total | 135 (15.5%) | 263 (42.6%) |
Employment Characteristics in Greene County
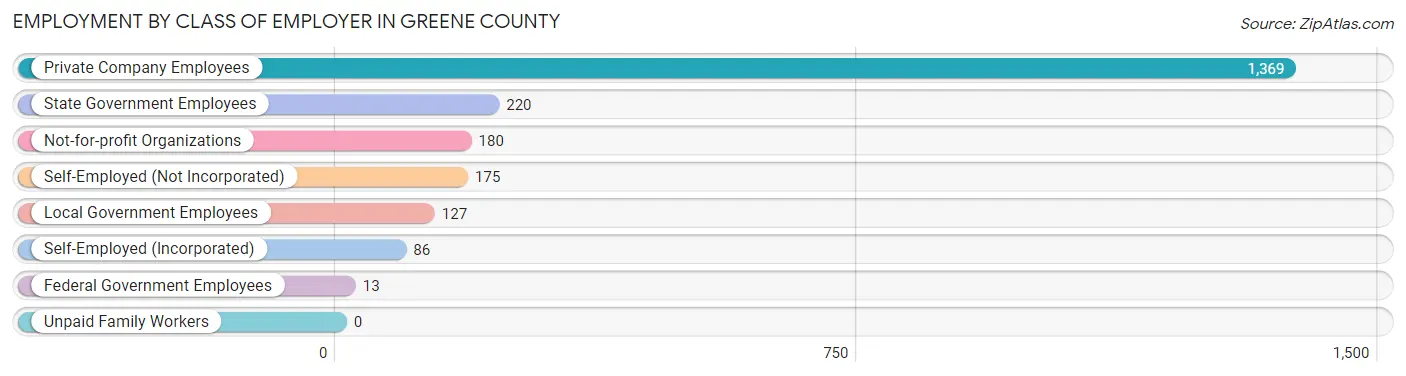
Employment by Class of Employer in Greene County
Among the 2,170 employed individuals in Greene County, private company employees (1,369 | 63.1%), state government employees (220 | 10.1%), and not-for-profit organizations (180 | 8.3%) make up the most common classes of employment.
| Employer Class | # Employees | % Employees |
| Private Company Employees | 1,369 | 63.1% |
| Self-Employed (Incorporated) | 86 | 4.0% |
| Self-Employed (Not Incorporated) | 175 | 8.1% |
| Not-for-profit Organizations | 180 | 8.3% |
| Local Government Employees | 127 | 5.9% |
| State Government Employees | 220 | 10.1% |
| Federal Government Employees | 13 | 0.6% |
| Unpaid Family Workers | 0 | 0.0% |
| Total | 2,170 | 100.0% |
Employment Status by Age in Greene County
According to the labor force statistics for Greene County, out of the total population over 16 years of age (6,121), 40.3% or 2,467 individuals are in the labor force, with 4.5% or 111 of them unemployed. The age group with the highest labor force participation rate is 30 to 34 years, with 79.3% or 402 individuals in the labor force. Within the labor force, the 16 to 19 years age range has the highest percentage of unemployed individuals, with 62.5% or 15 of them being unemployed.
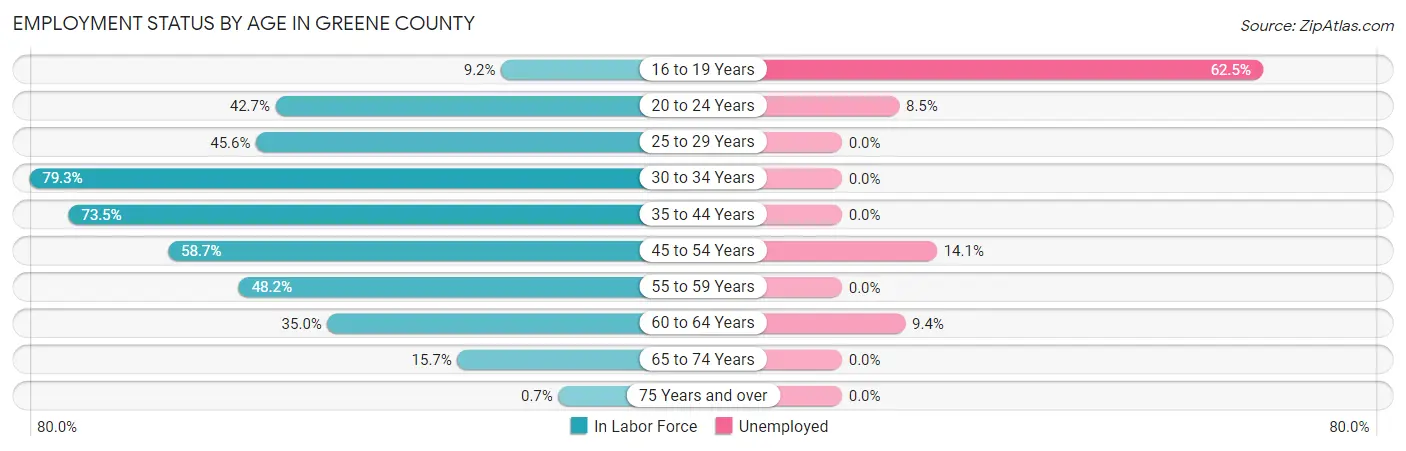
| Age Bracket | In Labor Force | Unemployed |
| 16 to 19 Years | 24 (9.2%) | 15 (62.5%) |
| 20 to 24 Years | 176 (42.7%) | 15 (8.5%) |
| 25 to 29 Years | 214 (45.6%) | 0 (0.0%) |
| 30 to 34 Years | 402 (79.3%) | 0 (0.0%) |
| 35 to 44 Years | 589 (73.5%) | 0 (0.0%) |
| 45 to 54 Years | 446 (58.7%) | 63 (14.1%) |
| 55 to 59 Years | 260 (48.2%) | 0 (0.0%) |
| 60 to 64 Years | 192 (35.0%) | 18 (9.4%) |
| 65 to 74 Years | 157 (15.7%) | 0 (0.0%) |
| 75 Years and over | 6 (0.7%) | 0 (0.0%) |
| Total | 2,467 (40.3%) | 111 (4.5%) |
Employment Status by Educational Attainment in Greene County
According to labor force statistics for Greene County, 58.0% of individuals (2,102) out of the total population between 25 and 64 years of age (3,625) are in the labor force, with 3.9% or 82 of them being unemployed. The group with the highest labor force participation rate are those with the educational attainment of bachelor's degree or higher, with 72.1% or 437 individuals in the labor force. Within the labor force, individuals with high school diploma education have the highest percentage of unemployment, with 8.1% or 63 of them being unemployed.
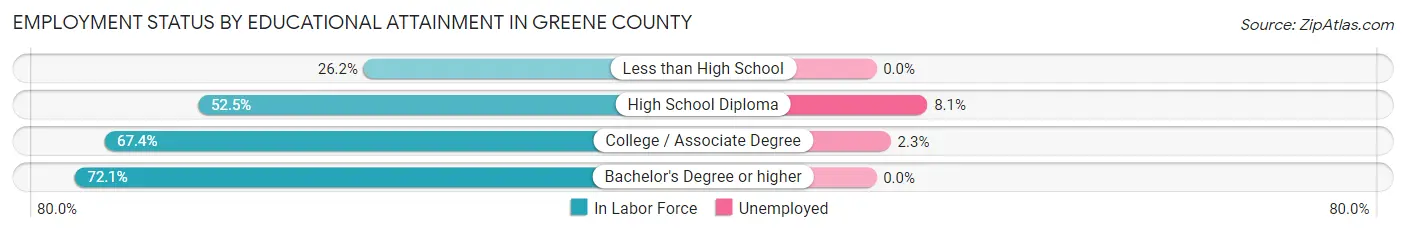
| Educational Attainment | In Labor Force | Unemployed |
| Less than High School | 94 (26.2%) | 0 (0.0%) |
| High School Diploma | 781 (52.5%) | 120 (8.1%) |
| College / Associate Degree | 791 (67.4%) | 27 (2.3%) |
| Bachelor's Degree or higher | 437 (72.1%) | 0 (0.0%) |
| Total | 2,102 (58.0%) | 141 (3.9%) |
Employment Occupations by Sex in Greene County
Management, Business, Science and Arts Occupations
The most common Management, Business, Science and Arts occupations in Greene County are Computers, Engineering & Science (244 | 10.4%), Community & Social Service (236 | 10.0%), Architecture & Engineering (166 | 7.0%), Education Instruction & Library (147 | 6.2%), and Management (73 | 3.1%).

Management, Business, Science and Arts Occupations by Sex
Within the Management, Business, Science and Arts occupations in Greene County, the most male-oriented occupations are Computers & Mathematics (100.0%), Legal Services & Support (100.0%), and Architecture & Engineering (97.6%), while the most female-oriented occupations are Education, Arts & Media (100.0%), Health Technologists (100.0%), and Health Diagnosing & Treating (87.7%).
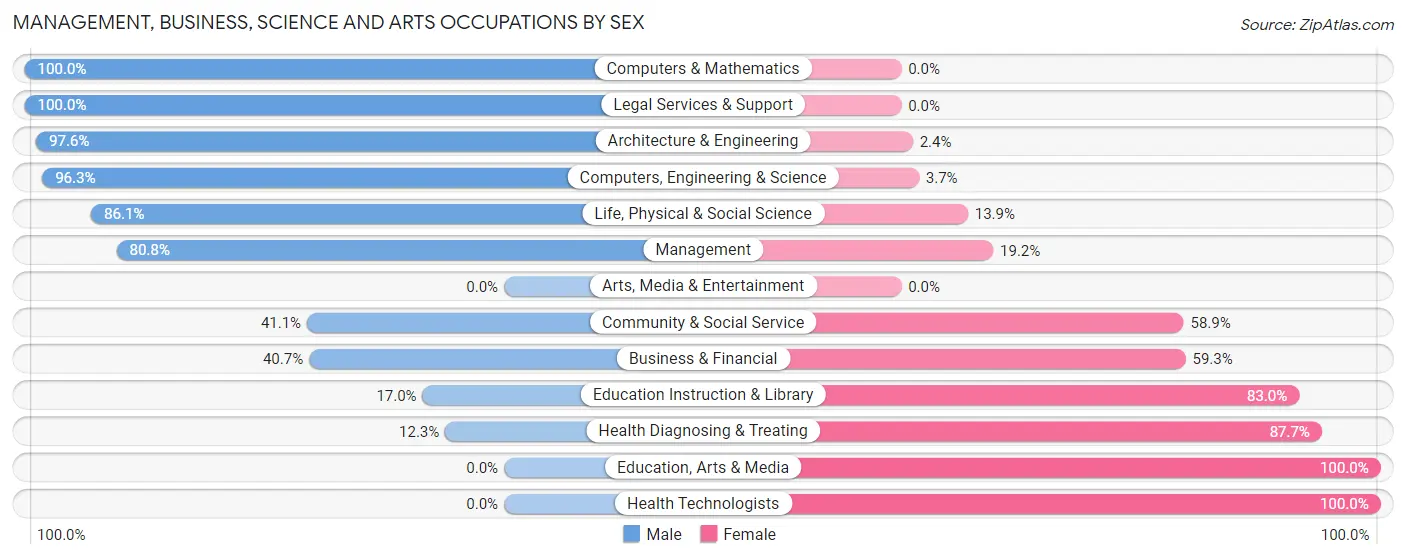
| Occupation | Male | Female |
| Management | 59 (80.8%) | 14 (19.2%) |
| Business & Financial | 24 (40.7%) | 35 (59.3%) |
| Computers, Engineering & Science | 235 (96.3%) | 9 (3.7%) |
| Computers & Mathematics | 42 (100.0%) | 0 (0.0%) |
| Architecture & Engineering | 162 (97.6%) | 4 (2.4%) |
| Life, Physical & Social Science | 31 (86.1%) | 5 (13.9%) |
| Community & Social Service | 97 (41.1%) | 139 (58.9%) |
| Education, Arts & Media | 0 (0.0%) | 17 (100.0%) |
| Legal Services & Support | 72 (100.0%) | 0 (0.0%) |
| Education Instruction & Library | 25 (17.0%) | 122 (83.0%) |
| Arts, Media & Entertainment | 0 (0.0%) | 0 (0.0%) |
| Health Diagnosing & Treating | 7 (12.3%) | 50 (87.7%) |
| Health Technologists | 0 (0.0%) | 50 (100.0%) |
| Total (Category) | 422 (63.1%) | 247 (36.9%) |
| Total (Overall) | 1,375 (58.4%) | 980 (41.6%) |
Services Occupations
The most common Services occupations in Greene County are Cleaning & Maintenance (204 | 8.7%), Food Preparation & Serving (59 | 2.5%), Security & Protection (46 | 1.9%), Law Enforcement (36 | 1.5%), and Healthcare Support (30 | 1.3%).
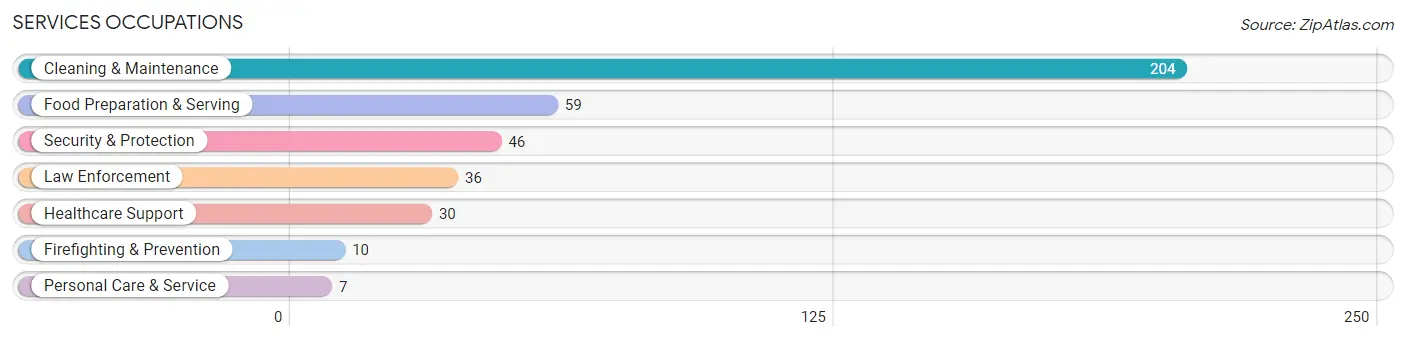
Services Occupations by Sex
Within the Services occupations in Greene County, the most male-oriented occupations are Firefighting & Prevention (100.0%), Personal Care & Service (100.0%), and Security & Protection (43.5%), while the most female-oriented occupations are Healthcare Support (100.0%), Food Preparation & Serving (100.0%), and Law Enforcement (72.2%).
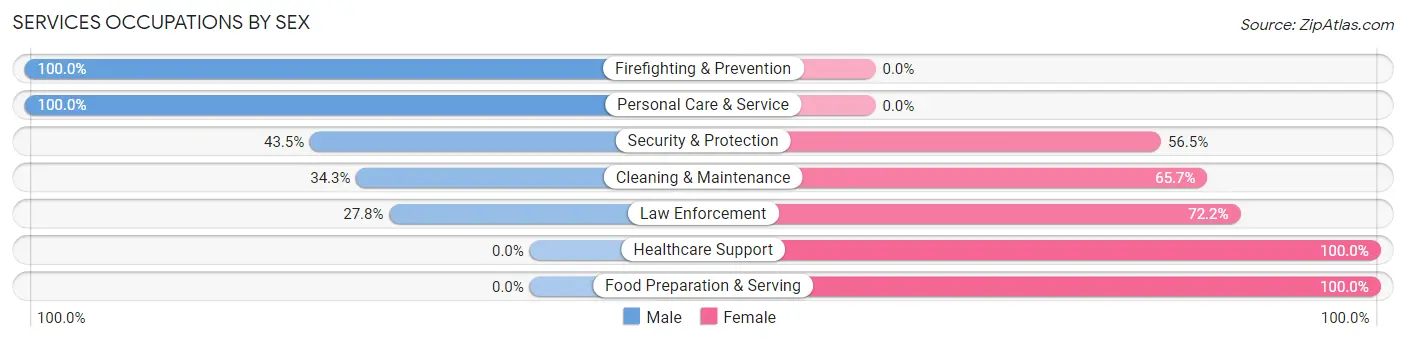
| Occupation | Male | Female |
| Healthcare Support | 0 (0.0%) | 30 (100.0%) |
| Security & Protection | 20 (43.5%) | 26 (56.5%) |
| Firefighting & Prevention | 10 (100.0%) | 0 (0.0%) |
| Law Enforcement | 10 (27.8%) | 26 (72.2%) |
| Food Preparation & Serving | 0 (0.0%) | 59 (100.0%) |
| Cleaning & Maintenance | 70 (34.3%) | 134 (65.7%) |
| Personal Care & Service | 7 (100.0%) | 0 (0.0%) |
| Total (Category) | 97 (28.0%) | 249 (72.0%) |
| Total (Overall) | 1,375 (58.4%) | 980 (41.6%) |
Sales and Office Occupations
The most common Sales and Office occupations in Greene County are Office & Administration (205 | 8.7%), and Sales & Related (119 | 5.1%).

Sales and Office Occupations by Sex
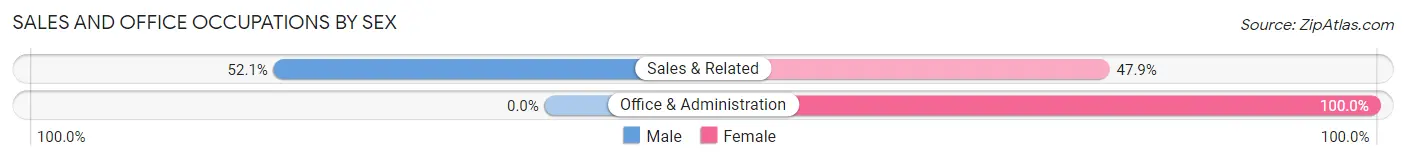
| Occupation | Male | Female |
| Sales & Related | 62 (52.1%) | 57 (47.9%) |
| Office & Administration | 0 (0.0%) | 205 (100.0%) |
| Total (Category) | 62 (19.1%) | 262 (80.9%) |
| Total (Overall) | 1,375 (58.4%) | 980 (41.6%) |
Natural Resources, Construction and Maintenance Occupations
The most common Natural Resources, Construction and Maintenance occupations in Greene County are Installation, Maintenance & Repair (232 | 9.9%), Construction & Extraction (149 | 6.3%), and Farming, Fishing & Forestry (16 | 0.7%).

Natural Resources, Construction and Maintenance Occupations by Sex
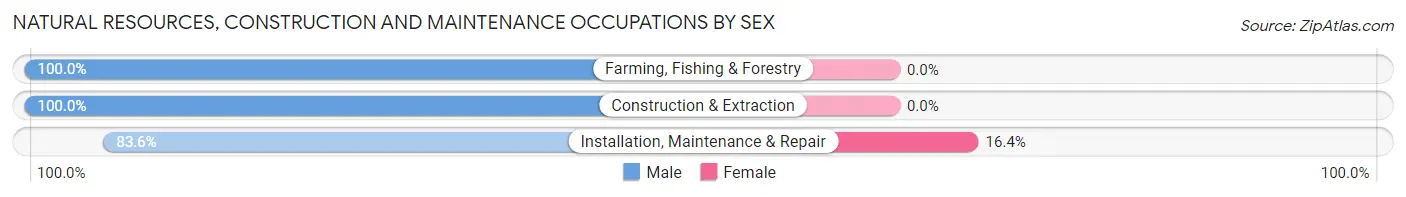
| Occupation | Male | Female |
| Farming, Fishing & Forestry | 16 (100.0%) | 0 (0.0%) |
| Construction & Extraction | 149 (100.0%) | 0 (0.0%) |
| Installation, Maintenance & Repair | 194 (83.6%) | 38 (16.4%) |
| Total (Category) | 359 (90.4%) | 38 (9.6%) |
| Total (Overall) | 1,375 (58.4%) | 980 (41.6%) |
Production, Transportation and Moving Occupations
The most common Production, Transportation and Moving occupations in Greene County are Production (310 | 13.2%), Transportation (204 | 8.7%), and Material Moving (105 | 4.5%).
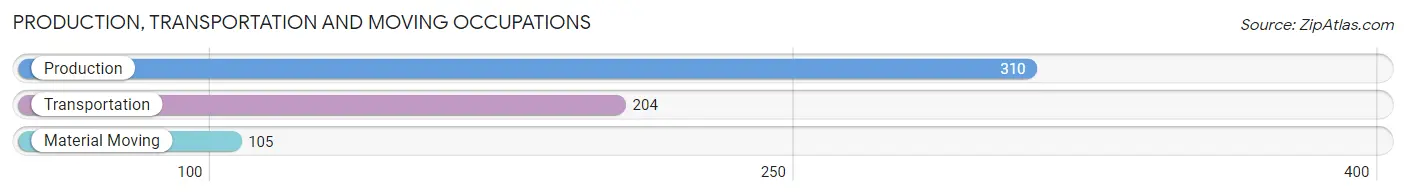
Production, Transportation and Moving Occupations by Sex

| Occupation | Male | Female |
| Production | 231 (74.5%) | 79 (25.5%) |
| Transportation | 99 (48.5%) | 105 (51.5%) |
| Material Moving | 105 (100.0%) | 0 (0.0%) |
| Total (Category) | 435 (70.3%) | 184 (29.7%) |
| Total (Overall) | 1,375 (58.4%) | 980 (41.6%) |
Employment Industries by Sex in Greene County
Employment Industries in Greene County
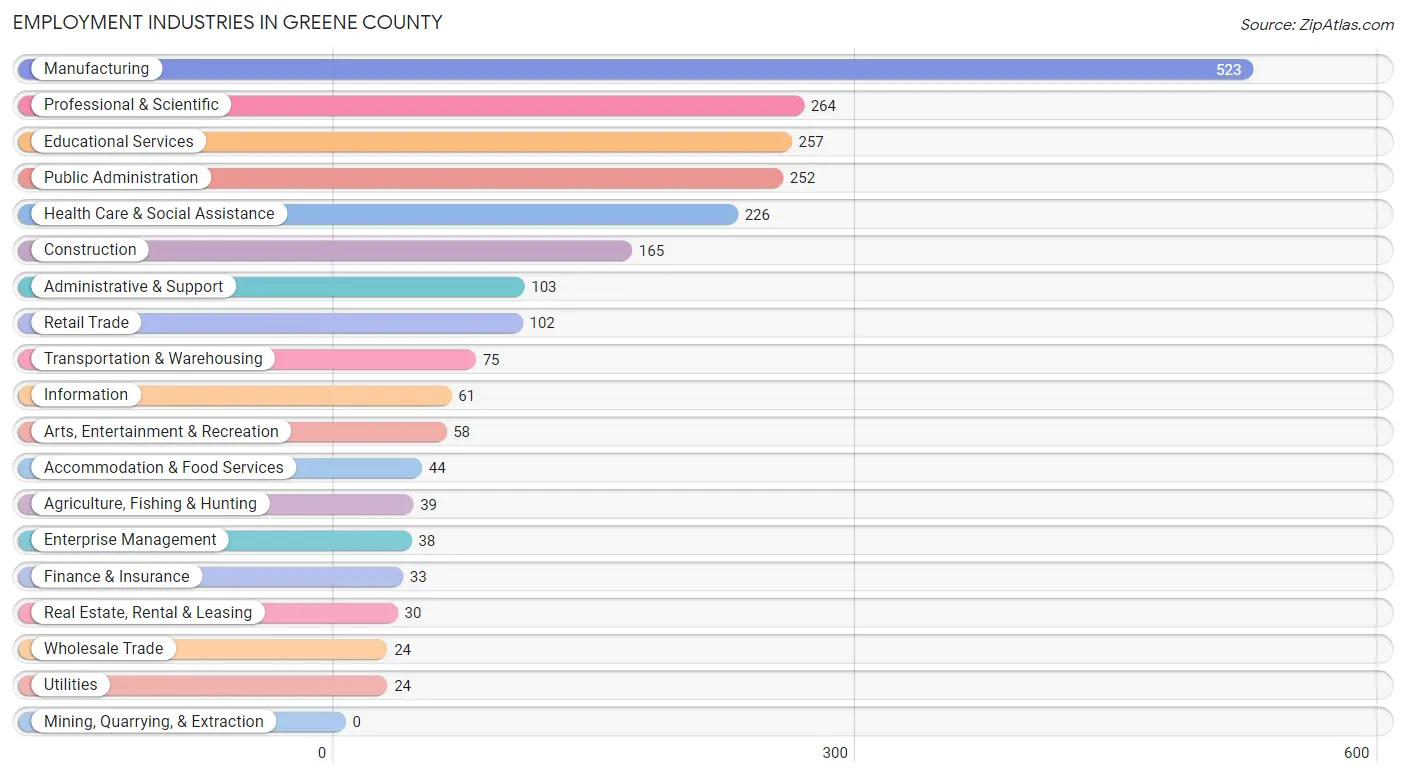
The major employment industries in Greene County include Manufacturing (523 | 22.2%), Professional & Scientific (264 | 11.2%), Educational Services (257 | 10.9%), Public Administration (252 | 10.7%), and Health Care & Social Assistance (226 | 9.6%).
Employment Industries by Sex in Greene County
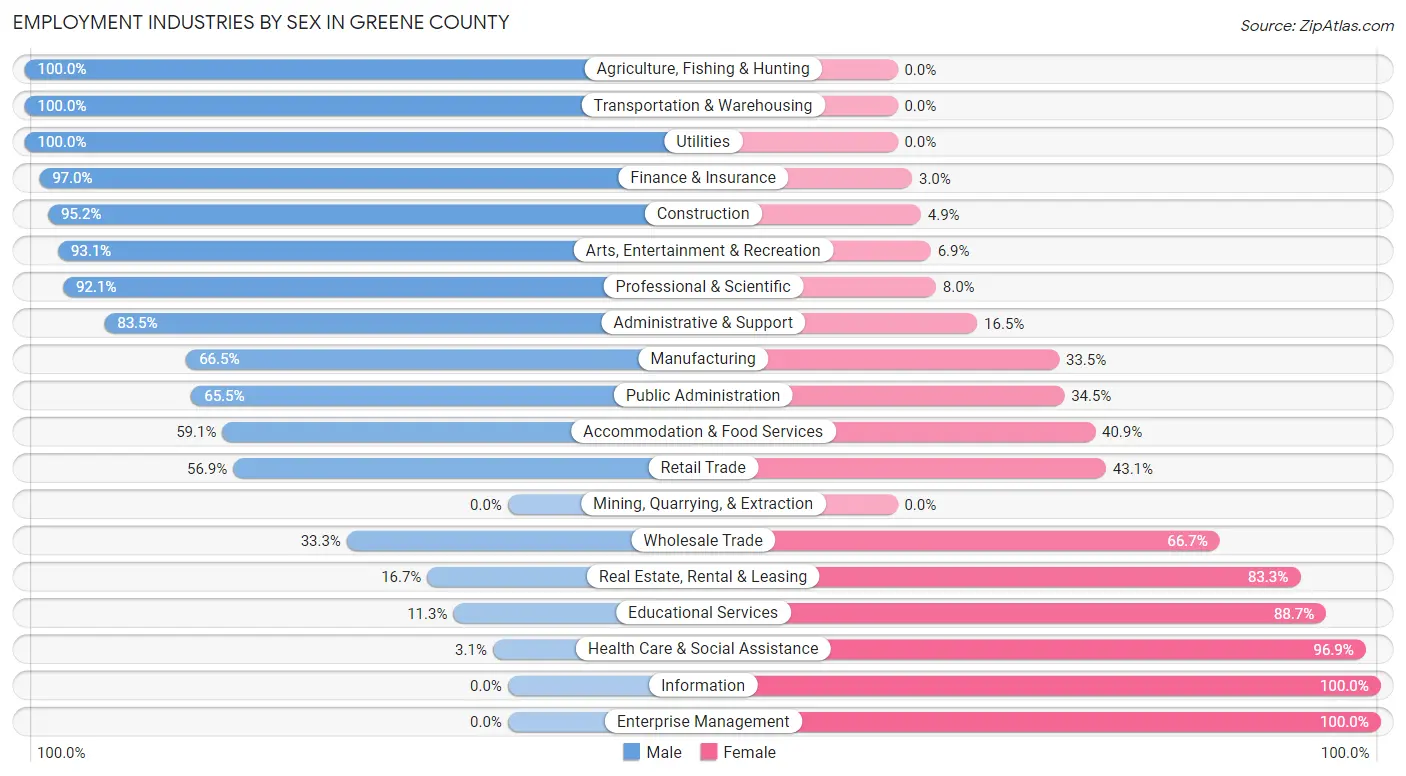
The Greene County industries that see more men than women are Agriculture, Fishing & Hunting (100.0%), Transportation & Warehousing (100.0%), and Utilities (100.0%), whereas the industries that tend to have a higher number of women are Information (100.0%), Enterprise Management (100.0%), and Health Care & Social Assistance (96.9%).
| Industry | Male | Female |
| Agriculture, Fishing & Hunting | 39 (100.0%) | 0 (0.0%) |
| Mining, Quarrying, & Extraction | 0 (0.0%) | 0 (0.0%) |
| Construction | 157 (95.2%) | 8 (4.9%) |
| Manufacturing | 348 (66.5%) | 175 (33.5%) |
| Wholesale Trade | 8 (33.3%) | 16 (66.7%) |
| Retail Trade | 58 (56.9%) | 44 (43.1%) |
| Transportation & Warehousing | 75 (100.0%) | 0 (0.0%) |
| Utilities | 24 (100.0%) | 0 (0.0%) |
| Information | 0 (0.0%) | 61 (100.0%) |
| Finance & Insurance | 32 (97.0%) | 1 (3.0%) |
| Real Estate, Rental & Leasing | 5 (16.7%) | 25 (83.3%) |
| Professional & Scientific | 243 (92.0%) | 21 (8.0%) |
| Enterprise Management | 0 (0.0%) | 38 (100.0%) |
| Administrative & Support | 86 (83.5%) | 17 (16.5%) |
| Educational Services | 29 (11.3%) | 228 (88.7%) |
| Health Care & Social Assistance | 7 (3.1%) | 219 (96.9%) |
| Arts, Entertainment & Recreation | 54 (93.1%) | 4 (6.9%) |
| Accommodation & Food Services | 26 (59.1%) | 18 (40.9%) |
| Public Administration | 165 (65.5%) | 87 (34.5%) |
| Total | 1,375 (58.4%) | 980 (41.6%) |
Education in Greene County
School Enrollment in Greene County
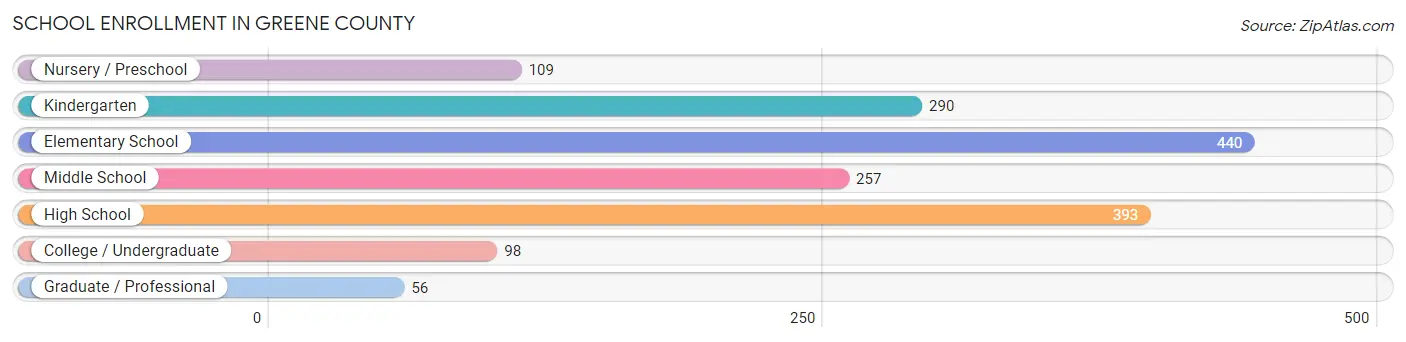
The most common levels of schooling among the 1,643 students in Greene County are elementary school (440 | 26.8%), high school (393 | 23.9%), and kindergarten (290 | 17.6%).
| School Level | # Students | % Students |
| Nursery / Preschool | 109 | 6.6% |
| Kindergarten | 290 | 17.6% |
| Elementary School | 440 | 26.8% |
| Middle School | 257 | 15.6% |
| High School | 393 | 23.9% |
| College / Undergraduate | 98 | 6.0% |
| Graduate / Professional | 56 | 3.4% |
| Total | 1,643 | 100.0% |
School Enrollment by Age by Funding Source in Greene County
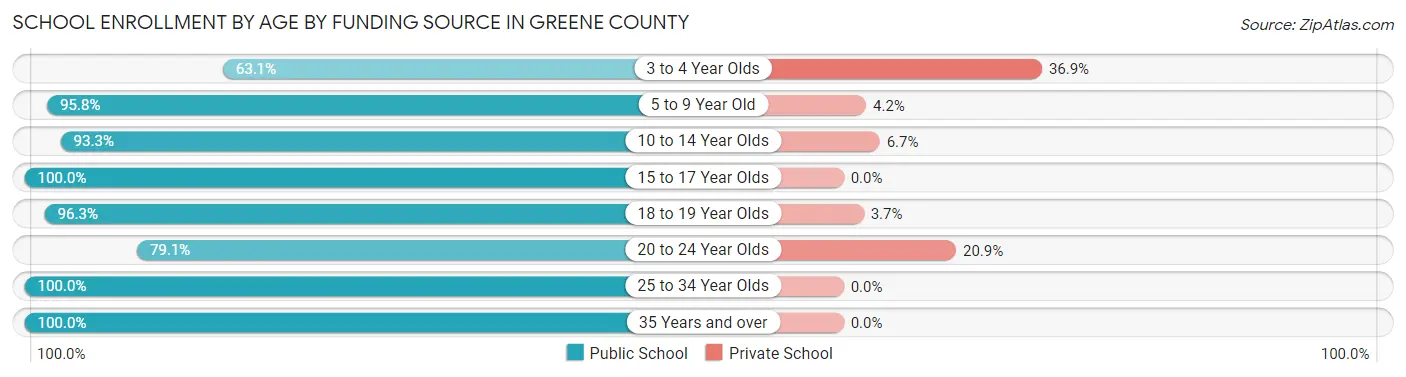
Out of a total of 1,643 students who are enrolled in schools in Greene County, 161 (9.8%) attend a private institution, while the remaining 1,482 (90.2%) are enrolled in public schools. The age group of 3 to 4 year olds has the highest likelihood of being enrolled in private schools, with 106 (36.9% in the age bracket) enrolled. Conversely, the age group of 15 to 17 year olds has the lowest likelihood of being enrolled in a private school, with 261 (100.0% in the age bracket) attending a public institution.
| Age Bracket | Public School | Private School |
| 3 to 4 Year Olds | 181 (63.1%) | 106 (36.9%) |
| 5 to 9 Year Old | 504 (95.8%) | 22 (4.2%) |
| 10 to 14 Year Olds | 264 (93.3%) | 19 (6.7%) |
| 15 to 17 Year Olds | 261 (100.0%) | 0 (0.0%) |
| 18 to 19 Year Olds | 129 (96.3%) | 5 (3.7%) |
| 20 to 24 Year Olds | 34 (79.1%) | 9 (20.9%) |
| 25 to 34 Year Olds | 79 (100.0%) | 0 (0.0%) |
| 35 Years and over | 30 (100.0%) | 0 (0.0%) |
| Total | 1,482 (90.2%) | 161 (9.8%) |
Educational Attainment by Field of Study in Greene County
Business (325 | 32.9%), education (231 | 23.4%), liberal arts & history (127 | 12.9%), social sciences (79 | 8.0%), and engineering (66 | 6.7%) are the most common fields of study among 987 individuals in Greene County who have obtained a bachelor's degree or higher.
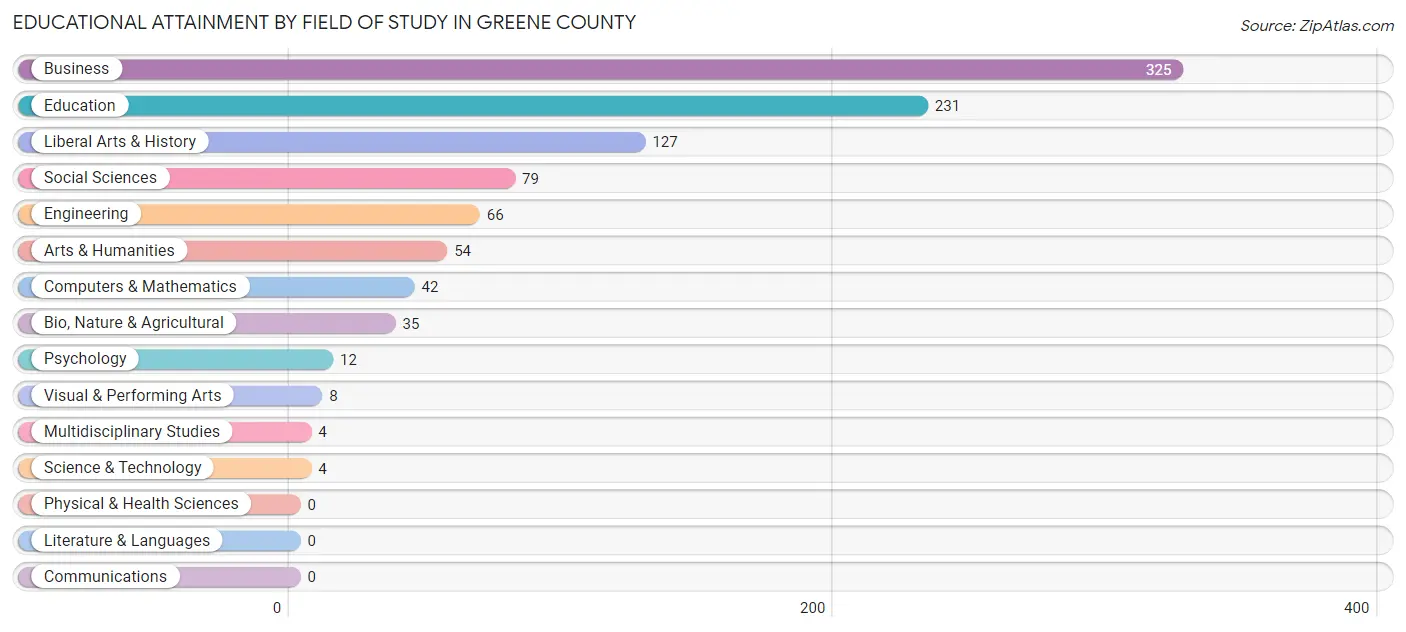
| Field of Study | # Graduates | % Graduates |
| Computers & Mathematics | 42 | 4.3% |
| Bio, Nature & Agricultural | 35 | 3.5% |
| Physical & Health Sciences | 0 | 0.0% |
| Psychology | 12 | 1.2% |
| Social Sciences | 79 | 8.0% |
| Engineering | 66 | 6.7% |
| Multidisciplinary Studies | 4 | 0.4% |
| Science & Technology | 4 | 0.4% |
| Business | 325 | 32.9% |
| Education | 231 | 23.4% |
| Literature & Languages | 0 | 0.0% |
| Liberal Arts & History | 127 | 12.9% |
| Visual & Performing Arts | 8 | 0.8% |
| Communications | 0 | 0.0% |
| Arts & Humanities | 54 | 5.5% |
| Total | 987 | 100.0% |
Transportation & Commute in Greene County
Vehicle Availability by Sex in Greene County
The most prevalent vehicle ownership categories in Greene County are males with 2 vehicles (488, accounting for 40.2%) and females with 2 vehicles (303, making up 52.3%).

| Vehicles Available | Male | Female |
| No Vehicle | 35 (2.9%) | 23 (2.5%) |
| 1 Vehicle | 271 (22.3%) | 391 (41.9%) |
| 2 Vehicles | 488 (40.2%) | 303 (32.5%) |
| 3 Vehicles | 212 (17.5%) | 90 (9.7%) |
| 4 Vehicles | 158 (13.0%) | 106 (11.4%) |
| 5 or more Vehicles | 49 (4.0%) | 20 (2.1%) |
| Total | 1,213 (100.0%) | 933 (100.0%) |
Commute Time in Greene County
The most frequently occuring commute durations in Greene County are 60 to 89 minutes (370 commuters, 17.6%), 5 to 9 minutes (310 commuters, 14.8%), and 45 to 59 minutes (294 commuters, 14.0%).
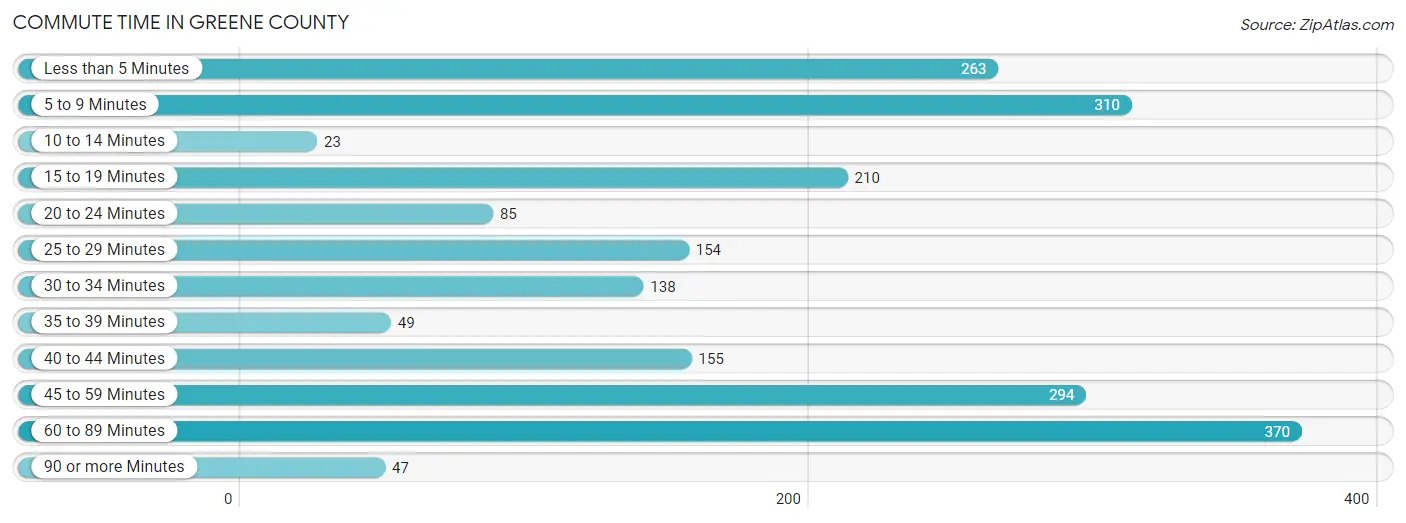
| Commute Time | # Commuters | % Commuters |
| Less than 5 Minutes | 263 | 12.5% |
| 5 to 9 Minutes | 310 | 14.8% |
| 10 to 14 Minutes | 23 | 1.1% |
| 15 to 19 Minutes | 210 | 10.0% |
| 20 to 24 Minutes | 85 | 4.1% |
| 25 to 29 Minutes | 154 | 7.3% |
| 30 to 34 Minutes | 138 | 6.6% |
| 35 to 39 Minutes | 49 | 2.3% |
| 40 to 44 Minutes | 155 | 7.4% |
| 45 to 59 Minutes | 294 | 14.0% |
| 60 to 89 Minutes | 370 | 17.6% |
| 90 or more Minutes | 47 | 2.2% |
Commute Time by Sex in Greene County
The most common commute times in Greene County are 60 to 89 minutes (347 commuters, 29.9%) for males and 15 to 19 minutes (184 commuters, 19.6%) for females.

| Commute Time | Male | Female |
| Less than 5 Minutes | 126 (10.8%) | 137 (14.6%) |
| 5 to 9 Minutes | 214 (18.4%) | 96 (10.2%) |
| 10 to 14 Minutes | 9 (0.8%) | 14 (1.5%) |
| 15 to 19 Minutes | 26 (2.2%) | 184 (19.6%) |
| 20 to 24 Minutes | 44 (3.8%) | 41 (4.4%) |
| 25 to 29 Minutes | 51 (4.4%) | 103 (11.0%) |
| 30 to 34 Minutes | 41 (3.5%) | 97 (10.3%) |
| 35 to 39 Minutes | 49 (4.2%) | 0 (0.0%) |
| 40 to 44 Minutes | 54 (4.6%) | 101 (10.8%) |
| 45 to 59 Minutes | 200 (17.2%) | 94 (10.0%) |
| 60 to 89 Minutes | 347 (29.9%) | 23 (2.5%) |
| 90 or more Minutes | 0 (0.0%) | 47 (5.0%) |
Time of Departure to Work by Sex in Greene County
The most frequent times of departure to work in Greene County are 12:00 AM to 4:59 AM (322, 27.7%) for males and 6:30 AM to 6:59 AM (342, 36.5%) for females.
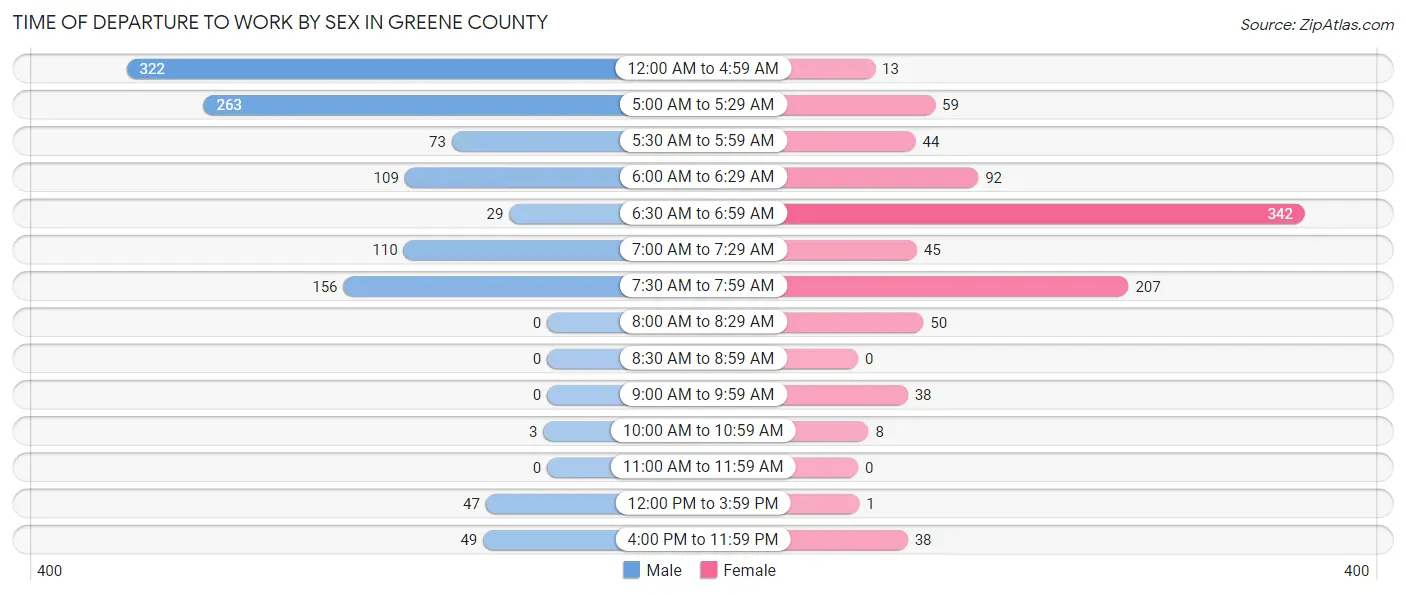
| Time of Departure | Male | Female |
| 12:00 AM to 4:59 AM | 322 (27.7%) | 13 (1.4%) |
| 5:00 AM to 5:29 AM | 263 (22.7%) | 59 (6.3%) |
| 5:30 AM to 5:59 AM | 73 (6.3%) | 44 (4.7%) |
| 6:00 AM to 6:29 AM | 109 (9.4%) | 92 (9.8%) |
| 6:30 AM to 6:59 AM | 29 (2.5%) | 342 (36.5%) |
| 7:00 AM to 7:29 AM | 110 (9.5%) | 45 (4.8%) |
| 7:30 AM to 7:59 AM | 156 (13.4%) | 207 (22.1%) |
| 8:00 AM to 8:29 AM | 0 (0.0%) | 50 (5.3%) |
| 8:30 AM to 8:59 AM | 0 (0.0%) | 0 (0.0%) |
| 9:00 AM to 9:59 AM | 0 (0.0%) | 38 (4.1%) |
| 10:00 AM to 10:59 AM | 3 (0.3%) | 8 (0.9%) |
| 11:00 AM to 11:59 AM | 0 (0.0%) | 0 (0.0%) |
| 12:00 PM to 3:59 PM | 47 (4.1%) | 1 (0.1%) |
| 4:00 PM to 11:59 PM | 49 (4.2%) | 38 (4.1%) |
| Total | 1,161 (100.0%) | 937 (100.0%) |
Housing Occupancy in Greene County
Occupancy by Ownership in Greene County
Of the total 2,872 dwellings in Greene County, owner-occupied units account for 2,112 (73.5%), while renter-occupied units make up 760 (26.5%).

| Occupancy | # Housing Units | % Housing Units |
| Owner Occupied Housing Units | 2,112 | 73.5% |
| Renter-Occupied Housing Units | 760 | 26.5% |
| Total Occupied Housing Units | 2,872 | 100.0% |
Occupancy by Household Size in Greene County

| Household Size | # Housing Units | % Housing Units |
| 1-Person Household | 1,373 | 47.8% |
| 2-Person Household | 800 | 27.9% |
| 3-Person Household | 327 | 11.4% |
| 4+ Person Household | 372 | 13.0% |
| Total Housing Units | 2,872 | 100.0% |
Occupancy by Ownership by Household Size in Greene County

| Household Size | Owner-occupied | Renter-occupied |
| 1-Person Household | 954 (69.5%) | 419 (30.5%) |
| 2-Person Household | 681 (85.1%) | 119 (14.9%) |
| 3-Person Household | 250 (76.4%) | 77 (23.5%) |
| 4+ Person Household | 227 (61.0%) | 145 (39.0%) |
| Total Housing Units | 2,112 (73.5%) | 760 (26.5%) |
Occupancy by Educational Attainment in Greene County
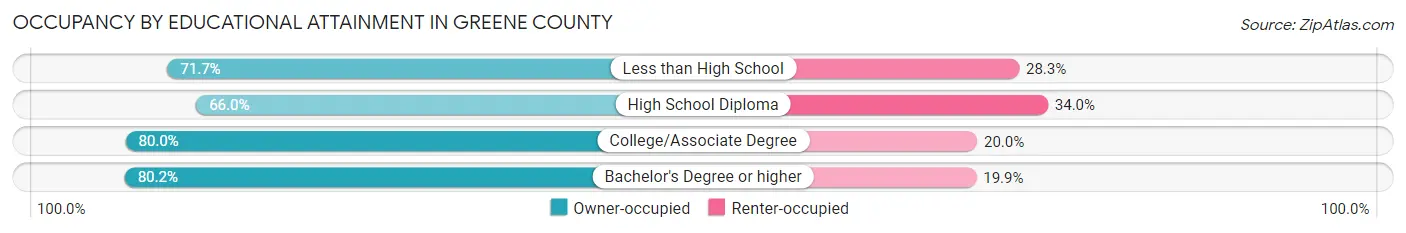
| Household Size | Owner-occupied | Renter-occupied |
| Less than High School | 415 (71.7%) | 164 (28.3%) |
| High School Diploma | 649 (66.0%) | 335 (34.0%) |
| College/Associate Degree | 632 (80.0%) | 158 (20.0%) |
| Bachelor's Degree or higher | 416 (80.1%) | 103 (19.9%) |
Occupancy by Age of Householder in Greene County
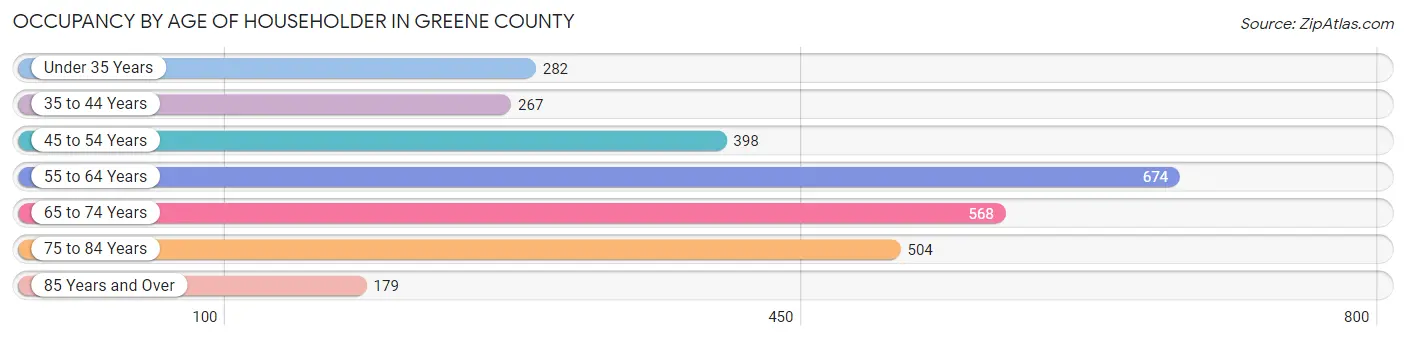
| Age Bracket | # Households | % Households |
| Under 35 Years | 282 | 9.8% |
| 35 to 44 Years | 267 | 9.3% |
| 45 to 54 Years | 398 | 13.9% |
| 55 to 64 Years | 674 | 23.5% |
| 65 to 74 Years | 568 | 19.8% |
| 75 to 84 Years | 504 | 17.5% |
| 85 Years and Over | 179 | 6.2% |
| Total | 2,872 | 100.0% |
Housing Finances in Greene County
Median Income by Occupancy in Greene County

| Occupancy Type | # Households | Median Income |
| Owner-Occupied | 2,112 (73.5%) | $34,832 |
| Renter-Occupied | 760 (26.5%) | $21,139 |
| Average | 2,872 (100.0%) | $32,796 |
Occupancy by Householder Income Bracket in Greene County
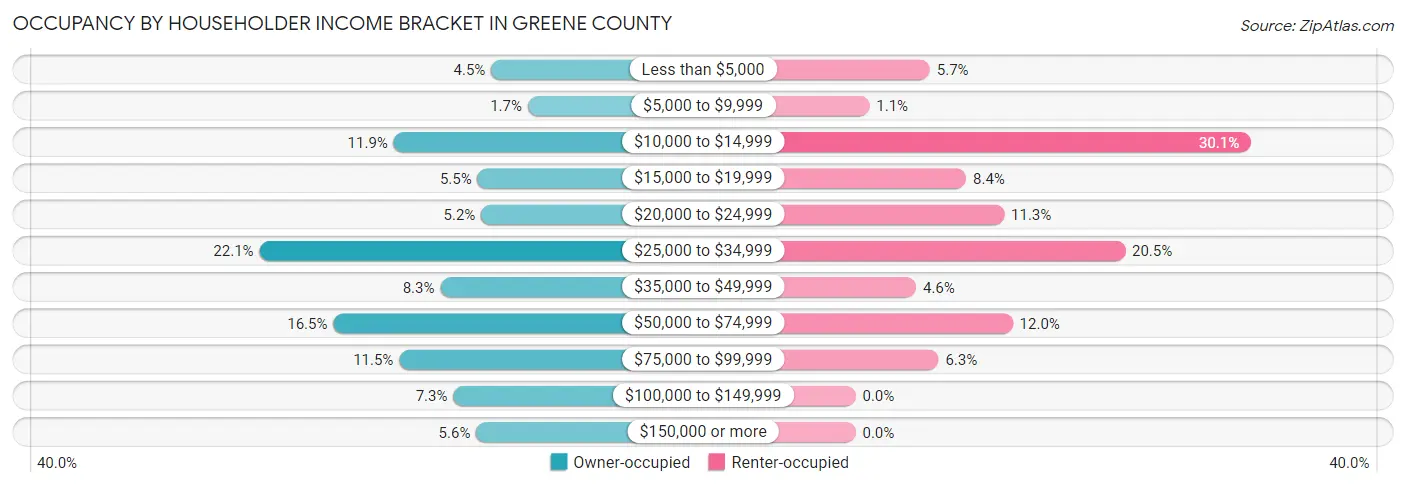
| Income Bracket | Owner-occupied | Renter-occupied |
| Less than $5,000 | 94 (4.4%) | 43 (5.7%) |
| $5,000 to $9,999 | 35 (1.7%) | 8 (1.1%) |
| $10,000 to $14,999 | 251 (11.9%) | 229 (30.1%) |
| $15,000 to $19,999 | 116 (5.5%) | 64 (8.4%) |
| $20,000 to $24,999 | 110 (5.2%) | 86 (11.3%) |
| $25,000 to $34,999 | 467 (22.1%) | 156 (20.5%) |
| $35,000 to $49,999 | 176 (8.3%) | 35 (4.6%) |
| $50,000 to $74,999 | 348 (16.5%) | 91 (12.0%) |
| $75,000 to $99,999 | 242 (11.5%) | 48 (6.3%) |
| $100,000 to $149,999 | 155 (7.3%) | 0 (0.0%) |
| $150,000 or more | 118 (5.6%) | 0 (0.0%) |
| Total | 2,112 (100.0%) | 760 (100.0%) |
Monthly Housing Cost Tiers in Greene County
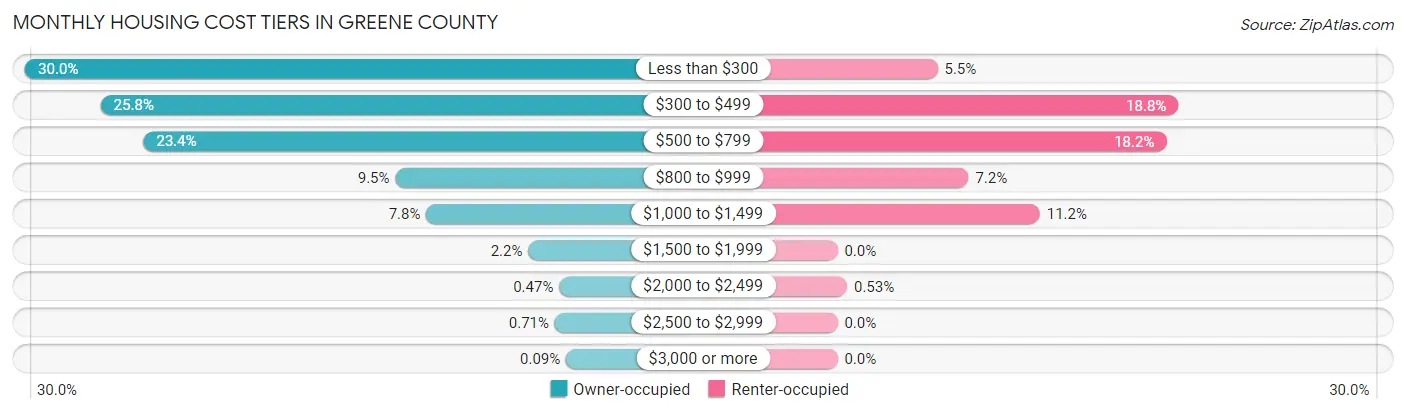
| Monthly Cost | Owner-occupied | Renter-occupied |
| Less than $300 | 633 (30.0%) | 42 (5.5%) |
| $300 to $499 | 545 (25.8%) | 143 (18.8%) |
| $500 to $799 | 495 (23.4%) | 138 (18.2%) |
| $800 to $999 | 201 (9.5%) | 55 (7.2%) |
| $1,000 to $1,499 | 165 (7.8%) | 85 (11.2%) |
| $1,500 to $1,999 | 46 (2.2%) | 0 (0.0%) |
| $2,000 to $2,499 | 10 (0.5%) | 4 (0.5%) |
| $2,500 to $2,999 | 15 (0.7%) | 0 (0.0%) |
| $3,000 or more | 2 (0.1%) | 0 (0.0%) |
| Total | 2,112 (100.0%) | 760 (100.0%) |
Physical Housing Characteristics in Greene County
Housing Structures in Greene County
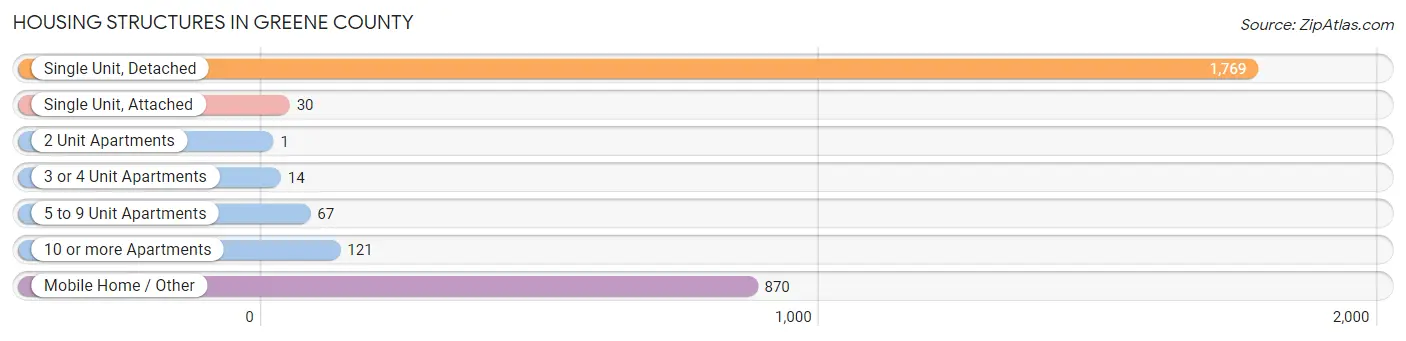
| Structure Type | # Housing Units | % Housing Units |
| Single Unit, Detached | 1,769 | 61.6% |
| Single Unit, Attached | 30 | 1.0% |
| 2 Unit Apartments | 1 | 0.0% |
| 3 or 4 Unit Apartments | 14 | 0.5% |
| 5 to 9 Unit Apartments | 67 | 2.3% |
| 10 or more Apartments | 121 | 4.2% |
| Mobile Home / Other | 870 | 30.3% |
| Total | 2,872 | 100.0% |
Housing Structures by Occupancy in Greene County
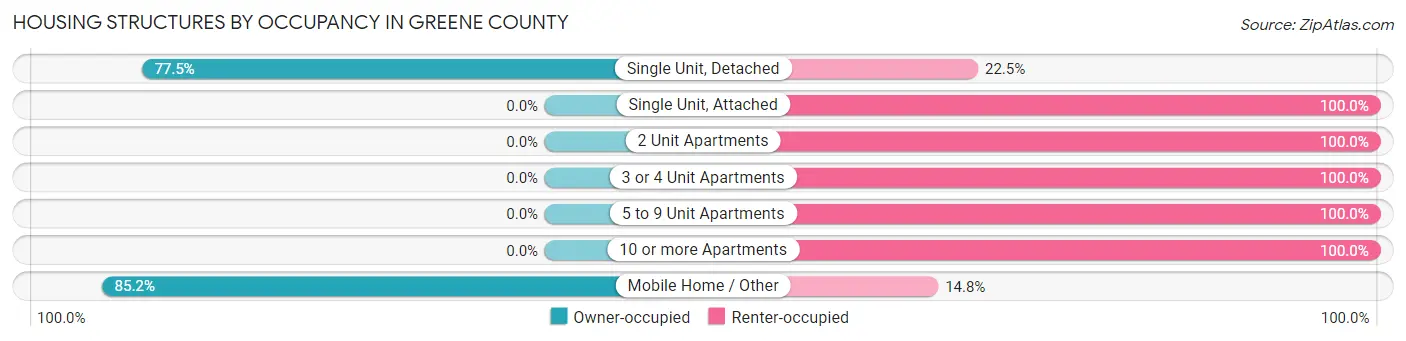
| Structure Type | Owner-occupied | Renter-occupied |
| Single Unit, Detached | 1,371 (77.5%) | 398 (22.5%) |
| Single Unit, Attached | 0 (0.0%) | 30 (100.0%) |
| 2 Unit Apartments | 0 (0.0%) | 1 (100.0%) |
| 3 or 4 Unit Apartments | 0 (0.0%) | 14 (100.0%) |
| 5 to 9 Unit Apartments | 0 (0.0%) | 67 (100.0%) |
| 10 or more Apartments | 0 (0.0%) | 121 (100.0%) |
| Mobile Home / Other | 741 (85.2%) | 129 (14.8%) |
| Total | 2,112 (73.5%) | 760 (26.5%) |
Housing Structures by Number of Rooms in Greene County
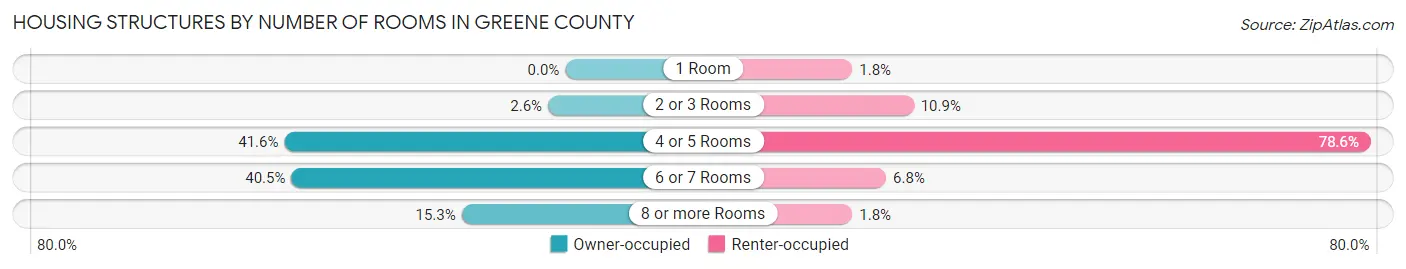
| Number of Rooms | Owner-occupied | Renter-occupied |
| 1 Room | 0 (0.0%) | 14 (1.8%) |
| 2 or 3 Rooms | 54 (2.6%) | 83 (10.9%) |
| 4 or 5 Rooms | 878 (41.6%) | 597 (78.5%) |
| 6 or 7 Rooms | 856 (40.5%) | 52 (6.8%) |
| 8 or more Rooms | 324 (15.3%) | 14 (1.8%) |
| Total | 2,112 (100.0%) | 760 (100.0%) |
Housing Structure by Heating Type in Greene County
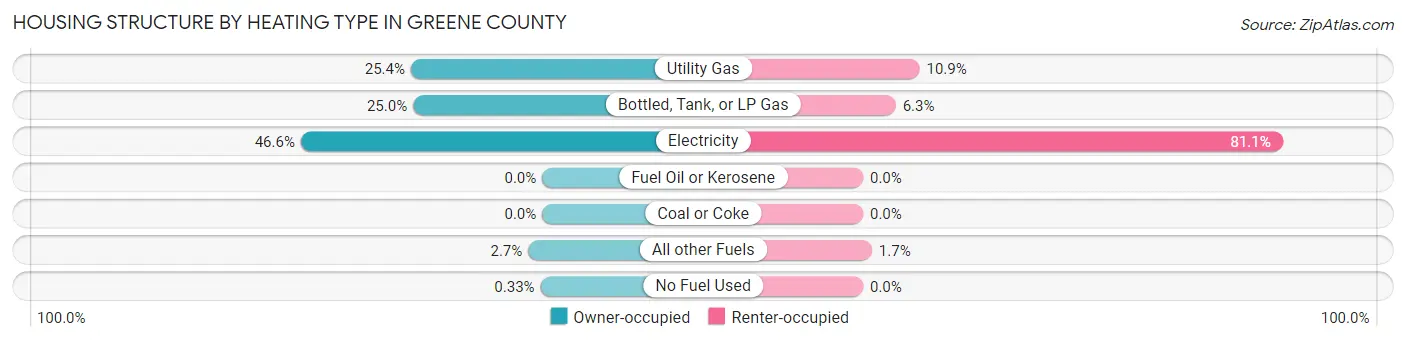
| Heating Type | Owner-occupied | Renter-occupied |
| Utility Gas | 536 (25.4%) | 83 (10.9%) |
| Bottled, Tank, or LP Gas | 527 (24.9%) | 48 (6.3%) |
| Electricity | 985 (46.6%) | 616 (81.0%) |
| Fuel Oil or Kerosene | 0 (0.0%) | 0 (0.0%) |
| Coal or Coke | 0 (0.0%) | 0 (0.0%) |
| All other Fuels | 57 (2.7%) | 13 (1.7%) |
| No Fuel Used | 7 (0.3%) | 0 (0.0%) |
| Total | 2,112 (100.0%) | 760 (100.0%) |
Household Vehicle Usage in Greene County
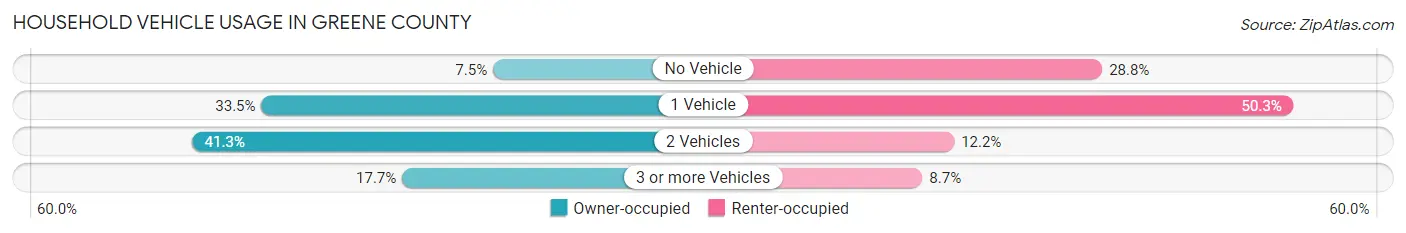
| Vehicles per Household | Owner-occupied | Renter-occupied |
| No Vehicle | 159 (7.5%) | 219 (28.8%) |
| 1 Vehicle | 707 (33.5%) | 382 (50.3%) |
| 2 Vehicles | 872 (41.3%) | 93 (12.2%) |
| 3 or more Vehicles | 374 (17.7%) | 66 (8.7%) |
| Total | 2,112 (100.0%) | 760 (100.0%) |
Real Estate & Mortgages in Greene County
Real Estate and Mortgage Overview in Greene County
| Characteristic | Without Mortgage | With Mortgage |
| Housing Units | 1,491 | 621 |
| Median Property Value | $58,300 | $96,200 |
| Median Household Income | $37,528 | $19 |
| Monthly Housing Costs | $346 | $2 |
| Real Estate Taxes | $266 | $320 |
Property Value by Mortgage Status in Greene County
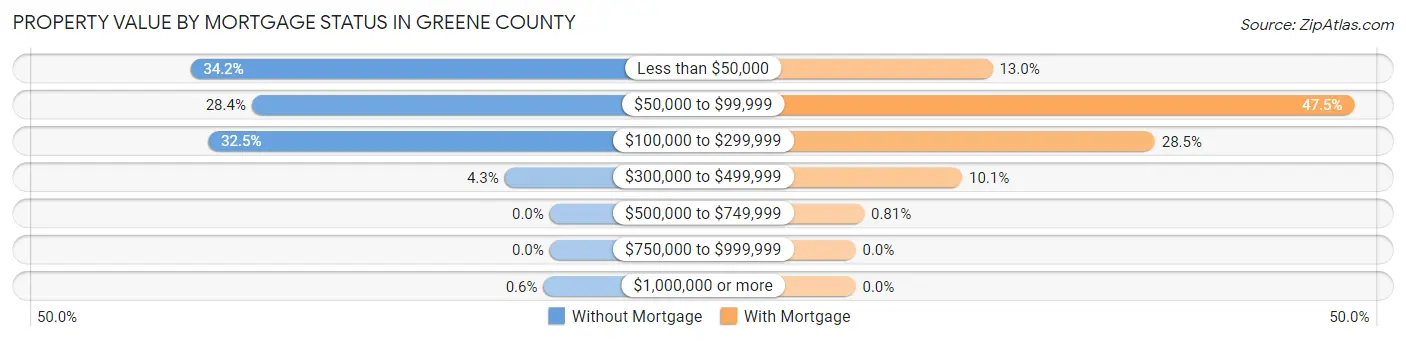
| Property Value | Without Mortgage | With Mortgage |
| Less than $50,000 | 510 (34.2%) | 81 (13.0%) |
| $50,000 to $99,999 | 423 (28.4%) | 295 (47.5%) |
| $100,000 to $299,999 | 485 (32.5%) | 177 (28.5%) |
| $300,000 to $499,999 | 64 (4.3%) | 63 (10.1%) |
| $500,000 to $749,999 | 0 (0.0%) | 5 (0.8%) |
| $750,000 to $999,999 | 0 (0.0%) | 0 (0.0%) |
| $1,000,000 or more | 9 (0.6%) | 0 (0.0%) |
| Total | 1,491 (100.0%) | 621 (100.0%) |
Household Income by Mortgage Status in Greene County
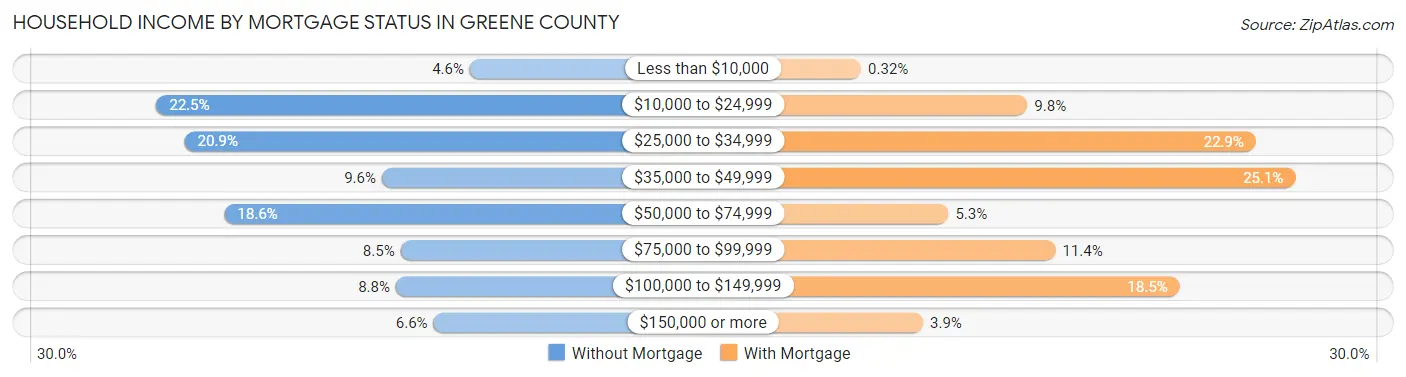
| Household Income | Without Mortgage | With Mortgage |
| Less than $10,000 | 68 (4.6%) | 2 (0.3%) |
| $10,000 to $24,999 | 335 (22.5%) | 61 (9.8%) |
| $25,000 to $34,999 | 311 (20.9%) | 142 (22.9%) |
| $35,000 to $49,999 | 143 (9.6%) | 156 (25.1%) |
| $50,000 to $74,999 | 277 (18.6%) | 33 (5.3%) |
| $75,000 to $99,999 | 127 (8.5%) | 71 (11.4%) |
| $100,000 to $149,999 | 131 (8.8%) | 115 (18.5%) |
| $150,000 or more | 99 (6.6%) | 24 (3.9%) |
| Total | 1,491 (100.0%) | 621 (100.0%) |
Property Value to Household Income Ratio in Greene County
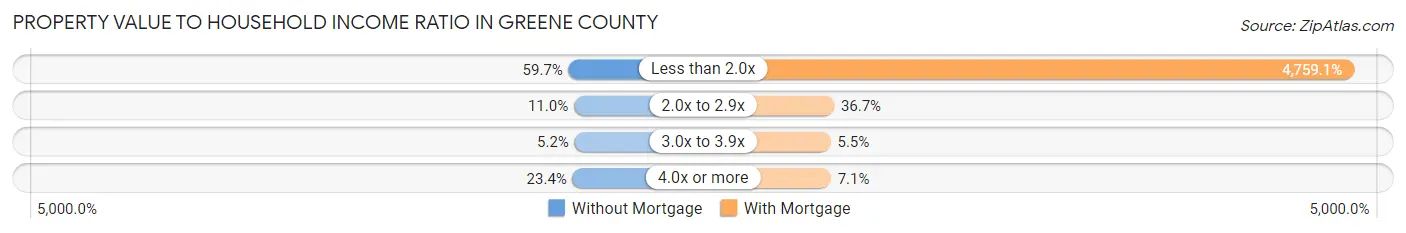
| Value-to-Income Ratio | Without Mortgage | With Mortgage |
| Less than 2.0x | 890 (59.7%) | 29,554 (4,759.1%) |
| 2.0x to 2.9x | 164 (11.0%) | 228 (36.7%) |
| 3.0x to 3.9x | 78 (5.2%) | 34 (5.5%) |
| 4.0x or more | 349 (23.4%) | 44 (7.1%) |
| Total | 1,491 (100.0%) | 621 (100.0%) |
Real Estate Taxes by Mortgage Status in Greene County
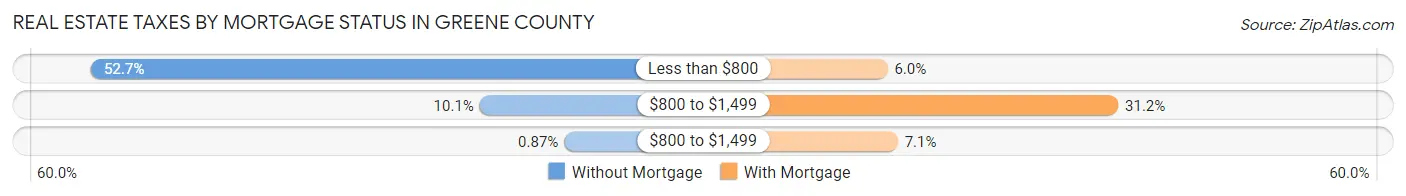
| Property Taxes | Without Mortgage | With Mortgage |
| Less than $800 | 786 (52.7%) | 37 (6.0%) |
| $800 to $1,499 | 151 (10.1%) | 194 (31.2%) |
| $800 to $1,499 | 13 (0.9%) | 44 (7.1%) |
| Total | 1,491 (100.0%) | 621 (100.0%) |
Health & Disability in Greene County
Health Insurance Coverage by Age in Greene County
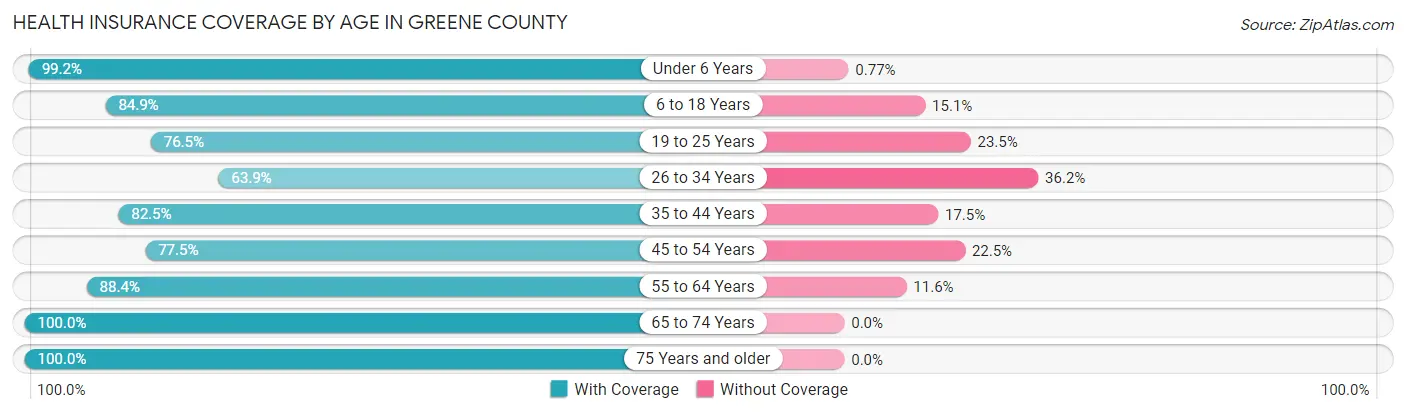
| Age Bracket | With Coverage | Without Coverage |
| Under 6 Years | 648 (99.2%) | 5 (0.8%) |
| 6 to 18 Years | 890 (84.9%) | 158 (15.1%) |
| 19 to 25 Years | 523 (76.5%) | 161 (23.5%) |
| 26 to 34 Years | 528 (63.8%) | 299 (36.1%) |
| 35 to 44 Years | 661 (82.5%) | 140 (17.5%) |
| 45 to 54 Years | 589 (77.5%) | 171 (22.5%) |
| 55 to 64 Years | 962 (88.4%) | 126 (11.6%) |
| 65 to 74 Years | 978 (100.0%) | 0 (0.0%) |
| 75 Years and older | 790 (100.0%) | 0 (0.0%) |
| Total | 6,569 (86.1%) | 1,060 (13.9%) |
Health Insurance Coverage by Citizenship Status in Greene County
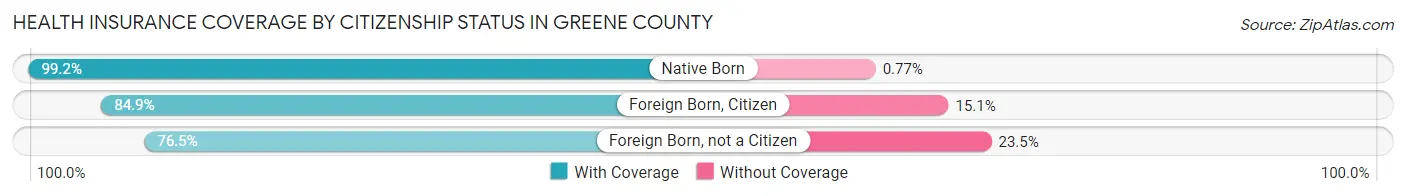
| Citizenship Status | With Coverage | Without Coverage |
| Native Born | 648 (99.2%) | 5 (0.8%) |
| Foreign Born, Citizen | 890 (84.9%) | 158 (15.1%) |
| Foreign Born, not a Citizen | 523 (76.5%) | 161 (23.5%) |
Health Insurance Coverage by Household Income in Greene County
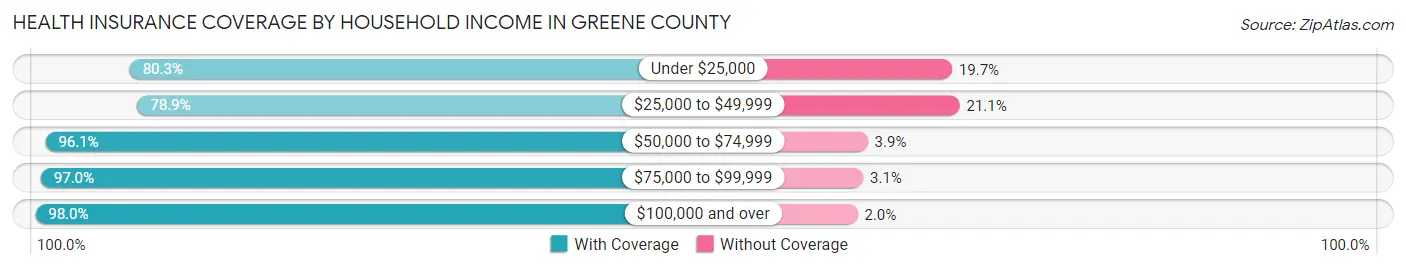
| Household Income | With Coverage | Without Coverage |
| Under $25,000 | 1,924 (80.3%) | 472 (19.7%) |
| $25,000 to $49,999 | 1,784 (78.9%) | 478 (21.1%) |
| $50,000 to $74,999 | 1,278 (96.1%) | 52 (3.9%) |
| $75,000 to $99,999 | 763 (97.0%) | 24 (3.0%) |
| $100,000 and over | 782 (98.0%) | 16 (2.0%) |
Public vs Private Health Insurance Coverage by Age in Greene County
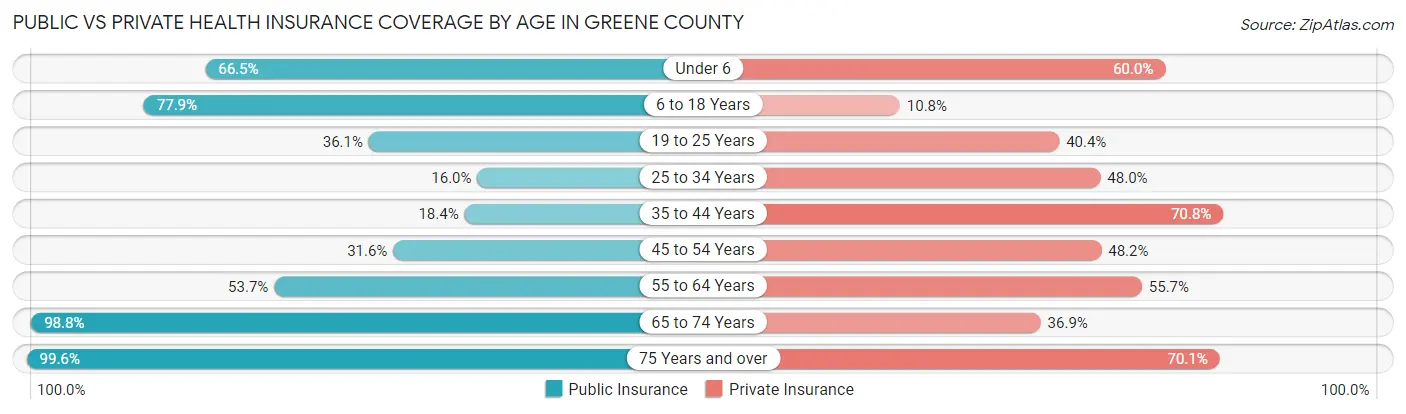
| Age Bracket | Public Insurance | Private Insurance |
| Under 6 | 434 (66.5%) | 392 (60.0%) |
| 6 to 18 Years | 816 (77.9%) | 113 (10.8%) |
| 19 to 25 Years | 247 (36.1%) | 276 (40.4%) |
| 25 to 34 Years | 132 (16.0%) | 397 (48.0%) |
| 35 to 44 Years | 147 (18.3%) | 567 (70.8%) |
| 45 to 54 Years | 240 (31.6%) | 366 (48.2%) |
| 55 to 64 Years | 584 (53.7%) | 606 (55.7%) |
| 65 to 74 Years | 966 (98.8%) | 361 (36.9%) |
| 75 Years and over | 787 (99.6%) | 554 (70.1%) |
| Total | 4,353 (57.1%) | 3,632 (47.6%) |
Disability Status by Sex by Age in Greene County

| Age Bracket | Male | Female |
| Under 5 Years | 0 (0.0%) | 0 (0.0%) |
| 5 to 17 Years | 105 (19.7%) | 0 (0.0%) |
| 18 to 34 Years | 123 (16.3%) | 401 (52.6%) |
| 35 to 64 Years | 348 (26.8%) | 281 (20.8%) |
| 65 to 74 Years | 177 (40.5%) | 229 (42.3%) |
| 75 Years and over | 184 (54.6%) | 301 (66.4%) |
Disability Class by Sex by Age in Greene County
Disability Class: Hearing Difficulty
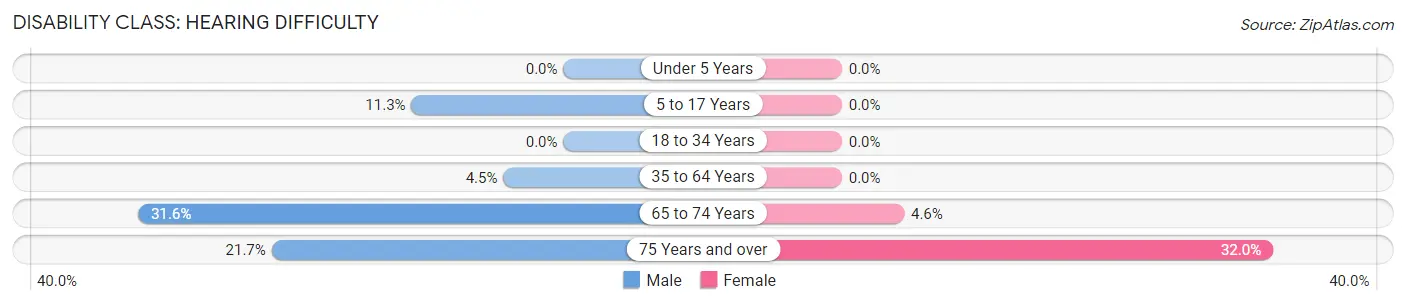
| Age Bracket | Male | Female |
| Under 5 Years | 0 (0.0%) | 0 (0.0%) |
| 5 to 17 Years | 60 (11.3%) | 0 (0.0%) |
| 18 to 34 Years | 0 (0.0%) | 0 (0.0%) |
| 35 to 64 Years | 58 (4.5%) | 0 (0.0%) |
| 65 to 74 Years | 138 (31.6%) | 25 (4.6%) |
| 75 Years and over | 73 (21.7%) | 145 (32.0%) |
Disability Class: Vision Difficulty
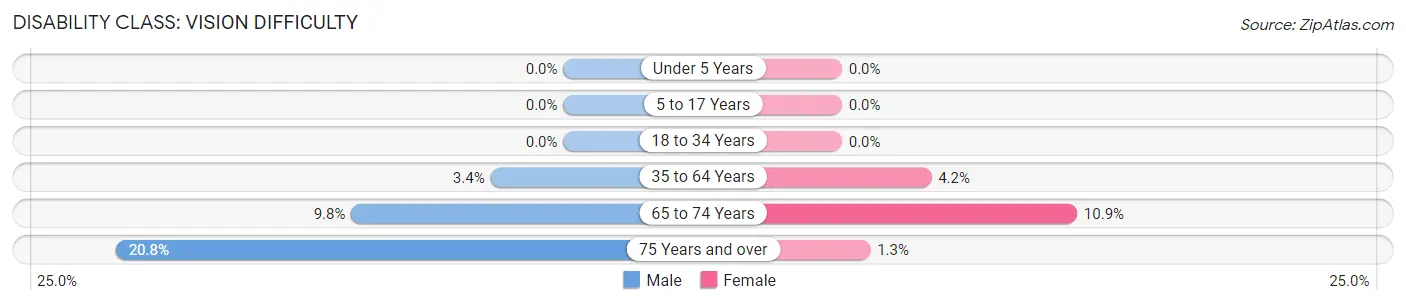
| Age Bracket | Male | Female |
| Under 5 Years | 0 (0.0%) | 0 (0.0%) |
| 5 to 17 Years | 0 (0.0%) | 0 (0.0%) |
| 18 to 34 Years | 0 (0.0%) | 0 (0.0%) |
| 35 to 64 Years | 44 (3.4%) | 56 (4.2%) |
| 65 to 74 Years | 43 (9.8%) | 59 (10.9%) |
| 75 Years and over | 70 (20.8%) | 6 (1.3%) |
Disability Class: Cognitive Difficulty
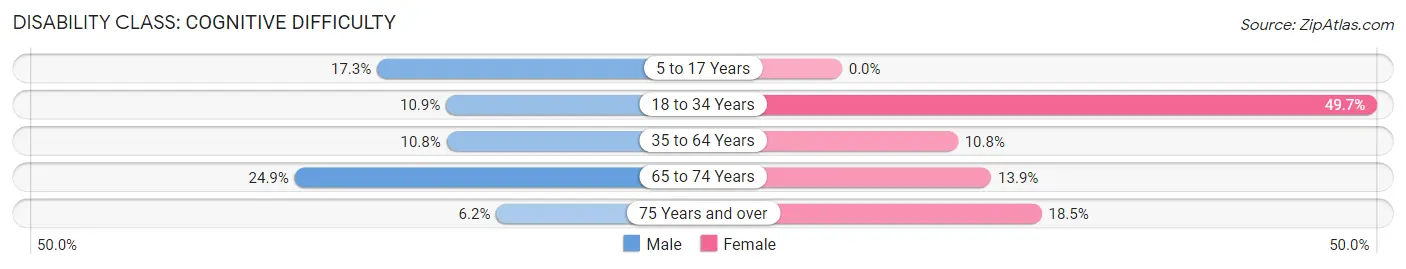
| Age Bracket | Male | Female |
| 5 to 17 Years | 92 (17.3%) | 0 (0.0%) |
| 18 to 34 Years | 82 (10.9%) | 379 (49.7%) |
| 35 to 64 Years | 141 (10.8%) | 145 (10.8%) |
| 65 to 74 Years | 109 (24.9%) | 75 (13.9%) |
| 75 Years and over | 21 (6.2%) | 84 (18.5%) |
Disability Class: Ambulatory Difficulty
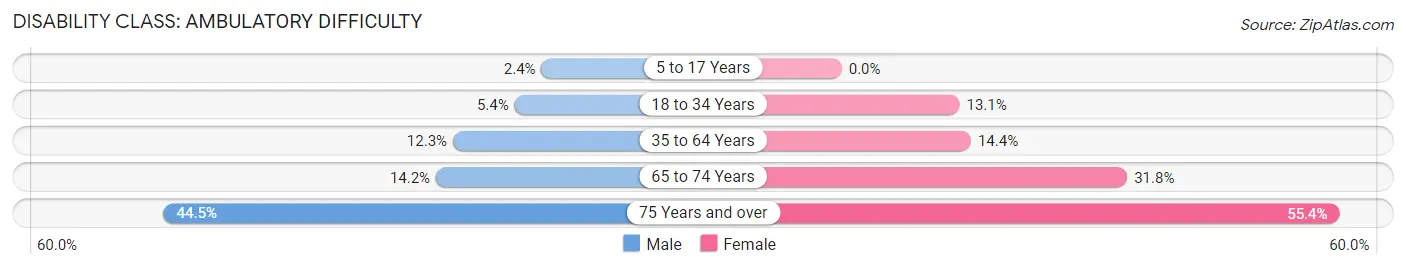
| Age Bracket | Male | Female |
| 5 to 17 Years | 13 (2.4%) | 0 (0.0%) |
| 18 to 34 Years | 41 (5.4%) | 100 (13.1%) |
| 35 to 64 Years | 160 (12.3%) | 194 (14.4%) |
| 65 to 74 Years | 62 (14.2%) | 172 (31.8%) |
| 75 Years and over | 150 (44.5%) | 251 (55.4%) |
Disability Class: Self-Care Difficulty
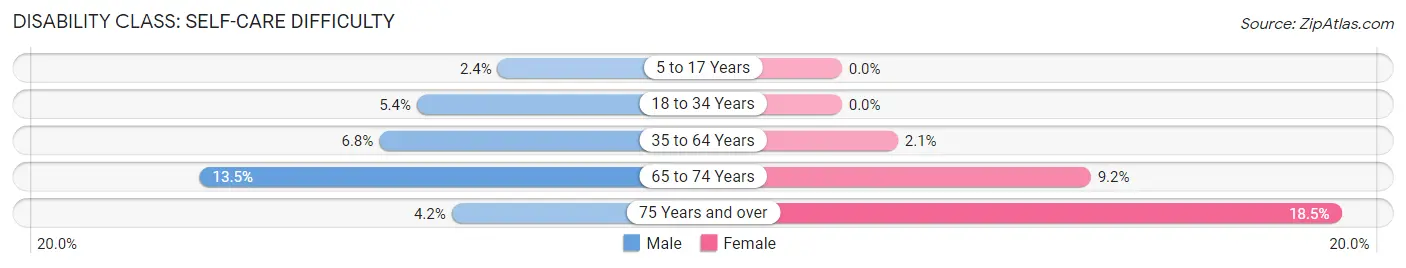
| Age Bracket | Male | Female |
| 5 to 17 Years | 13 (2.4%) | 0 (0.0%) |
| 18 to 34 Years | 41 (5.4%) | 0 (0.0%) |
| 35 to 64 Years | 89 (6.8%) | 28 (2.1%) |
| 65 to 74 Years | 59 (13.5%) | 50 (9.2%) |
| 75 Years and over | 14 (4.2%) | 84 (18.5%) |
Technology Access in Greene County
Computing Device Access in Greene County
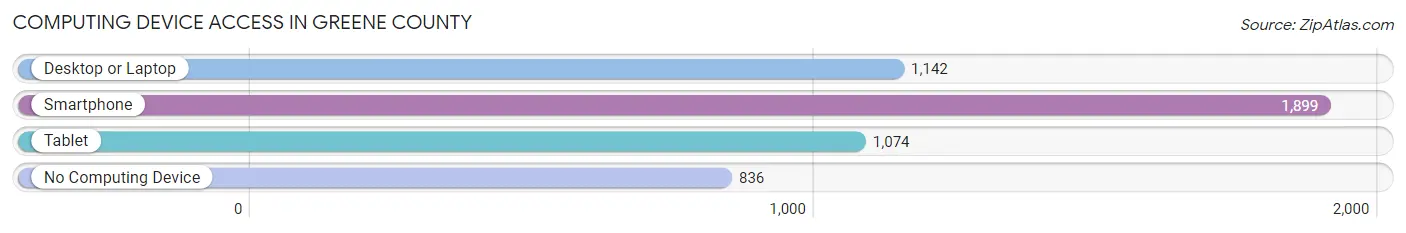
| Device Type | # Households | % Households |
| Desktop or Laptop | 1,142 | 39.8% |
| Smartphone | 1,899 | 66.1% |
| Tablet | 1,074 | 37.4% |
| No Computing Device | 836 | 29.1% |
| Total | 2,872 | 100.0% |
Internet Access in Greene County

| Internet Type | # Households | % Households |
| Dial-Up Internet | 8 | 0.3% |
| Broadband Home | 948 | 33.0% |
| Cellular Data Only | 377 | 13.1% |
| Satellite Internet | 303 | 10.5% |
| No Internet | 1,255 | 43.7% |
| Total | 2,872 | 100.0% |
Greene County Summary
Greene County is located in the southwestern corner of Alabama, and is bordered by the states of Mississippi and Florida. It is part of the Black Belt region of the state, and is known for its rich agricultural heritage. The county seat is Eutaw, and the population was 8,945 at the 2010 census.
Geography
Greene County is located in the southwestern corner of Alabama, and is bordered by the states of Mississippi and Florida. It is part of the Black Belt region of the state, and is known for its rich agricultural heritage. The county is mostly rural, with a total area of 602 square miles. The terrain is mostly flat, with some rolling hills in the northern part of the county. The Tombigbee River forms the western border of the county, and the Alabama River forms the eastern border.
Climate
Greene County has a humid subtropical climate, with hot, humid summers and mild winters. The average annual temperature is around 68°F, and the average annual precipitation is around 50 inches.
Demographics
As of the 2010 census, Greene County had a population of 8,945. The racial makeup of the county was 68.3% White, 30.2% Black or African American, 0.3% Native American, 0.2% Asian, 0.1% Pacific Islander, 0.3% from other races, and 0.7% from two or more races. 1.3% of the population were Hispanic or Latino of any race.
Economy
Greene County is largely rural, and the economy is largely based on agriculture. The county is known for its production of cotton, soybeans, corn, and peanuts. Other industries in the county include timber, manufacturing, and tourism.
History
Greene County was established in 1819, and was named for General Nathanael Greene, a hero of the American Revolution. The county seat is Eutaw, which was founded in 1819 and named for the Eutaw Springs in South Carolina. The county was largely agricultural, and the economy was based on cotton production.
During the Civil War, Greene County was a center of Confederate activity. The Battle of Eutaw Springs was fought in the county in September of 1864, and the Confederate forces were victorious. After the war, the county continued to be largely agricultural, and the economy was based on cotton production.
In the late 19th and early 20th centuries, Greene County was a center of the civil rights movement. The county was the site of several civil rights protests, and the county was the site of the first Freedom Riders in 1961.
Today, Greene County is a largely rural county, and the economy is based on agriculture. The county is known for its production of cotton, soybeans, corn, and peanuts. Other industries in the county include timber, manufacturing, and tourism.
Common Questions
What is the Total Population of Greene County?
Total Population of Greene County is 7,706.
What is the Total Male Population of Greene County?
Total Male Population of Greene County is 3,707.
What is the Total Female Population of Greene County?
Total Female Population of Greene County is 3,999.
What is the Ratio of Males per 100 Females in Greene County?
There are 92.70 Males per 100 Females in Greene County.
What is the Ratio of Females per 100 Males in Greene County?
There are 107.88 Females per 100 Males in Greene County.
What is the Median Population Age in Greene County?
Median Population Age in Greene County is 41.1 Years.
What is the Average Family Size in Greene County
Average Family Size in Greene County is 4.1 People.
What is the Average Household Size in Greene County
Average Household Size in Greene County is 2.6 People.
What is Per Capita Income in Greene County?
Per Capita income in Greene County is $20,862.
What is the Median Family Income in Greene County?
Median Family Income in Greene County is $53,019.
What is the Median Household income in Greene County?
Median Household Income in Greene County is $32,796.
What is Income or Wage Gap in Greene County?
Income or Wage Gap in Greene County is 18.6%.
Women in Greene County earn 81.4 cents for every dollar earned by a man.
What is Family Income Deficit in Greene County?
Family Income Deficit in Greene County is $6,413.
Families that are below poverty line in Greene County earn $6,413 less on average than the poverty threshold level.
What is Inequality or Gini Index in Greene County?
Inequality or Gini Index in Greene County is 0.47.
How Large is the Labor Force in Greene County?
There are 2,467 People in the Labor Forcein in Greene County.
What is the Percentage of People in the Labor Force in Greene County?
40.3% of People are in the Labor Force in Greene County.
What is the Unemployment Rate in Greene County?
Unemployment Rate in Greene County is 4.5%.