Cleburne County, AL
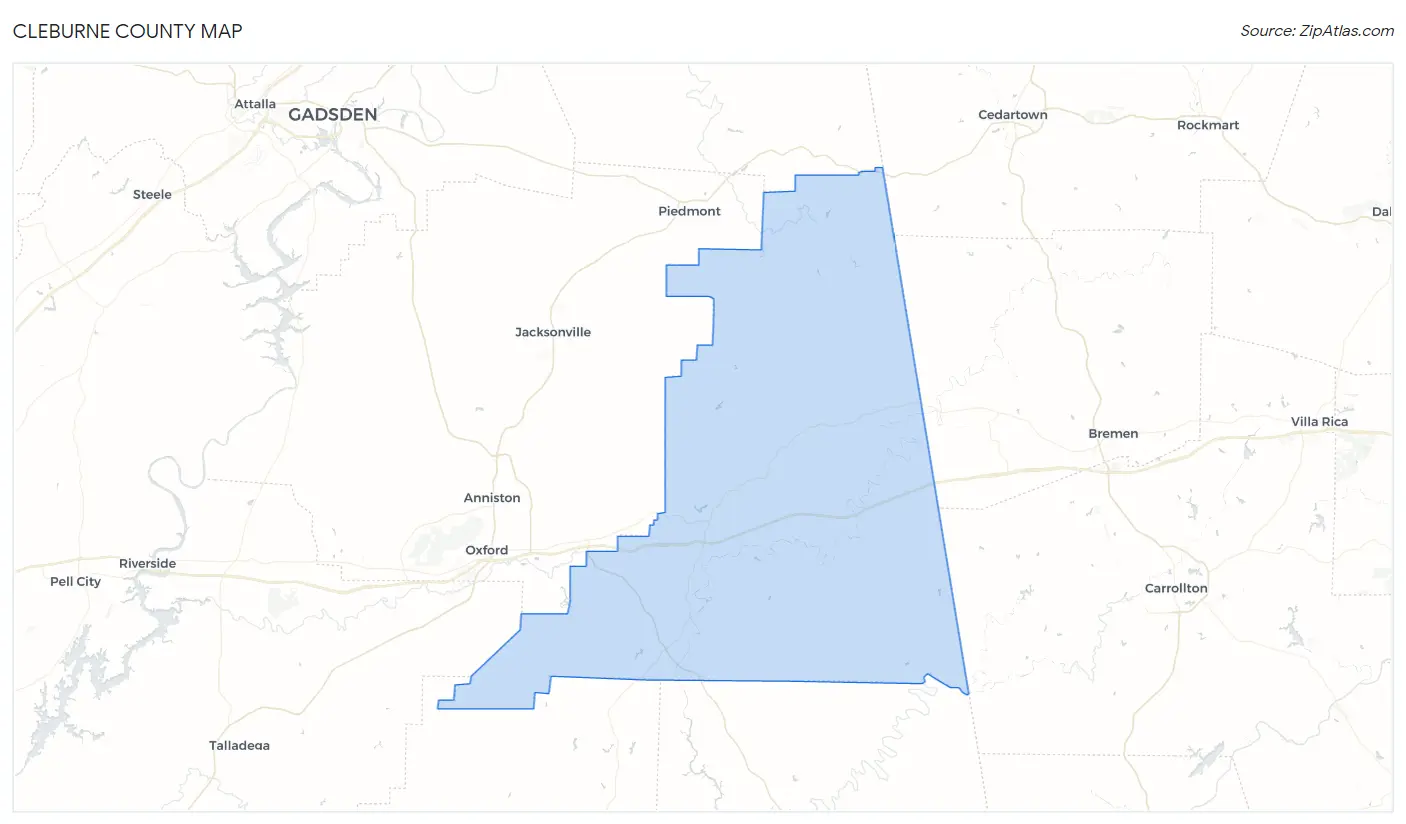
Cleburne County Map
Cleburne County Overview
15,144
TOTAL POPULATION
7,565
MALE POPULATION
7,579
FEMALE POPULATION
99.82
MALES / 100 FEMALES
100.19
FEMALES / 100 MALES
42.2
MEDIAN AGE
3.3
AVG FAMILY SIZE
2.6
AVG HOUSEHOLD SIZE
$28,598
PER CAPITA INCOME
$71,833
AVG FAMILY INCOME
$51,553
AVG HOUSEHOLD INCOME
32.3%
WAGE / INCOME GAP [ % ]
67.7¢/ $1
WAGE / INCOME GAP [ $ ]
$8,204
FAMILY INCOME DEFICIT
0.47
INEQUALITY / GINI INDEX
5,846
LABOR FORCE [ PEOPLE ]
48.3%
PERCENT IN LABOR FORCE
2.6%
UNEMPLOYMENT RATE
Cleburne County Area Codes
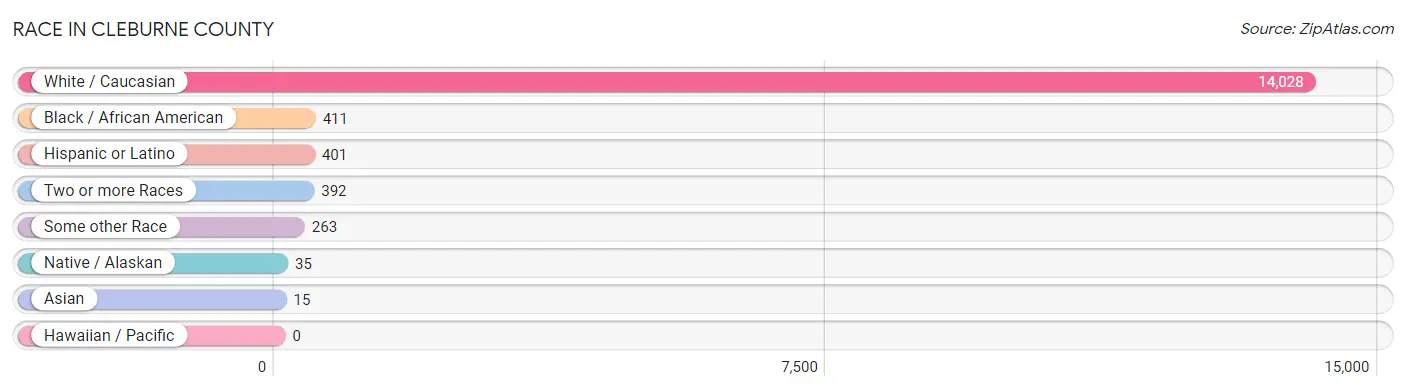
Race in Cleburne County
The most populous races in Cleburne County are White / Caucasian (14,028 | 92.6%), Black / African American (411 | 2.7%), and Hispanic or Latino (401 | 2.6%).
| Race | # Population | % Population |
| Asian | 15 | 0.1% |
| Black / African American | 411 | 2.7% |
| Hawaiian / Pacific | 0 | 0.0% |
| Hispanic or Latino | 401 | 2.6% |
| Native / Alaskan | 35 | 0.2% |
| White / Caucasian | 14,028 | 92.6% |
| Two or more Races | 392 | 2.6% |
| Some other Race | 263 | 1.7% |
| Total | 15,144 | 100.0% |
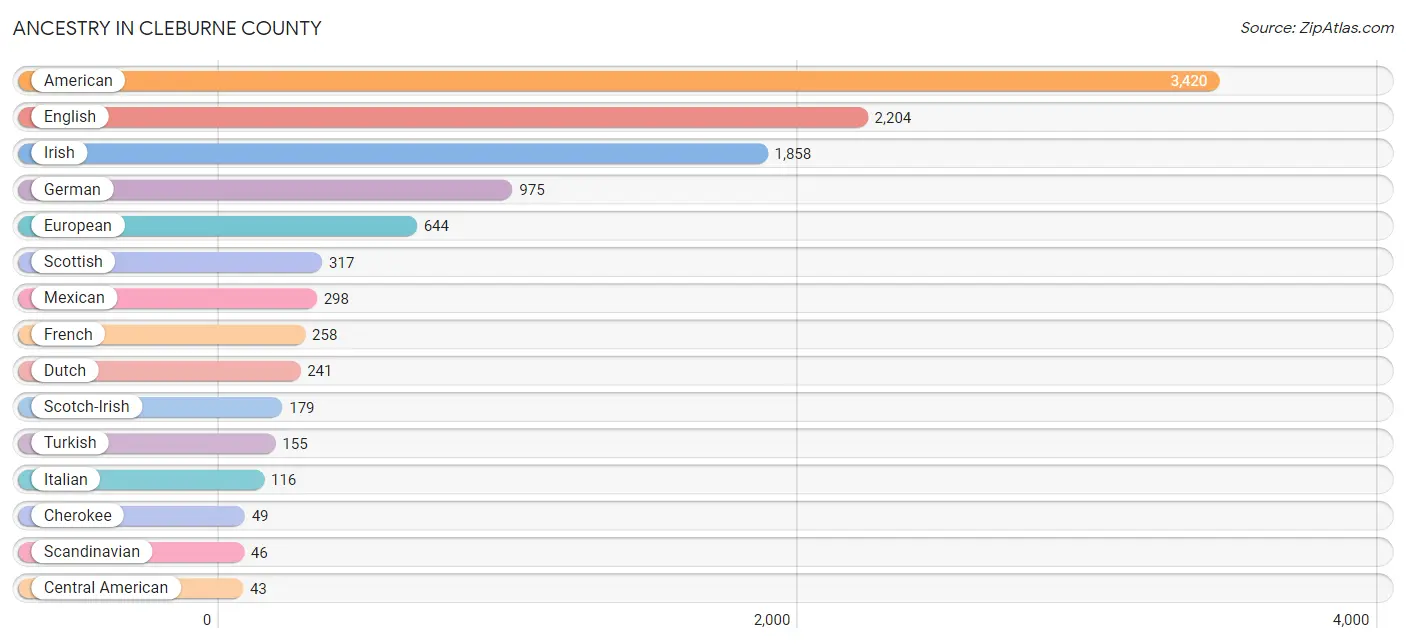
Ancestry in Cleburne County
The most populous ancestries reported in Cleburne County are American (3,420 | 22.6%), English (2,204 | 14.5%), Irish (1,858 | 12.3%), German (975 | 6.4%), and European (644 | 4.3%), together accounting for 60.1% of all Cleburne County residents.
| Ancestry | # Population | % Population |
| African | 21 | 0.1% |
| American | 3,420 | 22.6% |
| Austrian | 3 | 0.0% |
| Bhutanese | 14 | 0.1% |
| Blackfeet | 4 | 0.0% |
| Brazilian | 13 | 0.1% |
| British | 36 | 0.2% |
| Central American | 43 | 0.3% |
| Cherokee | 49 | 0.3% |
| Chickasaw | 2 | 0.0% |
| Dutch | 241 | 1.6% |
| Ecuadorian | 4 | 0.0% |
| English | 2,204 | 14.5% |
| European | 644 | 4.3% |
| French | 258 | 1.7% |
| German | 975 | 6.4% |
| Greek | 5 | 0.0% |
| Guatemalan | 43 | 0.3% |
| Indian (Asian) | 1 | 0.0% |
| Irish | 1,858 | 12.3% |
| Italian | 116 | 0.8% |
| Mexican | 298 | 2.0% |
| Norwegian | 30 | 0.2% |
| Polish | 6 | 0.0% |
| Puerto Rican | 5 | 0.0% |
| Russian | 12 | 0.1% |
| Samoan | 8 | 0.1% |
| Scandinavian | 46 | 0.3% |
| Scotch-Irish | 179 | 1.2% |
| Scottish | 317 | 2.1% |
| South American | 4 | 0.0% |
| Spaniard | 4 | 0.0% |
| Subsaharan African | 21 | 0.1% |
| Swedish | 16 | 0.1% |
| Swiss | 11 | 0.1% |
| Turkish | 155 | 1.0% |
| Welsh | 33 | 0.2% | View All 37 Rows |
Immigrants in Cleburne County
The most numerous immigrant groups reported in Cleburne County came from Latin America (93 | 0.6%), Central America (76 | 0.5%), Mexico (71 | 0.5%), Europe (69 | 0.5%), and Africa (40 | 0.3%), together accounting for 2.3% of all Cleburne County residents.

| Immigration Origin | # Population | % Population |
| Africa | 40 | 0.3% |
| Asia | 1 | 0.0% |
| Brazil | 13 | 0.1% |
| Canada | 8 | 0.1% |
| Central America | 76 | 0.5% |
| China | 1 | 0.0% |
| Eastern Asia | 1 | 0.0% |
| Eastern Europe | 12 | 0.1% |
| Ecuador | 4 | 0.0% |
| England | 22 | 0.2% |
| Europe | 69 | 0.5% |
| Germany | 33 | 0.2% |
| Guatemala | 5 | 0.0% |
| Latin America | 93 | 0.6% |
| Mexico | 71 | 0.5% |
| Netherlands | 2 | 0.0% |
| Northern Europe | 22 | 0.2% |
| Russia | 12 | 0.1% |
| South Africa | 40 | 0.3% |
| South America | 17 | 0.1% |
| Western Europe | 35 | 0.2% | View All 21 Rows |
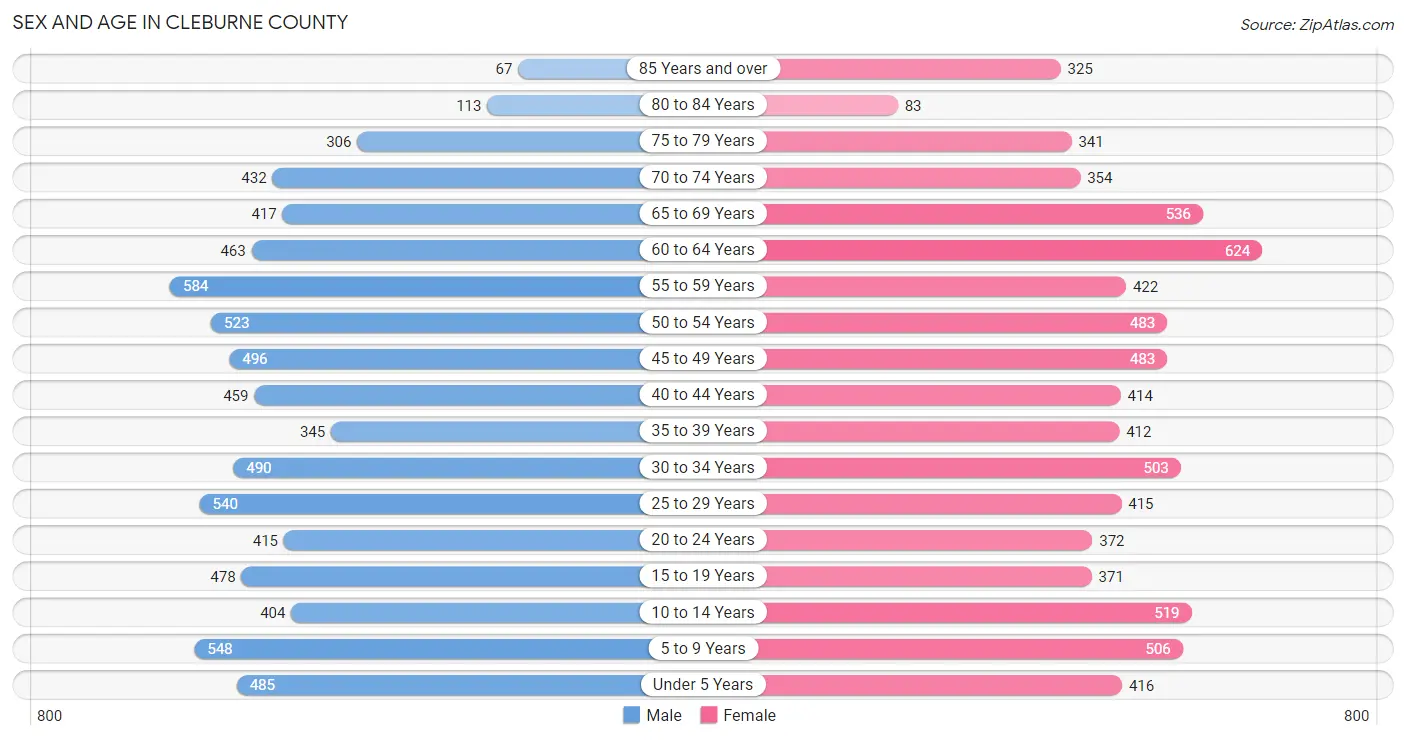
Sex and Age in Cleburne County
Sex and Age in Cleburne County
The most populous age groups in Cleburne County are 55 to 59 Years (584 | 7.7%) for men and 60 to 64 Years (624 | 8.2%) for women.
| Age Bracket | Male | Female |
| Under 5 Years | 485 (6.4%) | 416 (5.5%) |
| 5 to 9 Years | 548 (7.2%) | 506 (6.7%) |
| 10 to 14 Years | 404 (5.3%) | 519 (6.9%) |
| 15 to 19 Years | 478 (6.3%) | 371 (4.9%) |
| 20 to 24 Years | 415 (5.5%) | 372 (4.9%) |
| 25 to 29 Years | 540 (7.1%) | 415 (5.5%) |
| 30 to 34 Years | 490 (6.5%) | 503 (6.6%) |
| 35 to 39 Years | 345 (4.6%) | 412 (5.4%) |
| 40 to 44 Years | 459 (6.1%) | 414 (5.5%) |
| 45 to 49 Years | 496 (6.6%) | 483 (6.4%) |
| 50 to 54 Years | 523 (6.9%) | 483 (6.4%) |
| 55 to 59 Years | 584 (7.7%) | 422 (5.6%) |
| 60 to 64 Years | 463 (6.1%) | 624 (8.2%) |
| 65 to 69 Years | 417 (5.5%) | 536 (7.1%) |
| 70 to 74 Years | 432 (5.7%) | 354 (4.7%) |
| 75 to 79 Years | 306 (4.0%) | 341 (4.5%) |
| 80 to 84 Years | 113 (1.5%) | 83 (1.1%) |
| 85 Years and over | 67 (0.9%) | 325 (4.3%) |
| Total | 7,565 (100.0%) | 7,579 (100.0%) |
Families and Households in Cleburne County
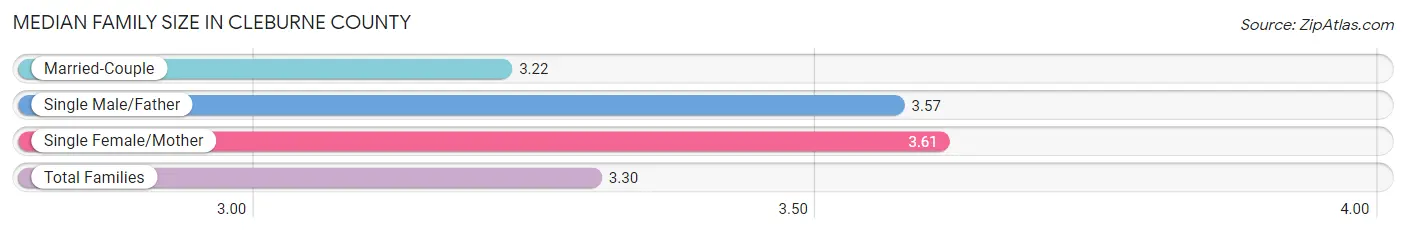
Median Family Size in Cleburne County
The median family size in Cleburne County is 3.30 persons per family, with single female/mother families (627 | 16.4%) accounting for the largest median family size of 3.61 persons per family. On the other hand, married-couple families (2,986 | 77.9%) represent the smallest median family size with 3.22 persons per family.
| Family Type | # Families | Family Size |
| Married-Couple | 2,986 (77.9%) | 3.22 |
| Single Male/Father | 221 (5.8%) | 3.57 |
| Single Female/Mother | 627 (16.4%) | 3.61 |
| Total Families | 3,834 (100.0%) | 3.30 |
Median Household Size in Cleburne County
The median household size in Cleburne County is 2.60 persons per household, with single male/father households (221 | 3.8%) accounting for the largest median household size of 3.88 persons per household. non-family households (1,927 | 33.5%) represent the smallest median household size with 1.09 persons per household.

| Household Type | # Households | Household Size |
| Married-Couple | 2,986 (51.8%) | 3.24 |
| Single Male/Father | 221 (3.8%) | 3.88 |
| Single Female/Mother | 627 (10.9%) | 3.73 |
| Non-family | 1,927 (33.5%) | 1.09 |
| Total Households | 5,761 (100.0%) | 2.60 |
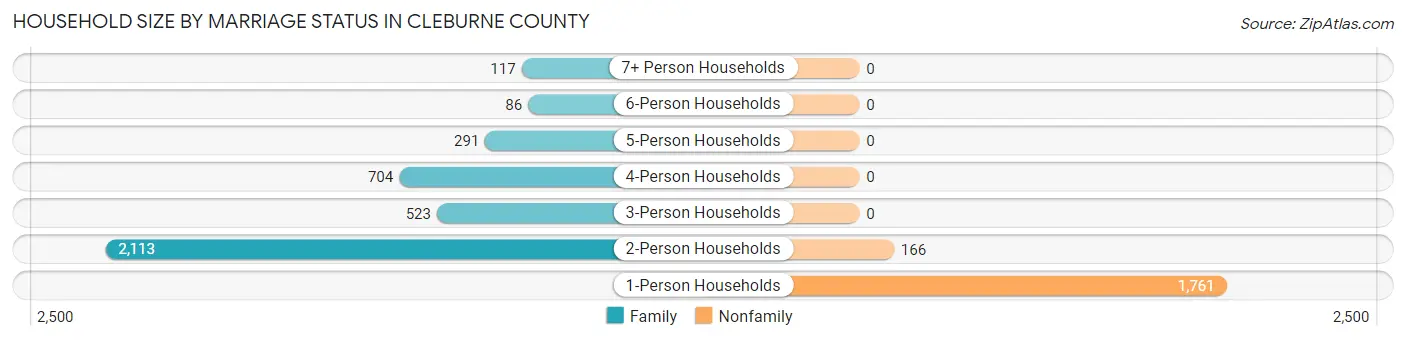
Household Size by Marriage Status in Cleburne County
Out of a total of 5,761 households in Cleburne County, 3,834 (66.5%) are family households, while 1,927 (33.5%) are nonfamily households. The most numerous type of family households are 2-person households, comprising 2,113, and the most common type of nonfamily households are 1-person households, comprising 1,761.
| Household Size | Family Households | Nonfamily Households |
| 1-Person Households | - | 1,761 (30.6%) |
| 2-Person Households | 2,113 (36.7%) | 166 (2.9%) |
| 3-Person Households | 523 (9.1%) | 0 (0.0%) |
| 4-Person Households | 704 (12.2%) | 0 (0.0%) |
| 5-Person Households | 291 (5.1%) | 0 (0.0%) |
| 6-Person Households | 86 (1.5%) | 0 (0.0%) |
| 7+ Person Households | 117 (2.0%) | 0 (0.0%) |
| Total | 3,834 (66.5%) | 1,927 (33.5%) |
Female Fertility in Cleburne County
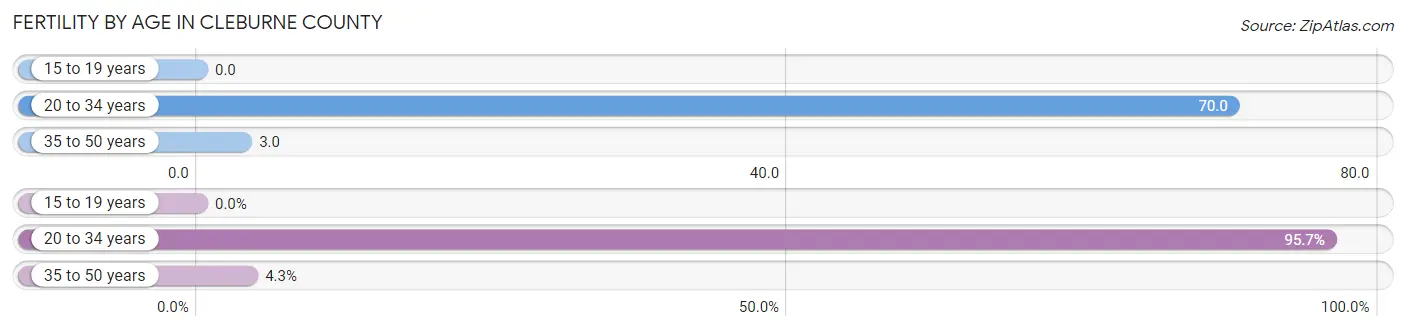
Fertility by Age in Cleburne County
Average fertility rate in Cleburne County is 31.0 births per 1,000 women. Women in the age bracket of 20 to 34 years have the highest fertility rate with 70.0 births per 1,000 women. Women in the age bracket of 20 to 34 years acount for 95.7% of all women with births.
| Age Bracket | Women with Births | Births / 1,000 Women |
| 15 to 19 years | 0 (0.0%) | 0.0 |
| 20 to 34 years | 90 (95.7%) | 70.0 |
| 35 to 50 years | 4 (4.3%) | 3.0 |
| Total | 94 (100.0%) | 31.0 |
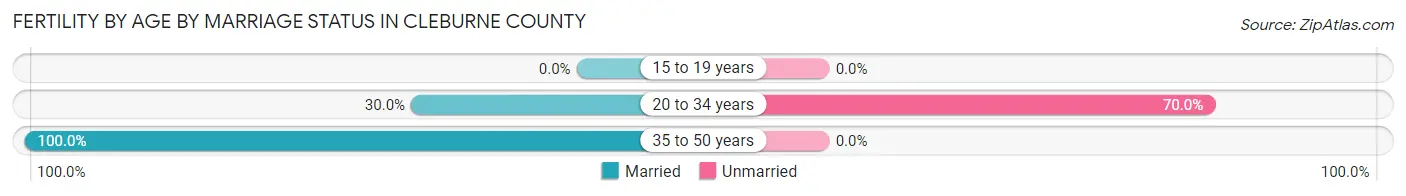
Fertility by Age by Marriage Status in Cleburne County
33.0% of women with births (94) in Cleburne County are married. The highest percentage of unmarried women with births falls into 20 to 34 years age bracket with 70.0% of them unmarried at the time of birth, while the lowest percentage of unmarried women with births belong to 35 to 50 years age bracket with 0.0% of them unmarried.
| Age Bracket | Married | Unmarried |
| 15 to 19 years | 0 (0.0%) | 0 (0.0%) |
| 20 to 34 years | 27 (30.0%) | 63 (70.0%) |
| 35 to 50 years | 4 (100.0%) | 0 (0.0%) |
| Total | 31 (33.0%) | 63 (67.0%) |
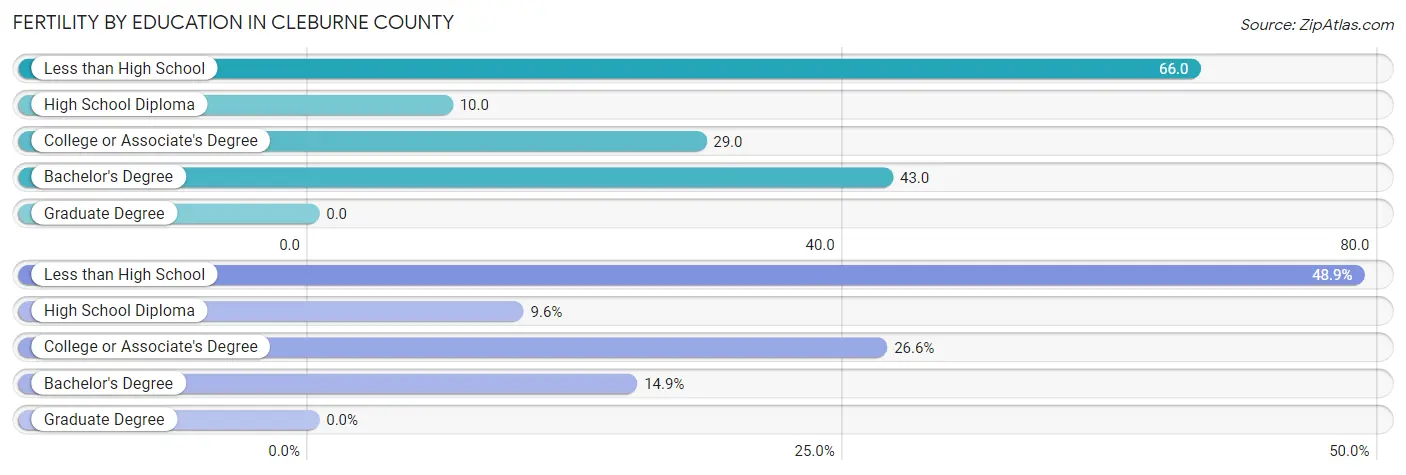
Fertility by Education in Cleburne County
| Educational Attainment | Women with Births | Births / 1,000 Women |
| Less than High School | 46 (48.9%) | 66.0 |
| High School Diploma | 9 (9.6%) | 10.0 |
| College or Associate's Degree | 25 (26.6%) | 29.0 |
| Bachelor's Degree | 14 (14.9%) | 43.0 |
| Graduate Degree | 0 (0.0%) | 0.0 |
| Total | 94 (100.0%) | 31.0 |
Fertility by Education by Marriage Status in Cleburne County
67.0% of women with births in Cleburne County are unmarried. Women with the educational attainment of high school diploma are most likely to be married with 100.0% of them married at childbirth, while women with the educational attainment of less than high school are least likely to be married with 95.7% of them unmarried at childbirth.
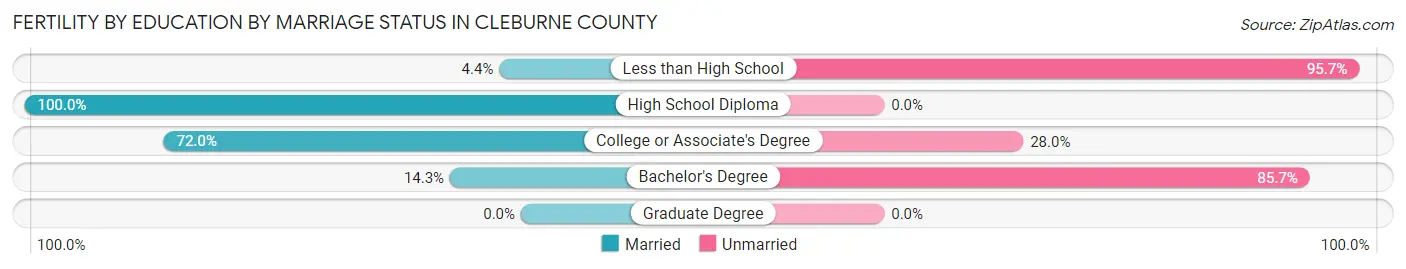
| Educational Attainment | Married | Unmarried |
| Less than High School | 2 (4.3%) | 44 (95.7%) |
| High School Diploma | 9 (100.0%) | 0 (0.0%) |
| College or Associate's Degree | 18 (72.0%) | 7 (28.0%) |
| Bachelor's Degree | 2 (14.3%) | 12 (85.7%) |
| Graduate Degree | 0 (0.0%) | 0 (0.0%) |
| Total | 31 (33.0%) | 63 (67.0%) |
Income in Cleburne County
Income Overview in Cleburne County
Per Capita Income in Cleburne County is $28,598, while median incomes of families and households are $71,833 and $51,553 respectively.
| Characteristic | Number | Measure |
| Per Capita Income | 15,144 | $28,598 |
| Median Family Income | 3,834 | $71,833 |
| Mean Family Income | 3,834 | $90,591 |
| Median Household Income | 5,761 | $51,553 |
| Mean Household Income | 5,761 | $71,645 |
| Income Deficit | 3,834 | $8,204 |
| Wage / Income Gap (%) | 15,144 | 32.28% |
| Wage / Income Gap ($) | 15,144 | 67.72¢ per $1 |
| Gini / Inequality Index | 15,144 | 0.47 |
Earnings by Sex in Cleburne County
Average Earnings in Cleburne County are $37,919, $43,448 for men and $29,424 for women, a difference of 32.3%.
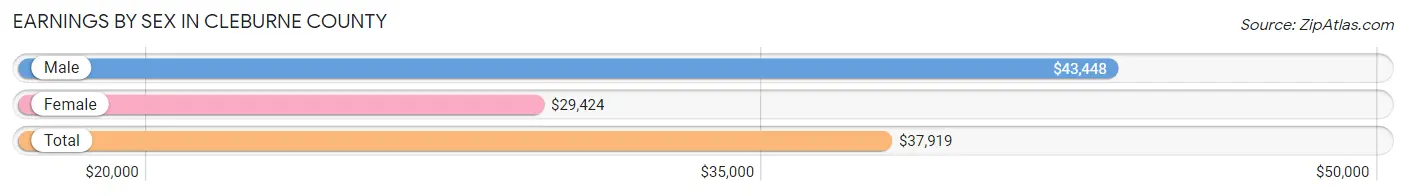
| Sex | Number | Average Earnings |
| Male | 3,697 (58.0%) | $43,448 |
| Female | 2,677 (42.0%) | $29,424 |
| Total | 6,374 (100.0%) | $37,919 |
Earnings by Sex by Income Bracket in Cleburne County
The most common earnings brackets in Cleburne County are $75,000 to $99,999 for men (394 | 10.7%) and $55,000 to $64,999 for women (220 | 8.2%).
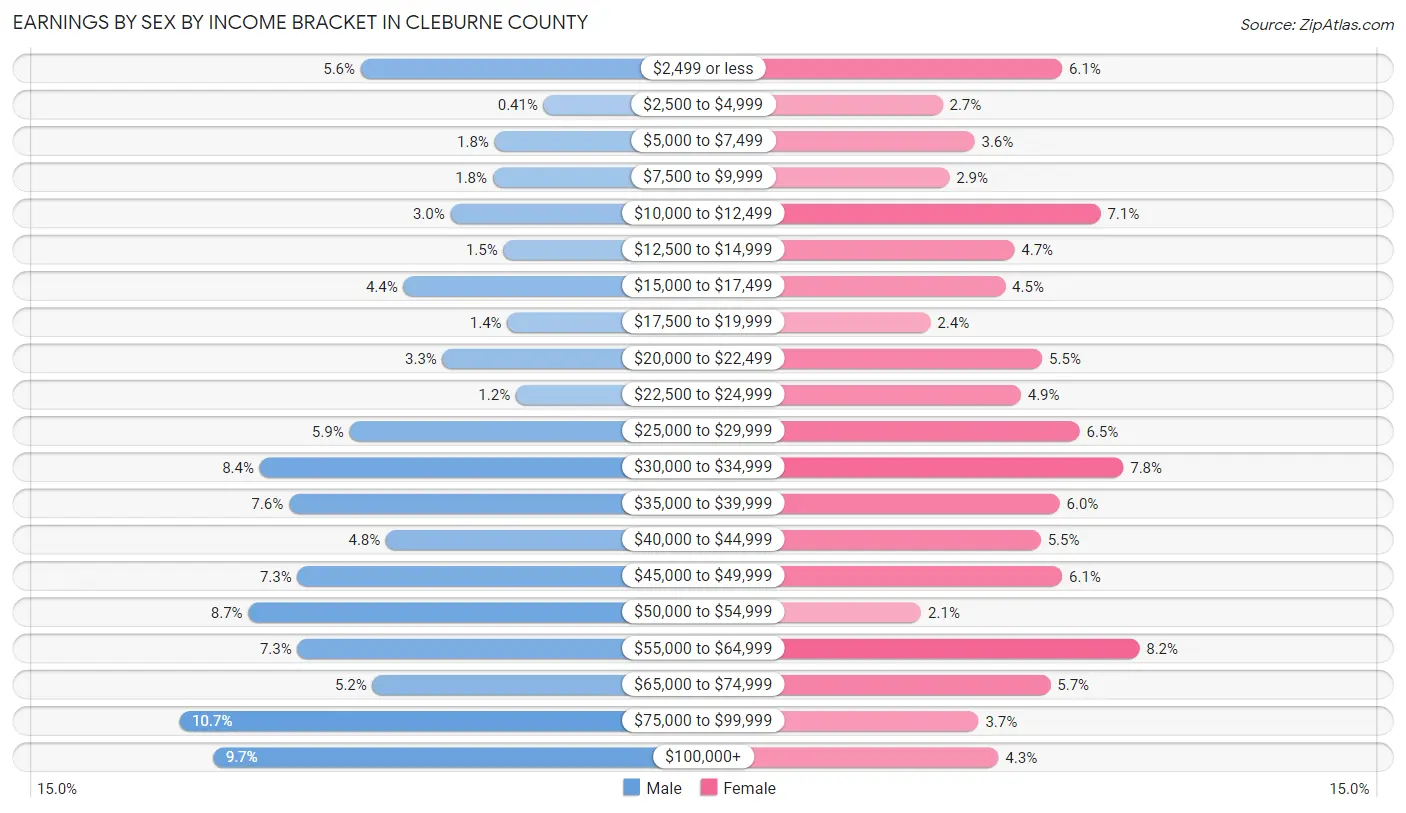
| Income | Male | Female |
| $2,499 or less | 205 (5.6%) | 162 (6.0%) |
| $2,500 to $4,999 | 15 (0.4%) | 72 (2.7%) |
| $5,000 to $7,499 | 66 (1.8%) | 96 (3.6%) |
| $7,500 to $9,999 | 68 (1.8%) | 77 (2.9%) |
| $10,000 to $12,499 | 112 (3.0%) | 191 (7.1%) |
| $12,500 to $14,999 | 57 (1.5%) | 126 (4.7%) |
| $15,000 to $17,499 | 161 (4.3%) | 119 (4.4%) |
| $17,500 to $19,999 | 53 (1.4%) | 63 (2.4%) |
| $20,000 to $22,499 | 120 (3.3%) | 147 (5.5%) |
| $22,500 to $24,999 | 44 (1.2%) | 131 (4.9%) |
| $25,000 to $29,999 | 217 (5.9%) | 175 (6.5%) |
| $30,000 to $34,999 | 310 (8.4%) | 208 (7.8%) |
| $35,000 to $39,999 | 280 (7.6%) | 160 (6.0%) |
| $40,000 to $44,999 | 179 (4.8%) | 146 (5.4%) |
| $45,000 to $49,999 | 271 (7.3%) | 162 (6.0%) |
| $50,000 to $54,999 | 322 (8.7%) | 56 (2.1%) |
| $55,000 to $64,999 | 271 (7.3%) | 220 (8.2%) |
| $65,000 to $74,999 | 193 (5.2%) | 153 (5.7%) |
| $75,000 to $99,999 | 394 (10.7%) | 99 (3.7%) |
| $100,000+ | 359 (9.7%) | 114 (4.3%) |
| Total | 3,697 (100.0%) | 2,677 (100.0%) |
Earnings by Sex by Educational Attainment in Cleburne County
Average earnings in Cleburne County are $48,357 for men and $32,771 for women, a difference of 32.2%. Men with an educational attainment of bachelor's degree enjoy the highest average annual earnings of $58,854, while those with less than high school education earn the least with $34,167. Women with an educational attainment of graduate degree earn the most with the average annual earnings of $59,489, while those with less than high school education have the smallest earnings of $7,286.
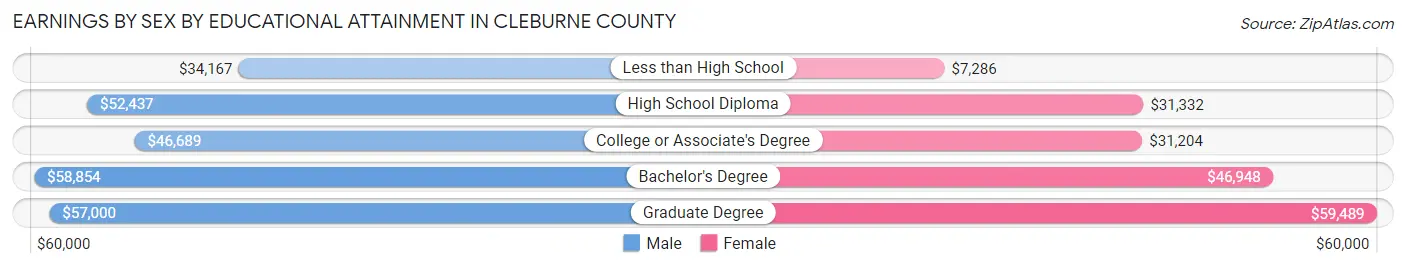
| Educational Attainment | Male Income | Female Income |
| Less than High School | $34,167 | $7,286 |
| High School Diploma | $52,437 | $31,332 |
| College or Associate's Degree | $46,689 | $31,204 |
| Bachelor's Degree | $58,854 | $46,948 |
| Graduate Degree | $57,000 | $59,489 |
| Total | $48,357 | $32,771 |
Family Income in Cleburne County
Family Income Brackets in Cleburne County
According to the Cleburne County family income data, there are 878 families falling into the $50,000 to $74,999 income range, which is the most common income bracket and makes up 22.9% of all families. Conversely, the $10,000 to $14,999 income bracket is the least frequent group with only 23 families (0.6%) belonging to this category.

| Income Bracket | # Families | % Families |
| Less than $10,000 | 92 | 2.4% |
| $10,000 to $14,999 | 23 | 0.6% |
| $15,000 to $24,999 | 215 | 5.6% |
| $25,000 to $34,999 | 288 | 7.5% |
| $35,000 to $49,999 | 479 | 12.5% |
| $50,000 to $74,999 | 878 | 22.9% |
| $75,000 to $99,999 | 794 | 20.7% |
| $100,000 to $149,999 | 717 | 18.7% |
| $150,000 to $199,999 | 199 | 5.2% |
| $200,000+ | 146 | 3.8% |
Family Income by Famaliy Size in Cleburne County
4-person families (713 | 18.6%) account for the highest median family income in Cleburne County with $92,448 per family, while 2-person families (2,159 | 56.3%) have the highest median income of $30,312 per family member.
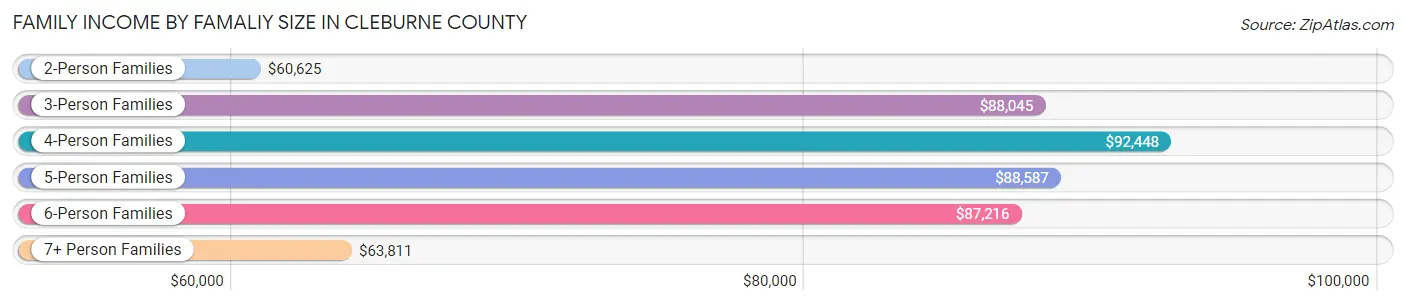
| Income Bracket | # Families | Median Income |
| 2-Person Families | 2,159 (56.3%) | $60,625 |
| 3-Person Families | 506 (13.2%) | $88,045 |
| 4-Person Families | 713 (18.6%) | $92,448 |
| 5-Person Families | 266 (6.9%) | $88,587 |
| 6-Person Families | 73 (1.9%) | $87,216 |
| 7+ Person Families | 117 (3.0%) | $63,811 |
| Total | 3,834 (100.0%) | $71,833 |
Family Income by Number of Earners in Cleburne County
The median family income in Cleburne County is $71,833, with families comprising 3+ earners (279) having the highest median family income of $106,964, while families with no earners (897) have the lowest median family income of $48,942, accounting for 7.3% and 23.4% of families, respectively.
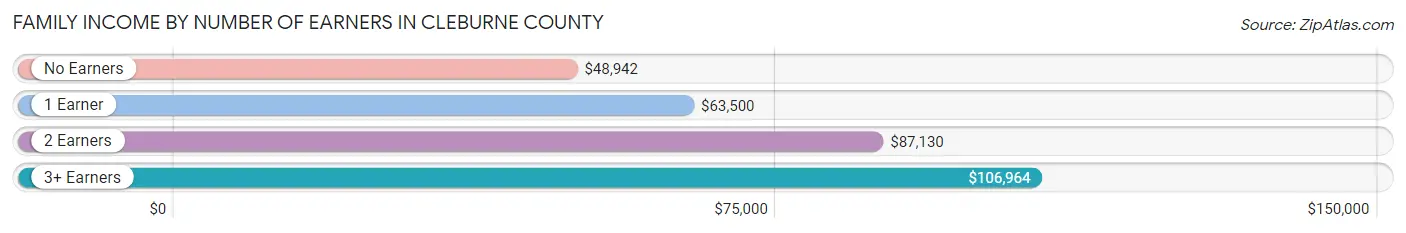
| Number of Earners | # Families | Median Income |
| No Earners | 897 (23.4%) | $48,942 |
| 1 Earner | 1,334 (34.8%) | $63,500 |
| 2 Earners | 1,324 (34.5%) | $87,130 |
| 3+ Earners | 279 (7.3%) | $106,964 |
| Total | 3,834 (100.0%) | $71,833 |
Household Income in Cleburne County
Household Income Brackets in Cleburne County
With 985 households falling in the category, the $50,000 to $74,999 income range is the most frequent in Cleburne County, accounting for 17.1% of all households. In contrast, only 150 households (2.6%) fall into the $200,000+ income bracket, making it the least populous group.
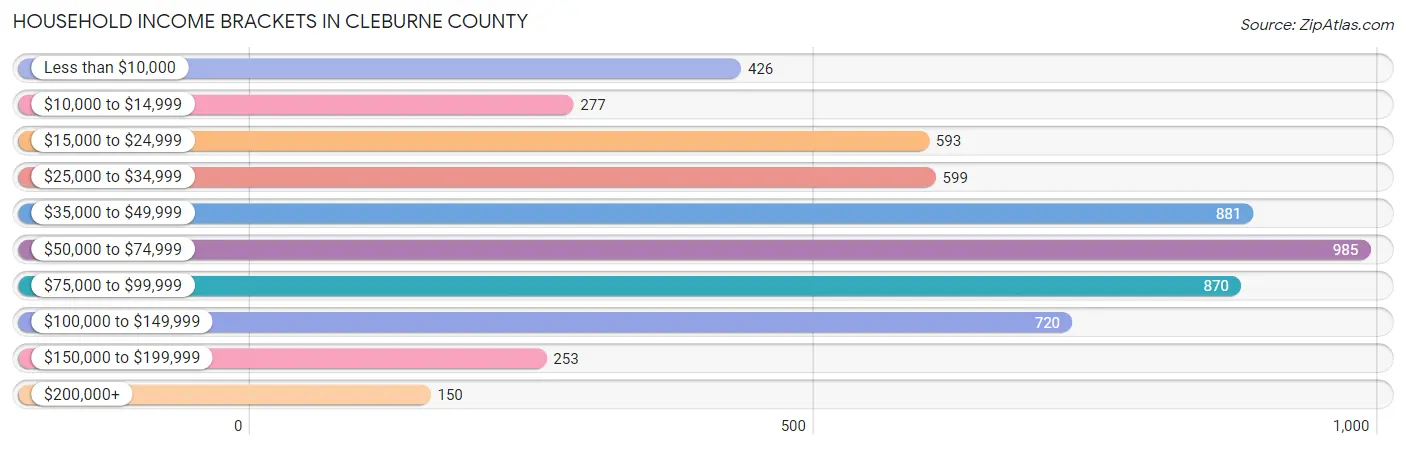
| Income Bracket | # Households | % Households |
| Less than $10,000 | 426 | 7.4% |
| $10,000 to $14,999 | 277 | 4.8% |
| $15,000 to $24,999 | 593 | 10.3% |
| $25,000 to $34,999 | 599 | 10.4% |
| $35,000 to $49,999 | 881 | 15.3% |
| $50,000 to $74,999 | 985 | 17.1% |
| $75,000 to $99,999 | 870 | 15.1% |
| $100,000 to $149,999 | 720 | 12.5% |
| $150,000 to $199,999 | 253 | 4.4% |
| $200,000+ | 150 | 2.6% |
Household Income by Householder Age in Cleburne County
The median household income in Cleburne County is $51,553, with the highest median household income of $82,886 found in the 45 to 64 years age bracket for the primary householder. A total of 2,063 households (35.8%) fall into this category. Meanwhile, the 65+ years age bracket for the primary householder has the lowest median household income of $40,008, with 2,089 households (36.3%) in this group.
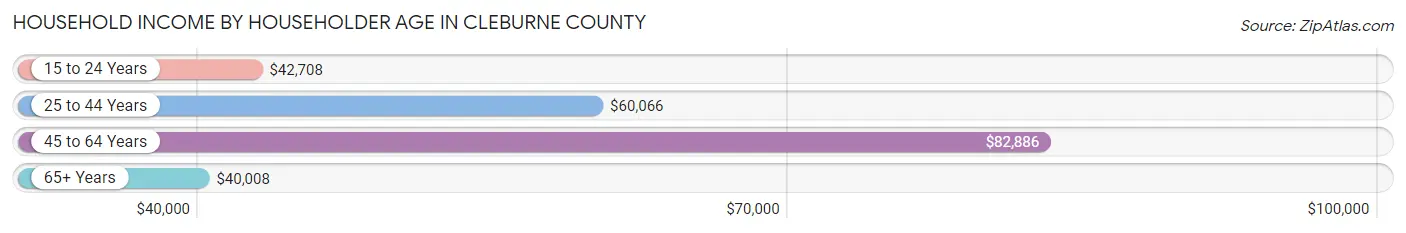
| Income Bracket | # Households | Median Income |
| 15 to 24 Years | 147 (2.5%) | $42,708 |
| 25 to 44 Years | 1,462 (25.4%) | $60,066 |
| 45 to 64 Years | 2,063 (35.8%) | $82,886 |
| 65+ Years | 2,089 (36.3%) | $40,008 |
| Total | 5,761 (100.0%) | $51,553 |
Poverty in Cleburne County
Income Below Poverty by Sex and Age in Cleburne County
With 11.3% poverty level for males and 14.5% for females among the residents of Cleburne County, 5 year old males and 15 year old females are the most vulnerable to poverty, with 94 males (69.1%) and 47 females (53.4%) in their respective age groups living below the poverty level.
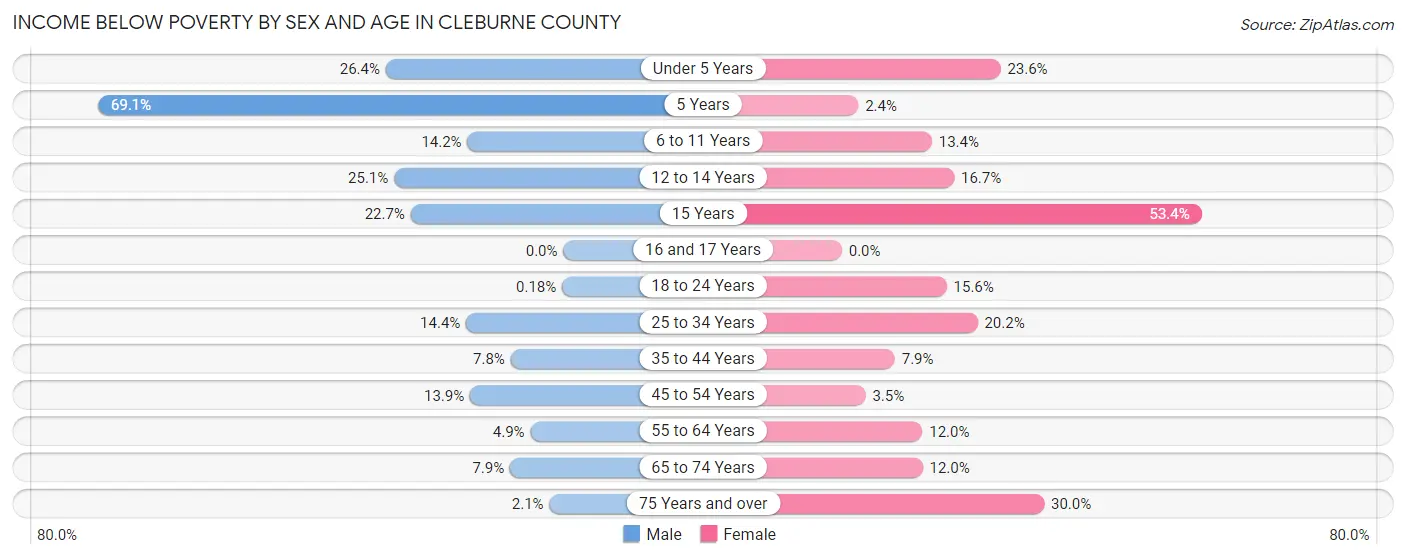
| Age Bracket | Male | Female |
| Under 5 Years | 125 (26.4%) | 98 (23.6%) |
| 5 Years | 94 (69.1%) | 1 (2.4%) |
| 6 to 11 Years | 89 (14.2%) | 89 (13.4%) |
| 12 to 14 Years | 48 (25.1%) | 53 (16.7%) |
| 15 Years | 17 (22.7%) | 47 (53.4%) |
| 16 and 17 Years | 0 (0.0%) | 0 (0.0%) |
| 18 to 24 Years | 1 (0.2%) | 75 (15.6%) |
| 25 to 34 Years | 144 (14.4%) | 185 (20.2%) |
| 35 to 44 Years | 62 (7.8%) | 65 (7.9%) |
| 45 to 54 Years | 140 (13.9%) | 34 (3.5%) |
| 55 to 64 Years | 51 (4.9%) | 124 (12.0%) |
| 65 to 74 Years | 67 (7.9%) | 106 (12.0%) |
| 75 Years and over | 10 (2.1%) | 206 (30.0%) |
| Total | 848 (11.3%) | 1,083 (14.5%) |
Income Above Poverty by Sex and Age in Cleburne County
According to the poverty statistics in Cleburne County, males aged 16 and 17 years and females aged 16 and 17 years are the age groups that are most secure financially, with 100.0% of males and 100.0% of females in these age groups living above the poverty line.
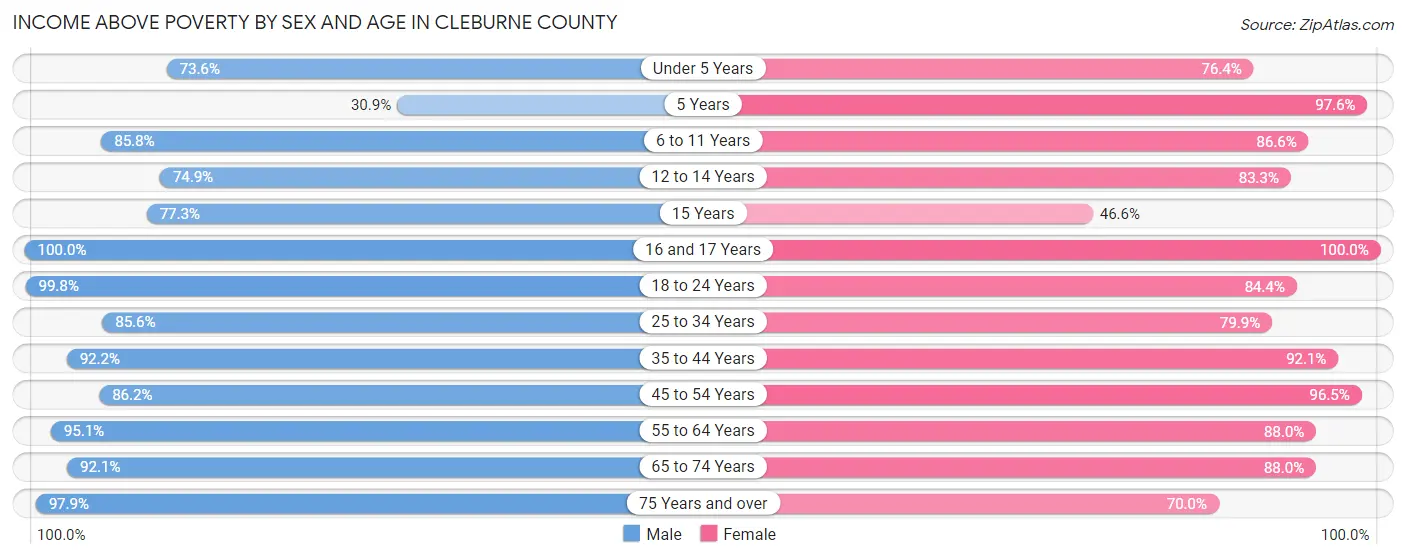
| Age Bracket | Male | Female |
| Under 5 Years | 349 (73.6%) | 318 (76.4%) |
| 5 Years | 42 (30.9%) | 40 (97.6%) |
| 6 to 11 Years | 536 (85.8%) | 577 (86.6%) |
| 12 to 14 Years | 143 (74.9%) | 265 (83.3%) |
| 15 Years | 58 (77.3%) | 41 (46.6%) |
| 16 and 17 Years | 241 (100.0%) | 164 (100.0%) |
| 18 to 24 Years | 567 (99.8%) | 407 (84.4%) |
| 25 to 34 Years | 854 (85.6%) | 733 (79.8%) |
| 35 to 44 Years | 731 (92.2%) | 761 (92.1%) |
| 45 to 54 Years | 871 (86.2%) | 932 (96.5%) |
| 55 to 64 Years | 992 (95.1%) | 913 (88.0%) |
| 65 to 74 Years | 780 (92.1%) | 778 (88.0%) |
| 75 Years and over | 474 (97.9%) | 480 (70.0%) |
| Total | 6,638 (88.7%) | 6,409 (85.5%) |
Income Below Poverty Among Married-Couple Families in Cleburne County
The poverty statistics for married-couple families in Cleburne County show that 2.0% or 61 of the total 2,986 families live below the poverty line. Families with 1 or 2 children have the highest poverty rate of 2.2%, comprising of 16 families. On the other hand, families with 5 or more children have the lowest poverty rate of 0.0%, which includes 0 families.
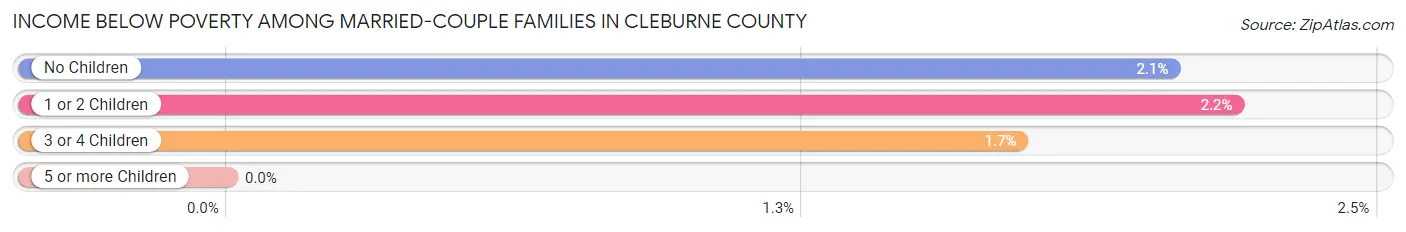
| Children | Above Poverty | Below Poverty |
| No Children | 1,911 (98.0%) | 40 (2.1%) |
| 1 or 2 Children | 713 (97.8%) | 16 (2.2%) |
| 3 or 4 Children | 285 (98.3%) | 5 (1.7%) |
| 5 or more Children | 16 (100.0%) | 0 (0.0%) |
| Total | 2,925 (98.0%) | 61 (2.0%) |
Income Below Poverty Among Single-Parent Households in Cleburne County
According to the poverty data in Cleburne County, 40.3% or 89 single-father households and 19.6% or 123 single-mother households are living below the poverty line. Among single-father households, those with 3 or 4 children have the highest poverty rate, with 45 households (100.0%) experiencing poverty. Likewise, among single-mother households, those with 3 or 4 children have the highest poverty rate, with 59 households (46.1%) falling below the poverty line.

| Children | Single Father | Single Mother |
| No Children | 1 (1.0%) | 19 (6.5%) |
| 1 or 2 Children | 43 (55.1%) | 45 (21.8%) |
| 3 or 4 Children | 45 (100.0%) | 59 (46.1%) |
| 5 or more Children | 0 (0.0%) | 0 (0.0%) |
| Total | 89 (40.3%) | 123 (19.6%) |
Income Below Poverty Among Married-Couple vs Single-Parent Households in Cleburne County
The poverty data for Cleburne County shows that 61 of the married-couple family households (2.0%) and 212 of the single-parent households (25.0%) are living below the poverty level. Within the married-couple family households, those with 1 or 2 children have the highest poverty rate, with 16 households (2.2%) falling below the poverty line. Among the single-parent households, those with 3 or 4 children have the highest poverty rate, with 104 household (60.1%) living below poverty.
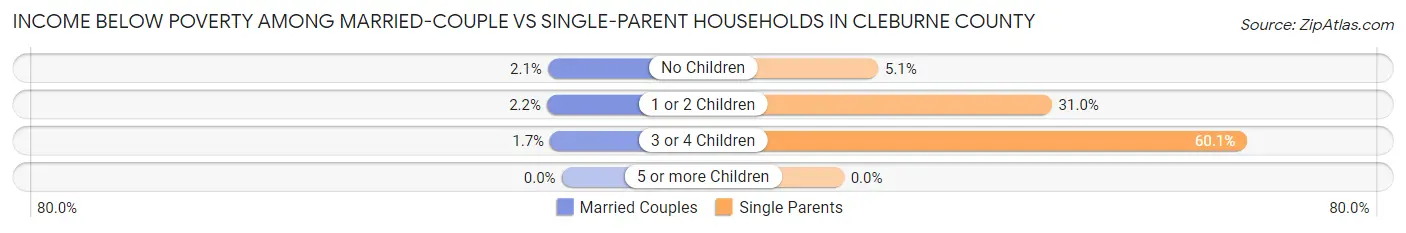
| Children | Married-Couple Families | Single-Parent Households |
| No Children | 40 (2.1%) | 20 (5.1%) |
| 1 or 2 Children | 16 (2.2%) | 88 (31.0%) |
| 3 or 4 Children | 5 (1.7%) | 104 (60.1%) |
| 5 or more Children | 0 (0.0%) | 0 (0.0%) |
| Total | 61 (2.0%) | 212 (25.0%) |
Employment Characteristics in Cleburne County
Employment by Class of Employer in Cleburne County
Among the 5,593 employed individuals in Cleburne County, private company employees (4,059 | 72.6%), local government employees (520 | 9.3%), and self-employed (not incorporated) (275 | 4.9%) make up the most common classes of employment.

| Employer Class | # Employees | % Employees |
| Private Company Employees | 4,059 | 72.6% |
| Self-Employed (Incorporated) | 248 | 4.4% |
| Self-Employed (Not Incorporated) | 275 | 4.9% |
| Not-for-profit Organizations | 234 | 4.2% |
| Local Government Employees | 520 | 9.3% |
| State Government Employees | 168 | 3.0% |
| Federal Government Employees | 80 | 1.4% |
| Unpaid Family Workers | 9 | 0.2% |
| Total | 5,593 | 100.0% |
Employment Status by Age in Cleburne County
According to the labor force statistics for Cleburne County, out of the total population over 16 years of age (12,103), 48.3% or 5,846 individuals are in the labor force, with 2.6% or 152 of them unemployed. The age group with the highest labor force participation rate is 35 to 44 years, with 77.7% or 1,267 individuals in the labor force. Within the labor force, the 16 to 19 years age range has the highest percentage of unemployed individuals, with 16.2% or 33 of them being unemployed.
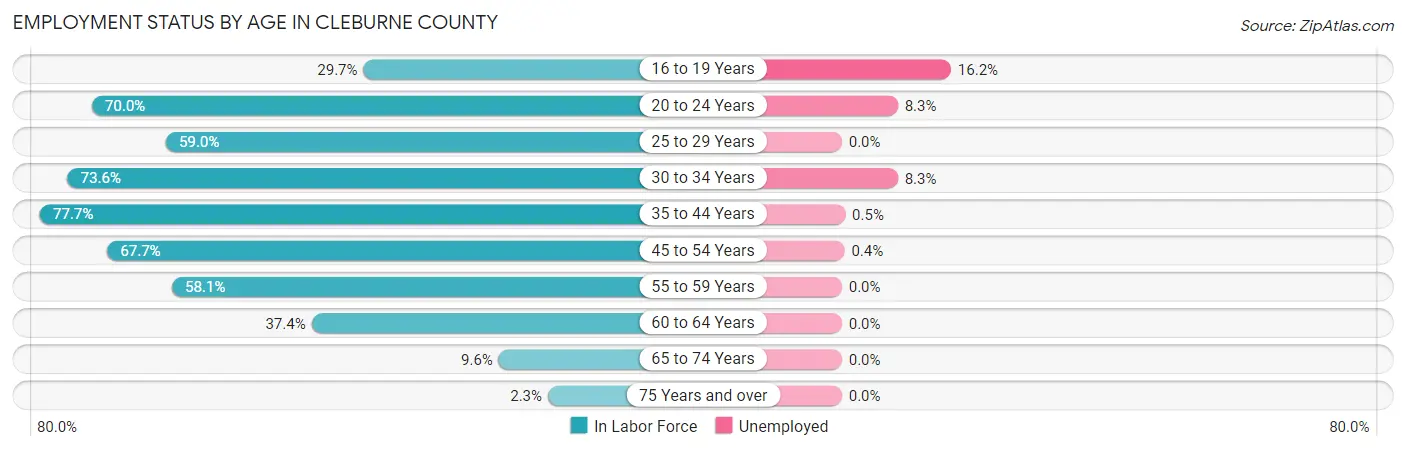
| Age Bracket | In Labor Force | Unemployed |
| 16 to 19 Years | 204 (29.7%) | 33 (16.2%) |
| 20 to 24 Years | 551 (70.0%) | 46 (8.3%) |
| 25 to 29 Years | 563 (59.0%) | 0 (0.0%) |
| 30 to 34 Years | 731 (73.6%) | 61 (8.3%) |
| 35 to 44 Years | 1,267 (77.7%) | 6 (0.5%) |
| 45 to 54 Years | 1,344 (67.7%) | 5 (0.4%) |
| 55 to 59 Years | 584 (58.1%) | 0 (0.0%) |
| 60 to 64 Years | 407 (37.4%) | 0 (0.0%) |
| 65 to 74 Years | 167 (9.6%) | 0 (0.0%) |
| 75 Years and over | 28 (2.3%) | 0 (0.0%) |
| Total | 5,846 (48.3%) | 152 (2.6%) |
Employment Status by Educational Attainment in Cleburne County
According to labor force statistics for Cleburne County, 63.9% of individuals (4,892) out of the total population between 25 and 64 years of age (7,656) are in the labor force, with 1.5% or 73 of them being unemployed. The group with the highest labor force participation rate are those with the educational attainment of bachelor's degree or higher, with 72.5% or 982 individuals in the labor force. Within the labor force, individuals with college / associate degree education have the highest percentage of unemployment, with 2.2% or 30 of them being unemployed.
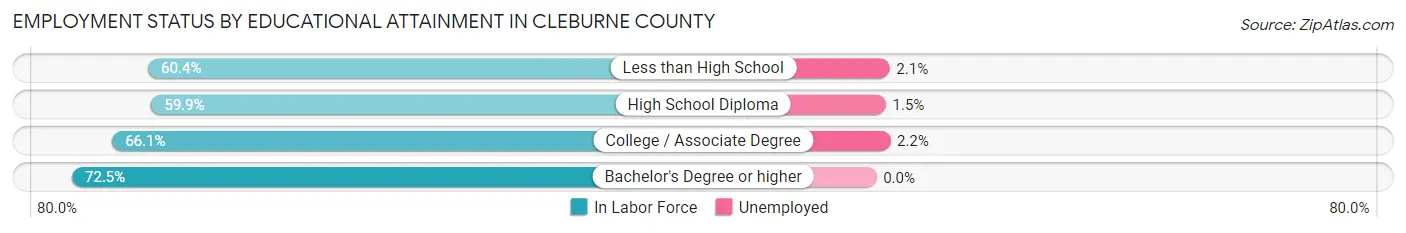
| Educational Attainment | In Labor Force | Unemployed |
| Less than High School | 770 (60.4%) | 27 (2.1%) |
| High School Diploma | 1,756 (59.9%) | 44 (1.5%) |
| College / Associate Degree | 1,384 (66.1%) | 46 (2.2%) |
| Bachelor's Degree or higher | 982 (72.5%) | 0 (0.0%) |
| Total | 4,892 (63.9%) | 115 (1.5%) |
Employment Occupations by Sex in Cleburne County
Management, Business, Science and Arts Occupations
The most common Management, Business, Science and Arts occupations in Cleburne County are Management (457 | 8.0%), Health Diagnosing & Treating (413 | 7.3%), Community & Social Service (369 | 6.5%), Education Instruction & Library (294 | 5.2%), and Health Technologists (259 | 4.5%).

Management, Business, Science and Arts Occupations by Sex
Within the Management, Business, Science and Arts occupations in Cleburne County, the most male-oriented occupations are Architecture & Engineering (75.0%), Management (61.9%), and Life, Physical & Social Science (52.8%), while the most female-oriented occupations are Legal Services & Support (100.0%), Arts, Media & Entertainment (100.0%), and Health Technologists (90.7%).
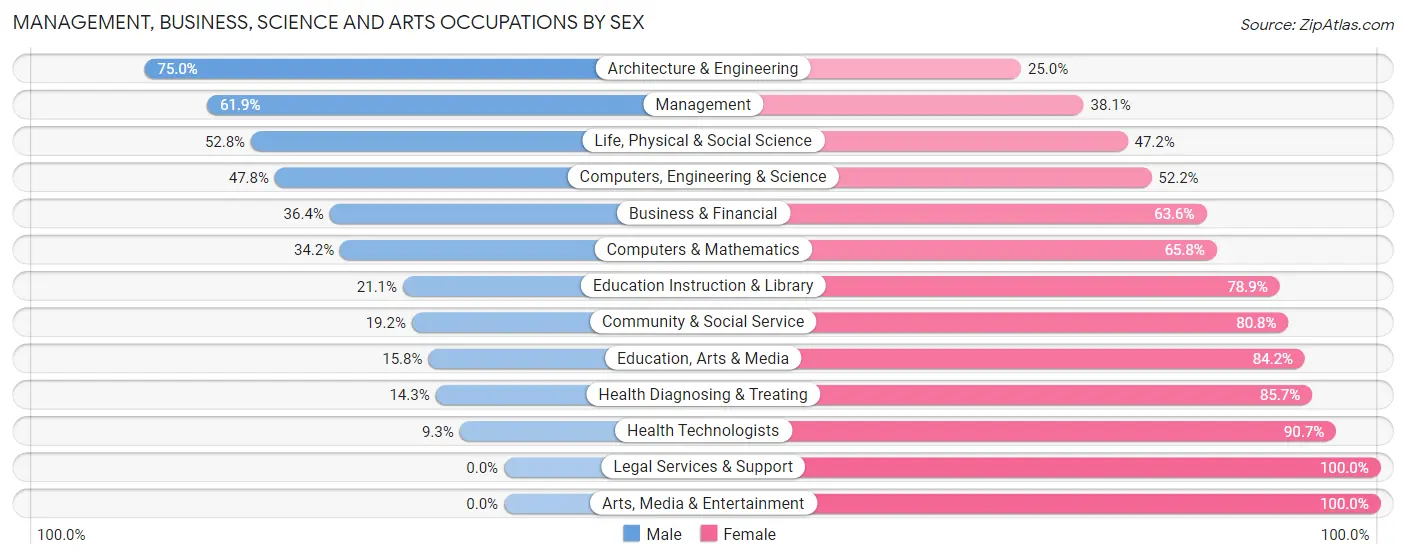
| Occupation | Male | Female |
| Management | 283 (61.9%) | 174 (38.1%) |
| Business & Financial | 68 (36.4%) | 119 (63.6%) |
| Computers, Engineering & Science | 98 (47.8%) | 107 (52.2%) |
| Computers & Mathematics | 40 (34.2%) | 77 (65.8%) |
| Architecture & Engineering | 39 (75.0%) | 13 (25.0%) |
| Life, Physical & Social Science | 19 (52.8%) | 17 (47.2%) |
| Community & Social Service | 71 (19.2%) | 298 (80.8%) |
| Education, Arts & Media | 9 (15.8%) | 48 (84.2%) |
| Legal Services & Support | 0 (0.0%) | 6 (100.0%) |
| Education Instruction & Library | 62 (21.1%) | 232 (78.9%) |
| Arts, Media & Entertainment | 0 (0.0%) | 12 (100.0%) |
| Health Diagnosing & Treating | 59 (14.3%) | 354 (85.7%) |
| Health Technologists | 24 (9.3%) | 235 (90.7%) |
| Total (Category) | 579 (35.5%) | 1,052 (64.5%) |
| Total (Overall) | 3,294 (57.9%) | 2,398 (42.1%) |
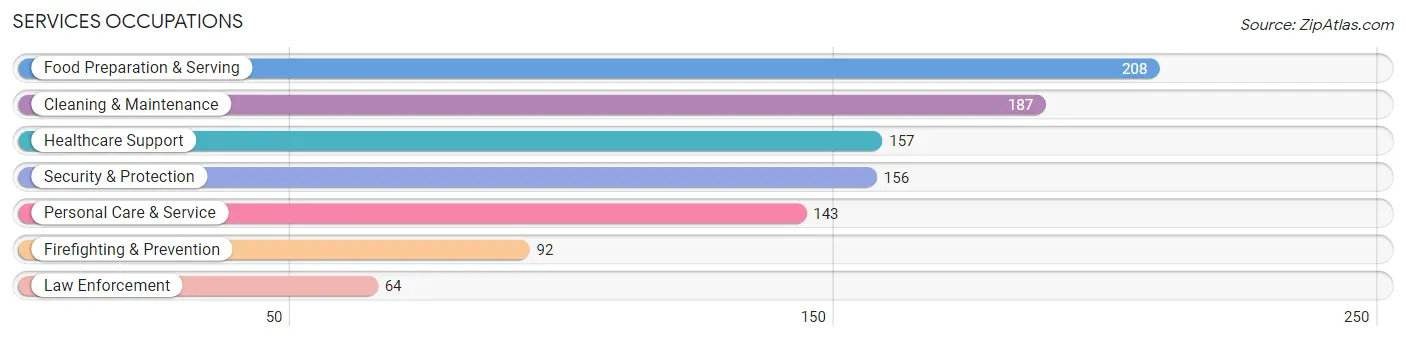
Services Occupations
The most common Services occupations in Cleburne County are Food Preparation & Serving (208 | 3.6%), Cleaning & Maintenance (187 | 3.3%), Healthcare Support (157 | 2.8%), Security & Protection (156 | 2.7%), and Personal Care & Service (143 | 2.5%).
Services Occupations by Sex
Within the Services occupations in Cleburne County, the most male-oriented occupations are Firefighting & Prevention (100.0%), Security & Protection (91.7%), and Law Enforcement (79.7%), while the most female-oriented occupations are Healthcare Support (100.0%), Personal Care & Service (88.8%), and Food Preparation & Serving (45.2%).

| Occupation | Male | Female |
| Healthcare Support | 0 (0.0%) | 157 (100.0%) |
| Security & Protection | 143 (91.7%) | 13 (8.3%) |
| Firefighting & Prevention | 92 (100.0%) | 0 (0.0%) |
| Law Enforcement | 51 (79.7%) | 13 (20.3%) |
| Food Preparation & Serving | 114 (54.8%) | 94 (45.2%) |
| Cleaning & Maintenance | 109 (58.3%) | 78 (41.7%) |
| Personal Care & Service | 16 (11.2%) | 127 (88.8%) |
| Total (Category) | 382 (44.9%) | 469 (55.1%) |
| Total (Overall) | 3,294 (57.9%) | 2,398 (42.1%) |
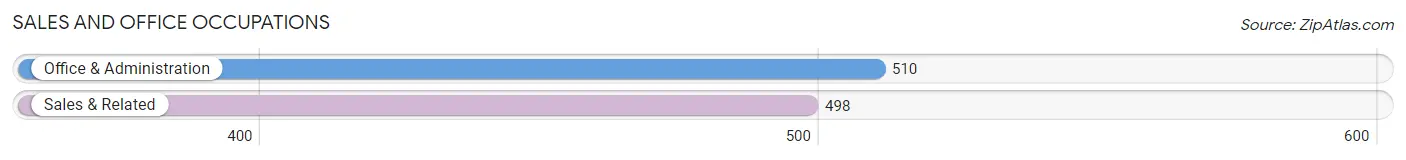
Sales and Office Occupations
The most common Sales and Office occupations in Cleburne County are Office & Administration (510 | 9.0%), and Sales & Related (498 | 8.7%).
Sales and Office Occupations by Sex
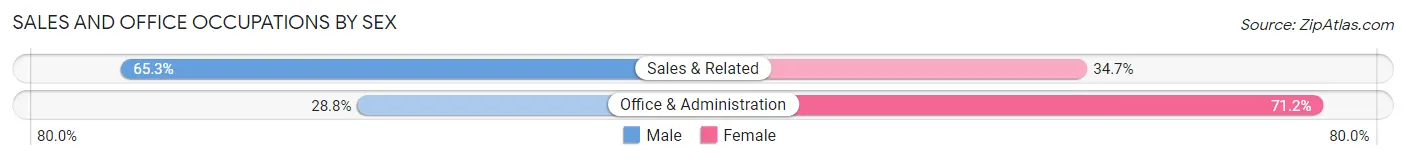
| Occupation | Male | Female |
| Sales & Related | 325 (65.3%) | 173 (34.7%) |
| Office & Administration | 147 (28.8%) | 363 (71.2%) |
| Total (Category) | 472 (46.8%) | 536 (53.2%) |
| Total (Overall) | 3,294 (57.9%) | 2,398 (42.1%) |
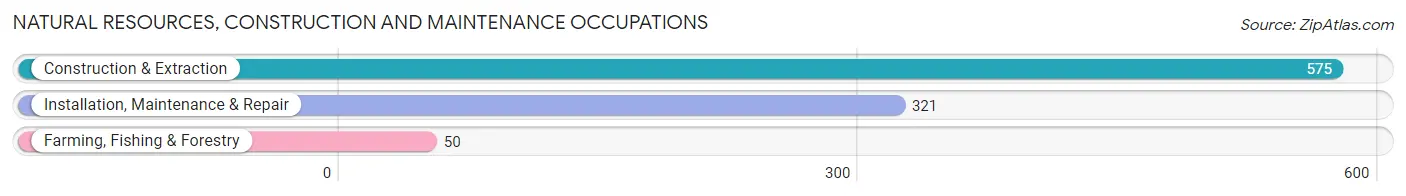
Natural Resources, Construction and Maintenance Occupations
The most common Natural Resources, Construction and Maintenance occupations in Cleburne County are Construction & Extraction (575 | 10.1%), Installation, Maintenance & Repair (321 | 5.6%), and Farming, Fishing & Forestry (50 | 0.9%).
Natural Resources, Construction and Maintenance Occupations by Sex
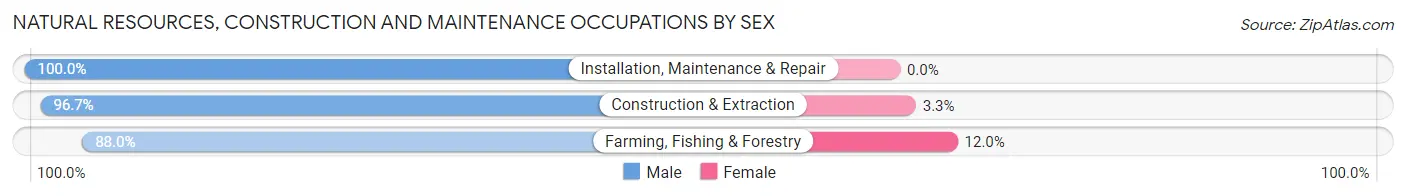
| Occupation | Male | Female |
| Farming, Fishing & Forestry | 44 (88.0%) | 6 (12.0%) |
| Construction & Extraction | 556 (96.7%) | 19 (3.3%) |
| Installation, Maintenance & Repair | 321 (100.0%) | 0 (0.0%) |
| Total (Category) | 921 (97.4%) | 25 (2.6%) |
| Total (Overall) | 3,294 (57.9%) | 2,398 (42.1%) |
Production, Transportation and Moving Occupations
The most common Production, Transportation and Moving occupations in Cleburne County are Production (865 | 15.2%), Transportation (261 | 4.6%), and Material Moving (130 | 2.3%).

Production, Transportation and Moving Occupations by Sex
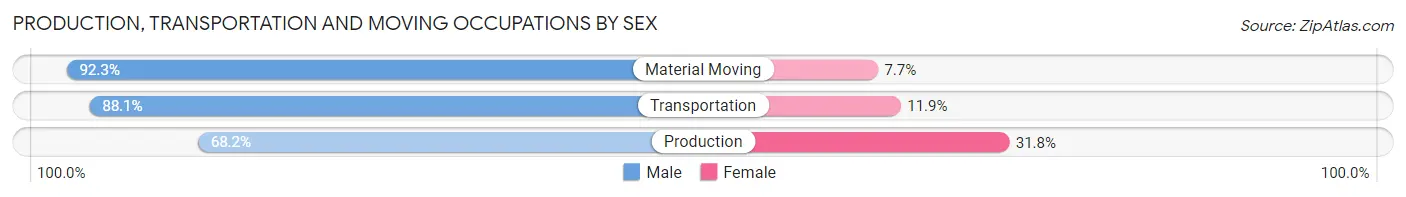
| Occupation | Male | Female |
| Production | 590 (68.2%) | 275 (31.8%) |
| Transportation | 230 (88.1%) | 31 (11.9%) |
| Material Moving | 120 (92.3%) | 10 (7.7%) |
| Total (Category) | 940 (74.8%) | 316 (25.2%) |
| Total (Overall) | 3,294 (57.9%) | 2,398 (42.1%) |
Employment Industries by Sex in Cleburne County
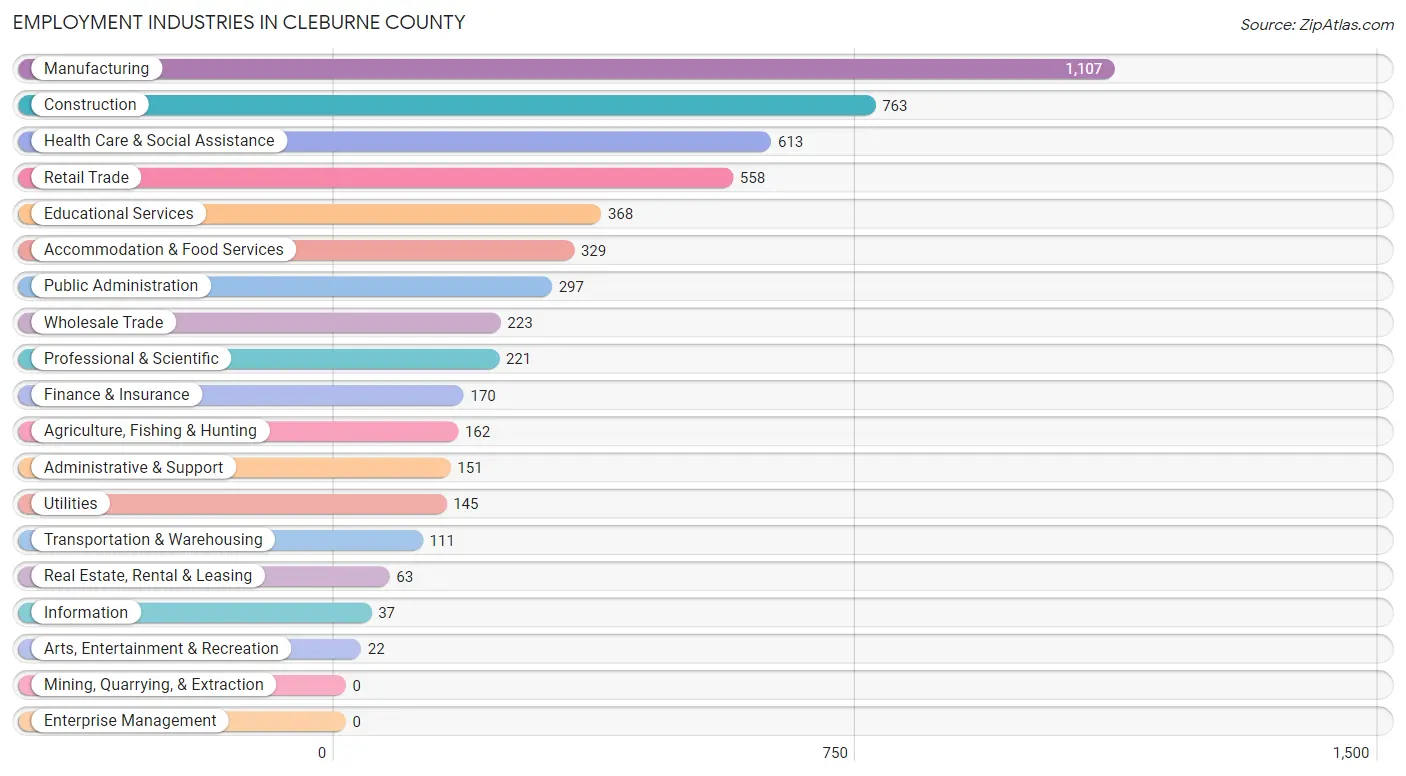
Employment Industries in Cleburne County
The major employment industries in Cleburne County include Manufacturing (1,107 | 19.5%), Construction (763 | 13.4%), Health Care & Social Assistance (613 | 10.8%), Retail Trade (558 | 9.8%), and Educational Services (368 | 6.5%).
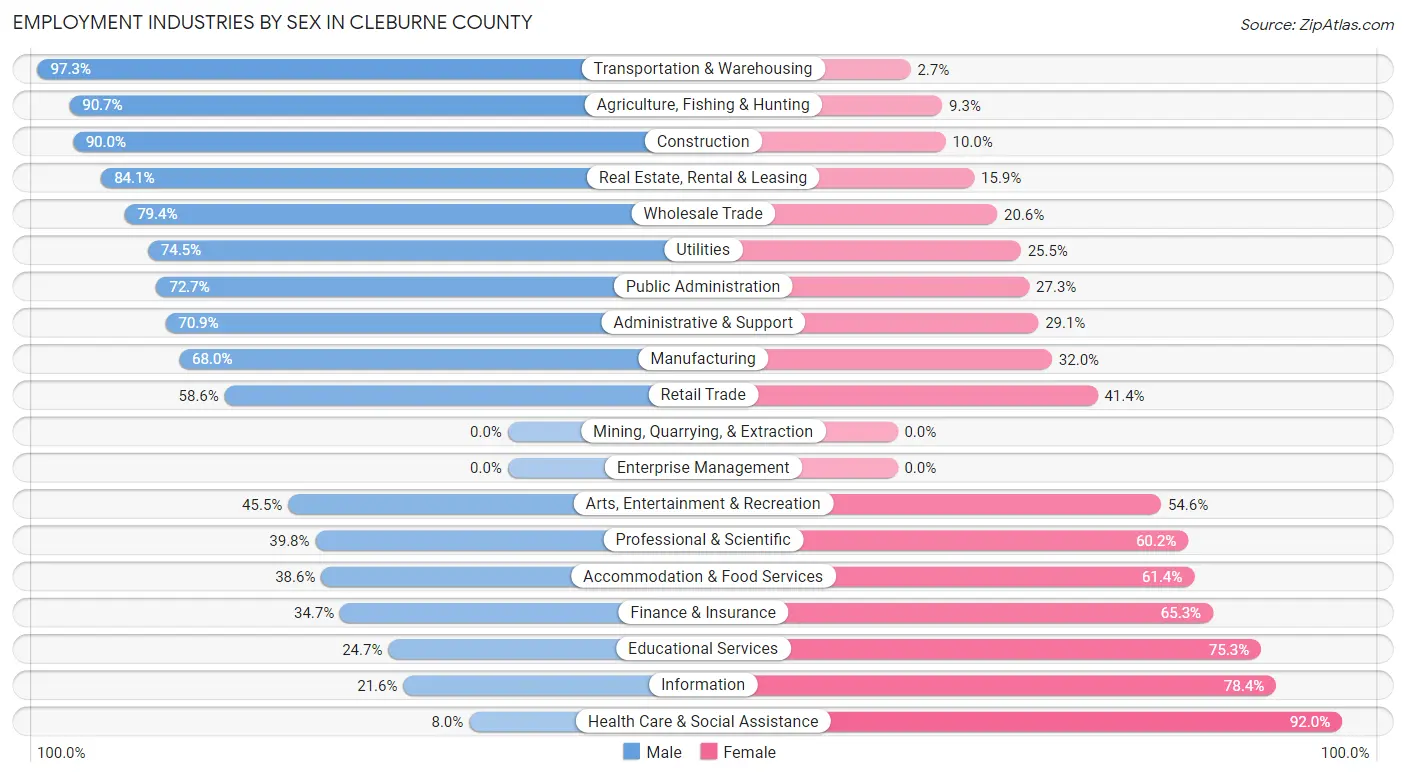
Employment Industries by Sex in Cleburne County
The Cleburne County industries that see more men than women are Transportation & Warehousing (97.3%), Agriculture, Fishing & Hunting (90.7%), and Construction (90.0%), whereas the industries that tend to have a higher number of women are Health Care & Social Assistance (92.0%), Information (78.4%), and Educational Services (75.3%).
| Industry | Male | Female |
| Agriculture, Fishing & Hunting | 147 (90.7%) | 15 (9.3%) |
| Mining, Quarrying, & Extraction | 0 (0.0%) | 0 (0.0%) |
| Construction | 687 (90.0%) | 76 (10.0%) |
| Manufacturing | 753 (68.0%) | 354 (32.0%) |
| Wholesale Trade | 177 (79.4%) | 46 (20.6%) |
| Retail Trade | 327 (58.6%) | 231 (41.4%) |
| Transportation & Warehousing | 108 (97.3%) | 3 (2.7%) |
| Utilities | 108 (74.5%) | 37 (25.5%) |
| Information | 8 (21.6%) | 29 (78.4%) |
| Finance & Insurance | 59 (34.7%) | 111 (65.3%) |
| Real Estate, Rental & Leasing | 53 (84.1%) | 10 (15.9%) |
| Professional & Scientific | 88 (39.8%) | 133 (60.2%) |
| Enterprise Management | 0 (0.0%) | 0 (0.0%) |
| Administrative & Support | 107 (70.9%) | 44 (29.1%) |
| Educational Services | 91 (24.7%) | 277 (75.3%) |
| Health Care & Social Assistance | 49 (8.0%) | 564 (92.0%) |
| Arts, Entertainment & Recreation | 10 (45.5%) | 12 (54.5%) |
| Accommodation & Food Services | 127 (38.6%) | 202 (61.4%) |
| Public Administration | 216 (72.7%) | 81 (27.3%) |
| Total | 3,294 (57.9%) | 2,398 (42.1%) |
Education in Cleburne County
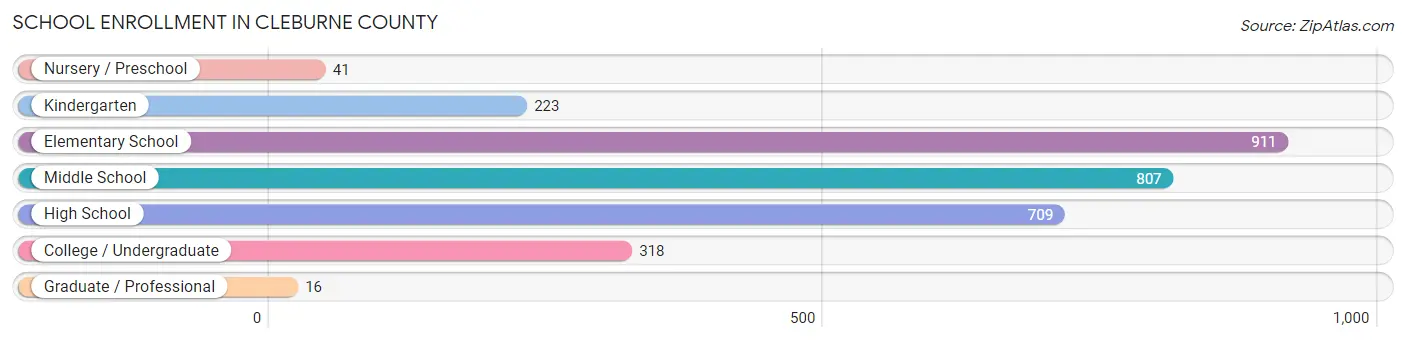
School Enrollment in Cleburne County
The most common levels of schooling among the 3,025 students in Cleburne County are elementary school (911 | 30.1%), middle school (807 | 26.7%), and high school (709 | 23.4%).
| School Level | # Students | % Students |
| Nursery / Preschool | 41 | 1.4% |
| Kindergarten | 223 | 7.4% |
| Elementary School | 911 | 30.1% |
| Middle School | 807 | 26.7% |
| High School | 709 | 23.4% |
| College / Undergraduate | 318 | 10.5% |
| Graduate / Professional | 16 | 0.5% |
| Total | 3,025 | 100.0% |
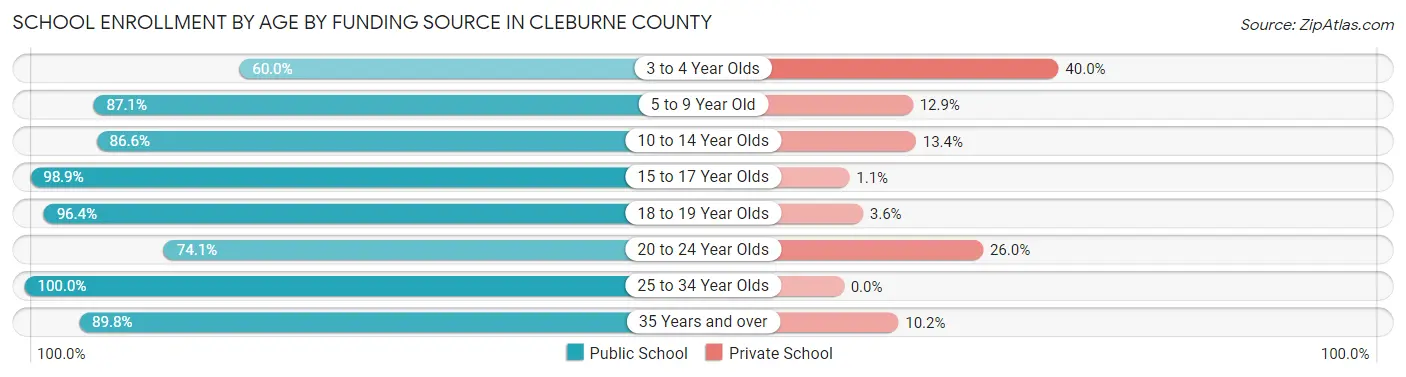
School Enrollment by Age by Funding Source in Cleburne County
Out of a total of 3,025 students who are enrolled in schools in Cleburne County, 339 (11.2%) attend a private institution, while the remaining 2,686 (88.8%) are enrolled in public schools. The age group of 3 to 4 year olds has the highest likelihood of being enrolled in private schools, with 24 (40.0% in the age bracket) enrolled. Conversely, the age group of 25 to 34 year olds has the lowest likelihood of being enrolled in a private school, with 30 (100.0% in the age bracket) attending a public institution.
| Age Bracket | Public School | Private School |
| 3 to 4 Year Olds | 36 (60.0%) | 24 (40.0%) |
| 5 to 9 Year Old | 874 (87.1%) | 129 (12.9%) |
| 10 to 14 Year Olds | 799 (86.6%) | 124 (13.4%) |
| 15 to 17 Year Olds | 562 (98.9%) | 6 (1.1%) |
| 18 to 19 Year Olds | 216 (96.4%) | 8 (3.6%) |
| 20 to 24 Year Olds | 117 (74.1%) | 41 (26.0%) |
| 25 to 34 Year Olds | 30 (100.0%) | 0 (0.0%) |
| 35 Years and over | 53 (89.8%) | 6 (10.2%) |
| Total | 2,686 (88.8%) | 339 (11.2%) |
Educational Attainment by Field of Study in Cleburne County
Business (370 | 20.7%), education (329 | 18.4%), science & technology (274 | 15.4%), arts & humanities (165 | 9.2%), and bio, nature & agricultural (148 | 8.3%) are the most common fields of study among 1,784 individuals in Cleburne County who have obtained a bachelor's degree or higher.
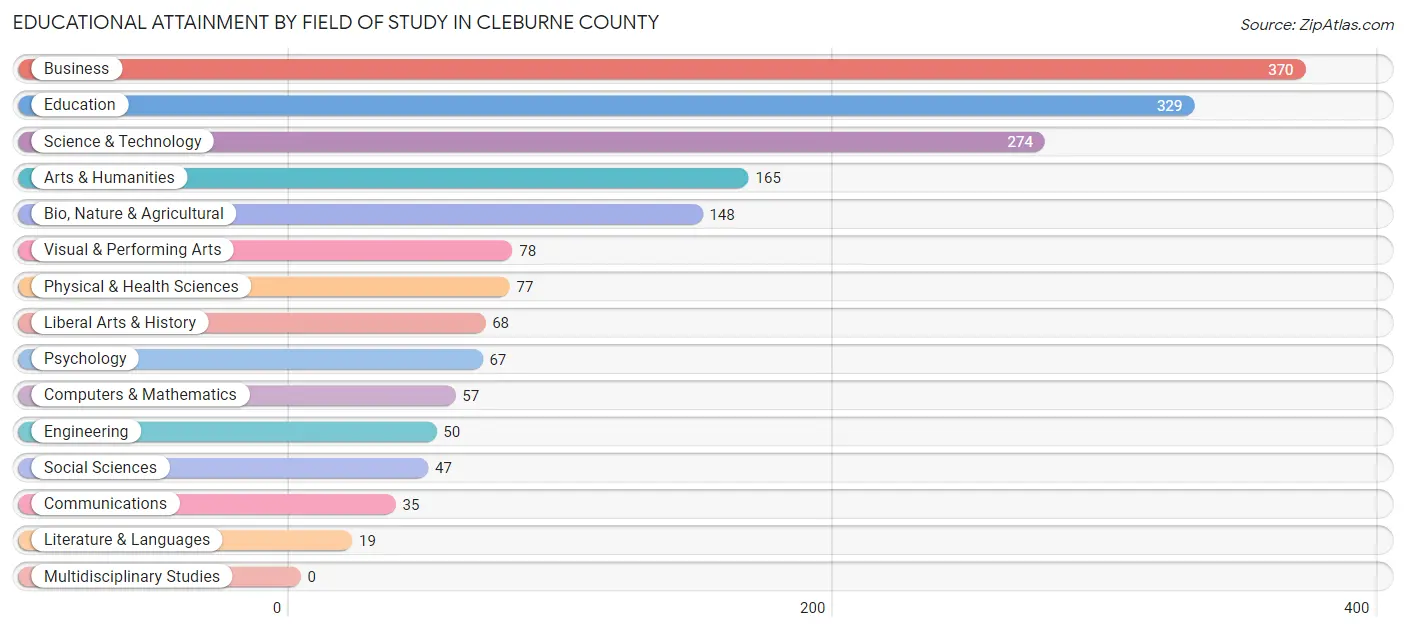
| Field of Study | # Graduates | % Graduates |
| Computers & Mathematics | 57 | 3.2% |
| Bio, Nature & Agricultural | 148 | 8.3% |
| Physical & Health Sciences | 77 | 4.3% |
| Psychology | 67 | 3.8% |
| Social Sciences | 47 | 2.6% |
| Engineering | 50 | 2.8% |
| Multidisciplinary Studies | 0 | 0.0% |
| Science & Technology | 274 | 15.4% |
| Business | 370 | 20.7% |
| Education | 329 | 18.4% |
| Literature & Languages | 19 | 1.1% |
| Liberal Arts & History | 68 | 3.8% |
| Visual & Performing Arts | 78 | 4.4% |
| Communications | 35 | 2.0% |
| Arts & Humanities | 165 | 9.2% |
| Total | 1,784 | 100.0% |
Transportation & Commute in Cleburne County
Vehicle Availability by Sex in Cleburne County
The most prevalent vehicle ownership categories in Cleburne County are males with 3 vehicles (942, accounting for 28.7%) and females with 3 vehicles (570, making up 40.7%).
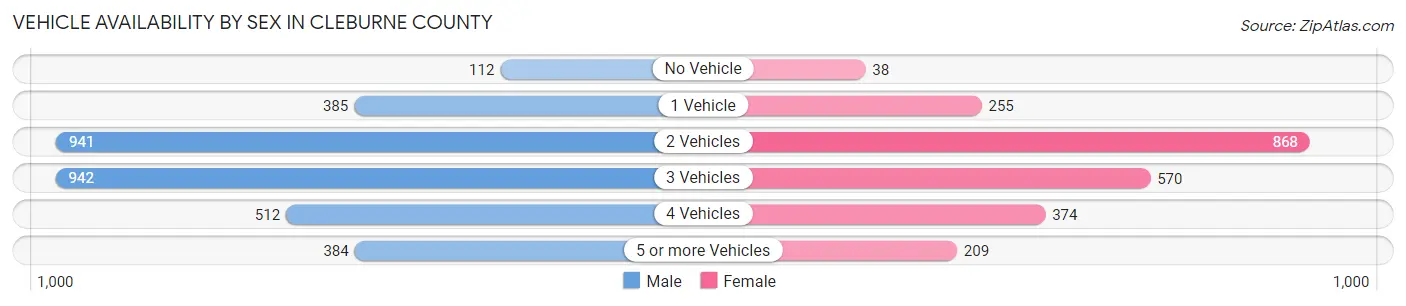
| Vehicles Available | Male | Female |
| No Vehicle | 112 (3.4%) | 38 (1.6%) |
| 1 Vehicle | 385 (11.7%) | 255 (11.0%) |
| 2 Vehicles | 941 (28.7%) | 868 (37.5%) |
| 3 Vehicles | 942 (28.7%) | 570 (24.6%) |
| 4 Vehicles | 512 (15.6%) | 374 (16.2%) |
| 5 or more Vehicles | 384 (11.7%) | 209 (9.0%) |
| Total | 3,276 (100.0%) | 2,314 (100.0%) |
Commute Time in Cleburne County
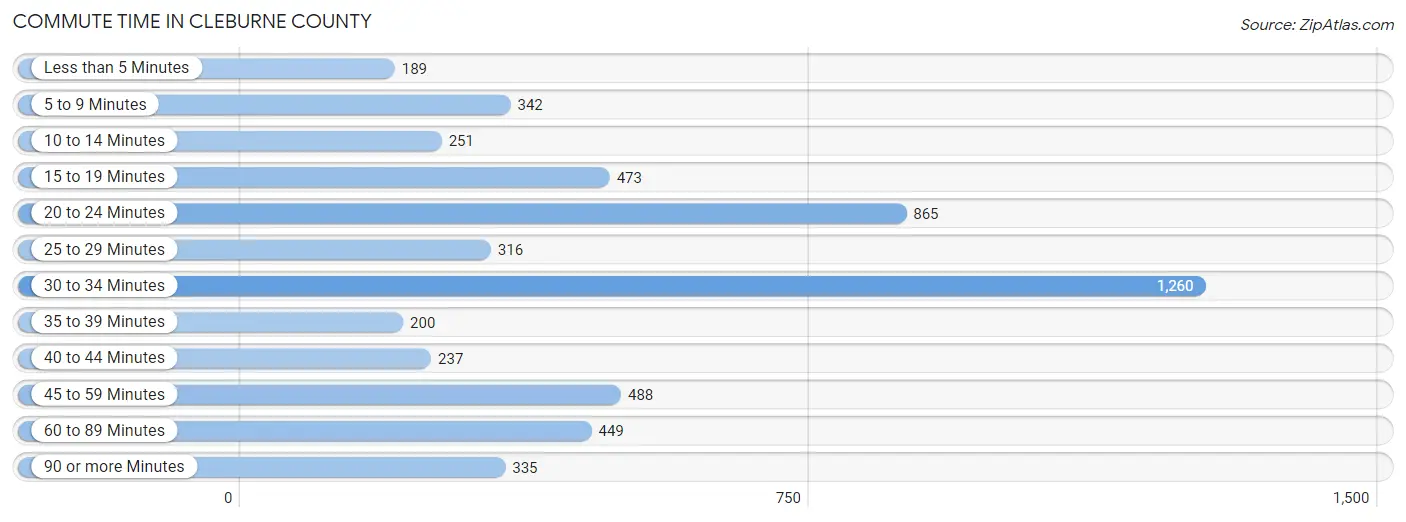
The most frequently occuring commute durations in Cleburne County are 30 to 34 minutes (1,260 commuters, 23.3%), 20 to 24 minutes (865 commuters, 16.0%), and 45 to 59 minutes (488 commuters, 9.0%).
| Commute Time | # Commuters | % Commuters |
| Less than 5 Minutes | 189 | 3.5% |
| 5 to 9 Minutes | 342 | 6.3% |
| 10 to 14 Minutes | 251 | 4.6% |
| 15 to 19 Minutes | 473 | 8.7% |
| 20 to 24 Minutes | 865 | 16.0% |
| 25 to 29 Minutes | 316 | 5.9% |
| 30 to 34 Minutes | 1,260 | 23.3% |
| 35 to 39 Minutes | 200 | 3.7% |
| 40 to 44 Minutes | 237 | 4.4% |
| 45 to 59 Minutes | 488 | 9.0% |
| 60 to 89 Minutes | 449 | 8.3% |
| 90 or more Minutes | 335 | 6.2% |
Commute Time by Sex in Cleburne County
The most common commute times in Cleburne County are 30 to 34 minutes (691 commuters, 21.8%) for males and 30 to 34 minutes (569 commuters, 25.5%) for females.

| Commute Time | Male | Female |
| Less than 5 Minutes | 120 (3.8%) | 69 (3.1%) |
| 5 to 9 Minutes | 159 (5.0%) | 183 (8.2%) |
| 10 to 14 Minutes | 188 (5.9%) | 63 (2.8%) |
| 15 to 19 Minutes | 195 (6.1%) | 278 (12.4%) |
| 20 to 24 Minutes | 468 (14.8%) | 397 (17.8%) |
| 25 to 29 Minutes | 237 (7.5%) | 79 (3.5%) |
| 30 to 34 Minutes | 691 (21.8%) | 569 (25.5%) |
| 35 to 39 Minutes | 59 (1.9%) | 141 (6.3%) |
| 40 to 44 Minutes | 144 (4.5%) | 93 (4.2%) |
| 45 to 59 Minutes | 283 (8.9%) | 205 (9.2%) |
| 60 to 89 Minutes | 320 (10.1%) | 129 (5.8%) |
| 90 or more Minutes | 307 (9.7%) | 28 (1.3%) |
Time of Departure to Work by Sex in Cleburne County
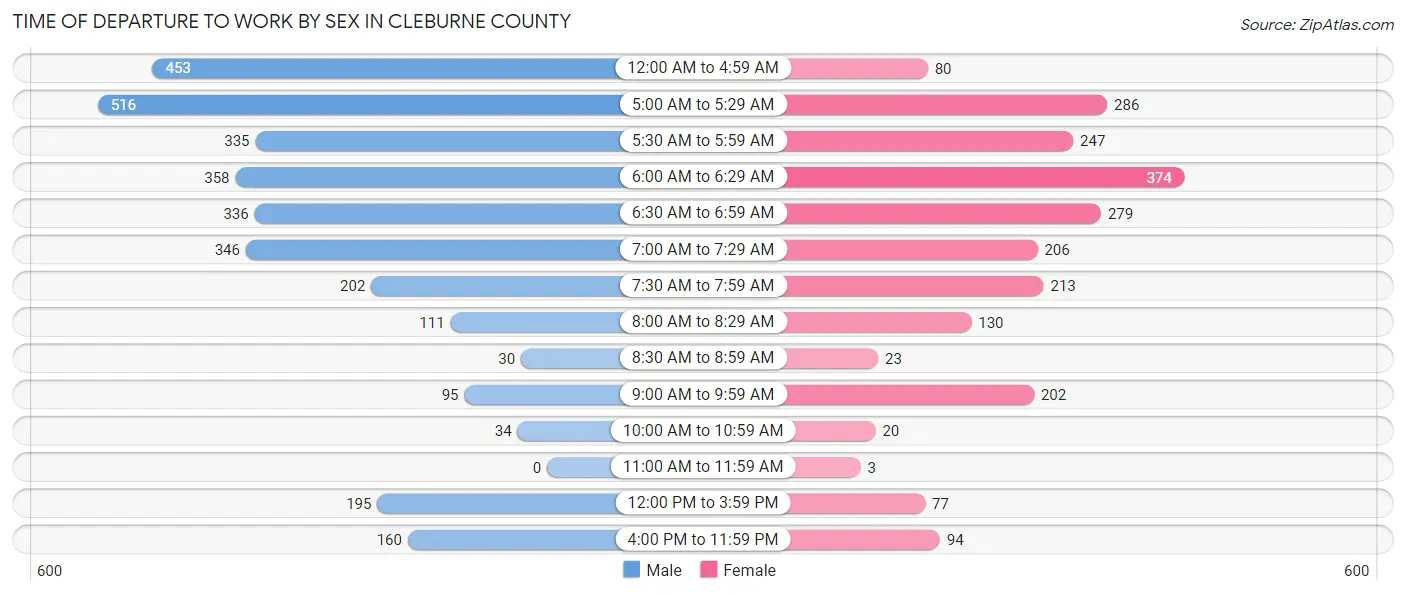
The most frequent times of departure to work in Cleburne County are 5:00 AM to 5:29 AM (516, 16.3%) for males and 6:00 AM to 6:29 AM (374, 16.7%) for females.
| Time of Departure | Male | Female |
| 12:00 AM to 4:59 AM | 453 (14.3%) | 80 (3.6%) |
| 5:00 AM to 5:29 AM | 516 (16.3%) | 286 (12.8%) |
| 5:30 AM to 5:59 AM | 335 (10.6%) | 247 (11.1%) |
| 6:00 AM to 6:29 AM | 358 (11.3%) | 374 (16.7%) |
| 6:30 AM to 6:59 AM | 336 (10.6%) | 279 (12.5%) |
| 7:00 AM to 7:29 AM | 346 (10.9%) | 206 (9.2%) |
| 7:30 AM to 7:59 AM | 202 (6.4%) | 213 (9.5%) |
| 8:00 AM to 8:29 AM | 111 (3.5%) | 130 (5.8%) |
| 8:30 AM to 8:59 AM | 30 (0.9%) | 23 (1.0%) |
| 9:00 AM to 9:59 AM | 95 (3.0%) | 202 (9.0%) |
| 10:00 AM to 10:59 AM | 34 (1.1%) | 20 (0.9%) |
| 11:00 AM to 11:59 AM | 0 (0.0%) | 3 (0.1%) |
| 12:00 PM to 3:59 PM | 195 (6.1%) | 77 (3.5%) |
| 4:00 PM to 11:59 PM | 160 (5.1%) | 94 (4.2%) |
| Total | 3,171 (100.0%) | 2,234 (100.0%) |
Housing Occupancy in Cleburne County
Occupancy by Ownership in Cleburne County
Of the total 5,761 dwellings in Cleburne County, owner-occupied units account for 4,496 (78.0%), while renter-occupied units make up 1,265 (22.0%).

| Occupancy | # Housing Units | % Housing Units |
| Owner Occupied Housing Units | 4,496 | 78.0% |
| Renter-Occupied Housing Units | 1,265 | 22.0% |
| Total Occupied Housing Units | 5,761 | 100.0% |
Occupancy by Household Size in Cleburne County
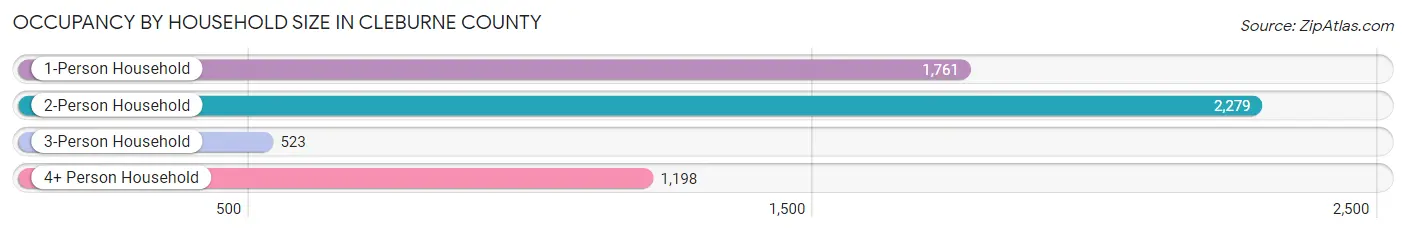
| Household Size | # Housing Units | % Housing Units |
| 1-Person Household | 1,761 | 30.6% |
| 2-Person Household | 2,279 | 39.6% |
| 3-Person Household | 523 | 9.1% |
| 4+ Person Household | 1,198 | 20.8% |
| Total Housing Units | 5,761 | 100.0% |
Occupancy by Ownership by Household Size in Cleburne County
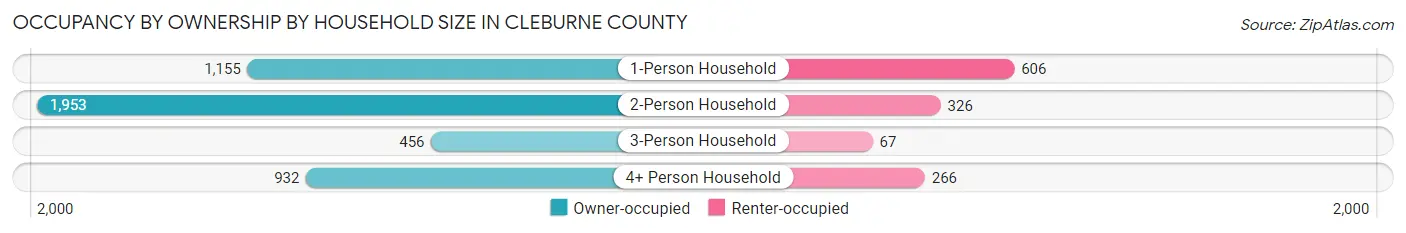
| Household Size | Owner-occupied | Renter-occupied |
| 1-Person Household | 1,155 (65.6%) | 606 (34.4%) |
| 2-Person Household | 1,953 (85.7%) | 326 (14.3%) |
| 3-Person Household | 456 (87.2%) | 67 (12.8%) |
| 4+ Person Household | 932 (77.8%) | 266 (22.2%) |
| Total Housing Units | 4,496 (78.0%) | 1,265 (22.0%) |
Occupancy by Educational Attainment in Cleburne County

| Household Size | Owner-occupied | Renter-occupied |
| Less than High School | 488 (61.3%) | 308 (38.7%) |
| High School Diploma | 2,039 (82.9%) | 422 (17.2%) |
| College/Associate Degree | 1,137 (70.4%) | 478 (29.6%) |
| Bachelor's Degree or higher | 832 (93.6%) | 57 (6.4%) |
Occupancy by Age of Householder in Cleburne County

| Age Bracket | # Households | % Households |
| Under 35 Years | 921 | 16.0% |
| 35 to 44 Years | 688 | 11.9% |
| 45 to 54 Years | 849 | 14.7% |
| 55 to 64 Years | 1,214 | 21.1% |
| 65 to 74 Years | 1,192 | 20.7% |
| 75 to 84 Years | 581 | 10.1% |
| 85 Years and Over | 316 | 5.5% |
| Total | 5,761 | 100.0% |
Housing Finances in Cleburne County
Median Income by Occupancy in Cleburne County
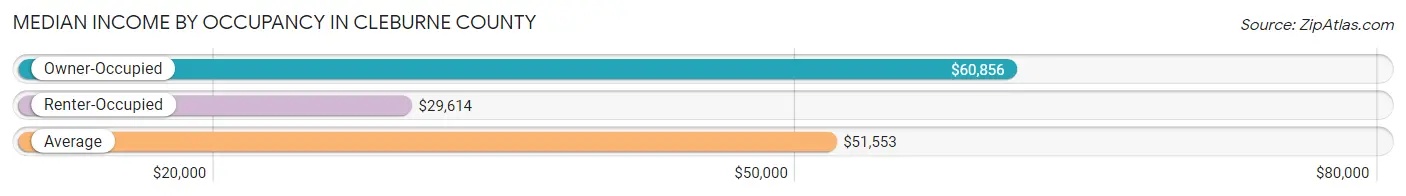
| Occupancy Type | # Households | Median Income |
| Owner-Occupied | 4,496 (78.0%) | $60,856 |
| Renter-Occupied | 1,265 (22.0%) | $29,614 |
| Average | 5,761 (100.0%) | $51,553 |
Occupancy by Householder Income Bracket in Cleburne County
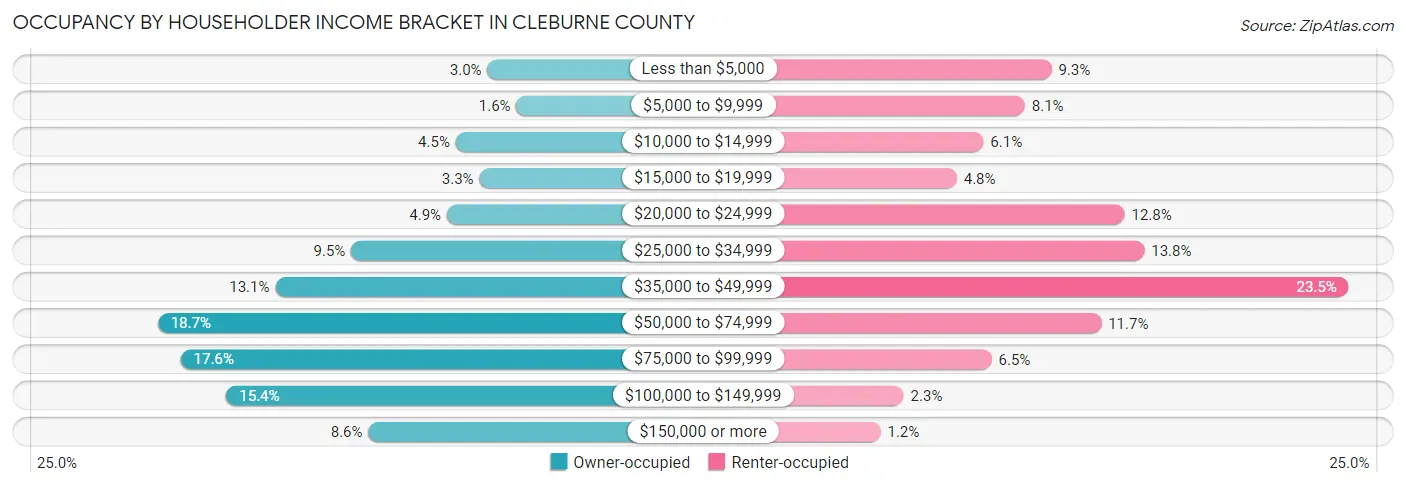
| Income Bracket | Owner-occupied | Renter-occupied |
| Less than $5,000 | 133 (3.0%) | 118 (9.3%) |
| $5,000 to $9,999 | 71 (1.6%) | 102 (8.1%) |
| $10,000 to $14,999 | 201 (4.5%) | 77 (6.1%) |
| $15,000 to $19,999 | 150 (3.3%) | 61 (4.8%) |
| $20,000 to $24,999 | 220 (4.9%) | 162 (12.8%) |
| $25,000 to $34,999 | 425 (9.5%) | 174 (13.8%) |
| $35,000 to $49,999 | 587 (13.1%) | 297 (23.5%) |
| $50,000 to $74,999 | 839 (18.7%) | 148 (11.7%) |
| $75,000 to $99,999 | 790 (17.6%) | 82 (6.5%) |
| $100,000 to $149,999 | 692 (15.4%) | 29 (2.3%) |
| $150,000 or more | 388 (8.6%) | 15 (1.2%) |
| Total | 4,496 (100.0%) | 1,265 (100.0%) |
Monthly Housing Cost Tiers in Cleburne County
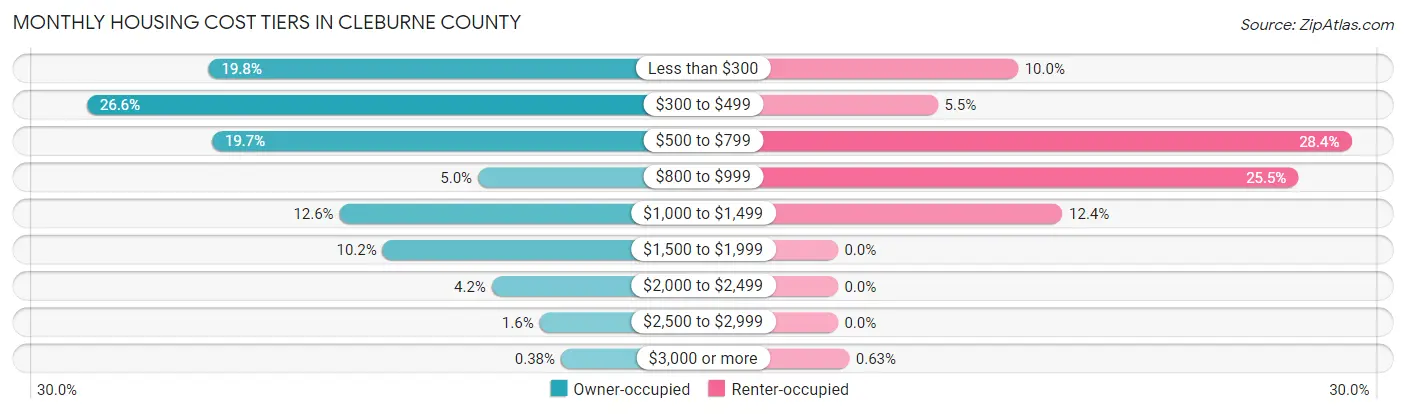
| Monthly Cost | Owner-occupied | Renter-occupied |
| Less than $300 | 892 (19.8%) | 126 (10.0%) |
| $300 to $499 | 1,194 (26.6%) | 70 (5.5%) |
| $500 to $799 | 884 (19.7%) | 359 (28.4%) |
| $800 to $999 | 223 (5.0%) | 322 (25.5%) |
| $1,000 to $1,499 | 567 (12.6%) | 157 (12.4%) |
| $1,500 to $1,999 | 460 (10.2%) | 0 (0.0%) |
| $2,000 to $2,499 | 189 (4.2%) | 0 (0.0%) |
| $2,500 to $2,999 | 70 (1.6%) | 0 (0.0%) |
| $3,000 or more | 17 (0.4%) | 8 (0.6%) |
| Total | 4,496 (100.0%) | 1,265 (100.0%) |
Physical Housing Characteristics in Cleburne County
Housing Structures in Cleburne County
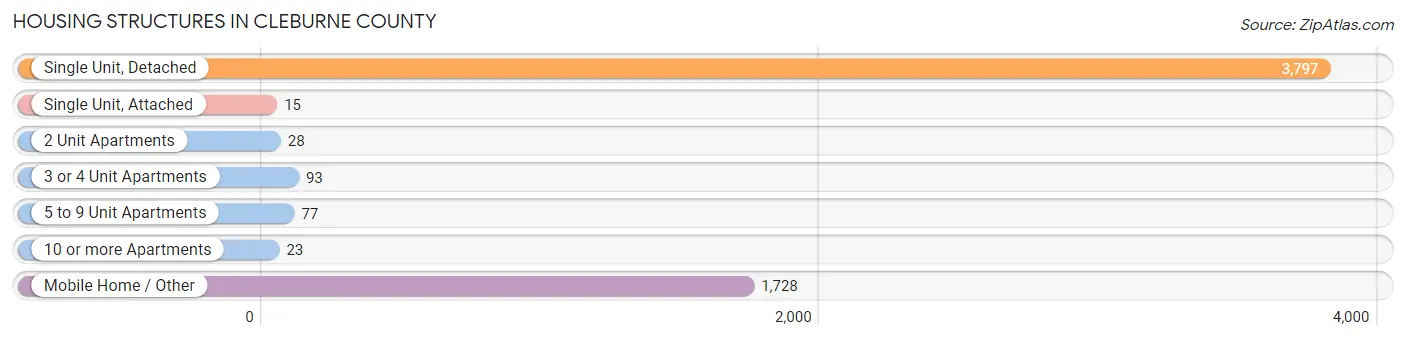
| Structure Type | # Housing Units | % Housing Units |
| Single Unit, Detached | 3,797 | 65.9% |
| Single Unit, Attached | 15 | 0.3% |
| 2 Unit Apartments | 28 | 0.5% |
| 3 or 4 Unit Apartments | 93 | 1.6% |
| 5 to 9 Unit Apartments | 77 | 1.3% |
| 10 or more Apartments | 23 | 0.4% |
| Mobile Home / Other | 1,728 | 30.0% |
| Total | 5,761 | 100.0% |
Housing Structures by Occupancy in Cleburne County
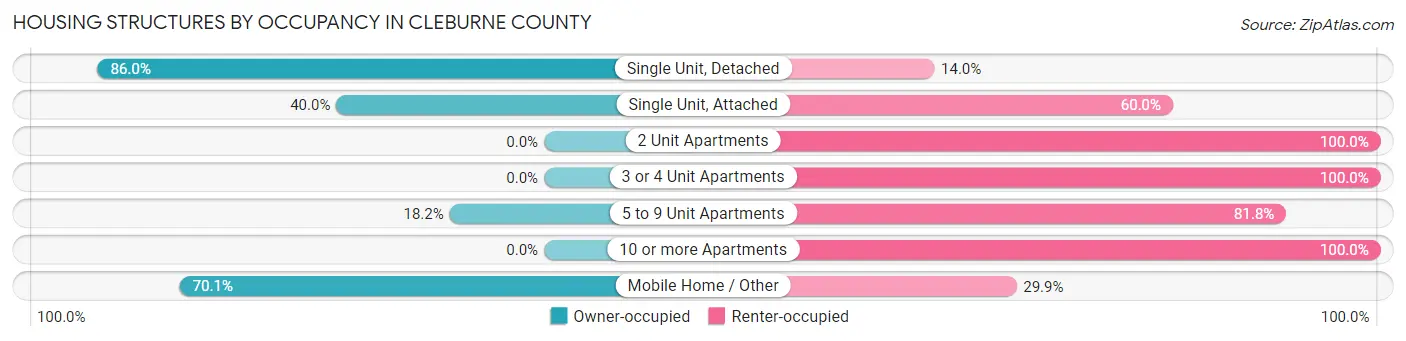
| Structure Type | Owner-occupied | Renter-occupied |
| Single Unit, Detached | 3,264 (86.0%) | 533 (14.0%) |
| Single Unit, Attached | 6 (40.0%) | 9 (60.0%) |
| 2 Unit Apartments | 0 (0.0%) | 28 (100.0%) |
| 3 or 4 Unit Apartments | 0 (0.0%) | 93 (100.0%) |
| 5 to 9 Unit Apartments | 14 (18.2%) | 63 (81.8%) |
| 10 or more Apartments | 0 (0.0%) | 23 (100.0%) |
| Mobile Home / Other | 1,212 (70.1%) | 516 (29.9%) |
| Total | 4,496 (78.0%) | 1,265 (22.0%) |
Housing Structures by Number of Rooms in Cleburne County
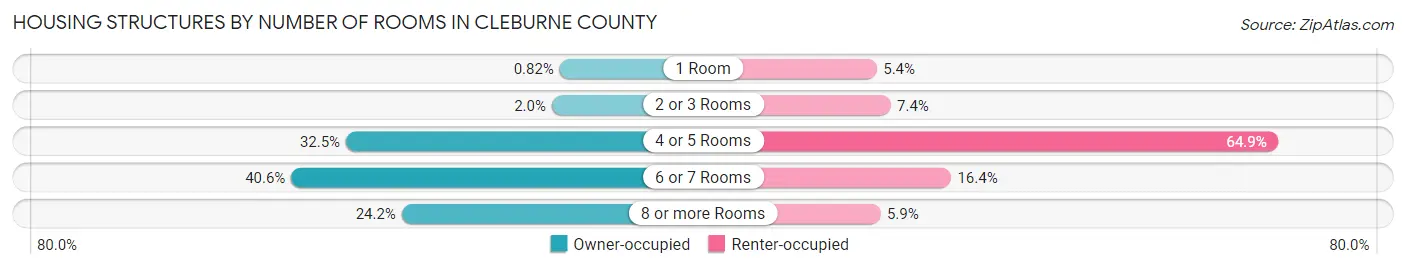
| Number of Rooms | Owner-occupied | Renter-occupied |
| 1 Room | 37 (0.8%) | 68 (5.4%) |
| 2 or 3 Rooms | 89 (2.0%) | 94 (7.4%) |
| 4 or 5 Rooms | 1,459 (32.5%) | 821 (64.9%) |
| 6 or 7 Rooms | 1,823 (40.6%) | 207 (16.4%) |
| 8 or more Rooms | 1,088 (24.2%) | 75 (5.9%) |
| Total | 4,496 (100.0%) | 1,265 (100.0%) |
Housing Structure by Heating Type in Cleburne County
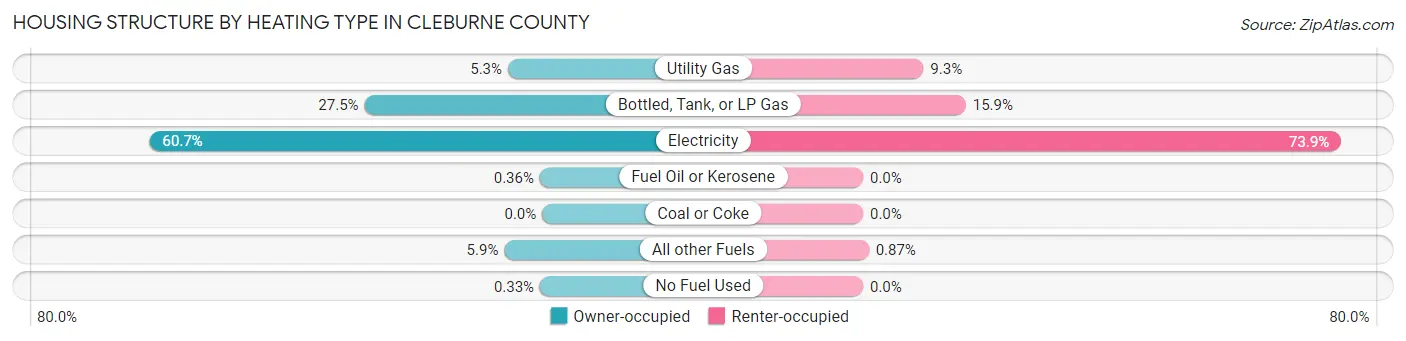
| Heating Type | Owner-occupied | Renter-occupied |
| Utility Gas | 238 (5.3%) | 118 (9.3%) |
| Bottled, Tank, or LP Gas | 1,235 (27.5%) | 201 (15.9%) |
| Electricity | 2,729 (60.7%) | 935 (73.9%) |
| Fuel Oil or Kerosene | 16 (0.4%) | 0 (0.0%) |
| Coal or Coke | 0 (0.0%) | 0 (0.0%) |
| All other Fuels | 263 (5.9%) | 11 (0.9%) |
| No Fuel Used | 15 (0.3%) | 0 (0.0%) |
| Total | 4,496 (100.0%) | 1,265 (100.0%) |
Household Vehicle Usage in Cleburne County

| Vehicles per Household | Owner-occupied | Renter-occupied |
| No Vehicle | 273 (6.1%) | 116 (9.2%) |
| 1 Vehicle | 845 (18.8%) | 489 (38.7%) |
| 2 Vehicles | 1,505 (33.5%) | 514 (40.6%) |
| 3 or more Vehicles | 1,873 (41.7%) | 146 (11.5%) |
| Total | 4,496 (100.0%) | 1,265 (100.0%) |
Real Estate & Mortgages in Cleburne County
Real Estate and Mortgage Overview in Cleburne County
| Characteristic | Without Mortgage | With Mortgage |
| Housing Units | 2,838 | 1,658 |
| Median Property Value | $110,600 | $168,500 |
| Median Household Income | $50,278 | $223 |
| Monthly Housing Costs | $366 | $17 |
| Real Estate Taxes | $312 | $160 |
Property Value by Mortgage Status in Cleburne County

| Property Value | Without Mortgage | With Mortgage |
| Less than $50,000 | 596 (21.0%) | 109 (6.6%) |
| $50,000 to $99,999 | 635 (22.4%) | 236 (14.2%) |
| $100,000 to $299,999 | 1,306 (46.0%) | 1,057 (63.7%) |
| $300,000 to $499,999 | 187 (6.6%) | 250 (15.1%) |
| $500,000 to $749,999 | 78 (2.8%) | 6 (0.4%) |
| $750,000 to $999,999 | 7 (0.3%) | 0 (0.0%) |
| $1,000,000 or more | 29 (1.0%) | 0 (0.0%) |
| Total | 2,838 (100.0%) | 1,658 (100.0%) |
Household Income by Mortgage Status in Cleburne County
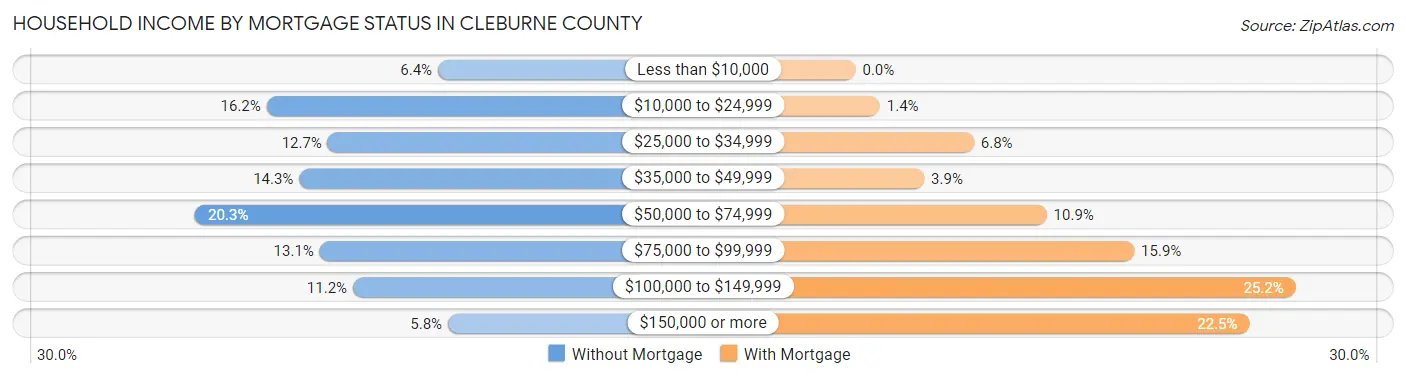
| Household Income | Without Mortgage | With Mortgage |
| Less than $10,000 | 181 (6.4%) | 0 (0.0%) |
| $10,000 to $24,999 | 459 (16.2%) | 23 (1.4%) |
| $25,000 to $34,999 | 360 (12.7%) | 112 (6.8%) |
| $35,000 to $49,999 | 406 (14.3%) | 65 (3.9%) |
| $50,000 to $74,999 | 575 (20.3%) | 181 (10.9%) |
| $75,000 to $99,999 | 373 (13.1%) | 264 (15.9%) |
| $100,000 to $149,999 | 319 (11.2%) | 417 (25.2%) |
| $150,000 or more | 165 (5.8%) | 373 (22.5%) |
| Total | 2,838 (100.0%) | 1,658 (100.0%) |
Property Value to Household Income Ratio in Cleburne County

| Value-to-Income Ratio | Without Mortgage | With Mortgage |
| Less than 2.0x | 1,179 (41.5%) | 84,125 (5,073.9%) |
| 2.0x to 2.9x | 624 (22.0%) | 805 (48.5%) |
| 3.0x to 3.9x | 154 (5.4%) | 329 (19.8%) |
| 4.0x or more | 816 (28.7%) | 234 (14.1%) |
| Total | 2,838 (100.0%) | 1,658 (100.0%) |
Real Estate Taxes by Mortgage Status in Cleburne County

| Property Taxes | Without Mortgage | With Mortgage |
| Less than $800 | 1,638 (57.7%) | 0 (0.0%) |
| $800 to $1,499 | 291 (10.2%) | 1,061 (64.0%) |
| $800 to $1,499 | 131 (4.6%) | 361 (21.8%) |
| Total | 2,838 (100.0%) | 1,658 (100.0%) |
Health & Disability in Cleburne County
Health Insurance Coverage by Age in Cleburne County
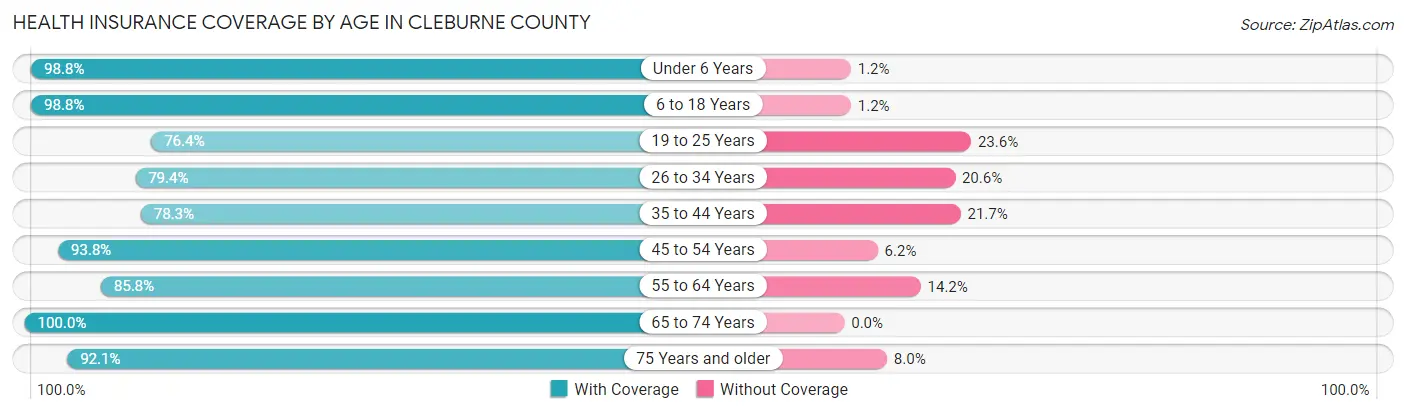
| Age Bracket | With Coverage | Without Coverage |
| Under 6 Years | 1,065 (98.8%) | 13 (1.2%) |
| 6 to 18 Years | 2,510 (98.8%) | 31 (1.2%) |
| 19 to 25 Years | 731 (76.4%) | 226 (23.6%) |
| 26 to 34 Years | 1,457 (79.4%) | 379 (20.6%) |
| 35 to 44 Years | 1,268 (78.3%) | 351 (21.7%) |
| 45 to 54 Years | 1,854 (93.8%) | 123 (6.2%) |
| 55 to 64 Years | 1,784 (85.8%) | 296 (14.2%) |
| 65 to 74 Years | 1,731 (100.0%) | 0 (0.0%) |
| 75 Years and older | 1,077 (92.0%) | 93 (8.0%) |
| Total | 13,477 (89.9%) | 1,512 (10.1%) |
Health Insurance Coverage by Citizenship Status in Cleburne County
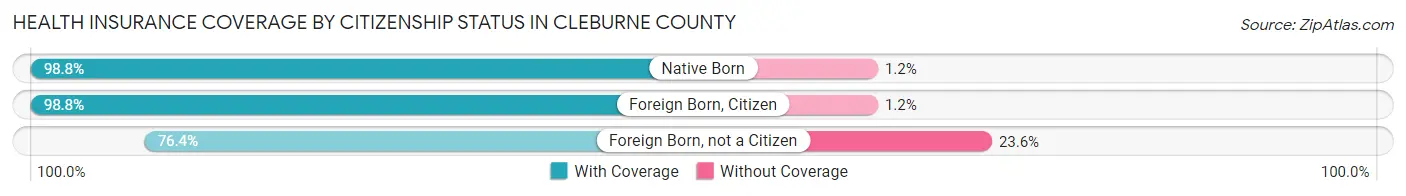
| Citizenship Status | With Coverage | Without Coverage |
| Native Born | 1,065 (98.8%) | 13 (1.2%) |
| Foreign Born, Citizen | 2,510 (98.8%) | 31 (1.2%) |
| Foreign Born, not a Citizen | 731 (76.4%) | 226 (23.6%) |
Health Insurance Coverage by Household Income in Cleburne County
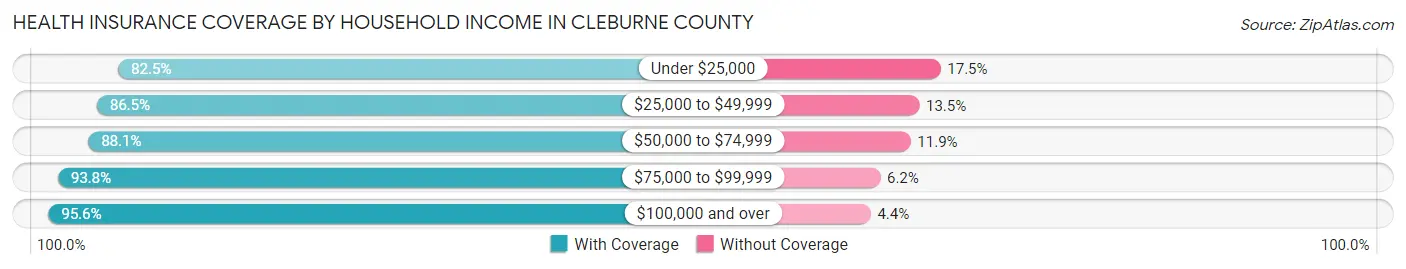
| Household Income | With Coverage | Without Coverage |
| Under $25,000 | 1,854 (82.5%) | 394 (17.5%) |
| $25,000 to $49,999 | 2,506 (86.5%) | 392 (13.5%) |
| $50,000 to $74,999 | 2,757 (88.1%) | 373 (11.9%) |
| $75,000 to $99,999 | 2,903 (93.8%) | 193 (6.2%) |
| $100,000 and over | 3,443 (95.6%) | 160 (4.4%) |
Public vs Private Health Insurance Coverage by Age in Cleburne County

| Age Bracket | Public Insurance | Private Insurance |
| Under 6 | 687 (63.7%) | 378 (35.1%) |
| 6 to 18 Years | 1,073 (42.2%) | 1,483 (58.4%) |
| 19 to 25 Years | 20 (2.1%) | 711 (74.3%) |
| 25 to 34 Years | 319 (17.4%) | 1,138 (62.0%) |
| 35 to 44 Years | 113 (7.0%) | 1,188 (73.4%) |
| 45 to 54 Years | 422 (21.3%) | 1,553 (78.5%) |
| 55 to 64 Years | 339 (16.3%) | 1,534 (73.8%) |
| 65 to 74 Years | 1,702 (98.3%) | 1,047 (60.5%) |
| 75 Years and over | 1,077 (92.0%) | 667 (57.0%) |
| Total | 5,752 (38.4%) | 9,699 (64.7%) |
Disability Status by Sex by Age in Cleburne County

| Age Bracket | Male | Female |
| Under 5 Years | 30 (6.2%) | 14 (3.4%) |
| 5 to 17 Years | 54 (4.3%) | 63 (4.9%) |
| 18 to 34 Years | 197 (12.6%) | 266 (19.0%) |
| 35 to 64 Years | 697 (24.5%) | 608 (21.5%) |
| 65 to 74 Years | 347 (41.0%) | 298 (33.7%) |
| 75 Years and over | 313 (64.7%) | 324 (47.2%) |
Disability Class by Sex by Age in Cleburne County
Disability Class: Hearing Difficulty

| Age Bracket | Male | Female |
| Under 5 Years | 0 (0.0%) | 14 (3.4%) |
| 5 to 17 Years | 0 (0.0%) | 0 (0.0%) |
| 18 to 34 Years | 0 (0.0%) | 11 (0.8%) |
| 35 to 64 Years | 381 (13.4%) | 176 (6.2%) |
| 65 to 74 Years | 277 (32.7%) | 42 (4.8%) |
| 75 Years and over | 311 (64.3%) | 132 (19.2%) |
Disability Class: Vision Difficulty
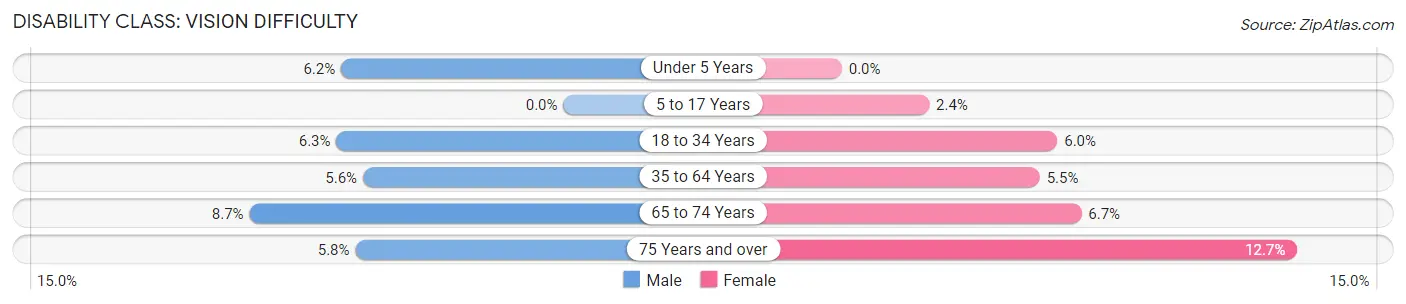
| Age Bracket | Male | Female |
| Under 5 Years | 30 (6.2%) | 0 (0.0%) |
| 5 to 17 Years | 0 (0.0%) | 31 (2.4%) |
| 18 to 34 Years | 99 (6.3%) | 84 (6.0%) |
| 35 to 64 Years | 159 (5.6%) | 156 (5.5%) |
| 65 to 74 Years | 74 (8.7%) | 59 (6.7%) |
| 75 Years and over | 28 (5.8%) | 87 (12.7%) |
Disability Class: Cognitive Difficulty
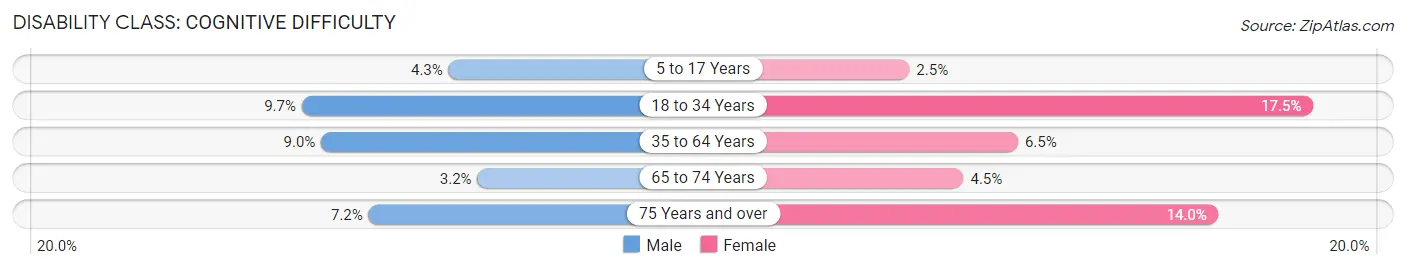
| Age Bracket | Male | Female |
| 5 to 17 Years | 54 (4.3%) | 32 (2.5%) |
| 18 to 34 Years | 152 (9.7%) | 245 (17.5%) |
| 35 to 64 Years | 256 (9.0%) | 185 (6.5%) |
| 65 to 74 Years | 27 (3.2%) | 40 (4.5%) |
| 75 Years and over | 35 (7.2%) | 96 (14.0%) |
Disability Class: Ambulatory Difficulty

| Age Bracket | Male | Female |
| 5 to 17 Years | 0 (0.0%) | 0 (0.0%) |
| 18 to 34 Years | 63 (4.0%) | 119 (8.5%) |
| 35 to 64 Years | 242 (8.5%) | 363 (12.8%) |
| 65 to 74 Years | 130 (15.3%) | 211 (23.9%) |
| 75 Years and over | 91 (18.8%) | 231 (33.7%) |
Disability Class: Self-Care Difficulty
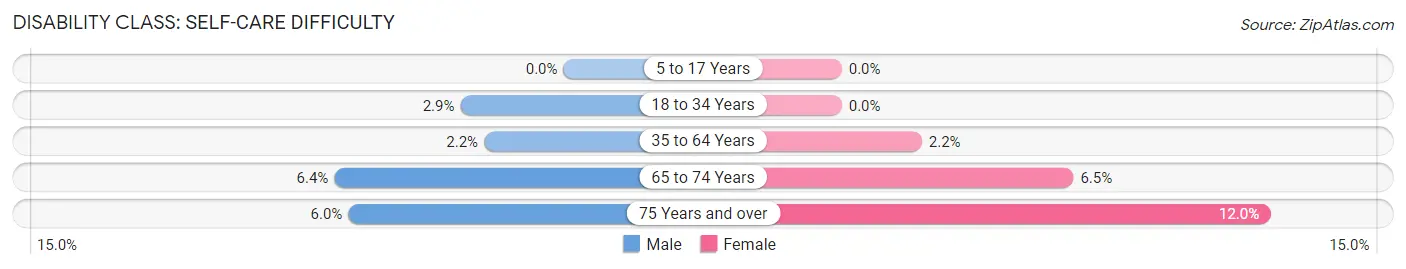
| Age Bracket | Male | Female |
| 5 to 17 Years | 0 (0.0%) | 0 (0.0%) |
| 18 to 34 Years | 45 (2.9%) | 0 (0.0%) |
| 35 to 64 Years | 63 (2.2%) | 63 (2.2%) |
| 65 to 74 Years | 54 (6.4%) | 57 (6.5%) |
| 75 Years and over | 29 (6.0%) | 82 (11.9%) |
Technology Access in Cleburne County
Computing Device Access in Cleburne County

| Device Type | # Households | % Households |
| Desktop or Laptop | 3,383 | 58.7% |
| Smartphone | 4,905 | 85.1% |
| Tablet | 2,663 | 46.2% |
| No Computing Device | 637 | 11.1% |
| Total | 5,761 | 100.0% |
Internet Access in Cleburne County

| Internet Type | # Households | % Households |
| Dial-Up Internet | 6 | 0.1% |
| Broadband Home | 2,021 | 35.1% |
| Cellular Data Only | 1,802 | 31.3% |
| Satellite Internet | 483 | 8.4% |
| No Internet | 1,500 | 26.0% |
| Total | 5,761 | 100.0% |
Cleburne County Summary
Cleburne County is located in the northeastern corner of Alabama, and is part of the Appalachian region. It is bordered by Calhoun, Randolph, Clay, Talladega, and St. Clair counties. The county seat is Heflin, and the county is named for Confederate General Patrick Cleburne.
Geography
Cleburne County is located in the Appalachian foothills, and is characterized by rolling hills and valleys. The county is drained by the Choccolocco Creek, which flows southward through the county. The county is mostly forested, with the majority of the land being used for timber production. The county is also home to several state parks, including Cheaha State Park, which is located on the highest point in the state.
The county has a total area of 576 square miles, of which 574 square miles is land and 2 square miles is water. The county is located in the Central Time Zone.
Demographics
As of the 2010 census, there were 14,972 people, 5,845 households, and 4,093 families residing in the county. The population density was 26 people per square mile. There were 6,717 housing units at an average density of 12 per square mile. The racial makeup of the county was 87.3% White, 10.2% Black or African American, 0.3% Native American, 0.2% Asian, 0.1% Pacific Islander, 0.7% from other races, and 1.3% from two or more races. 1.7% of the population were Hispanic or Latino of any race.
There were 5,845 households, out of which 28.2% had children under the age of 18 living with them, 53.2% were married couples living together, 12.2% had a female householder with no husband present, and 30.2% were non-families. 26.2% of all households were made up of individuals, and 11.7% had someone living alone who was 65 years of age or older. The average household size was 2.48 and the average family size was 2.98.
In the county, the population was spread out, with 24.2% under the age of 18, 8.2% from 18 to 24, 27.2% from 25 to 44, 25.2% from 45 to 64, and 15.2% who were 65 years of age or older. The median age was 38 years. For every 100 females, there were 94.2 males. For every 100 females age 18 and over, there were 91.2 males.
The median income for a household in the county was $30,945, and the median income for a family was $37,813. Males had a median income of $30,945 versus $21,813 for females. The per capita income for the county was $15,945. About 13.2% of families and 16.2% of the population were below the poverty line, including 22.2% of those under age 18 and 14.2% of those age 65 or over.
Economy
The economy of Cleburne County is largely based on agriculture and timber production. The county is home to several large timber companies, and the timber industry is the largest employer in the county. Other major industries include poultry production, manufacturing, and tourism.
The county is home to several state parks, including Cheaha State Park, which is located on the highest point in the state. The park is a popular destination for hikers, campers, and other outdoor enthusiasts. The county is also home to several historic sites, including the Heflin-Torbert House, which is listed on the National Register of Historic Places.
The county is served by several major highways, including Interstate 20, US Highway 78, and Alabama State Route 9. The county is also served by the Anniston-Calhoun Regional Airport, which is located in nearby Calhoun County.
Conclusion
Cleburne County is located in the northeastern corner of Alabama, and is part of the Appalachian region. It is bordered by Calhoun, Randolph, Clay, Talladega, and St. Clair counties. The county seat is Heflin, and the county is named for Confederate General Patrick Cleburne. The county is characterized by rolling hills and valleys, and is mostly forested, with the majority of the land being used for timber production. The economy of Cleburne County is largely based on agriculture and timber production, and the county is home to several state parks and historic sites. The county is served by several major highways, and is also served by the Anniston-Calhoun Regional Airport.
Common Questions
What is the Total Population of Cleburne County?
Total Population of Cleburne County is 15,144.
What is the Total Male Population of Cleburne County?
Total Male Population of Cleburne County is 7,565.
What is the Total Female Population of Cleburne County?
Total Female Population of Cleburne County is 7,579.
What is the Ratio of Males per 100 Females in Cleburne County?
There are 99.82 Males per 100 Females in Cleburne County.
What is the Ratio of Females per 100 Males in Cleburne County?
There are 100.19 Females per 100 Males in Cleburne County.
What is the Median Population Age in Cleburne County?
Median Population Age in Cleburne County is 42.2 Years.
What is the Average Family Size in Cleburne County
Average Family Size in Cleburne County is 3.3 People.
What is the Average Household Size in Cleburne County
Average Household Size in Cleburne County is 2.6 People.
What is Per Capita Income in Cleburne County?
Per Capita income in Cleburne County is $28,598.
What is the Median Family Income in Cleburne County?
Median Family Income in Cleburne County is $71,833.
What is the Median Household income in Cleburne County?
Median Household Income in Cleburne County is $51,553.
What is Income or Wage Gap in Cleburne County?
Income or Wage Gap in Cleburne County is 32.3%.
Women in Cleburne County earn 67.7 cents for every dollar earned by a man.
What is Family Income Deficit in Cleburne County?
Family Income Deficit in Cleburne County is $8,204.
Families that are below poverty line in Cleburne County earn $8,204 less on average than the poverty threshold level.
What is Inequality or Gini Index in Cleburne County?
Inequality or Gini Index in Cleburne County is 0.47.
How Large is the Labor Force in Cleburne County?
There are 5,846 People in the Labor Forcein in Cleburne County.
What is the Percentage of People in the Labor Force in Cleburne County?
48.3% of People are in the Labor Force in Cleburne County.
What is the Unemployment Rate in Cleburne County?
Unemployment Rate in Cleburne County is 2.6%.