Clarke County, AL
Clarke County Map
Clarke County Overview
23,058
TOTAL POPULATION
11,032
MALE POPULATION
12,026
FEMALE POPULATION
91.73
MALES / 100 FEMALES
109.01
FEMALES / 100 MALES
42.7
MEDIAN AGE
3.6
AVG FAMILY SIZE
2.8
AVG HOUSEHOLD SIZE
$29,310
PER CAPITA INCOME
$64,688
AVG FAMILY INCOME
$47,549
AVG HOUSEHOLD INCOME
36.5%
WAGE / INCOME GAP [ % ]
63.5¢/ $1
WAGE / INCOME GAP [ $ ]
$10,612
FAMILY INCOME DEFICIT
0.53
INEQUALITY / GINI INDEX
8,972
LABOR FORCE [ PEOPLE ]
48.2%
PERCENT IN LABOR FORCE
12.5%
UNEMPLOYMENT RATE
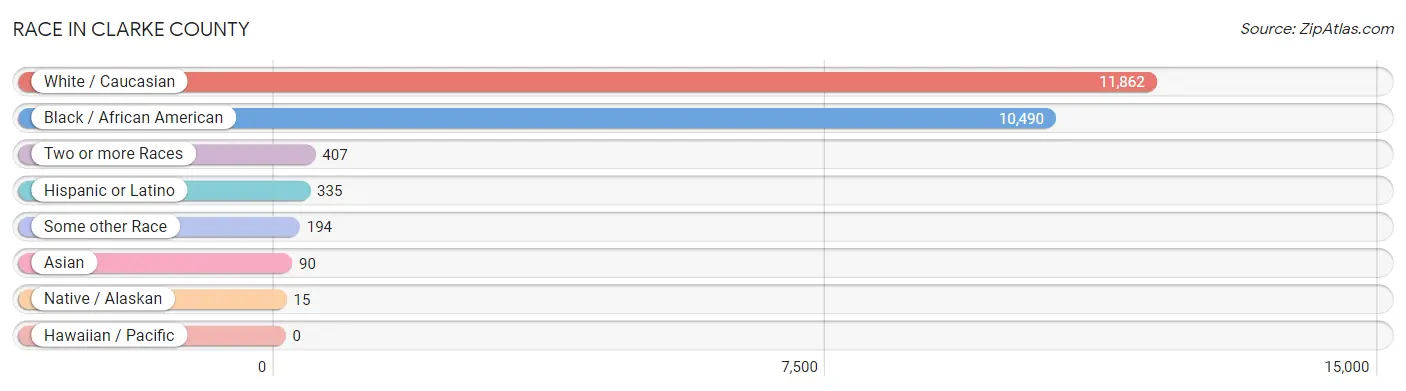
Race in Clarke County
The most populous races in Clarke County are White / Caucasian (11,862 | 51.4%), Black / African American (10,490 | 45.5%), and Two or more Races (407 | 1.8%).
| Race | # Population | % Population |
| Asian | 90 | 0.4% |
| Black / African American | 10,490 | 45.5% |
| Hawaiian / Pacific | 0 | 0.0% |
| Hispanic or Latino | 335 | 1.5% |
| Native / Alaskan | 15 | 0.1% |
| White / Caucasian | 11,862 | 51.4% |
| Two or more Races | 407 | 1.8% |
| Some other Race | 194 | 0.8% |
| Total | 23,058 | 100.0% |
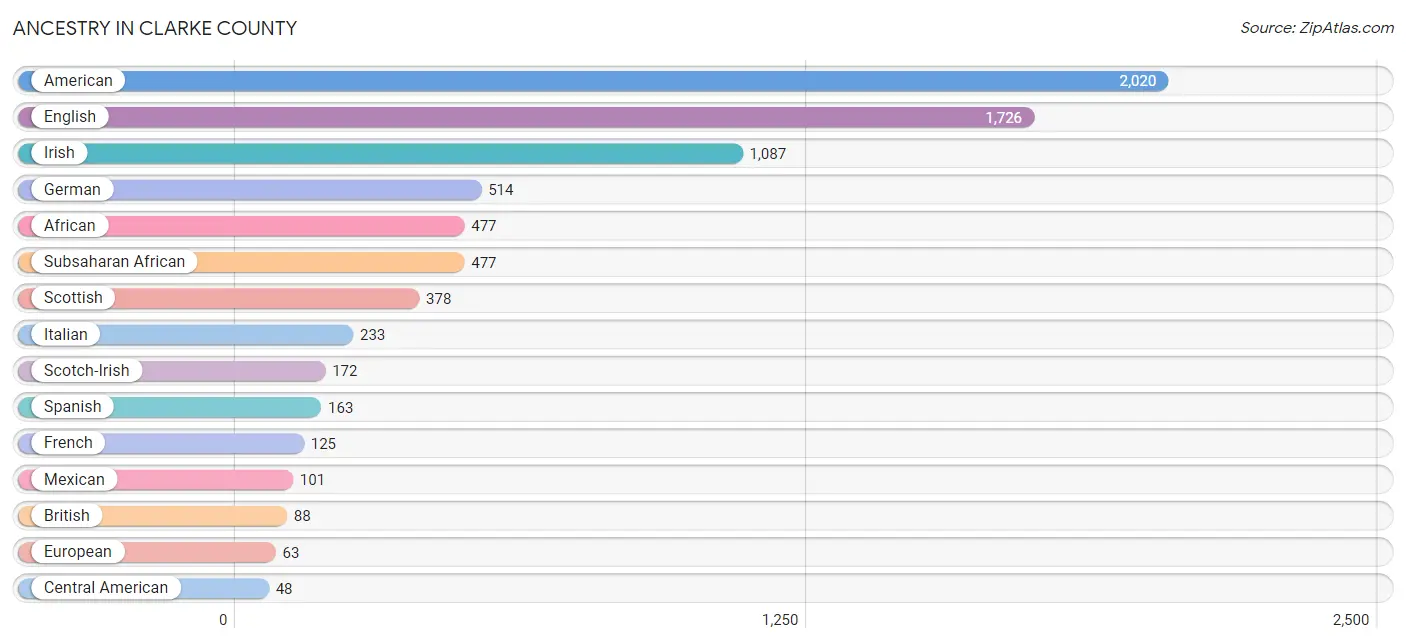
Ancestry in Clarke County
The most populous ancestries reported in Clarke County are American (2,020 | 8.8%), English (1,726 | 7.5%), Irish (1,087 | 4.7%), German (514 | 2.2%), and African (477 | 2.1%), together accounting for 25.3% of all Clarke County residents.
| Ancestry | # Population | % Population |
| African | 477 | 2.1% |
| American | 2,020 | 8.8% |
| Bhutanese | 4 | 0.0% |
| British | 88 | 0.4% |
| Cajun | 10 | 0.0% |
| Central American | 48 | 0.2% |
| Cherokee | 28 | 0.1% |
| Creek | 2 | 0.0% |
| Croatian | 5 | 0.0% |
| Dutch | 48 | 0.2% |
| Eastern European | 7 | 0.0% |
| English | 1,726 | 7.5% |
| European | 63 | 0.3% |
| French | 125 | 0.5% |
| French Canadian | 3 | 0.0% |
| German | 514 | 2.2% |
| Guatemalan | 48 | 0.2% |
| Houma | 9 | 0.0% |
| Indian (Asian) | 33 | 0.1% |
| Irish | 1,087 | 4.7% |
| Italian | 233 | 1.0% |
| Korean | 36 | 0.2% |
| Mexican | 101 | 0.4% |
| Norwegian | 26 | 0.1% |
| Pakistani | 4 | 0.0% |
| Pennsylvania German | 8 | 0.0% |
| Puerto Rican | 13 | 0.1% |
| Russian | 7 | 0.0% |
| Scandinavian | 35 | 0.2% |
| Scotch-Irish | 172 | 0.7% |
| Scottish | 378 | 1.6% |
| Seminole | 8 | 0.0% |
| Spaniard | 10 | 0.0% |
| Spanish | 163 | 0.7% |
| Sri Lankan | 37 | 0.2% |
| Subsaharan African | 477 | 2.1% |
| Swedish | 35 | 0.2% |
| Thai | 21 | 0.1% |
| Welsh | 35 | 0.2% | View All 39 Rows |
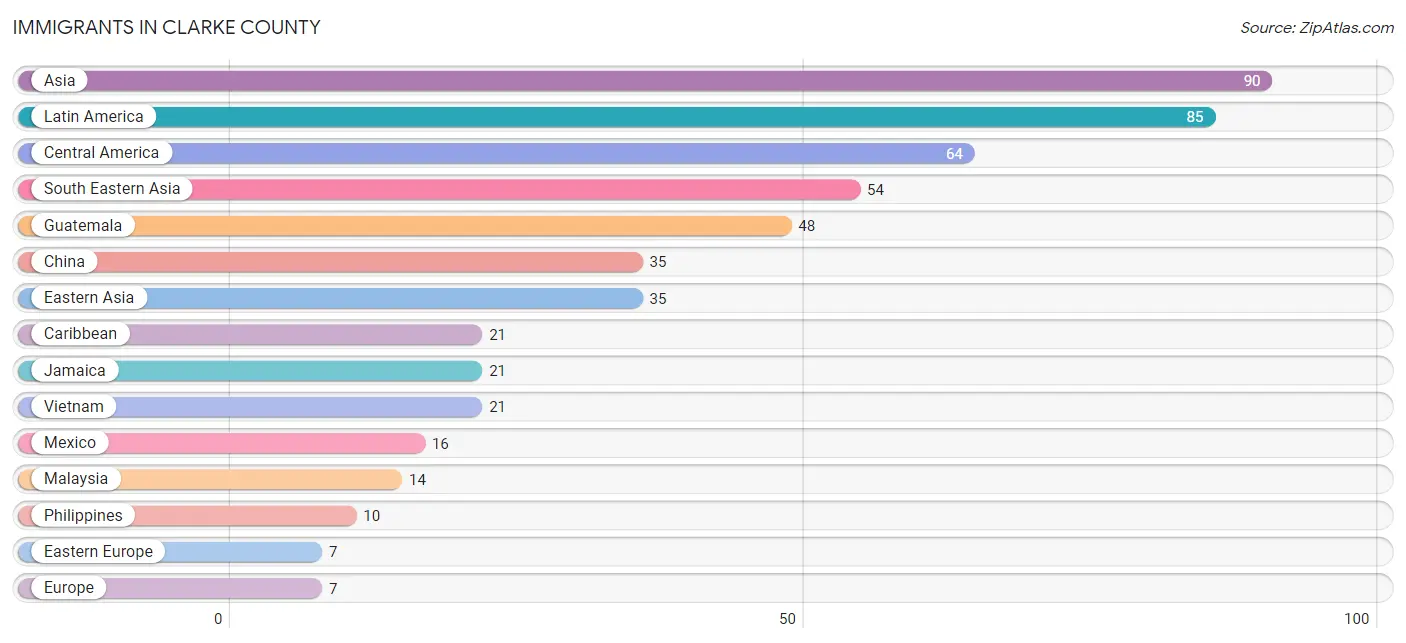
Immigrants in Clarke County
The most numerous immigrant groups reported in Clarke County came from Asia (90 | 0.4%), Latin America (85 | 0.4%), Central America (64 | 0.3%), South Eastern Asia (54 | 0.2%), and Guatemala (48 | 0.2%), together accounting for 1.5% of all Clarke County residents.
| Immigration Origin | # Population | % Population |
| Asia | 90 | 0.4% |
| Caribbean | 21 | 0.1% |
| Central America | 64 | 0.3% |
| China | 35 | 0.2% |
| Eastern Asia | 35 | 0.2% |
| Eastern Europe | 7 | 0.0% |
| Europe | 7 | 0.0% |
| Guatemala | 48 | 0.2% |
| India | 1 | 0.0% |
| Jamaica | 21 | 0.1% |
| Latin America | 85 | 0.4% |
| Malaysia | 14 | 0.1% |
| Mexico | 16 | 0.1% |
| Philippines | 10 | 0.0% |
| Russia | 7 | 0.0% |
| Singapore | 5 | 0.0% |
| South Central Asia | 1 | 0.0% |
| South Eastern Asia | 54 | 0.2% |
| Thailand | 4 | 0.0% |
| Vietnam | 21 | 0.1% | View All 20 Rows |
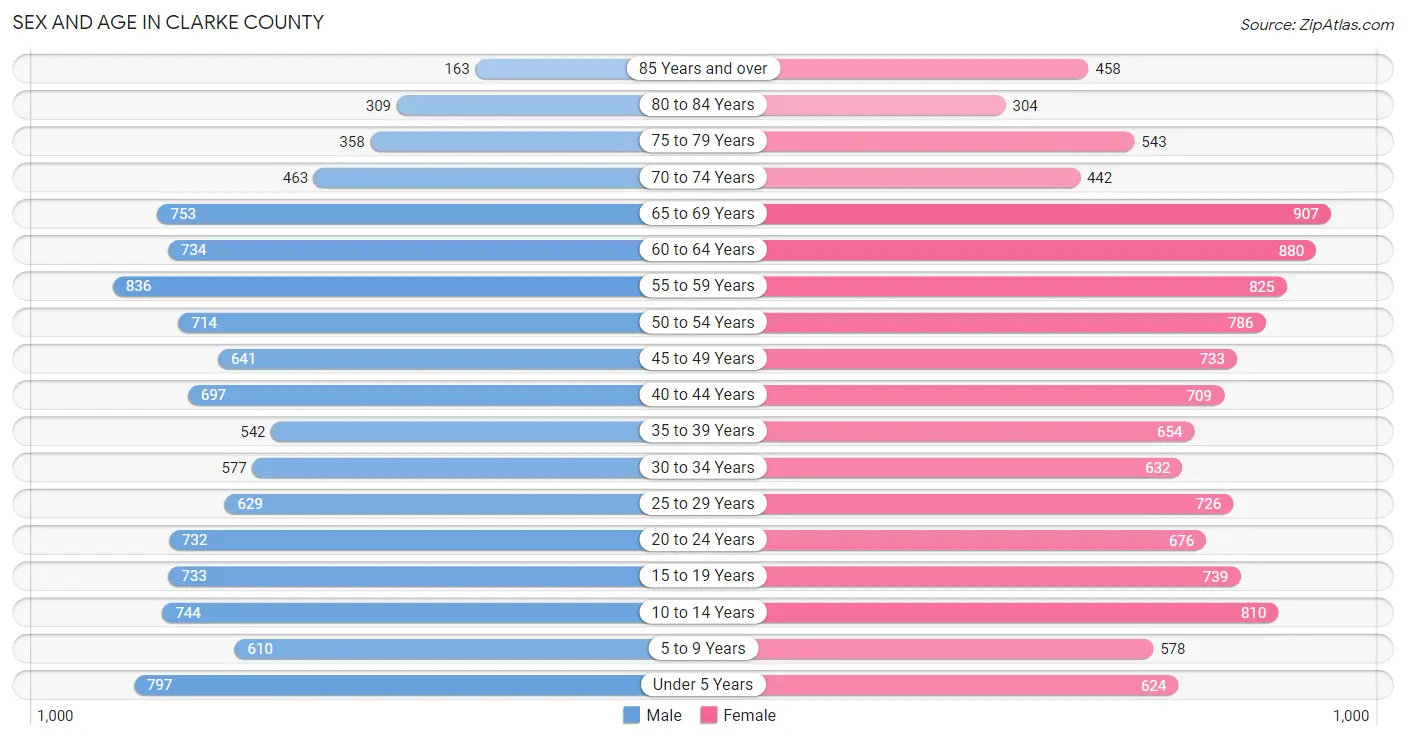
Sex and Age in Clarke County
Sex and Age in Clarke County
The most populous age groups in Clarke County are 55 to 59 Years (836 | 7.6%) for men and 65 to 69 Years (907 | 7.5%) for women.
| Age Bracket | Male | Female |
| Under 5 Years | 797 (7.2%) | 624 (5.2%) |
| 5 to 9 Years | 610 (5.5%) | 578 (4.8%) |
| 10 to 14 Years | 744 (6.7%) | 810 (6.7%) |
| 15 to 19 Years | 733 (6.6%) | 739 (6.1%) |
| 20 to 24 Years | 732 (6.6%) | 676 (5.6%) |
| 25 to 29 Years | 629 (5.7%) | 726 (6.0%) |
| 30 to 34 Years | 577 (5.2%) | 632 (5.3%) |
| 35 to 39 Years | 542 (4.9%) | 654 (5.4%) |
| 40 to 44 Years | 697 (6.3%) | 709 (5.9%) |
| 45 to 49 Years | 641 (5.8%) | 733 (6.1%) |
| 50 to 54 Years | 714 (6.5%) | 786 (6.5%) |
| 55 to 59 Years | 836 (7.6%) | 825 (6.9%) |
| 60 to 64 Years | 734 (6.7%) | 880 (7.3%) |
| 65 to 69 Years | 753 (6.8%) | 907 (7.5%) |
| 70 to 74 Years | 463 (4.2%) | 442 (3.7%) |
| 75 to 79 Years | 358 (3.3%) | 543 (4.5%) |
| 80 to 84 Years | 309 (2.8%) | 304 (2.5%) |
| 85 Years and over | 163 (1.5%) | 458 (3.8%) |
| Total | 11,032 (100.0%) | 12,026 (100.0%) |
Families and Households in Clarke County
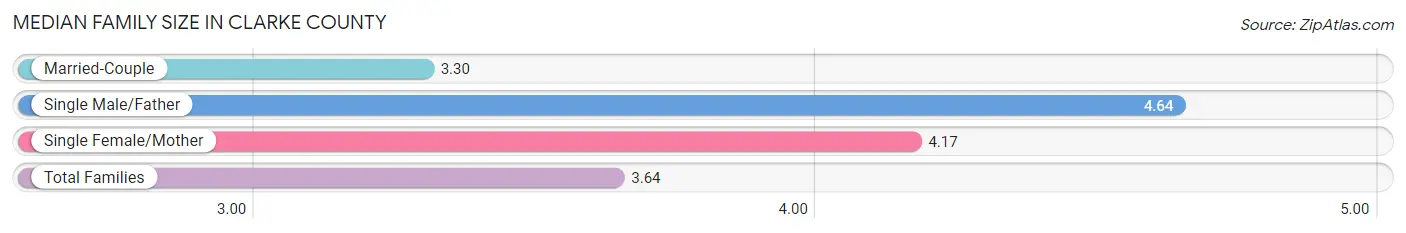
Median Family Size in Clarke County
The median family size in Clarke County is 3.64 persons per family, with single male/father families (547 | 10.6%) accounting for the largest median family size of 4.64 persons per family. On the other hand, married-couple families (3,442 | 66.4%) represent the smallest median family size with 3.30 persons per family.
| Family Type | # Families | Family Size |
| Married-Couple | 3,442 (66.4%) | 3.30 |
| Single Male/Father | 547 (10.6%) | 4.64 |
| Single Female/Mother | 1,192 (23.0%) | 4.17 |
| Total Families | 5,181 (100.0%) | 3.64 |
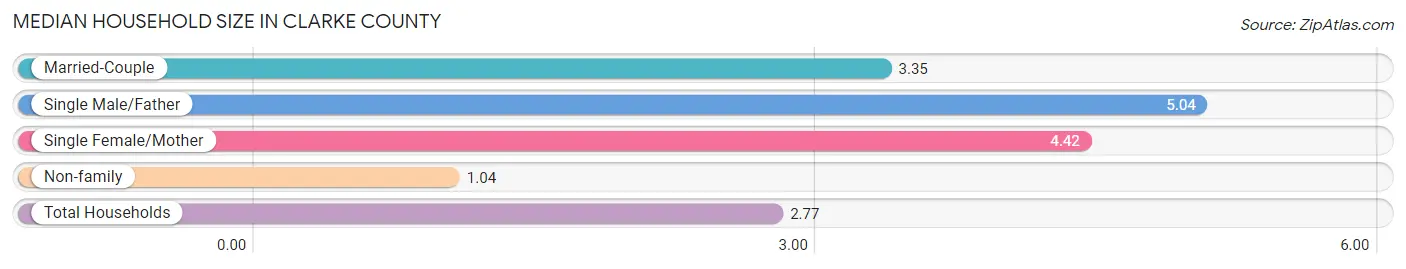
Median Household Size in Clarke County
The median household size in Clarke County is 2.77 persons per household, with single male/father households (547 | 6.7%) accounting for the largest median household size of 5.04 persons per household. non-family households (3,007 | 36.7%) represent the smallest median household size with 1.04 persons per household.
| Household Type | # Households | Household Size |
| Married-Couple | 3,442 (42.0%) | 3.35 |
| Single Male/Father | 547 (6.7%) | 5.04 |
| Single Female/Mother | 1,192 (14.6%) | 4.42 |
| Non-family | 3,007 (36.7%) | 1.04 |
| Total Households | 8,188 (100.0%) | 2.77 |
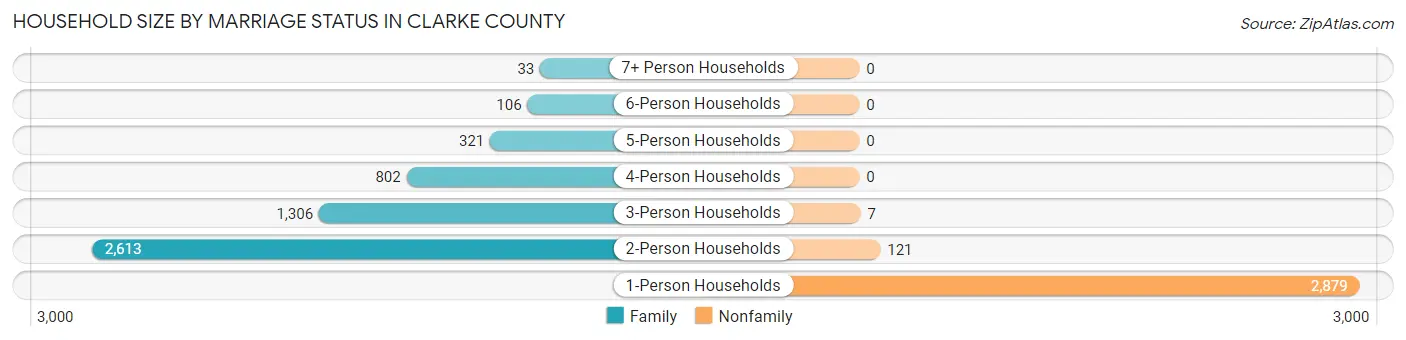
Household Size by Marriage Status in Clarke County
Out of a total of 8,188 households in Clarke County, 5,181 (63.3%) are family households, while 3,007 (36.7%) are nonfamily households. The most numerous type of family households are 2-person households, comprising 2,613, and the most common type of nonfamily households are 1-person households, comprising 2,879.
| Household Size | Family Households | Nonfamily Households |
| 1-Person Households | - | 2,879 (35.2%) |
| 2-Person Households | 2,613 (31.9%) | 121 (1.5%) |
| 3-Person Households | 1,306 (16.0%) | 7 (0.1%) |
| 4-Person Households | 802 (9.8%) | 0 (0.0%) |
| 5-Person Households | 321 (3.9%) | 0 (0.0%) |
| 6-Person Households | 106 (1.3%) | 0 (0.0%) |
| 7+ Person Households | 33 (0.4%) | 0 (0.0%) |
| Total | 5,181 (63.3%) | 3,007 (36.7%) |
Female Fertility in Clarke County
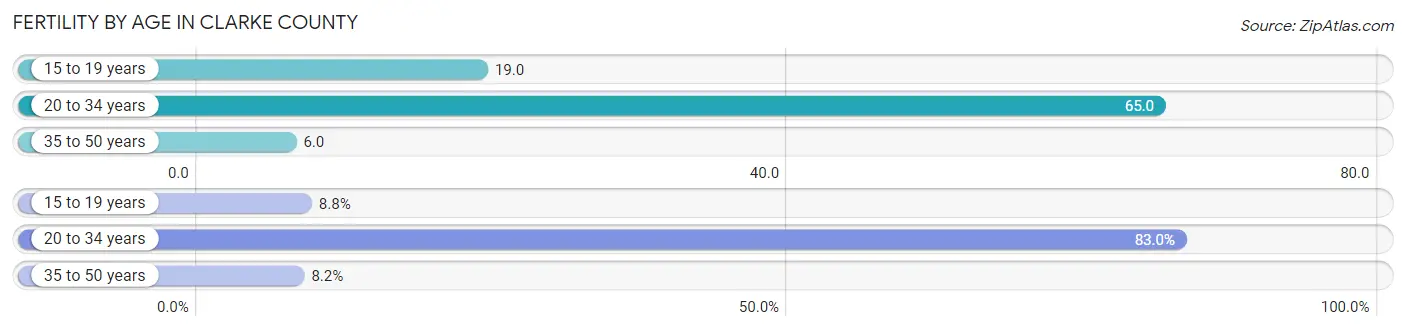
Fertility by Age in Clarke County
Average fertility rate in Clarke County is 32.0 births per 1,000 women. Women in the age bracket of 20 to 34 years have the highest fertility rate with 65.0 births per 1,000 women. Women in the age bracket of 20 to 34 years acount for 83.0% of all women with births.
| Age Bracket | Women with Births | Births / 1,000 Women |
| 15 to 19 years | 14 (8.8%) | 19.0 |
| 20 to 34 years | 132 (83.0%) | 65.0 |
| 35 to 50 years | 13 (8.2%) | 6.0 |
| Total | 159 (100.0%) | 32.0 |
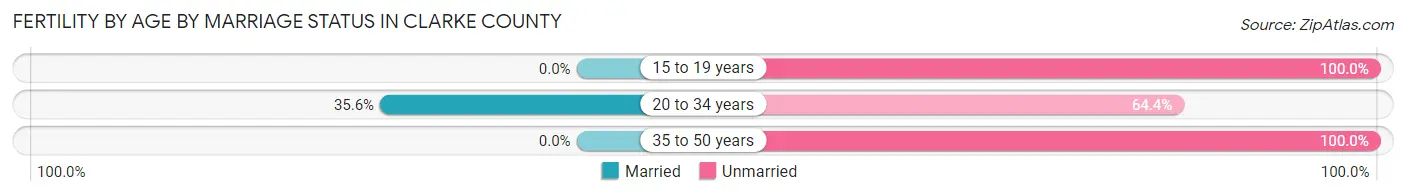
Fertility by Age by Marriage Status in Clarke County
29.6% of women with births (159) in Clarke County are married. The highest percentage of unmarried women with births falls into 15 to 19 years age bracket with 100.0% of them unmarried at the time of birth, while the lowest percentage of unmarried women with births belong to 20 to 34 years age bracket with 64.4% of them unmarried.
| Age Bracket | Married | Unmarried |
| 15 to 19 years | 0 (0.0%) | 14 (100.0%) |
| 20 to 34 years | 47 (35.6%) | 85 (64.4%) |
| 35 to 50 years | 0 (0.0%) | 13 (100.0%) |
| Total | 47 (29.6%) | 112 (70.4%) |
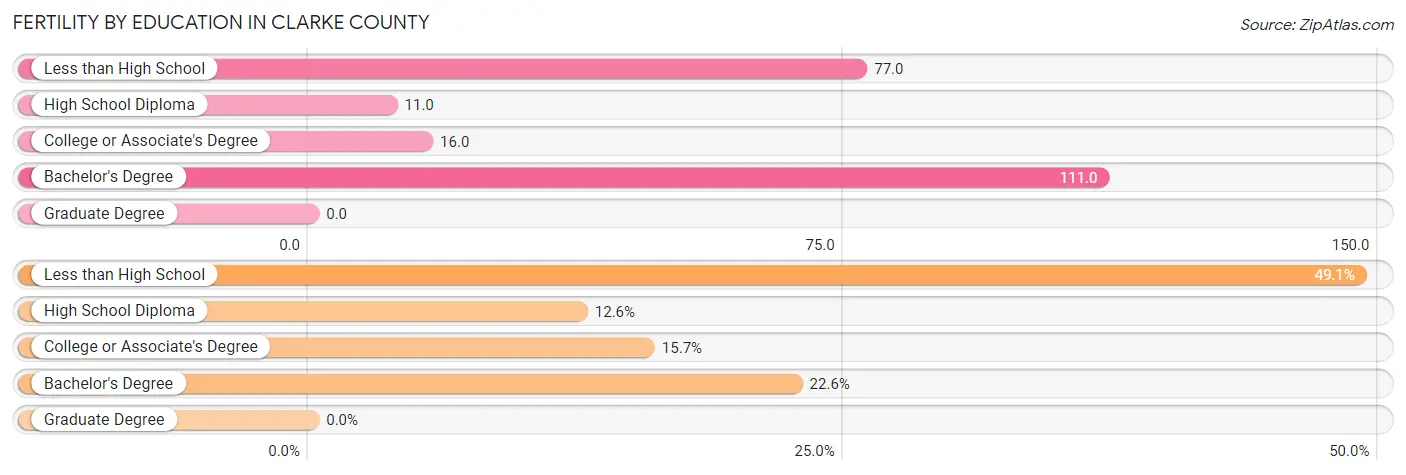
Fertility by Education in Clarke County
| Educational Attainment | Women with Births | Births / 1,000 Women |
| Less than High School | 78 (49.1%) | 77.0 |
| High School Diploma | 20 (12.6%) | 11.0 |
| College or Associate's Degree | 25 (15.7%) | 16.0 |
| Bachelor's Degree | 36 (22.6%) | 111.0 |
| Graduate Degree | 0 (0.0%) | 0.0 |
| Total | 159 (100.0%) | 32.0 |
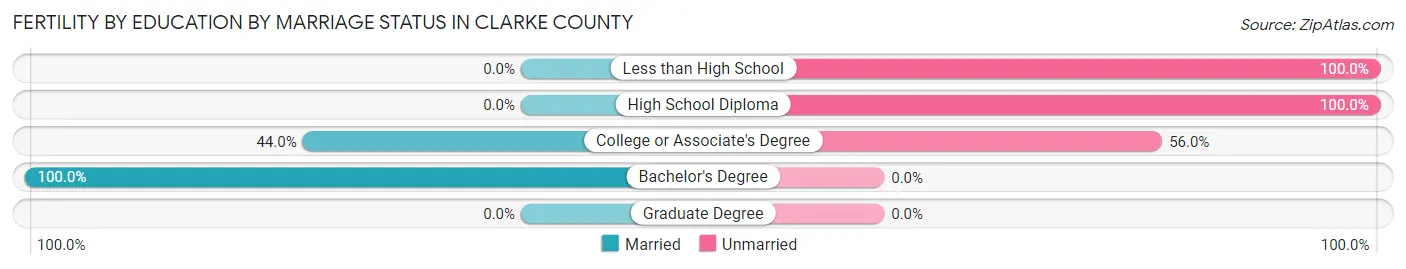
Fertility by Education by Marriage Status in Clarke County
70.4% of women with births in Clarke County are unmarried. Women with the educational attainment of bachelor's degree are most likely to be married with 100.0% of them married at childbirth, while women with the educational attainment of less than high school are least likely to be married with 100.0% of them unmarried at childbirth.
| Educational Attainment | Married | Unmarried |
| Less than High School | 0 (0.0%) | 78 (100.0%) |
| High School Diploma | 0 (0.0%) | 20 (100.0%) |
| College or Associate's Degree | 11 (44.0%) | 14 (56.0%) |
| Bachelor's Degree | 36 (100.0%) | 0 (0.0%) |
| Graduate Degree | 0 (0.0%) | 0 (0.0%) |
| Total | 47 (29.6%) | 112 (70.4%) |
Income in Clarke County
Income Overview in Clarke County
Per Capita Income in Clarke County is $29,310, while median incomes of families and households are $64,688 and $47,549 respectively.
| Characteristic | Number | Measure |
| Per Capita Income | 23,058 | $29,310 |
| Median Family Income | 5,181 | $64,688 |
| Mean Family Income | 5,181 | $92,040 |
| Median Household Income | 8,188 | $47,549 |
| Mean Household Income | 8,188 | $71,413 |
| Income Deficit | 5,181 | $10,612 |
| Wage / Income Gap (%) | 23,058 | 36.51% |
| Wage / Income Gap ($) | 23,058 | 63.49¢ per $1 |
| Gini / Inequality Index | 23,058 | 0.53 |
Earnings by Sex in Clarke County
Average Earnings in Clarke County are $33,120, $42,698 for men and $27,108 for women, a difference of 36.5%.
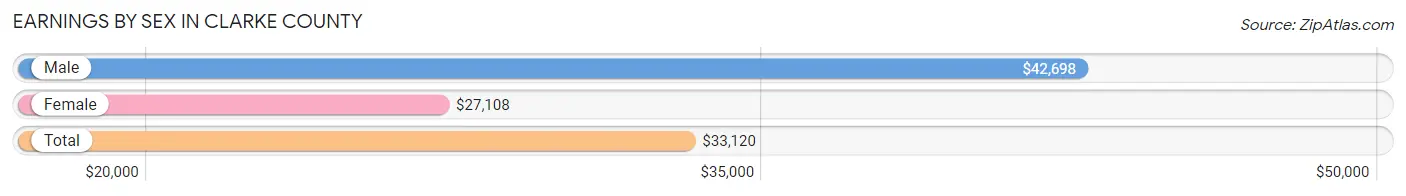
| Sex | Number | Average Earnings |
| Male | 4,542 (50.2%) | $42,698 |
| Female | 4,511 (49.8%) | $27,108 |
| Total | 9,053 (100.0%) | $33,120 |
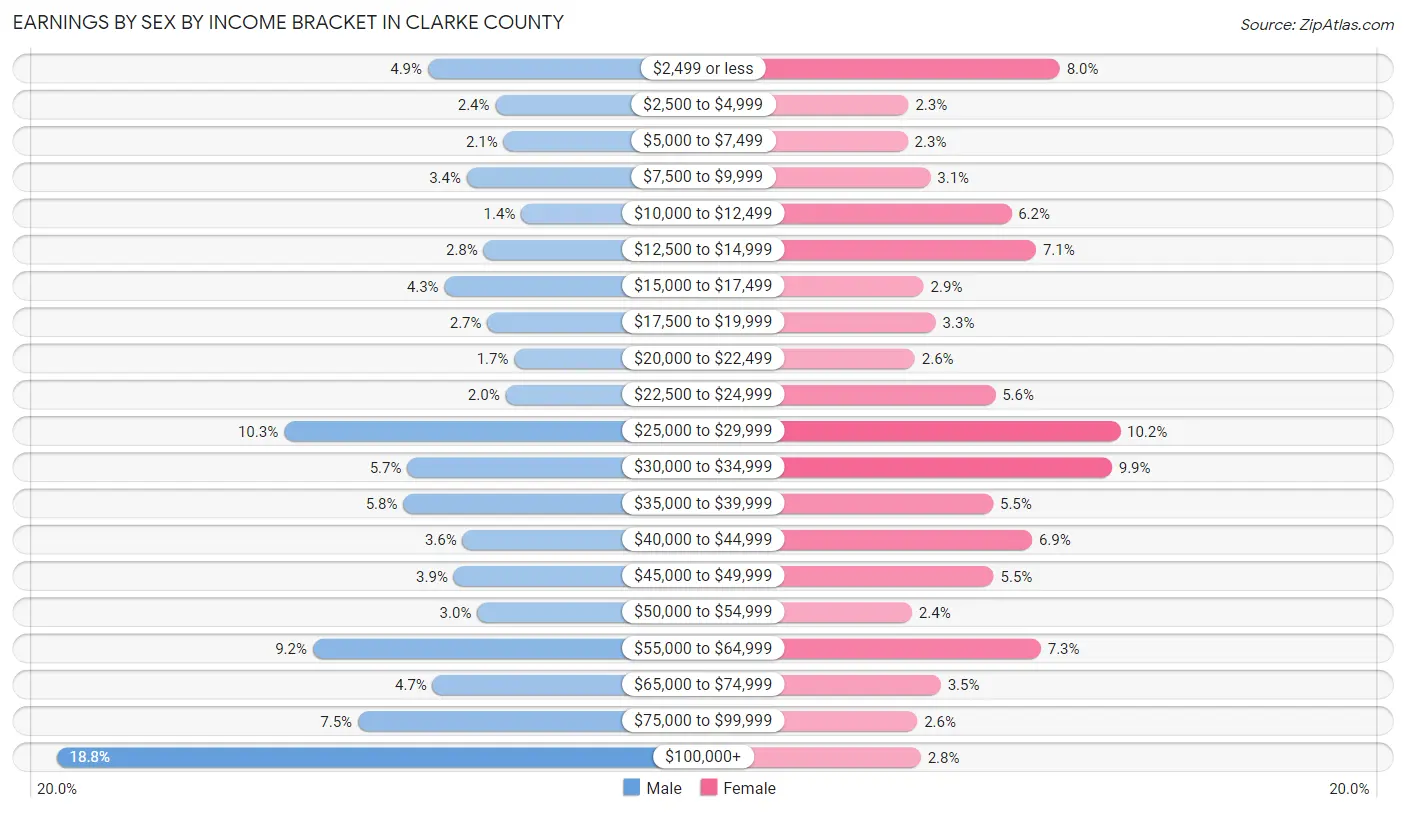
Earnings by Sex by Income Bracket in Clarke County
The most common earnings brackets in Clarke County are $100,000+ for men (854 | 18.8%) and $25,000 to $29,999 for women (462 | 10.2%).
| Income | Male | Female |
| $2,499 or less | 222 (4.9%) | 360 (8.0%) |
| $2,500 to $4,999 | 107 (2.4%) | 104 (2.3%) |
| $5,000 to $7,499 | 93 (2.1%) | 103 (2.3%) |
| $7,500 to $9,999 | 156 (3.4%) | 141 (3.1%) |
| $10,000 to $12,499 | 63 (1.4%) | 278 (6.2%) |
| $12,500 to $14,999 | 127 (2.8%) | 320 (7.1%) |
| $15,000 to $17,499 | 194 (4.3%) | 130 (2.9%) |
| $17,500 to $19,999 | 121 (2.7%) | 150 (3.3%) |
| $20,000 to $22,499 | 75 (1.7%) | 115 (2.5%) |
| $22,500 to $24,999 | 90 (2.0%) | 251 (5.6%) |
| $25,000 to $29,999 | 467 (10.3%) | 462 (10.2%) |
| $30,000 to $34,999 | 257 (5.7%) | 448 (9.9%) |
| $35,000 to $39,999 | 264 (5.8%) | 247 (5.5%) |
| $40,000 to $44,999 | 163 (3.6%) | 313 (6.9%) |
| $45,000 to $49,999 | 178 (3.9%) | 248 (5.5%) |
| $50,000 to $54,999 | 138 (3.0%) | 110 (2.4%) |
| $55,000 to $64,999 | 418 (9.2%) | 328 (7.3%) |
| $65,000 to $74,999 | 214 (4.7%) | 159 (3.5%) |
| $75,000 to $99,999 | 341 (7.5%) | 119 (2.6%) |
| $100,000+ | 854 (18.8%) | 125 (2.8%) |
| Total | 4,542 (100.0%) | 4,511 (100.0%) |
Earnings by Sex by Educational Attainment in Clarke County
Average earnings in Clarke County are $50,000 for men and $31,435 for women, a difference of 37.1%. Men with an educational attainment of graduate degree enjoy the highest average annual earnings of $126,136, while those with less than high school education earn the least with $31,689. Women with an educational attainment of bachelor's degree earn the most with the average annual earnings of $50,800, while those with less than high school education have the smallest earnings of $22,824.

| Educational Attainment | Male Income | Female Income |
| Less than High School | $31,689 | $22,824 |
| High School Diploma | $48,311 | $25,529 |
| College or Associate's Degree | $55,638 | $33,750 |
| Bachelor's Degree | $57,917 | $50,800 |
| Graduate Degree | $126,136 | $42,895 |
| Total | $50,000 | $31,435 |
Family Income in Clarke County
Family Income Brackets in Clarke County
According to the Clarke County family income data, there are 984 families falling into the $50,000 to $74,999 income range, which is the most common income bracket and makes up 19.0% of all families. Conversely, the less than $10,000 income bracket is the least frequent group with only 218 families (4.2%) belonging to this category.
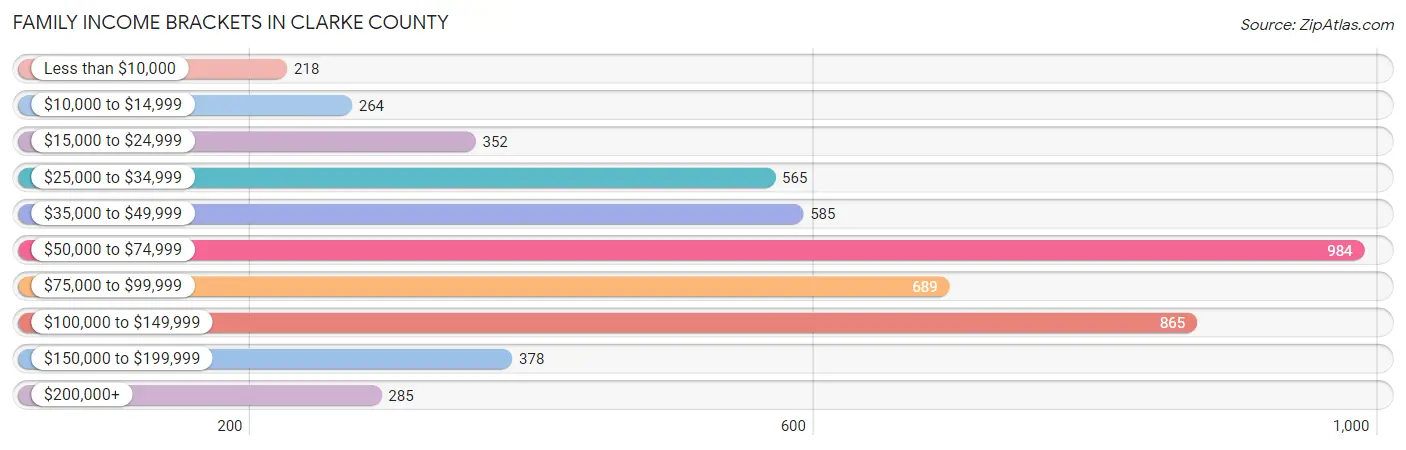
| Income Bracket | # Families | % Families |
| Less than $10,000 | 218 | 4.2% |
| $10,000 to $14,999 | 264 | 5.1% |
| $15,000 to $24,999 | 352 | 6.8% |
| $25,000 to $34,999 | 565 | 10.9% |
| $35,000 to $49,999 | 585 | 11.3% |
| $50,000 to $74,999 | 984 | 19.0% |
| $75,000 to $99,999 | 689 | 13.3% |
| $100,000 to $149,999 | 865 | 16.7% |
| $150,000 to $199,999 | 378 | 7.3% |
| $200,000+ | 285 | 5.5% |
Family Income by Famaliy Size in Clarke County
6-person families (62 | 1.2%) account for the highest median family income in Clarke County with $118,700 per family, while 2-person families (2,764 | 53.3%) have the highest median income of $27,993 per family member.
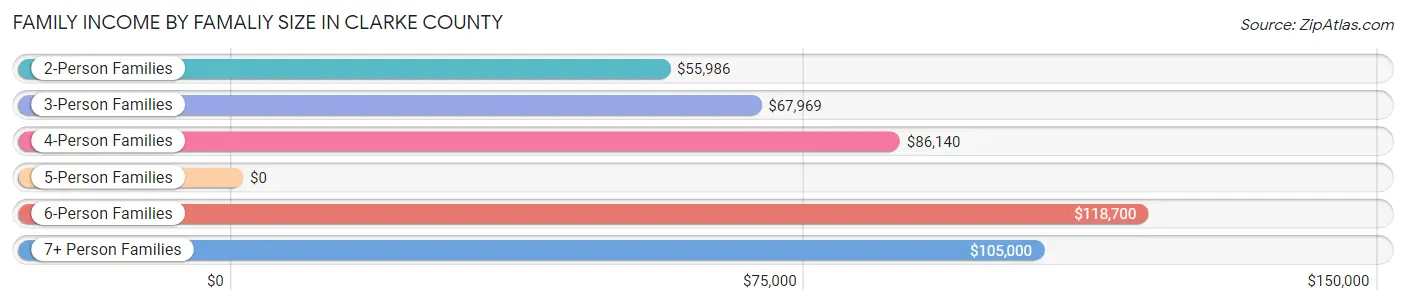
| Income Bracket | # Families | Median Income |
| 2-Person Families | 2,764 (53.3%) | $55,986 |
| 3-Person Families | 1,281 (24.7%) | $67,969 |
| 4-Person Families | 715 (13.8%) | $86,140 |
| 5-Person Families | 333 (6.4%) | $0 |
| 6-Person Families | 62 (1.2%) | $118,700 |
| 7+ Person Families | 26 (0.5%) | $105,000 |
| Total | 5,181 (100.0%) | $64,688 |
Family Income by Number of Earners in Clarke County
The median family income in Clarke County is $64,688, with families comprising 3+ earners (367) having the highest median family income of $119,063, while families with no earners (1,382) have the lowest median family income of $31,667, accounting for 7.1% and 26.7% of families, respectively.
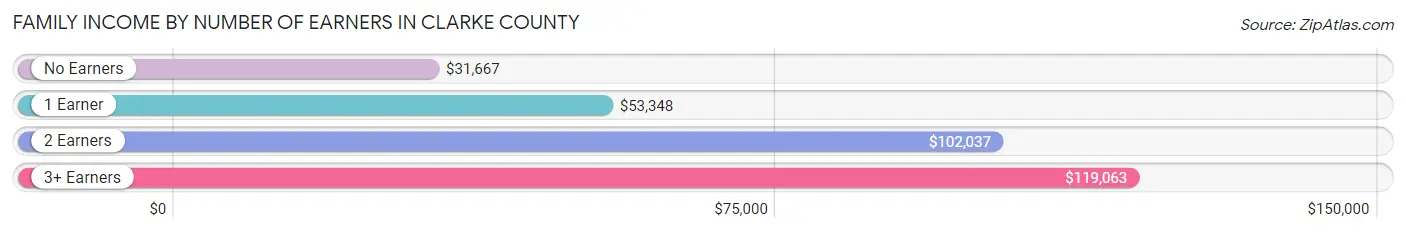
| Number of Earners | # Families | Median Income |
| No Earners | 1,382 (26.7%) | $31,667 |
| 1 Earner | 1,916 (37.0%) | $53,348 |
| 2 Earners | 1,516 (29.3%) | $102,037 |
| 3+ Earners | 367 (7.1%) | $119,063 |
| Total | 5,181 (100.0%) | $64,688 |
Household Income in Clarke County
Household Income Brackets in Clarke County
With 1,400 households falling in the category, the $50,000 to $74,999 income range is the most frequent in Clarke County, accounting for 17.1% of all households. In contrast, only 287 households (3.5%) fall into the $200,000+ income bracket, making it the least populous group.
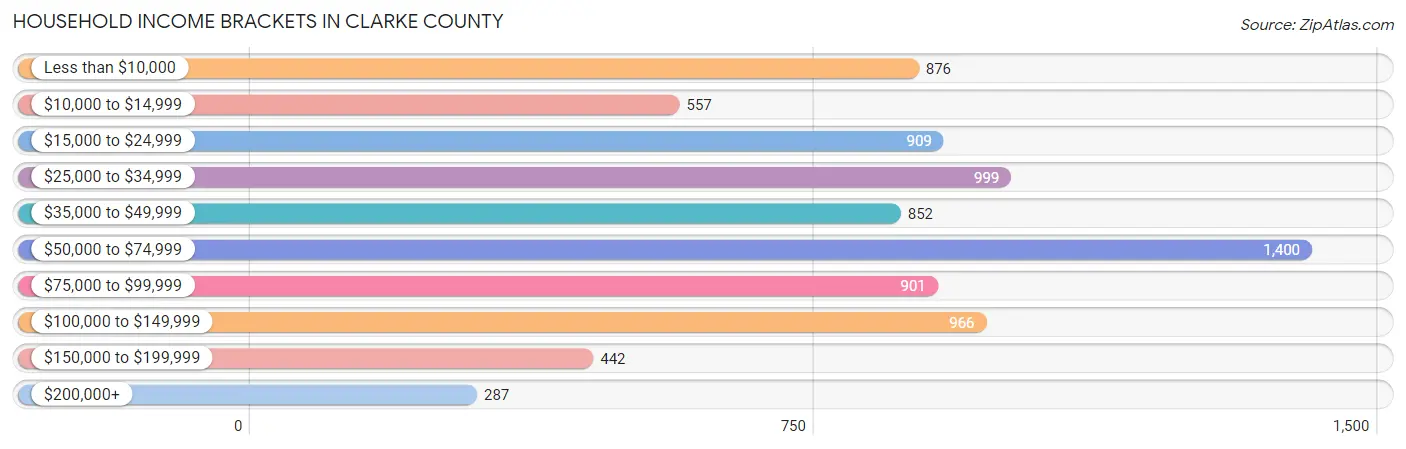
| Income Bracket | # Households | % Households |
| Less than $10,000 | 876 | 10.7% |
| $10,000 to $14,999 | 557 | 6.8% |
| $15,000 to $24,999 | 909 | 11.1% |
| $25,000 to $34,999 | 999 | 12.2% |
| $35,000 to $49,999 | 852 | 10.4% |
| $50,000 to $74,999 | 1,400 | 17.1% |
| $75,000 to $99,999 | 901 | 11.0% |
| $100,000 to $149,999 | 966 | 11.8% |
| $150,000 to $199,999 | 442 | 5.4% |
| $200,000+ | 287 | 3.5% |
Household Income by Householder Age in Clarke County
The median household income in Clarke County is $47,549, with the highest median household income of $54,723 found in the 45 to 64 years age bracket for the primary householder. A total of 3,273 households (40.0%) fall into this category. Meanwhile, the 15 to 24 years age bracket for the primary householder has the lowest median household income of $30,625, with 156 households (1.9%) in this group.

| Income Bracket | # Households | Median Income |
| 15 to 24 Years | 156 (1.9%) | $30,625 |
| 25 to 44 Years | 2,097 (25.6%) | $41,508 |
| 45 to 64 Years | 3,273 (40.0%) | $54,723 |
| 65+ Years | 2,662 (32.5%) | $42,583 |
| Total | 8,188 (100.0%) | $47,549 |
Poverty in Clarke County
Income Below Poverty by Sex and Age in Clarke County
With 21.5% poverty level for males and 23.1% for females among the residents of Clarke County, 5 year old males and 25 to 34 year old females are the most vulnerable to poverty, with 24 males (72.7%) and 553 females (41.0%) in their respective age groups living below the poverty level.

| Age Bracket | Male | Female |
| Under 5 Years | 330 (41.8%) | 184 (30.1%) |
| 5 Years | 24 (72.7%) | 0 (0.0%) |
| 6 to 11 Years | 209 (23.2%) | 297 (35.4%) |
| 12 to 14 Years | 191 (47.0%) | 154 (38.3%) |
| 15 Years | 8 (5.0%) | 36 (30.0%) |
| 16 and 17 Years | 46 (15.2%) | 56 (17.1%) |
| 18 to 24 Years | 148 (14.9%) | 255 (26.5%) |
| 25 to 34 Years | 313 (26.6%) | 553 (41.0%) |
| 35 to 44 Years | 272 (22.3%) | 323 (23.7%) |
| 45 to 54 Years | 277 (20.7%) | 144 (9.5%) |
| 55 to 64 Years | 278 (17.8%) | 332 (19.6%) |
| 65 to 74 Years | 136 (11.3%) | 225 (16.9%) |
| 75 Years and over | 114 (13.9%) | 168 (14.6%) |
| Total | 2,346 (21.5%) | 2,727 (23.1%) |
Income Above Poverty by Sex and Age in Clarke County
According to the poverty statistics in Clarke County, males aged 15 years and females aged 5 years are the age groups that are most secure financially, with 95.0% of males and 100.0% of females in these age groups living above the poverty line.
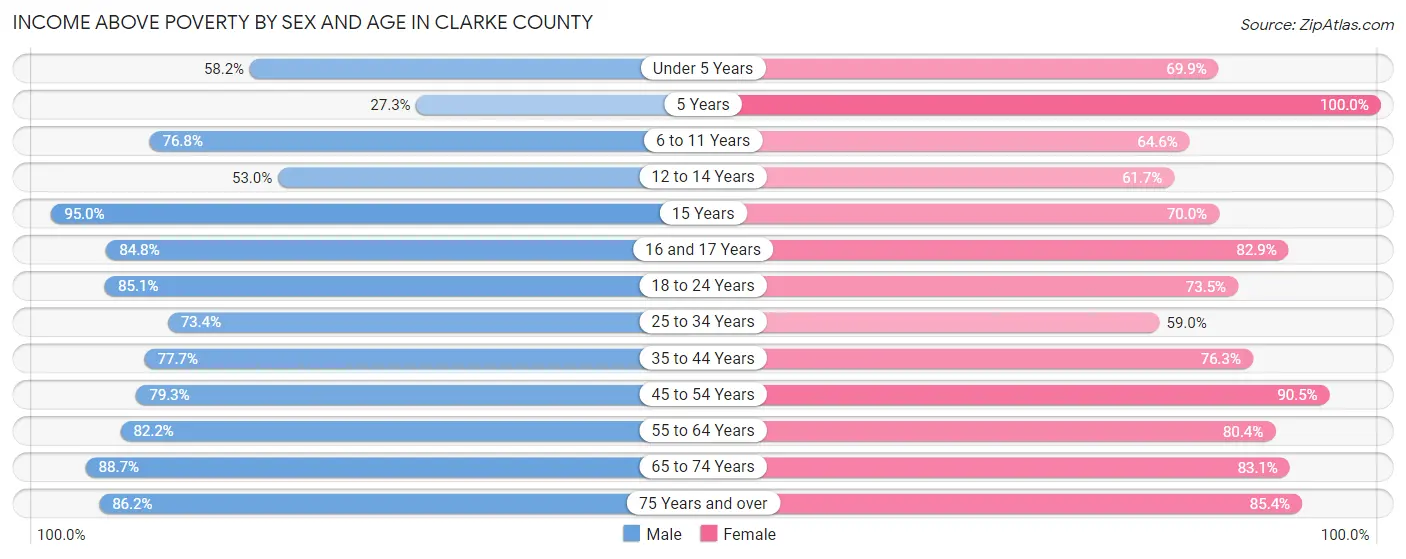
| Age Bracket | Male | Female |
| Under 5 Years | 459 (58.2%) | 428 (69.9%) |
| 5 Years | 9 (27.3%) | 115 (100.0%) |
| 6 to 11 Years | 692 (76.8%) | 541 (64.6%) |
| 12 to 14 Years | 215 (53.0%) | 248 (61.7%) |
| 15 Years | 153 (95.0%) | 84 (70.0%) |
| 16 and 17 Years | 257 (84.8%) | 272 (82.9%) |
| 18 to 24 Years | 842 (85.1%) | 708 (73.5%) |
| 25 to 34 Years | 865 (73.4%) | 795 (59.0%) |
| 35 to 44 Years | 949 (77.7%) | 1,039 (76.3%) |
| 45 to 54 Years | 1,058 (79.2%) | 1,373 (90.5%) |
| 55 to 64 Years | 1,284 (82.2%) | 1,364 (80.4%) |
| 65 to 74 Years | 1,063 (88.7%) | 1,109 (83.1%) |
| 75 Years and over | 709 (86.2%) | 983 (85.4%) |
| Total | 8,555 (78.5%) | 9,059 (76.9%) |
Income Below Poverty Among Married-Couple Families in Clarke County
The poverty statistics for married-couple families in Clarke County show that 7.8% or 267 of the total 3,442 families live below the poverty line. Families with 3 or 4 children have the highest poverty rate of 46.6%, comprising of 76 families. On the other hand, families with 1 or 2 children have the lowest poverty rate of 3.7%, which includes 35 families.

| Children | Above Poverty | Below Poverty |
| No Children | 2,179 (93.3%) | 156 (6.7%) |
| 1 or 2 Children | 909 (96.3%) | 35 (3.7%) |
| 3 or 4 Children | 87 (53.4%) | 76 (46.6%) |
| 5 or more Children | 0 (0.0%) | 0 (0.0%) |
| Total | 3,175 (92.2%) | 267 (7.8%) |
Income Below Poverty Among Single-Parent Households in Clarke County
According to the poverty data in Clarke County, 27.1% or 148 single-father households and 32.0% or 381 single-mother households are living below the poverty line. Among single-father households, those with 3 or 4 children have the highest poverty rate, with 28 households (100.0%) experiencing poverty. Likewise, among single-mother households, those with 5 or more children have the highest poverty rate, with 7 households (100.0%) falling below the poverty line.
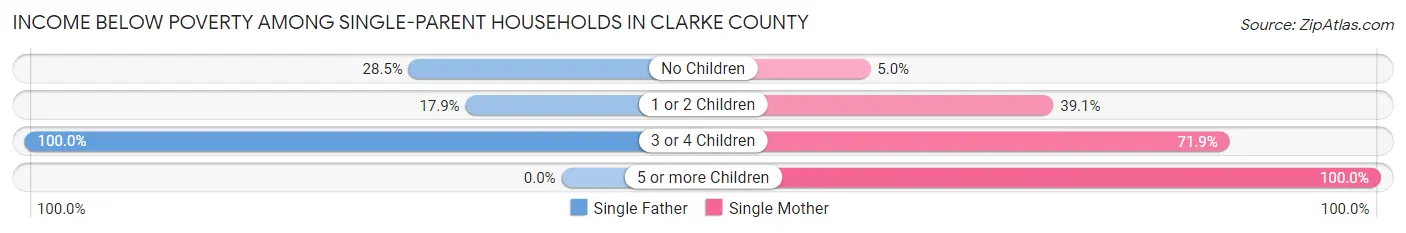
| Children | Single Father | Single Mother |
| No Children | 76 (28.5%) | 16 (5.0%) |
| 1 or 2 Children | 44 (17.9%) | 312 (39.1%) |
| 3 or 4 Children | 28 (100.0%) | 46 (71.9%) |
| 5 or more Children | 0 (0.0%) | 7 (100.0%) |
| Total | 148 (27.1%) | 381 (32.0%) |
Income Below Poverty Among Married-Couple vs Single-Parent Households in Clarke County
The poverty data for Clarke County shows that 267 of the married-couple family households (7.8%) and 529 of the single-parent households (30.4%) are living below the poverty level. Within the married-couple family households, those with 3 or 4 children have the highest poverty rate, with 76 households (46.6%) falling below the poverty line. Among the single-parent households, those with 3 or 4 children have the highest poverty rate, with 74 household (80.4%) living below poverty.
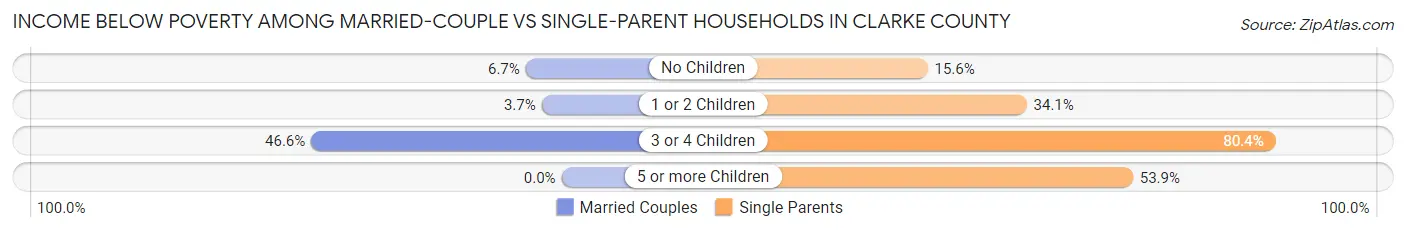
| Children | Married-Couple Families | Single-Parent Households |
| No Children | 156 (6.7%) | 92 (15.6%) |
| 1 or 2 Children | 35 (3.7%) | 356 (34.1%) |
| 3 or 4 Children | 76 (46.6%) | 74 (80.4%) |
| 5 or more Children | 0 (0.0%) | 7 (53.8%) |
| Total | 267 (7.8%) | 529 (30.4%) |
Employment Characteristics in Clarke County
Employment by Class of Employer in Clarke County
Among the 7,694 employed individuals in Clarke County, private company employees (5,638 | 73.3%), self-employed (not incorporated) (520 | 6.8%), and local government employees (491 | 6.4%) make up the most common classes of employment.
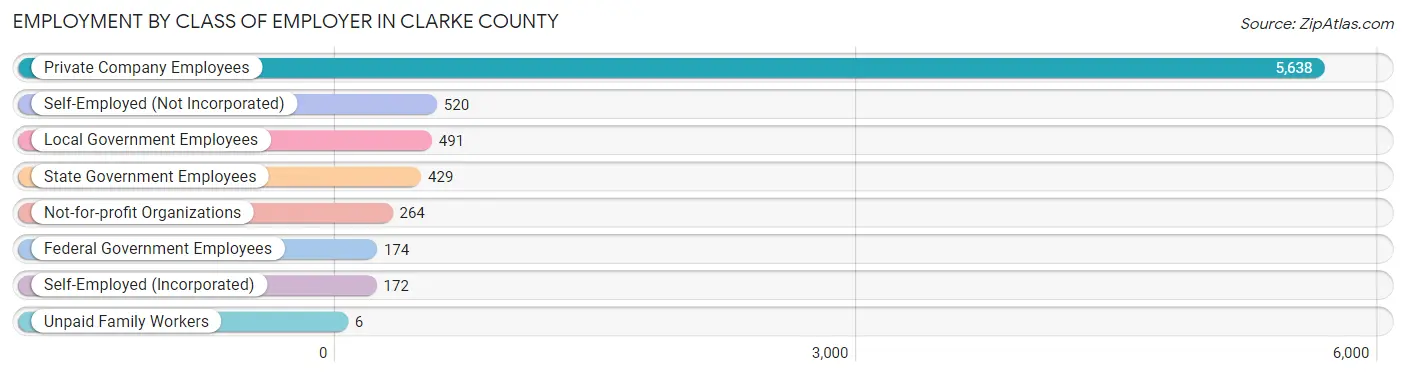
| Employer Class | # Employees | % Employees |
| Private Company Employees | 5,638 | 73.3% |
| Self-Employed (Incorporated) | 172 | 2.2% |
| Self-Employed (Not Incorporated) | 520 | 6.8% |
| Not-for-profit Organizations | 264 | 3.4% |
| Local Government Employees | 491 | 6.4% |
| State Government Employees | 429 | 5.6% |
| Federal Government Employees | 174 | 2.3% |
| Unpaid Family Workers | 6 | 0.1% |
| Total | 7,694 | 100.0% |
Employment Status by Age in Clarke County
According to the labor force statistics for Clarke County, out of the total population over 16 years of age (18,614), 48.2% or 8,972 individuals are in the labor force, with 12.5% or 1,122 of them unemployed. The age group with the highest labor force participation rate is 25 to 29 years, with 75.1% or 1,018 individuals in the labor force. Within the labor force, the 16 to 19 years age range has the highest percentage of unemployed individuals, with 50.3% or 170 of them being unemployed.
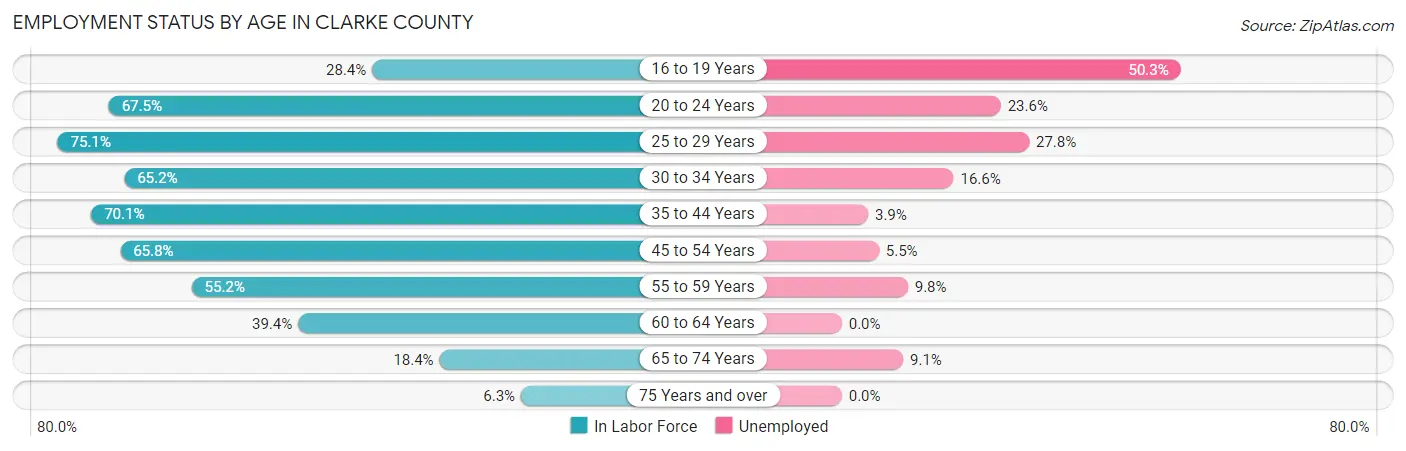
| Age Bracket | In Labor Force | Unemployed |
| 16 to 19 Years | 338 (28.4%) | 170 (50.3%) |
| 20 to 24 Years | 950 (67.5%) | 224 (23.6%) |
| 25 to 29 Years | 1,018 (75.1%) | 283 (27.8%) |
| 30 to 34 Years | 788 (65.2%) | 131 (16.6%) |
| 35 to 44 Years | 1,824 (70.1%) | 71 (3.9%) |
| 45 to 54 Years | 1,891 (65.8%) | 104 (5.5%) |
| 55 to 59 Years | 917 (55.2%) | 90 (9.8%) |
| 60 to 64 Years | 636 (39.4%) | 0 (0.0%) |
| 65 to 74 Years | 472 (18.4%) | 43 (9.1%) |
| 75 Years and over | 135 (6.3%) | 0 (0.0%) |
| Total | 8,972 (48.2%) | 1,122 (12.5%) |
Employment Status by Educational Attainment in Clarke County
According to labor force statistics for Clarke County, 62.5% of individuals (7,072) out of the total population between 25 and 64 years of age (11,315) are in the labor force, with 9.6% or 679 of them being unemployed. The group with the highest labor force participation rate are those with the educational attainment of bachelor's degree or higher, with 81.4% or 1,136 individuals in the labor force. Within the labor force, individuals with less than high school education have the highest percentage of unemployment, with 35.0% or 177 of them being unemployed.
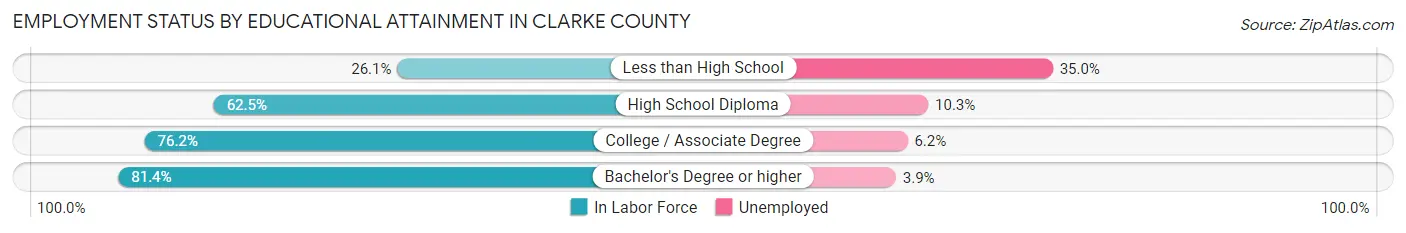
| Educational Attainment | In Labor Force | Unemployed |
| Less than High School | 507 (26.1%) | 680 (35.0%) |
| High School Diploma | 2,970 (62.5%) | 489 (10.3%) |
| College / Associate Degree | 2,457 (76.2%) | 200 (6.2%) |
| Bachelor's Degree or higher | 1,136 (81.4%) | 54 (3.9%) |
| Total | 7,072 (62.5%) | 1,086 (9.6%) |
Employment Occupations by Sex in Clarke County
Management, Business, Science and Arts Occupations
The most common Management, Business, Science and Arts occupations in Clarke County are Community & Social Service (752 | 9.6%), Health Diagnosing & Treating (580 | 7.4%), Education Instruction & Library (478 | 6.1%), Management (357 | 4.5%), and Health Technologists (261 | 3.3%).
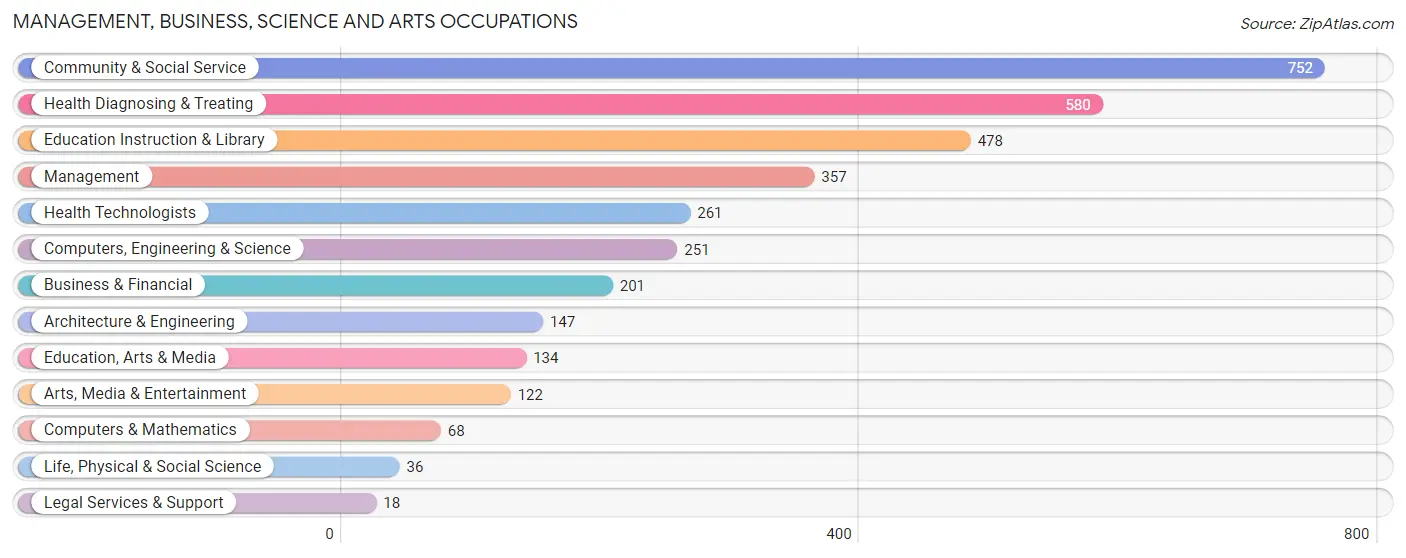
Management, Business, Science and Arts Occupations by Sex
Within the Management, Business, Science and Arts occupations in Clarke County, the most male-oriented occupations are Architecture & Engineering (100.0%), Legal Services & Support (100.0%), and Life, Physical & Social Science (91.7%), while the most female-oriented occupations are Computers & Mathematics (91.2%), Education Instruction & Library (85.2%), and Business & Financial (84.6%).

| Occupation | Male | Female |
| Management | 198 (55.5%) | 159 (44.5%) |
| Business & Financial | 31 (15.4%) | 170 (84.6%) |
| Computers, Engineering & Science | 186 (74.1%) | 65 (25.9%) |
| Computers & Mathematics | 6 (8.8%) | 62 (91.2%) |
| Architecture & Engineering | 147 (100.0%) | 0 (0.0%) |
| Life, Physical & Social Science | 33 (91.7%) | 3 (8.3%) |
| Community & Social Service | 218 (29.0%) | 534 (71.0%) |
| Education, Arts & Media | 42 (31.3%) | 92 (68.7%) |
| Legal Services & Support | 18 (100.0%) | 0 (0.0%) |
| Education Instruction & Library | 71 (14.8%) | 407 (85.2%) |
| Arts, Media & Entertainment | 87 (71.3%) | 35 (28.7%) |
| Health Diagnosing & Treating | 122 (21.0%) | 458 (79.0%) |
| Health Technologists | 109 (41.8%) | 152 (58.2%) |
| Total (Category) | 755 (35.3%) | 1,386 (64.7%) |
| Total (Overall) | 3,878 (49.5%) | 3,963 (50.5%) |
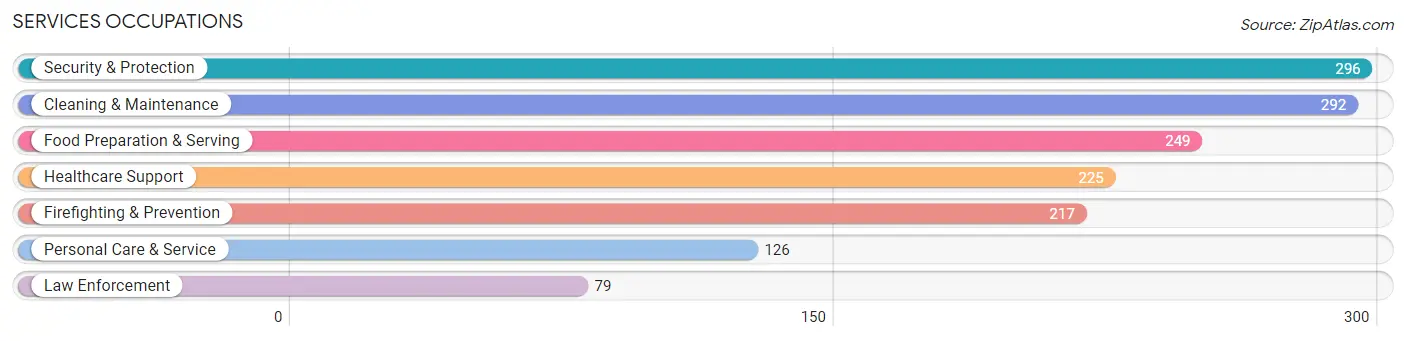
Services Occupations
The most common Services occupations in Clarke County are Security & Protection (296 | 3.8%), Cleaning & Maintenance (292 | 3.7%), Food Preparation & Serving (249 | 3.2%), Healthcare Support (225 | 2.9%), and Firefighting & Prevention (217 | 2.8%).
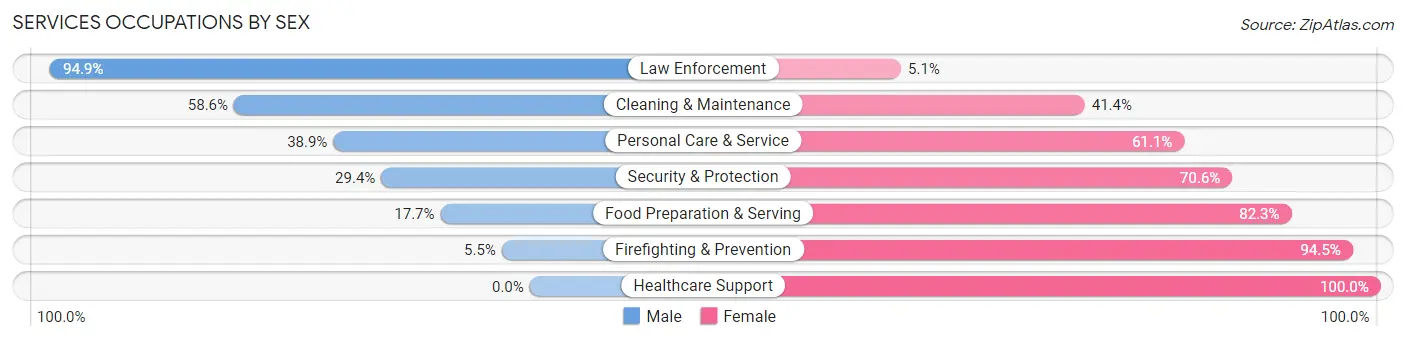
Services Occupations by Sex
Within the Services occupations in Clarke County, the most male-oriented occupations are Law Enforcement (94.9%), Cleaning & Maintenance (58.6%), and Personal Care & Service (38.9%), while the most female-oriented occupations are Healthcare Support (100.0%), Firefighting & Prevention (94.5%), and Food Preparation & Serving (82.3%).
| Occupation | Male | Female |
| Healthcare Support | 0 (0.0%) | 225 (100.0%) |
| Security & Protection | 87 (29.4%) | 209 (70.6%) |
| Firefighting & Prevention | 12 (5.5%) | 205 (94.5%) |
| Law Enforcement | 75 (94.9%) | 4 (5.1%) |
| Food Preparation & Serving | 44 (17.7%) | 205 (82.3%) |
| Cleaning & Maintenance | 171 (58.6%) | 121 (41.4%) |
| Personal Care & Service | 49 (38.9%) | 77 (61.1%) |
| Total (Category) | 351 (29.5%) | 837 (70.5%) |
| Total (Overall) | 3,878 (49.5%) | 3,963 (50.5%) |
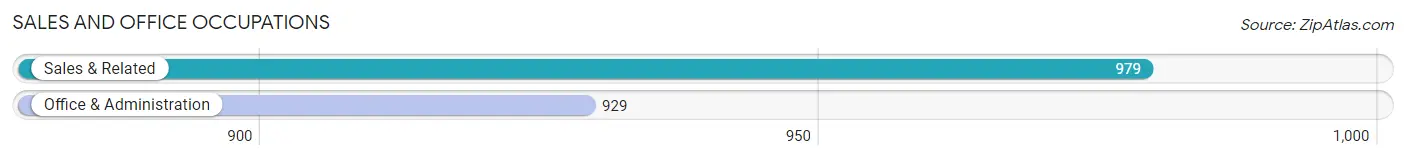
Sales and Office Occupations
The most common Sales and Office occupations in Clarke County are Sales & Related (979 | 12.5%), and Office & Administration (929 | 11.8%).
Sales and Office Occupations by Sex
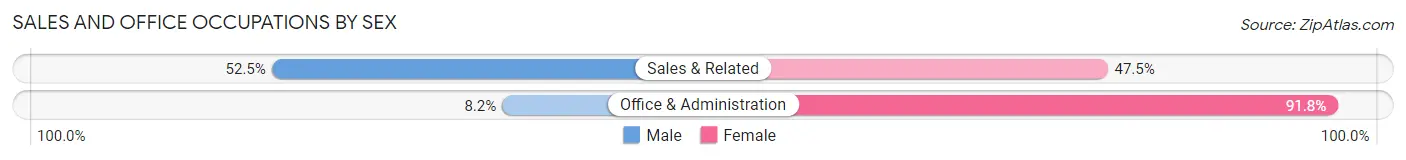
| Occupation | Male | Female |
| Sales & Related | 514 (52.5%) | 465 (47.5%) |
| Office & Administration | 76 (8.2%) | 853 (91.8%) |
| Total (Category) | 590 (30.9%) | 1,318 (69.1%) |
| Total (Overall) | 3,878 (49.5%) | 3,963 (50.5%) |
Natural Resources, Construction and Maintenance Occupations
The most common Natural Resources, Construction and Maintenance occupations in Clarke County are Installation, Maintenance & Repair (423 | 5.4%), Construction & Extraction (307 | 3.9%), and Farming, Fishing & Forestry (162 | 2.1%).
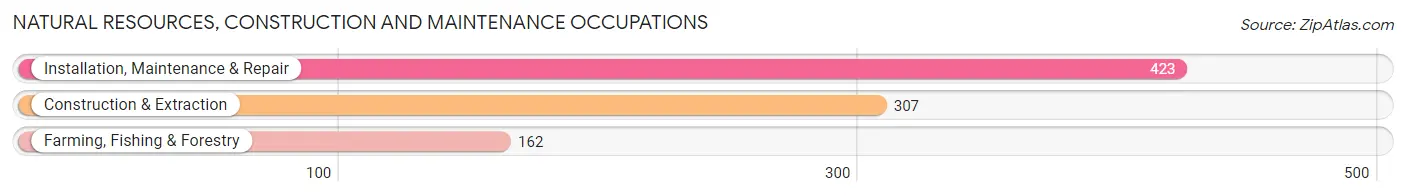
Natural Resources, Construction and Maintenance Occupations by Sex

| Occupation | Male | Female |
| Farming, Fishing & Forestry | 150 (92.6%) | 12 (7.4%) |
| Construction & Extraction | 302 (98.4%) | 5 (1.6%) |
| Installation, Maintenance & Repair | 399 (94.3%) | 24 (5.7%) |
| Total (Category) | 851 (95.4%) | 41 (4.6%) |
| Total (Overall) | 3,878 (49.5%) | 3,963 (50.5%) |
Production, Transportation and Moving Occupations
The most common Production, Transportation and Moving occupations in Clarke County are Production (768 | 9.8%), Transportation (520 | 6.6%), and Material Moving (424 | 5.4%).
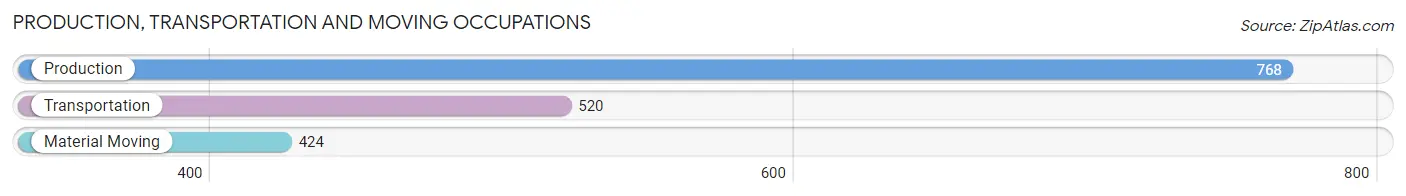
Production, Transportation and Moving Occupations by Sex

| Occupation | Male | Female |
| Production | 648 (84.4%) | 120 (15.6%) |
| Transportation | 448 (86.2%) | 72 (13.9%) |
| Material Moving | 235 (55.4%) | 189 (44.6%) |
| Total (Category) | 1,331 (77.7%) | 381 (22.3%) |
| Total (Overall) | 3,878 (49.5%) | 3,963 (50.5%) |
Employment Industries by Sex in Clarke County
Employment Industries in Clarke County
The major employment industries in Clarke County include Manufacturing (1,224 | 15.6%), Retail Trade (1,115 | 14.2%), Health Care & Social Assistance (1,094 | 14.0%), Educational Services (587 | 7.5%), and Construction (542 | 6.9%).

Employment Industries by Sex in Clarke County
The Clarke County industries that see more men than women are Agriculture, Fishing & Hunting (92.7%), Manufacturing (82.3%), and Transportation & Warehousing (74.6%), whereas the industries that tend to have a higher number of women are Mining, Quarrying, & Extraction (100.0%), Arts, Entertainment & Recreation (88.2%), and Educational Services (86.5%).
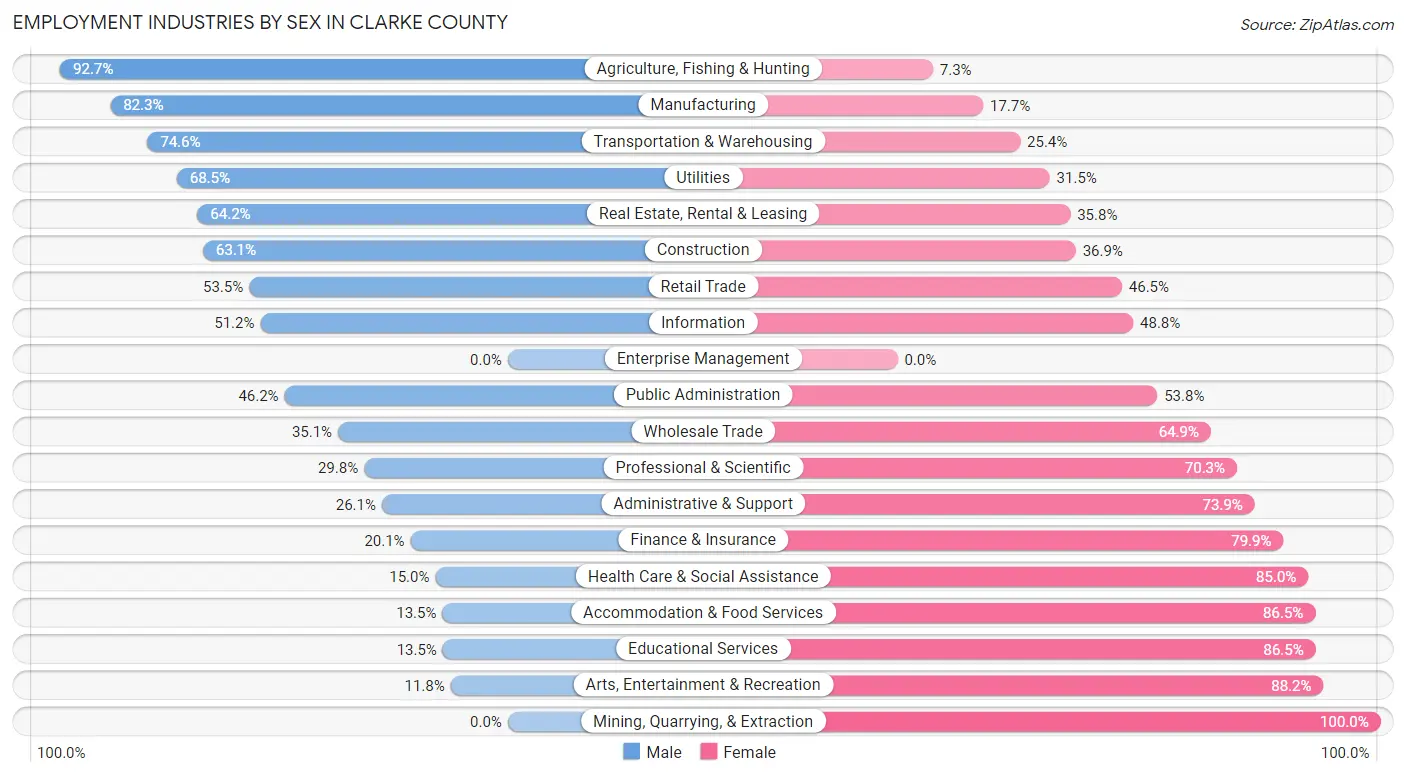
| Industry | Male | Female |
| Agriculture, Fishing & Hunting | 278 (92.7%) | 22 (7.3%) |
| Mining, Quarrying, & Extraction | 0 (0.0%) | 20 (100.0%) |
| Construction | 342 (63.1%) | 200 (36.9%) |
| Manufacturing | 1,007 (82.3%) | 217 (17.7%) |
| Wholesale Trade | 26 (35.1%) | 48 (64.9%) |
| Retail Trade | 597 (53.5%) | 518 (46.5%) |
| Transportation & Warehousing | 370 (74.6%) | 126 (25.4%) |
| Utilities | 150 (68.5%) | 69 (31.5%) |
| Information | 21 (51.2%) | 20 (48.8%) |
| Finance & Insurance | 57 (20.1%) | 226 (79.9%) |
| Real Estate, Rental & Leasing | 158 (64.2%) | 88 (35.8%) |
| Professional & Scientific | 36 (29.7%) | 85 (70.3%) |
| Enterprise Management | 0 (0.0%) | 0 (0.0%) |
| Administrative & Support | 74 (26.1%) | 210 (73.9%) |
| Educational Services | 79 (13.5%) | 508 (86.5%) |
| Health Care & Social Assistance | 164 (15.0%) | 930 (85.0%) |
| Arts, Entertainment & Recreation | 9 (11.8%) | 67 (88.2%) |
| Accommodation & Food Services | 52 (13.5%) | 332 (86.5%) |
| Public Administration | 116 (46.2%) | 135 (53.8%) |
| Total | 3,878 (49.5%) | 3,963 (50.5%) |
Education in Clarke County
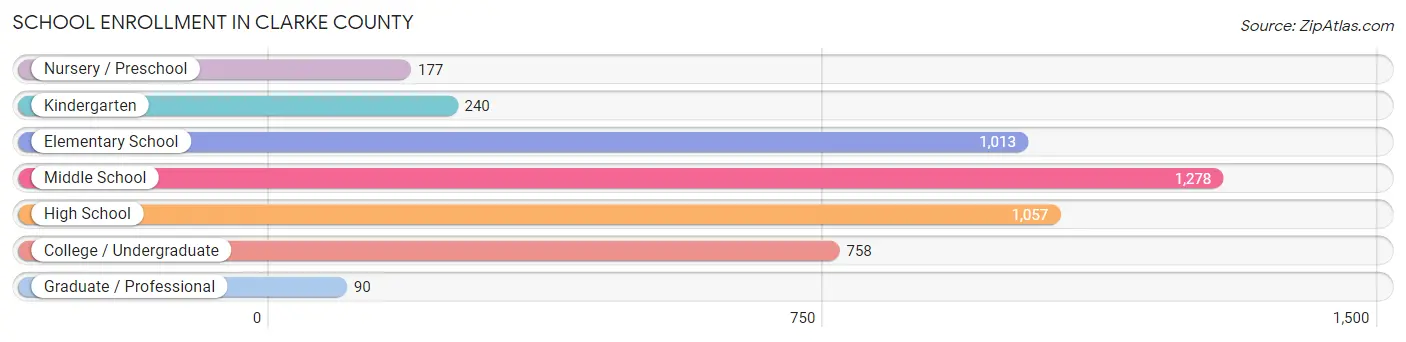
School Enrollment in Clarke County
The most common levels of schooling among the 4,613 students in Clarke County are middle school (1,278 | 27.7%), high school (1,057 | 22.9%), and elementary school (1,013 | 22.0%).
| School Level | # Students | % Students |
| Nursery / Preschool | 177 | 3.8% |
| Kindergarten | 240 | 5.2% |
| Elementary School | 1,013 | 22.0% |
| Middle School | 1,278 | 27.7% |
| High School | 1,057 | 22.9% |
| College / Undergraduate | 758 | 16.4% |
| Graduate / Professional | 90 | 1.9% |
| Total | 4,613 | 100.0% |
School Enrollment by Age by Funding Source in Clarke County
Out of a total of 4,613 students who are enrolled in schools in Clarke County, 678 (14.7%) attend a private institution, while the remaining 3,935 (85.3%) are enrolled in public schools. The age group of 15 to 17 year olds has the highest likelihood of being enrolled in private schools, with 205 (24.4% in the age bracket) enrolled. Conversely, the age group of 20 to 24 year olds has the lowest likelihood of being enrolled in a private school, with 369 (100.0% in the age bracket) attending a public institution.

| Age Bracket | Public School | Private School |
| 3 to 4 Year Olds | 140 (80.5%) | 34 (19.5%) |
| 5 to 9 Year Old | 827 (83.4%) | 165 (16.6%) |
| 10 to 14 Year Olds | 1,293 (84.2%) | 242 (15.8%) |
| 15 to 17 Year Olds | 634 (75.6%) | 205 (24.4%) |
| 18 to 19 Year Olds | 250 (97.3%) | 7 (2.7%) |
| 20 to 24 Year Olds | 369 (100.0%) | 0 (0.0%) |
| 25 to 34 Year Olds | 124 (85.5%) | 21 (14.5%) |
| 35 Years and over | 300 (99.3%) | 2 (0.7%) |
| Total | 3,935 (85.3%) | 678 (14.7%) |
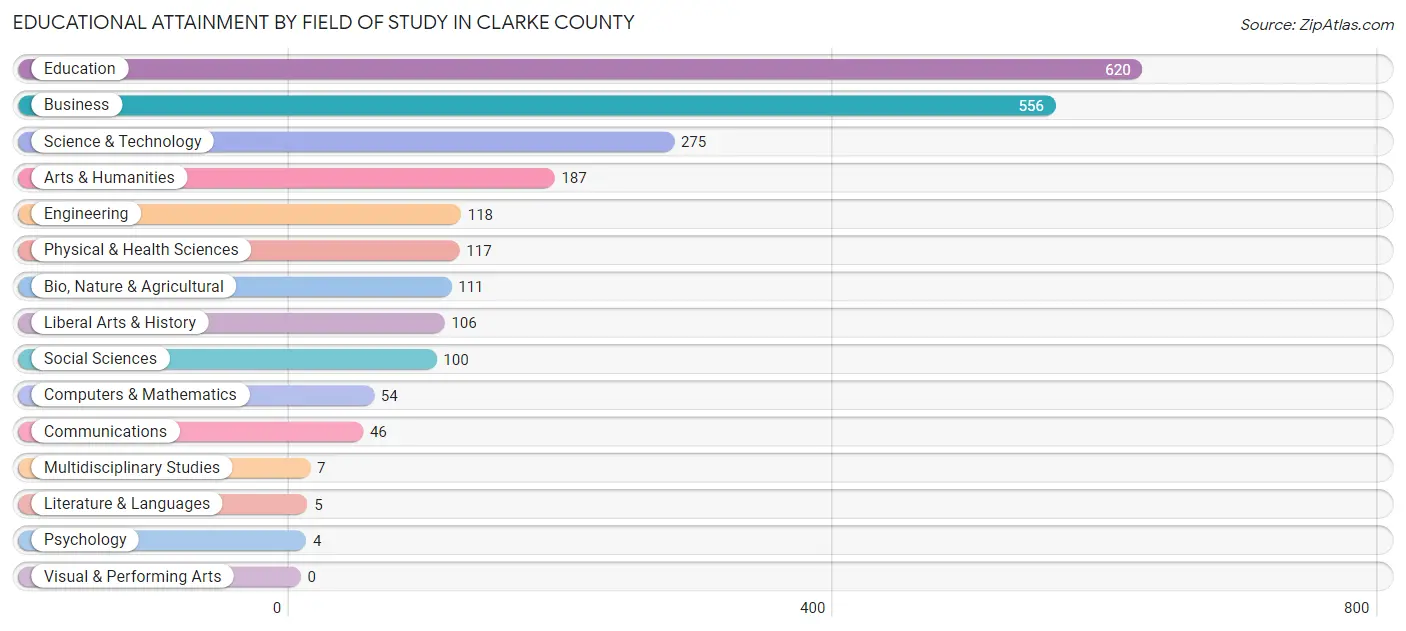
Educational Attainment by Field of Study in Clarke County
Education (620 | 26.9%), business (556 | 24.1%), science & technology (275 | 11.9%), arts & humanities (187 | 8.1%), and engineering (118 | 5.1%) are the most common fields of study among 2,306 individuals in Clarke County who have obtained a bachelor's degree or higher.
| Field of Study | # Graduates | % Graduates |
| Computers & Mathematics | 54 | 2.3% |
| Bio, Nature & Agricultural | 111 | 4.8% |
| Physical & Health Sciences | 117 | 5.1% |
| Psychology | 4 | 0.2% |
| Social Sciences | 100 | 4.3% |
| Engineering | 118 | 5.1% |
| Multidisciplinary Studies | 7 | 0.3% |
| Science & Technology | 275 | 11.9% |
| Business | 556 | 24.1% |
| Education | 620 | 26.9% |
| Literature & Languages | 5 | 0.2% |
| Liberal Arts & History | 106 | 4.6% |
| Visual & Performing Arts | 0 | 0.0% |
| Communications | 46 | 2.0% |
| Arts & Humanities | 187 | 8.1% |
| Total | 2,306 | 100.0% |
Transportation & Commute in Clarke County
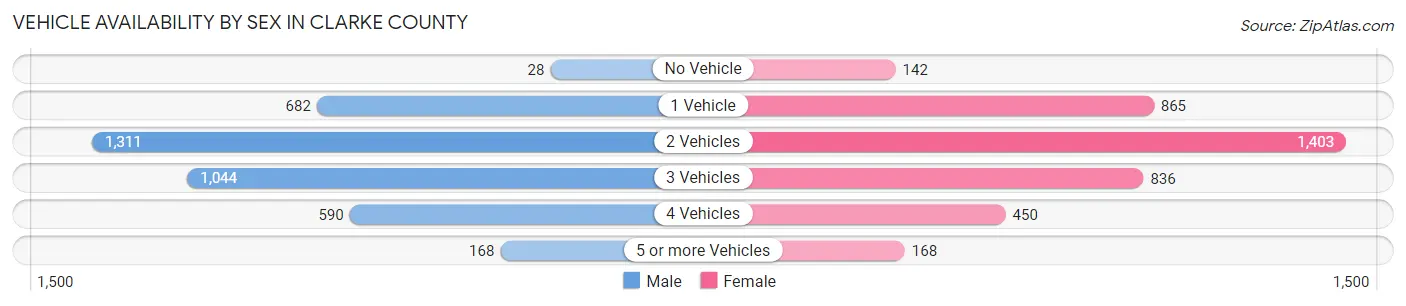
Vehicle Availability by Sex in Clarke County
The most prevalent vehicle ownership categories in Clarke County are males with 2 vehicles (1,311, accounting for 34.3%) and females with 2 vehicles (1,403, making up 33.9%).
| Vehicles Available | Male | Female |
| No Vehicle | 28 (0.7%) | 142 (3.7%) |
| 1 Vehicle | 682 (17.8%) | 865 (22.4%) |
| 2 Vehicles | 1,311 (34.3%) | 1,403 (36.3%) |
| 3 Vehicles | 1,044 (27.3%) | 836 (21.6%) |
| 4 Vehicles | 590 (15.4%) | 450 (11.7%) |
| 5 or more Vehicles | 168 (4.4%) | 168 (4.3%) |
| Total | 3,823 (100.0%) | 3,864 (100.0%) |
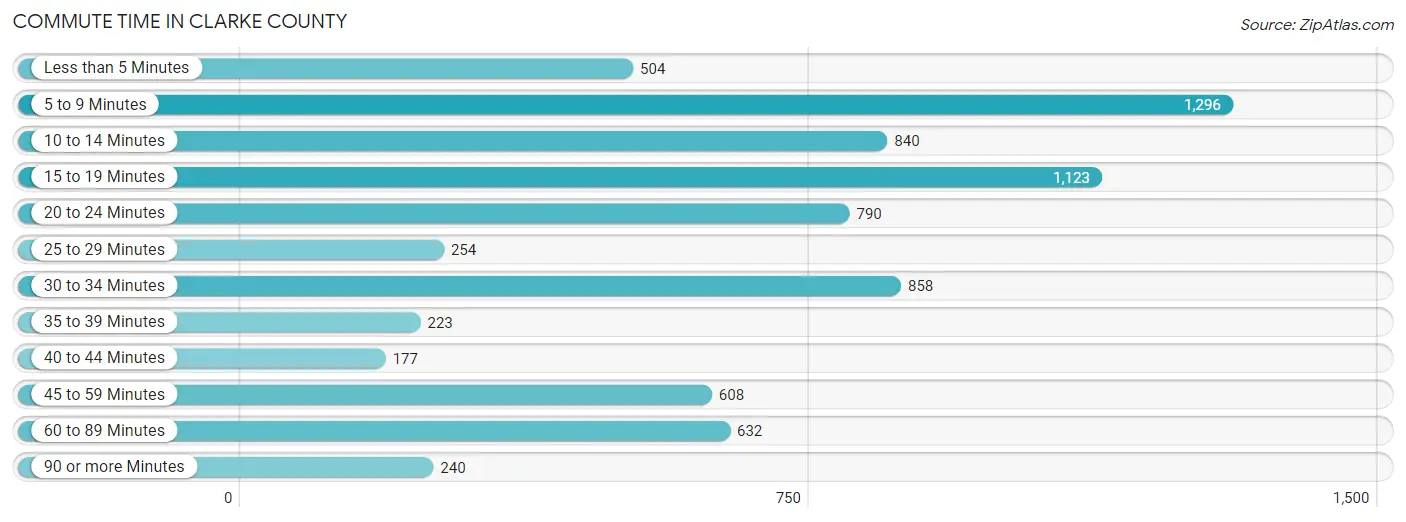
Commute Time in Clarke County
The most frequently occuring commute durations in Clarke County are 5 to 9 minutes (1,296 commuters, 17.2%), 15 to 19 minutes (1,123 commuters, 14.9%), and 30 to 34 minutes (858 commuters, 11.4%).
| Commute Time | # Commuters | % Commuters |
| Less than 5 Minutes | 504 | 6.7% |
| 5 to 9 Minutes | 1,296 | 17.2% |
| 10 to 14 Minutes | 840 | 11.1% |
| 15 to 19 Minutes | 1,123 | 14.9% |
| 20 to 24 Minutes | 790 | 10.5% |
| 25 to 29 Minutes | 254 | 3.4% |
| 30 to 34 Minutes | 858 | 11.4% |
| 35 to 39 Minutes | 223 | 3.0% |
| 40 to 44 Minutes | 177 | 2.4% |
| 45 to 59 Minutes | 608 | 8.1% |
| 60 to 89 Minutes | 632 | 8.4% |
| 90 or more Minutes | 240 | 3.2% |
Commute Time by Sex in Clarke County
The most common commute times in Clarke County are 15 to 19 minutes (593 commuters, 15.6%) for males and 5 to 9 minutes (793 commuters, 21.2%) for females.
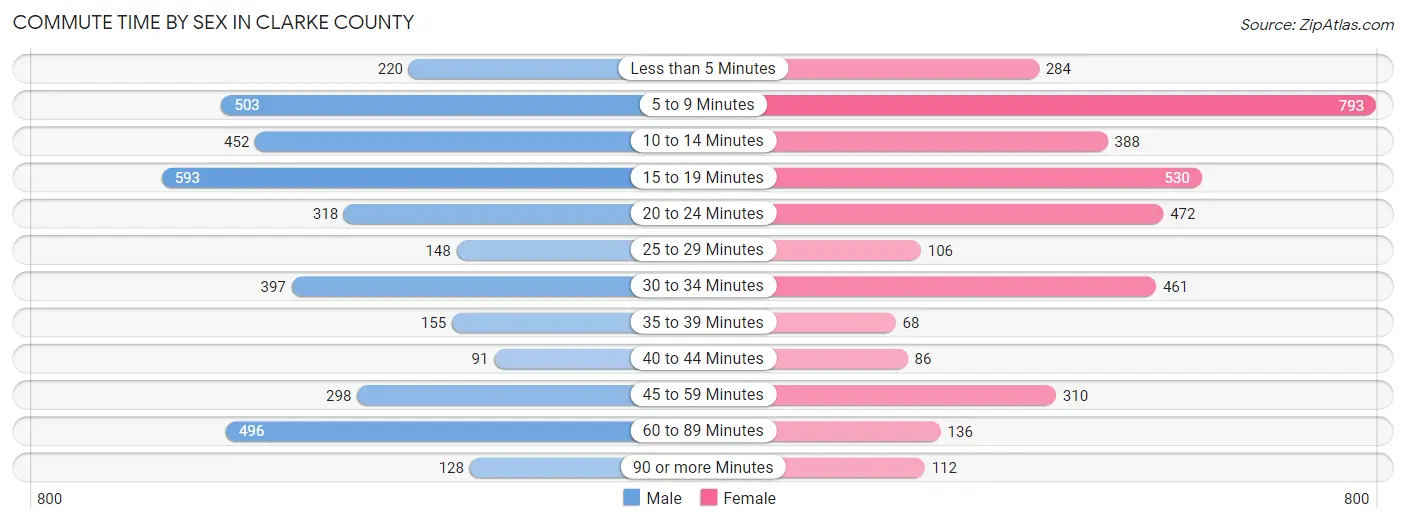
| Commute Time | Male | Female |
| Less than 5 Minutes | 220 (5.8%) | 284 (7.6%) |
| 5 to 9 Minutes | 503 (13.2%) | 793 (21.2%) |
| 10 to 14 Minutes | 452 (11.9%) | 388 (10.4%) |
| 15 to 19 Minutes | 593 (15.6%) | 530 (14.1%) |
| 20 to 24 Minutes | 318 (8.4%) | 472 (12.6%) |
| 25 to 29 Minutes | 148 (3.9%) | 106 (2.8%) |
| 30 to 34 Minutes | 397 (10.4%) | 461 (12.3%) |
| 35 to 39 Minutes | 155 (4.1%) | 68 (1.8%) |
| 40 to 44 Minutes | 91 (2.4%) | 86 (2.3%) |
| 45 to 59 Minutes | 298 (7.8%) | 310 (8.3%) |
| 60 to 89 Minutes | 496 (13.1%) | 136 (3.6%) |
| 90 or more Minutes | 128 (3.4%) | 112 (3.0%) |
Time of Departure to Work by Sex in Clarke County
The most frequent times of departure to work in Clarke County are 12:00 AM to 4:59 AM (613, 16.1%) for males and 7:30 AM to 7:59 AM (922, 24.6%) for females.
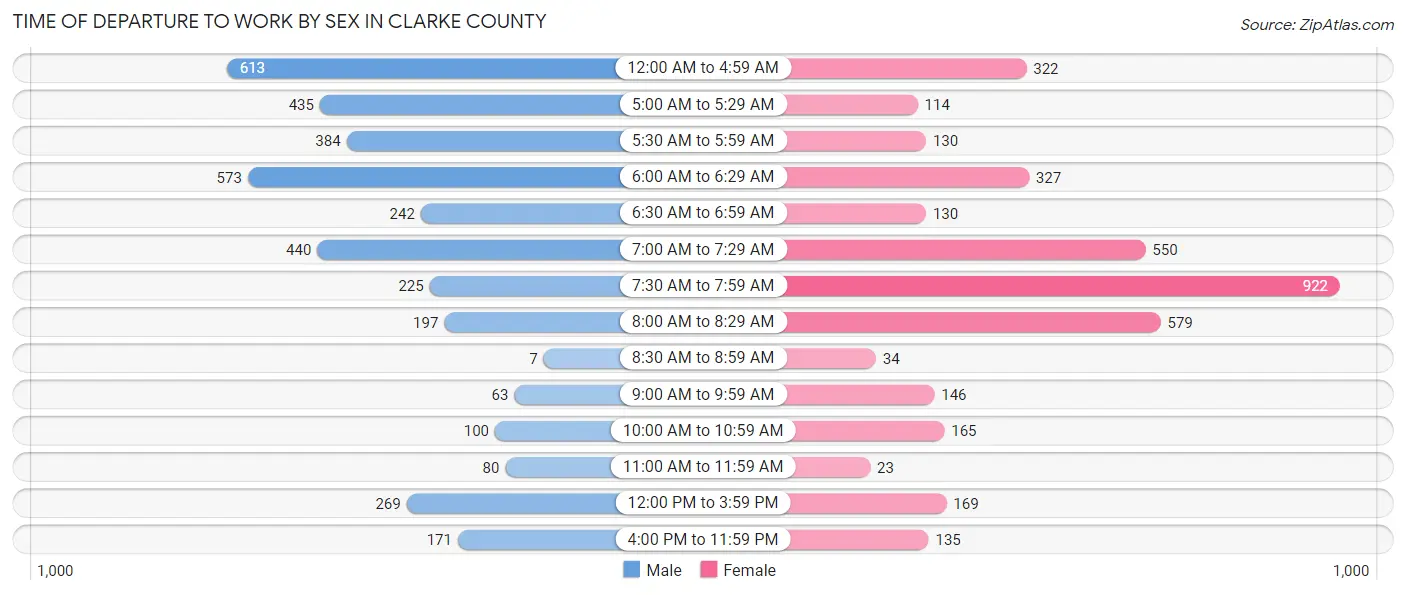
| Time of Departure | Male | Female |
| 12:00 AM to 4:59 AM | 613 (16.1%) | 322 (8.6%) |
| 5:00 AM to 5:29 AM | 435 (11.5%) | 114 (3.0%) |
| 5:30 AM to 5:59 AM | 384 (10.1%) | 130 (3.5%) |
| 6:00 AM to 6:29 AM | 573 (15.1%) | 327 (8.7%) |
| 6:30 AM to 6:59 AM | 242 (6.4%) | 130 (3.5%) |
| 7:00 AM to 7:29 AM | 440 (11.6%) | 550 (14.7%) |
| 7:30 AM to 7:59 AM | 225 (5.9%) | 922 (24.6%) |
| 8:00 AM to 8:29 AM | 197 (5.2%) | 579 (15.5%) |
| 8:30 AM to 8:59 AM | 7 (0.2%) | 34 (0.9%) |
| 9:00 AM to 9:59 AM | 63 (1.7%) | 146 (3.9%) |
| 10:00 AM to 10:59 AM | 100 (2.6%) | 165 (4.4%) |
| 11:00 AM to 11:59 AM | 80 (2.1%) | 23 (0.6%) |
| 12:00 PM to 3:59 PM | 269 (7.1%) | 169 (4.5%) |
| 4:00 PM to 11:59 PM | 171 (4.5%) | 135 (3.6%) |
| Total | 3,799 (100.0%) | 3,746 (100.0%) |
Housing Occupancy in Clarke County
Occupancy by Ownership in Clarke County
Of the total 8,188 dwellings in Clarke County, owner-occupied units account for 5,916 (72.3%), while renter-occupied units make up 2,272 (27.8%).
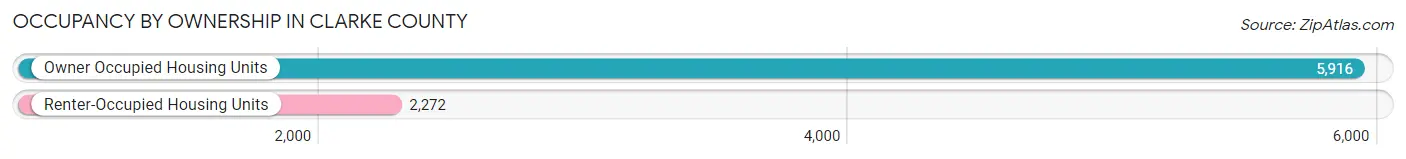
| Occupancy | # Housing Units | % Housing Units |
| Owner Occupied Housing Units | 5,916 | 72.3% |
| Renter-Occupied Housing Units | 2,272 | 27.8% |
| Total Occupied Housing Units | 8,188 | 100.0% |
Occupancy by Household Size in Clarke County

| Household Size | # Housing Units | % Housing Units |
| 1-Person Household | 2,879 | 35.2% |
| 2-Person Household | 2,734 | 33.4% |
| 3-Person Household | 1,313 | 16.0% |
| 4+ Person Household | 1,262 | 15.4% |
| Total Housing Units | 8,188 | 100.0% |
Occupancy by Ownership by Household Size in Clarke County
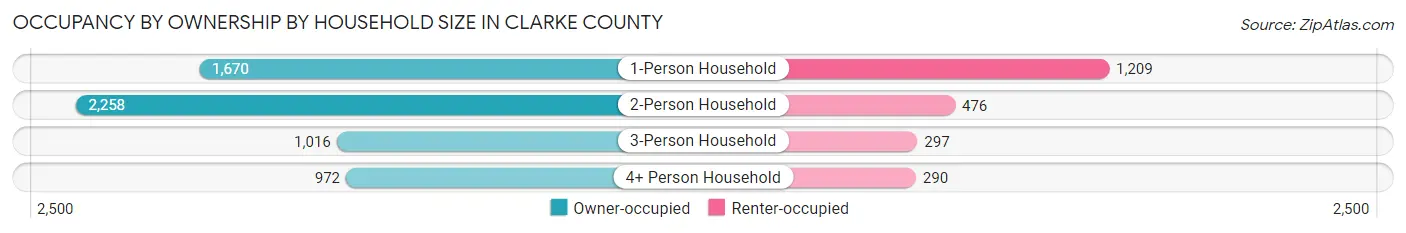
| Household Size | Owner-occupied | Renter-occupied |
| 1-Person Household | 1,670 (58.0%) | 1,209 (42.0%) |
| 2-Person Household | 2,258 (82.6%) | 476 (17.4%) |
| 3-Person Household | 1,016 (77.4%) | 297 (22.6%) |
| 4+ Person Household | 972 (77.0%) | 290 (23.0%) |
| Total Housing Units | 5,916 (72.3%) | 2,272 (27.8%) |
Occupancy by Educational Attainment in Clarke County
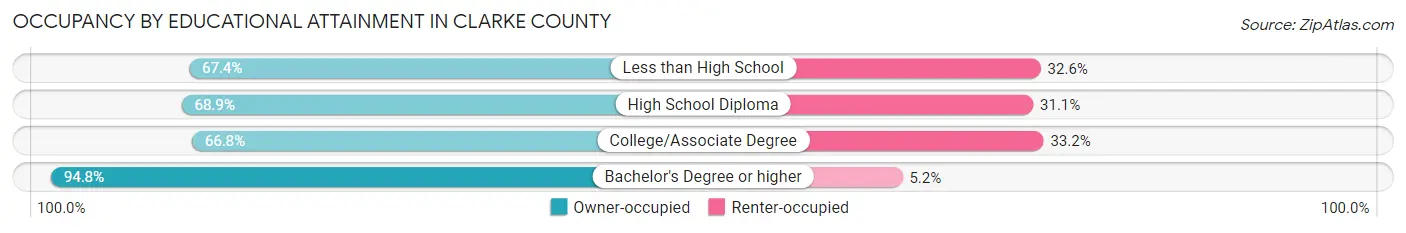
| Household Size | Owner-occupied | Renter-occupied |
| Less than High School | 897 (67.4%) | 434 (32.6%) |
| High School Diploma | 2,224 (68.9%) | 1,005 (31.1%) |
| College/Associate Degree | 1,539 (66.8%) | 764 (33.2%) |
| Bachelor's Degree or higher | 1,256 (94.8%) | 69 (5.2%) |
Occupancy by Age of Householder in Clarke County
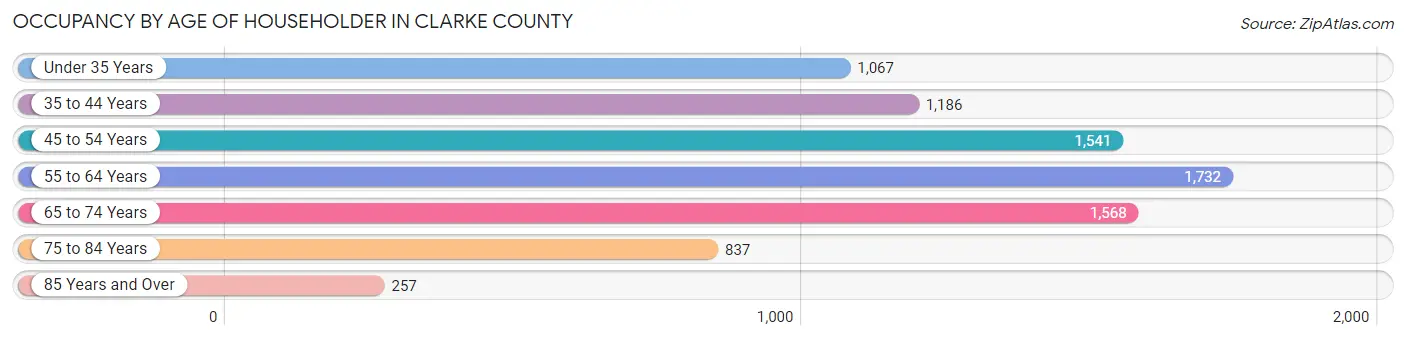
| Age Bracket | # Households | % Households |
| Under 35 Years | 1,067 | 13.0% |
| 35 to 44 Years | 1,186 | 14.5% |
| 45 to 54 Years | 1,541 | 18.8% |
| 55 to 64 Years | 1,732 | 21.1% |
| 65 to 74 Years | 1,568 | 19.2% |
| 75 to 84 Years | 837 | 10.2% |
| 85 Years and Over | 257 | 3.1% |
| Total | 8,188 | 100.0% |
Housing Finances in Clarke County
Median Income by Occupancy in Clarke County
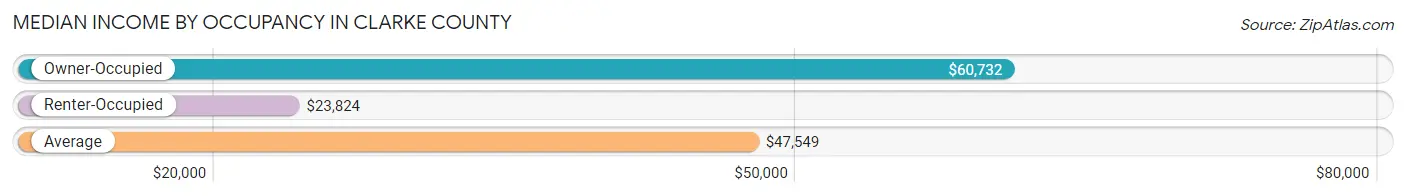
| Occupancy Type | # Households | Median Income |
| Owner-Occupied | 5,916 (72.3%) | $60,732 |
| Renter-Occupied | 2,272 (27.8%) | $23,824 |
| Average | 8,188 (100.0%) | $47,549 |
Occupancy by Householder Income Bracket in Clarke County
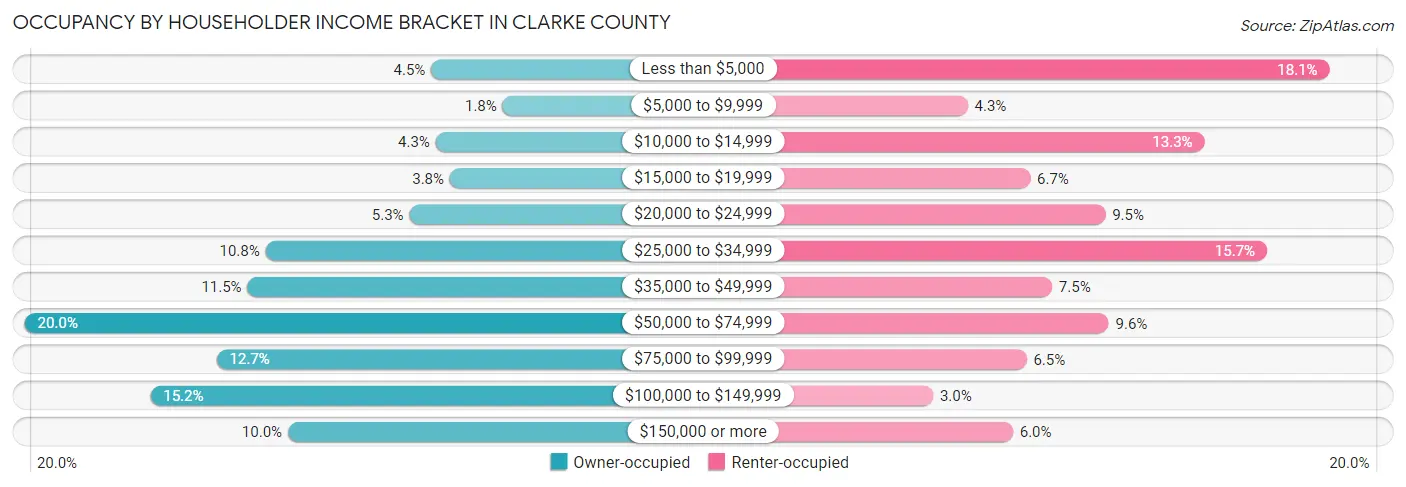
| Income Bracket | Owner-occupied | Renter-occupied |
| Less than $5,000 | 267 (4.5%) | 410 (18.0%) |
| $5,000 to $9,999 | 106 (1.8%) | 97 (4.3%) |
| $10,000 to $14,999 | 257 (4.3%) | 302 (13.3%) |
| $15,000 to $19,999 | 225 (3.8%) | 151 (6.7%) |
| $20,000 to $24,999 | 316 (5.3%) | 216 (9.5%) |
| $25,000 to $34,999 | 640 (10.8%) | 356 (15.7%) |
| $35,000 to $49,999 | 681 (11.5%) | 170 (7.5%) |
| $50,000 to $74,999 | 1,183 (20.0%) | 219 (9.6%) |
| $75,000 to $99,999 | 751 (12.7%) | 148 (6.5%) |
| $100,000 to $149,999 | 900 (15.2%) | 67 (2.9%) |
| $150,000 or more | 590 (10.0%) | 136 (6.0%) |
| Total | 5,916 (100.0%) | 2,272 (100.0%) |
Monthly Housing Cost Tiers in Clarke County
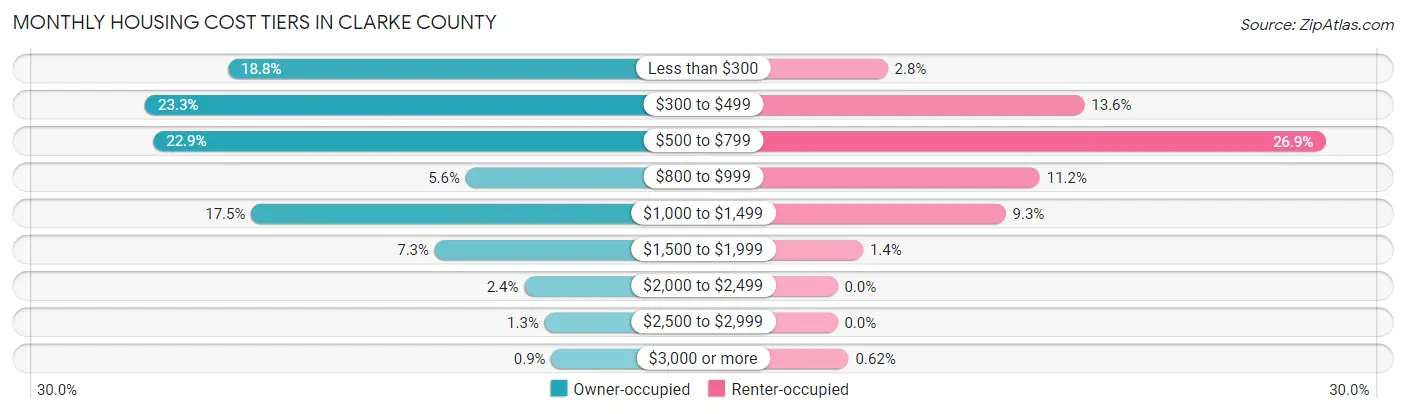
| Monthly Cost | Owner-occupied | Renter-occupied |
| Less than $300 | 1,110 (18.8%) | 63 (2.8%) |
| $300 to $499 | 1,381 (23.3%) | 310 (13.6%) |
| $500 to $799 | 1,354 (22.9%) | 612 (26.9%) |
| $800 to $999 | 333 (5.6%) | 254 (11.2%) |
| $1,000 to $1,499 | 1,034 (17.5%) | 211 (9.3%) |
| $1,500 to $1,999 | 434 (7.3%) | 32 (1.4%) |
| $2,000 to $2,499 | 142 (2.4%) | 0 (0.0%) |
| $2,500 to $2,999 | 75 (1.3%) | 0 (0.0%) |
| $3,000 or more | 53 (0.9%) | 14 (0.6%) |
| Total | 5,916 (100.0%) | 2,272 (100.0%) |
Physical Housing Characteristics in Clarke County
Housing Structures in Clarke County
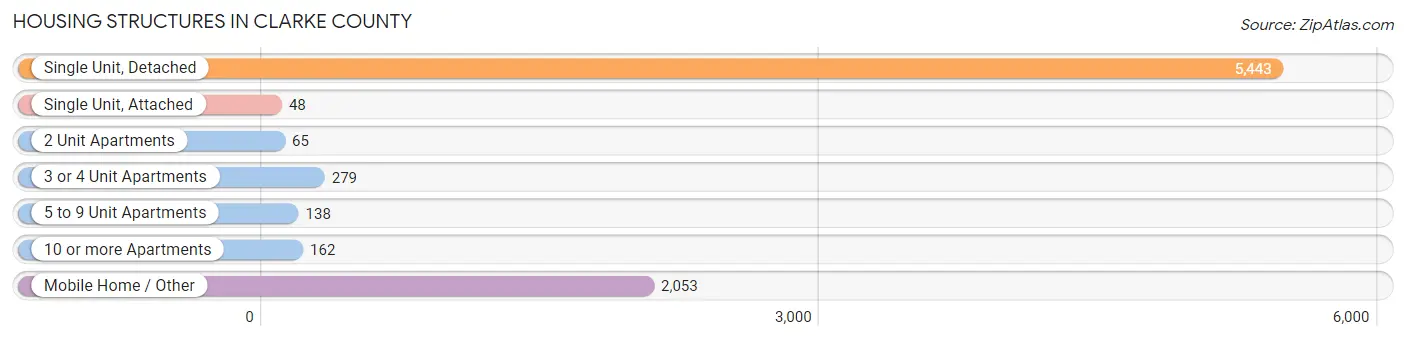
| Structure Type | # Housing Units | % Housing Units |
| Single Unit, Detached | 5,443 | 66.5% |
| Single Unit, Attached | 48 | 0.6% |
| 2 Unit Apartments | 65 | 0.8% |
| 3 or 4 Unit Apartments | 279 | 3.4% |
| 5 to 9 Unit Apartments | 138 | 1.7% |
| 10 or more Apartments | 162 | 2.0% |
| Mobile Home / Other | 2,053 | 25.1% |
| Total | 8,188 | 100.0% |
Housing Structures by Occupancy in Clarke County

| Structure Type | Owner-occupied | Renter-occupied |
| Single Unit, Detached | 4,560 (83.8%) | 883 (16.2%) |
| Single Unit, Attached | 41 (85.4%) | 7 (14.6%) |
| 2 Unit Apartments | 14 (21.5%) | 51 (78.5%) |
| 3 or 4 Unit Apartments | 0 (0.0%) | 279 (100.0%) |
| 5 to 9 Unit Apartments | 0 (0.0%) | 138 (100.0%) |
| 10 or more Apartments | 0 (0.0%) | 162 (100.0%) |
| Mobile Home / Other | 1,301 (63.4%) | 752 (36.6%) |
| Total | 5,916 (72.3%) | 2,272 (27.8%) |
Housing Structures by Number of Rooms in Clarke County
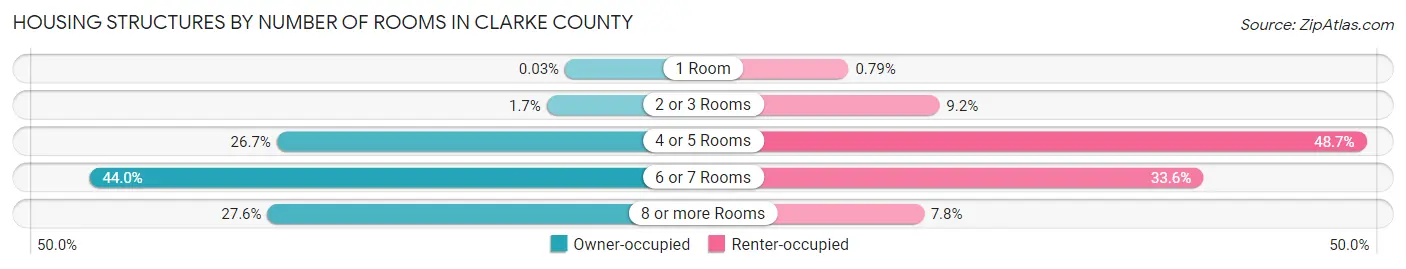
| Number of Rooms | Owner-occupied | Renter-occupied |
| 1 Room | 2 (0.0%) | 18 (0.8%) |
| 2 or 3 Rooms | 102 (1.7%) | 209 (9.2%) |
| 4 or 5 Rooms | 1,579 (26.7%) | 1,106 (48.7%) |
| 6 or 7 Rooms | 2,603 (44.0%) | 763 (33.6%) |
| 8 or more Rooms | 1,630 (27.6%) | 176 (7.7%) |
| Total | 5,916 (100.0%) | 2,272 (100.0%) |
Housing Structure by Heating Type in Clarke County
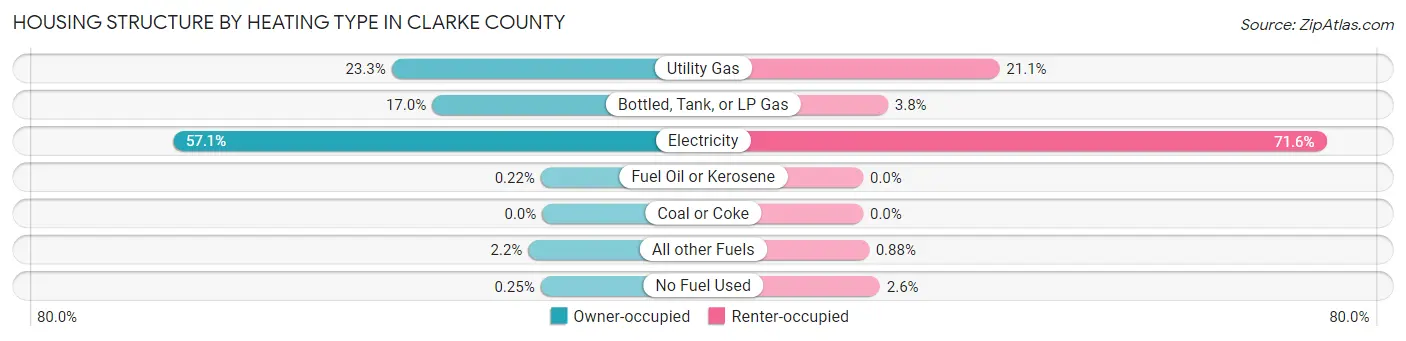
| Heating Type | Owner-occupied | Renter-occupied |
| Utility Gas | 1,377 (23.3%) | 479 (21.1%) |
| Bottled, Tank, or LP Gas | 1,007 (17.0%) | 87 (3.8%) |
| Electricity | 3,377 (57.1%) | 1,627 (71.6%) |
| Fuel Oil or Kerosene | 13 (0.2%) | 0 (0.0%) |
| Coal or Coke | 0 (0.0%) | 0 (0.0%) |
| All other Fuels | 127 (2.1%) | 20 (0.9%) |
| No Fuel Used | 15 (0.3%) | 59 (2.6%) |
| Total | 5,916 (100.0%) | 2,272 (100.0%) |
Household Vehicle Usage in Clarke County
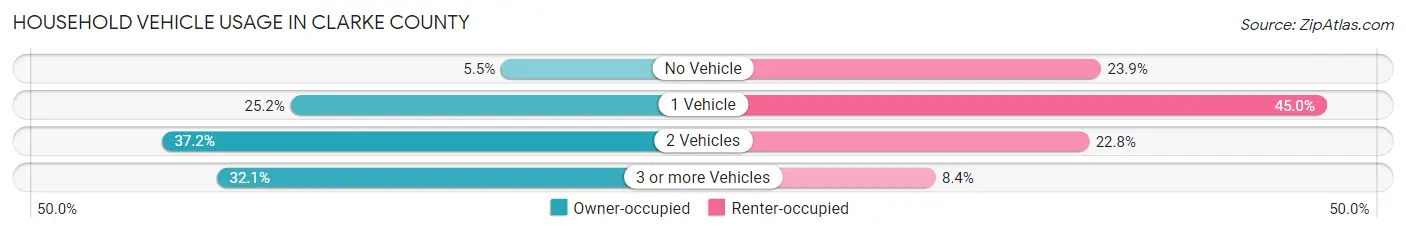
| Vehicles per Household | Owner-occupied | Renter-occupied |
| No Vehicle | 327 (5.5%) | 542 (23.9%) |
| 1 Vehicle | 1,489 (25.2%) | 1,022 (45.0%) |
| 2 Vehicles | 2,202 (37.2%) | 517 (22.8%) |
| 3 or more Vehicles | 1,898 (32.1%) | 191 (8.4%) |
| Total | 5,916 (100.0%) | 2,272 (100.0%) |
Real Estate & Mortgages in Clarke County
Real Estate and Mortgage Overview in Clarke County
| Characteristic | Without Mortgage | With Mortgage |
| Housing Units | 3,694 | 2,222 |
| Median Property Value | $95,300 | $181,700 |
| Median Household Income | $47,109 | $376 |
| Monthly Housing Costs | $403 | $53 |
| Real Estate Taxes | $311 | $315 |
Property Value by Mortgage Status in Clarke County

| Property Value | Without Mortgage | With Mortgage |
| Less than $50,000 | 1,141 (30.9%) | 79 (3.6%) |
| $50,000 to $99,999 | 812 (22.0%) | 282 (12.7%) |
| $100,000 to $299,999 | 1,366 (37.0%) | 1,554 (69.9%) |
| $300,000 to $499,999 | 282 (7.6%) | 271 (12.2%) |
| $500,000 to $749,999 | 47 (1.3%) | 36 (1.6%) |
| $750,000 to $999,999 | 13 (0.4%) | 0 (0.0%) |
| $1,000,000 or more | 33 (0.9%) | 0 (0.0%) |
| Total | 3,694 (100.0%) | 2,222 (100.0%) |
Household Income by Mortgage Status in Clarke County
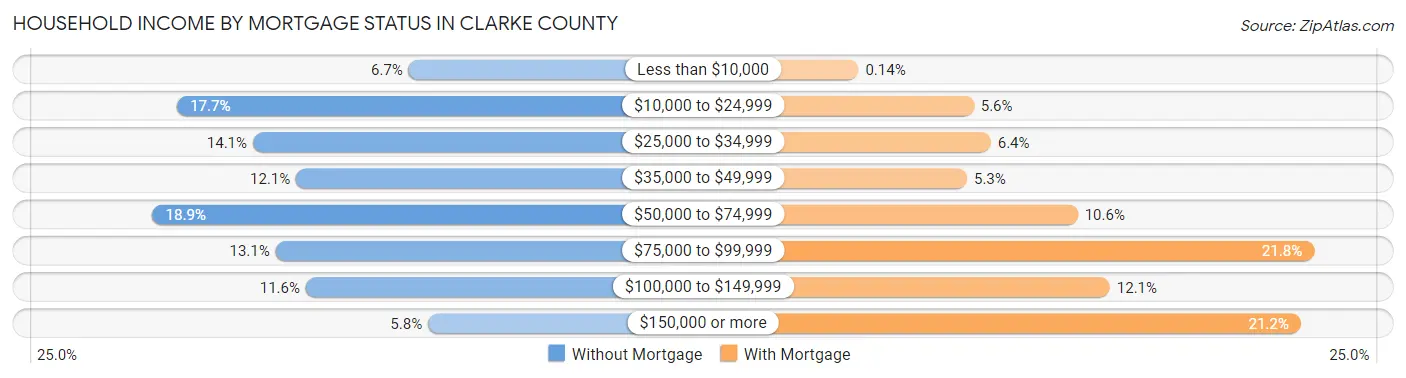
| Household Income | Without Mortgage | With Mortgage |
| Less than $10,000 | 248 (6.7%) | 3 (0.1%) |
| $10,000 to $24,999 | 655 (17.7%) | 125 (5.6%) |
| $25,000 to $34,999 | 522 (14.1%) | 143 (6.4%) |
| $35,000 to $49,999 | 446 (12.1%) | 118 (5.3%) |
| $50,000 to $74,999 | 698 (18.9%) | 235 (10.6%) |
| $75,000 to $99,999 | 482 (13.1%) | 485 (21.8%) |
| $100,000 to $149,999 | 429 (11.6%) | 269 (12.1%) |
| $150,000 or more | 214 (5.8%) | 471 (21.2%) |
| Total | 3,694 (100.0%) | 2,222 (100.0%) |
Property Value to Household Income Ratio in Clarke County

| Value-to-Income Ratio | Without Mortgage | With Mortgage |
| Less than 2.0x | 1,879 (50.9%) | 75,223 (3,385.4%) |
| 2.0x to 2.9x | 577 (15.6%) | 1,026 (46.2%) |
| 3.0x to 3.9x | 257 (7.0%) | 535 (24.1%) |
| 4.0x or more | 861 (23.3%) | 220 (9.9%) |
| Total | 3,694 (100.0%) | 2,222 (100.0%) |
Real Estate Taxes by Mortgage Status in Clarke County
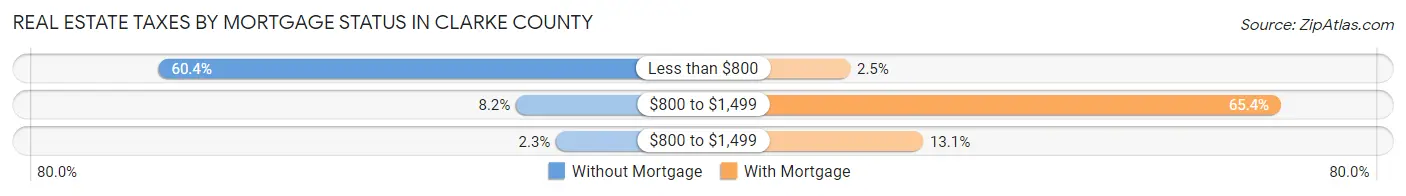
| Property Taxes | Without Mortgage | With Mortgage |
| Less than $800 | 2,232 (60.4%) | 55 (2.5%) |
| $800 to $1,499 | 302 (8.2%) | 1,454 (65.4%) |
| $800 to $1,499 | 86 (2.3%) | 292 (13.1%) |
| Total | 3,694 (100.0%) | 2,222 (100.0%) |
Health & Disability in Clarke County
Health Insurance Coverage by Age in Clarke County
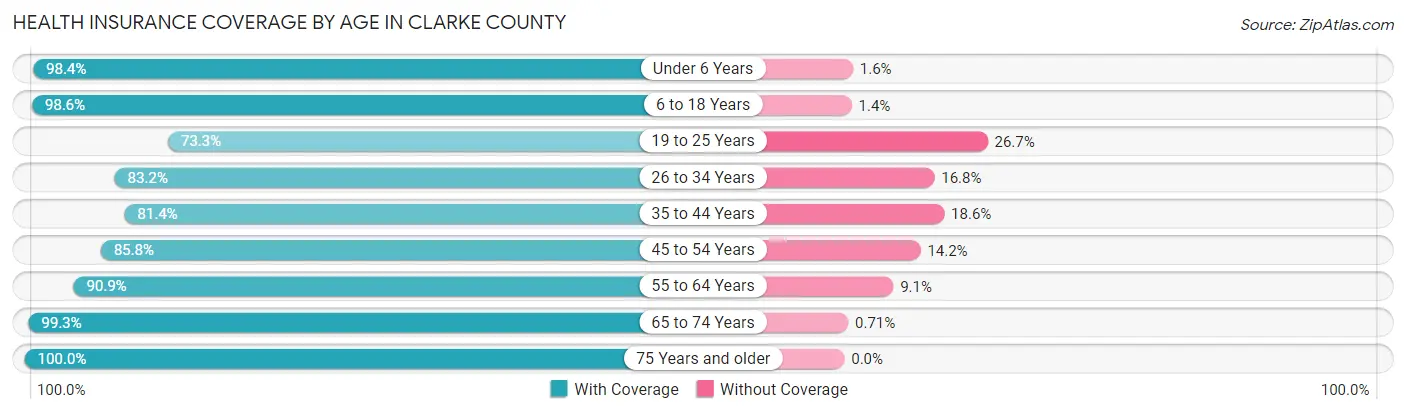
| Age Bracket | With Coverage | Without Coverage |
| Under 6 Years | 1,544 (98.4%) | 25 (1.6%) |
| 6 to 18 Years | 3,845 (98.6%) | 53 (1.4%) |
| 19 to 25 Years | 1,493 (73.3%) | 544 (26.7%) |
| 26 to 34 Years | 1,711 (83.2%) | 345 (16.8%) |
| 35 to 44 Years | 2,094 (81.4%) | 479 (18.6%) |
| 45 to 54 Years | 2,447 (85.8%) | 405 (14.2%) |
| 55 to 64 Years | 2,961 (90.9%) | 297 (9.1%) |
| 65 to 74 Years | 2,515 (99.3%) | 18 (0.7%) |
| 75 Years and older | 1,974 (100.0%) | 0 (0.0%) |
| Total | 20,584 (90.5%) | 2,166 (9.5%) |
Health Insurance Coverage by Citizenship Status in Clarke County
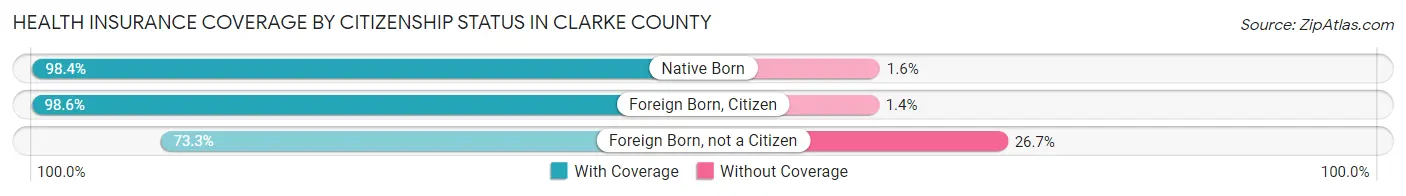
| Citizenship Status | With Coverage | Without Coverage |
| Native Born | 1,544 (98.4%) | 25 (1.6%) |
| Foreign Born, Citizen | 3,845 (98.6%) | 53 (1.4%) |
| Foreign Born, not a Citizen | 1,493 (73.3%) | 544 (26.7%) |
Health Insurance Coverage by Household Income in Clarke County
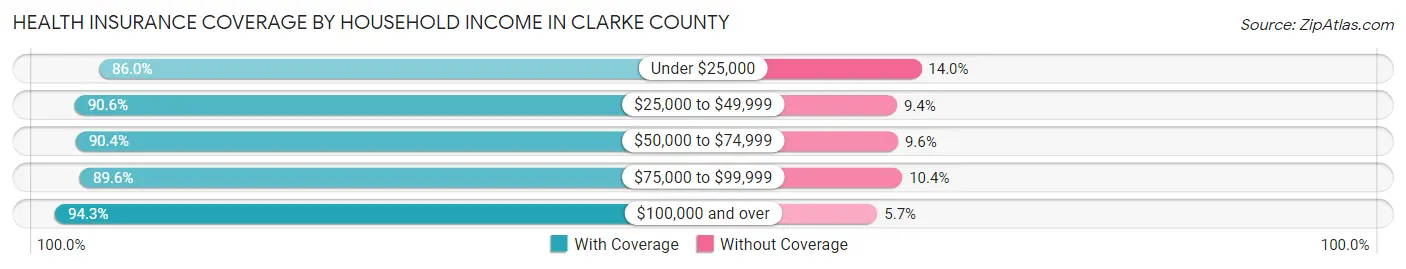
| Household Income | With Coverage | Without Coverage |
| Under $25,000 | 4,304 (86.0%) | 699 (14.0%) |
| $25,000 to $49,999 | 3,827 (90.6%) | 397 (9.4%) |
| $50,000 to $74,999 | 3,944 (90.4%) | 418 (9.6%) |
| $75,000 to $99,999 | 2,475 (89.6%) | 287 (10.4%) |
| $100,000 and over | 5,962 (94.3%) | 362 (5.7%) |
Public vs Private Health Insurance Coverage by Age in Clarke County
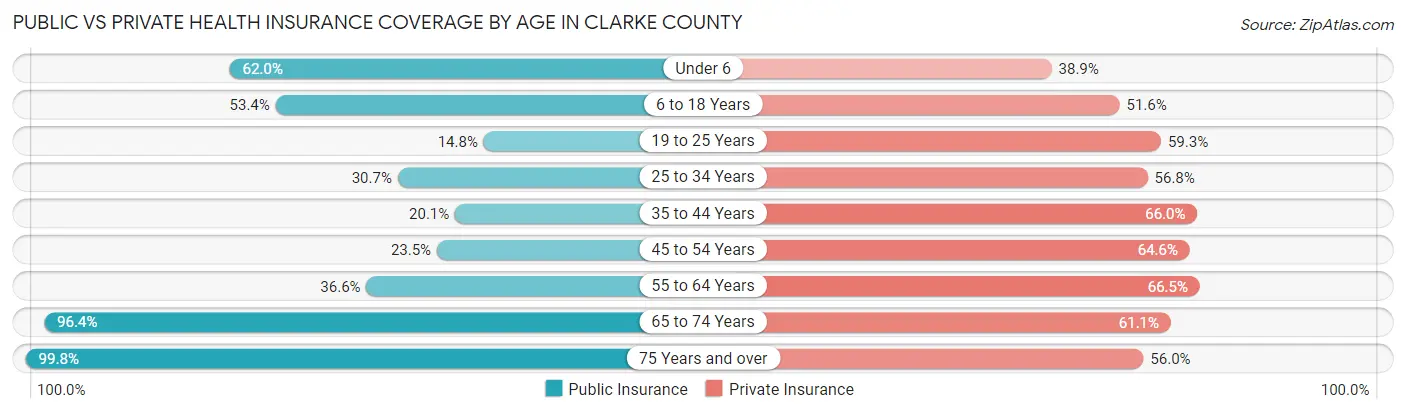
| Age Bracket | Public Insurance | Private Insurance |
| Under 6 | 972 (62.0%) | 611 (38.9%) |
| 6 to 18 Years | 2,082 (53.4%) | 2,010 (51.6%) |
| 19 to 25 Years | 301 (14.8%) | 1,207 (59.3%) |
| 25 to 34 Years | 632 (30.7%) | 1,167 (56.8%) |
| 35 to 44 Years | 517 (20.1%) | 1,698 (66.0%) |
| 45 to 54 Years | 669 (23.5%) | 1,842 (64.6%) |
| 55 to 64 Years | 1,191 (36.6%) | 2,165 (66.4%) |
| 65 to 74 Years | 2,441 (96.4%) | 1,547 (61.1%) |
| 75 Years and over | 1,970 (99.8%) | 1,105 (56.0%) |
| Total | 10,775 (47.4%) | 13,352 (58.7%) |
Disability Status by Sex by Age in Clarke County
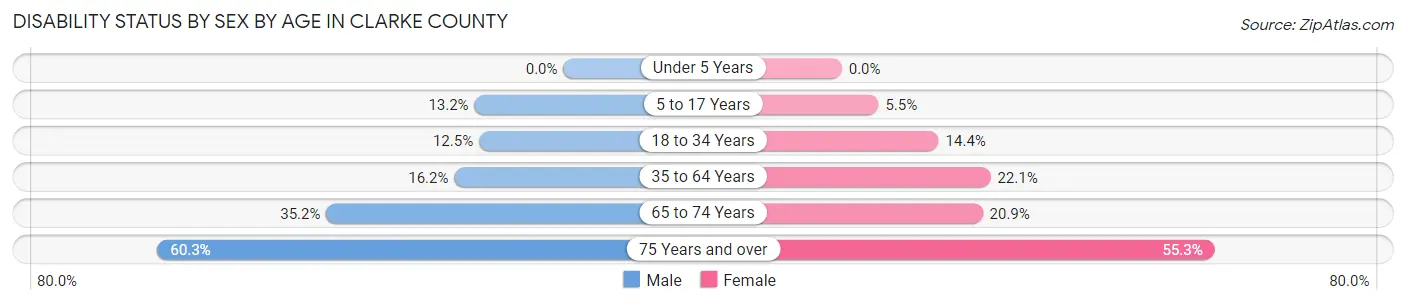
| Age Bracket | Male | Female |
| Under 5 Years | 0 (0.0%) | 0 (0.0%) |
| 5 to 17 Years | 240 (13.2%) | 100 (5.4%) |
| 18 to 34 Years | 272 (12.5%) | 333 (14.4%) |
| 35 to 64 Years | 665 (16.2%) | 1,010 (22.1%) |
| 65 to 74 Years | 422 (35.2%) | 279 (20.9%) |
| 75 Years and over | 496 (60.3%) | 637 (55.3%) |
Disability Class by Sex by Age in Clarke County
Disability Class: Hearing Difficulty
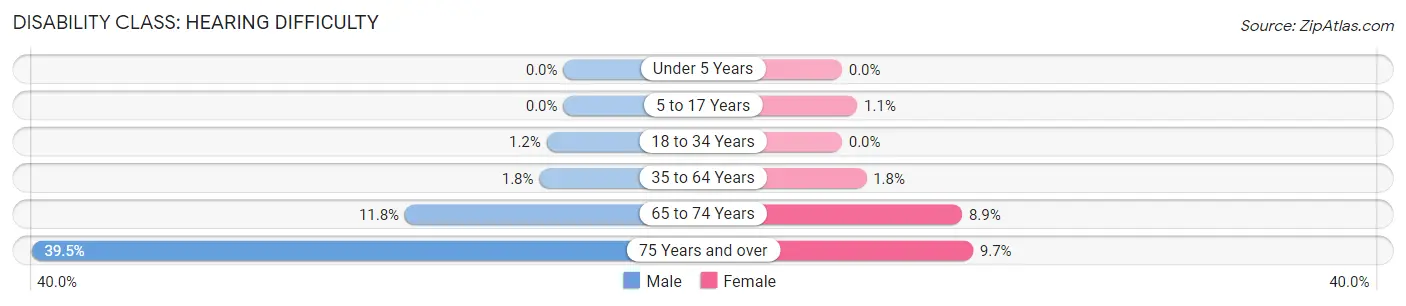
| Age Bracket | Male | Female |
| Under 5 Years | 0 (0.0%) | 0 (0.0%) |
| 5 to 17 Years | 0 (0.0%) | 21 (1.1%) |
| 18 to 34 Years | 27 (1.2%) | 0 (0.0%) |
| 35 to 64 Years | 73 (1.8%) | 83 (1.8%) |
| 65 to 74 Years | 141 (11.8%) | 119 (8.9%) |
| 75 Years and over | 325 (39.5%) | 112 (9.7%) |
Disability Class: Vision Difficulty
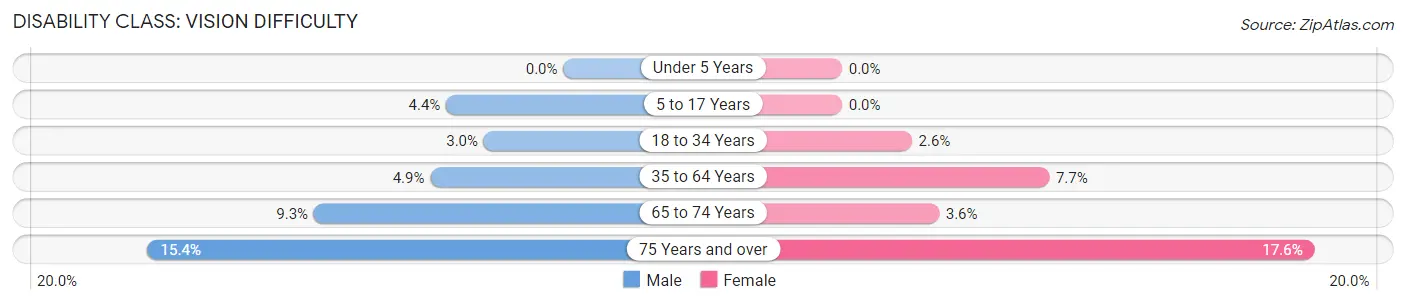
| Age Bracket | Male | Female |
| Under 5 Years | 0 (0.0%) | 0 (0.0%) |
| 5 to 17 Years | 79 (4.3%) | 0 (0.0%) |
| 18 to 34 Years | 64 (2.9%) | 60 (2.6%) |
| 35 to 64 Years | 203 (4.9%) | 352 (7.7%) |
| 65 to 74 Years | 111 (9.3%) | 48 (3.6%) |
| 75 Years and over | 127 (15.4%) | 202 (17.5%) |
Disability Class: Cognitive Difficulty
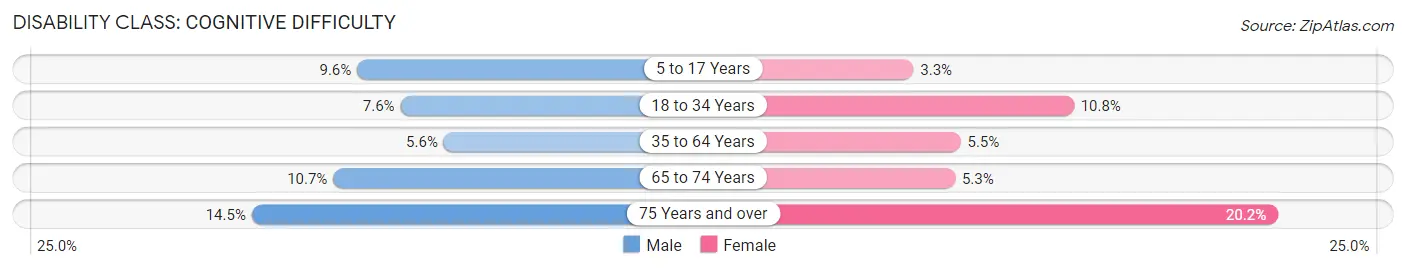
| Age Bracket | Male | Female |
| 5 to 17 Years | 174 (9.6%) | 61 (3.3%) |
| 18 to 34 Years | 164 (7.6%) | 249 (10.8%) |
| 35 to 64 Years | 228 (5.6%) | 252 (5.5%) |
| 65 to 74 Years | 128 (10.7%) | 70 (5.2%) |
| 75 Years and over | 119 (14.5%) | 233 (20.2%) |
Disability Class: Ambulatory Difficulty

| Age Bracket | Male | Female |
| 5 to 17 Years | 22 (1.2%) | 11 (0.6%) |
| 18 to 34 Years | 23 (1.1%) | 114 (4.9%) |
| 35 to 64 Years | 446 (10.9%) | 816 (17.8%) |
| 65 to 74 Years | 216 (18.0%) | 171 (12.8%) |
| 75 Years and over | 256 (31.1%) | 439 (38.1%) |
Disability Class: Self-Care Difficulty

| Age Bracket | Male | Female |
| 5 to 17 Years | 46 (2.5%) | 19 (1.0%) |
| 18 to 34 Years | 31 (1.4%) | 65 (2.8%) |
| 35 to 64 Years | 167 (4.1%) | 284 (6.2%) |
| 65 to 74 Years | 70 (5.8%) | 41 (3.1%) |
| 75 Years and over | 104 (12.6%) | 169 (14.7%) |
Technology Access in Clarke County
Computing Device Access in Clarke County

| Device Type | # Households | % Households |
| Desktop or Laptop | 4,689 | 57.3% |
| Smartphone | 6,172 | 75.4% |
| Tablet | 3,686 | 45.0% |
| No Computing Device | 1,298 | 15.9% |
| Total | 8,188 | 100.0% |
Internet Access in Clarke County
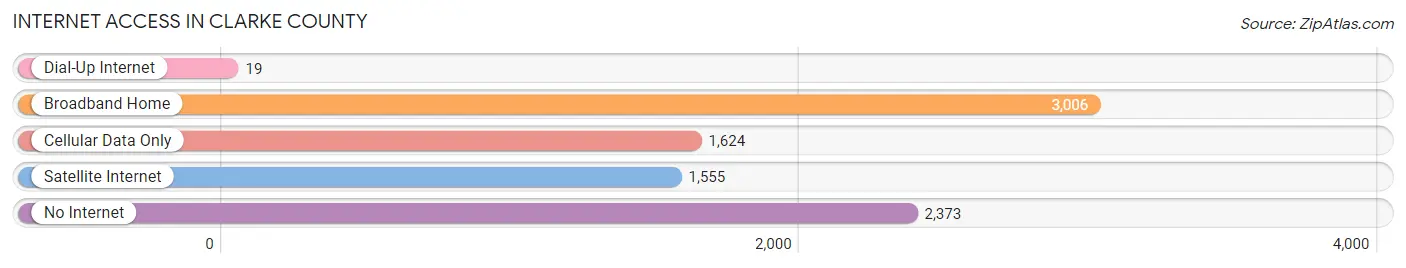
| Internet Type | # Households | % Households |
| Dial-Up Internet | 19 | 0.2% |
| Broadband Home | 3,006 | 36.7% |
| Cellular Data Only | 1,624 | 19.8% |
| Satellite Internet | 1,555 | 19.0% |
| No Internet | 2,373 | 29.0% |
| Total | 8,188 | 100.0% |
Clarke County Summary
Clarke County, Alabama is located in the southwestern corner of the state, and is bordered by Washington County to the north, Mobile County to the east, Monroe County to the south, and Choctaw County to the west. The county seat is Grove Hill, and the county is part of the Mobile metropolitan area. As of the 2010 census, the population of Clarke County was 25,833.
History
Clarke County was established on December 10, 1812, and was named for General John Clarke of Georgia, who served in the Revolutionary War. The county was originally part of the Choctaw Nation, and was ceded to the United States in the Treaty of Dancing Rabbit Creek in 1830. The county was then divided into two parts, with the northern part becoming Washington County and the southern part becoming Clarke County.
The county was largely agricultural in the 19th century, with cotton being the main crop. The county was also home to several sawmills and gristmills, as well as a few small towns. The county seat of Grove Hill was established in 1821, and the county courthouse was built in 1825.
In the early 20th century, the county began to industrialize, with the establishment of several lumber mills and a cotton mill. The county also saw an influx of African-American residents, who were attracted by the promise of jobs in the lumber and cotton industries.
Geography
Clarke County is located in the southwestern corner of Alabama, and is bordered by Washington County to the north, Mobile County to the east, Monroe County to the south, and Choctaw County to the west. The county covers an area of 845 square miles, and is mostly rural, with the majority of the land being used for agricultural purposes. The county is located in the Coastal Plain region of Alabama, and is characterized by rolling hills and flat plains. The county is drained by the Tombigbee River, which forms the western border of the county.
The county is home to several state parks, including the Choctawhatchee River State Park, the Perdido River State Park, and the Conecuh National Forest. The county is also home to the Clarke County Wildlife Management Area, which is a popular destination for hunting and fishing.
Economy
The economy of Clarke County is largely based on agriculture, with cotton, soybeans, and corn being the main crops. The county is also home to several lumber mills, as well as a few small manufacturing plants. The county is also home to several state parks, which provide jobs in the tourism industry.
Demographics
As of the 2010 census, the population of Clarke County was 25,833. The population is largely rural, with the majority of the population living in small towns and rural areas. The racial makeup of the county is 73.3% White, 24.2% African American, 0.4% Native American, 0.3% Asian, 0.1% Pacific Islander, 0.7% from other races, and 1.0% from two or more races. The median household income in the county is $35,945, and the median family income is $43,945. The per capita income in the county is $17,845.
Common Questions
What is the Total Population of Clarke County?
Total Population of Clarke County is 23,058.
What is the Total Male Population of Clarke County?
Total Male Population of Clarke County is 11,032.
What is the Total Female Population of Clarke County?
Total Female Population of Clarke County is 12,026.
What is the Ratio of Males per 100 Females in Clarke County?
There are 91.73 Males per 100 Females in Clarke County.
What is the Ratio of Females per 100 Males in Clarke County?
There are 109.01 Females per 100 Males in Clarke County.
What is the Median Population Age in Clarke County?
Median Population Age in Clarke County is 42.7 Years.
What is the Average Family Size in Clarke County
Average Family Size in Clarke County is 3.6 People.
What is the Average Household Size in Clarke County
Average Household Size in Clarke County is 2.8 People.
What is Per Capita Income in Clarke County?
Per Capita income in Clarke County is $29,310.
What is the Median Family Income in Clarke County?
Median Family Income in Clarke County is $64,688.
What is the Median Household income in Clarke County?
Median Household Income in Clarke County is $47,549.
What is Income or Wage Gap in Clarke County?
Income or Wage Gap in Clarke County is 36.5%.
Women in Clarke County earn 63.5 cents for every dollar earned by a man.
What is Family Income Deficit in Clarke County?
Family Income Deficit in Clarke County is $10,612.
Families that are below poverty line in Clarke County earn $10,612 less on average than the poverty threshold level.
What is Inequality or Gini Index in Clarke County?
Inequality or Gini Index in Clarke County is 0.53.
How Large is the Labor Force in Clarke County?
There are 8,972 People in the Labor Forcein in Clarke County.
What is the Percentage of People in the Labor Force in Clarke County?
48.2% of People are in the Labor Force in Clarke County.
What is the Unemployment Rate in Clarke County?
Unemployment Rate in Clarke County is 12.5%.