Bullock County, AL
Bullock County Map
Bullock County Overview
10,328
TOTAL POPULATION
5,542
MALE POPULATION
4,786
FEMALE POPULATION
115.80
MALES / 100 FEMALES
86.36
FEMALES / 100 MALES
39.2
MEDIAN AGE
3.5
AVG FAMILY SIZE
2.8
AVG HOUSEHOLD SIZE
$22,115
PER CAPITA INCOME
$43,750
AVG FAMILY INCOME
$36,136
AVG HOUSEHOLD INCOME
32.0%
WAGE / INCOME GAP [ % ]
68.0¢/ $1
WAGE / INCOME GAP [ $ ]
0.51
INEQUALITY / GINI INDEX
3,886
LABOR FORCE [ PEOPLE ]
46.4%
PERCENT IN LABOR FORCE
3.7%
UNEMPLOYMENT RATE
Bullock County Area Codes
Race in Bullock County
The most populous races in Bullock County are Black / African American (7,117 | 68.9%), White / Caucasian (2,397 | 23.2%), and Hispanic or Latino (907 | 8.8%).

| Race | # Population | % Population |
| Asian | 43 | 0.4% |
| Black / African American | 7,117 | 68.9% |
| Hawaiian / Pacific | 0 | 0.0% |
| Hispanic or Latino | 907 | 8.8% |
| Native / Alaskan | 0 | 0.0% |
| White / Caucasian | 2,397 | 23.2% |
| Two or more Races | 203 | 2.0% |
| Some other Race | 568 | 5.5% |
| Total | 10,328 | 100.0% |
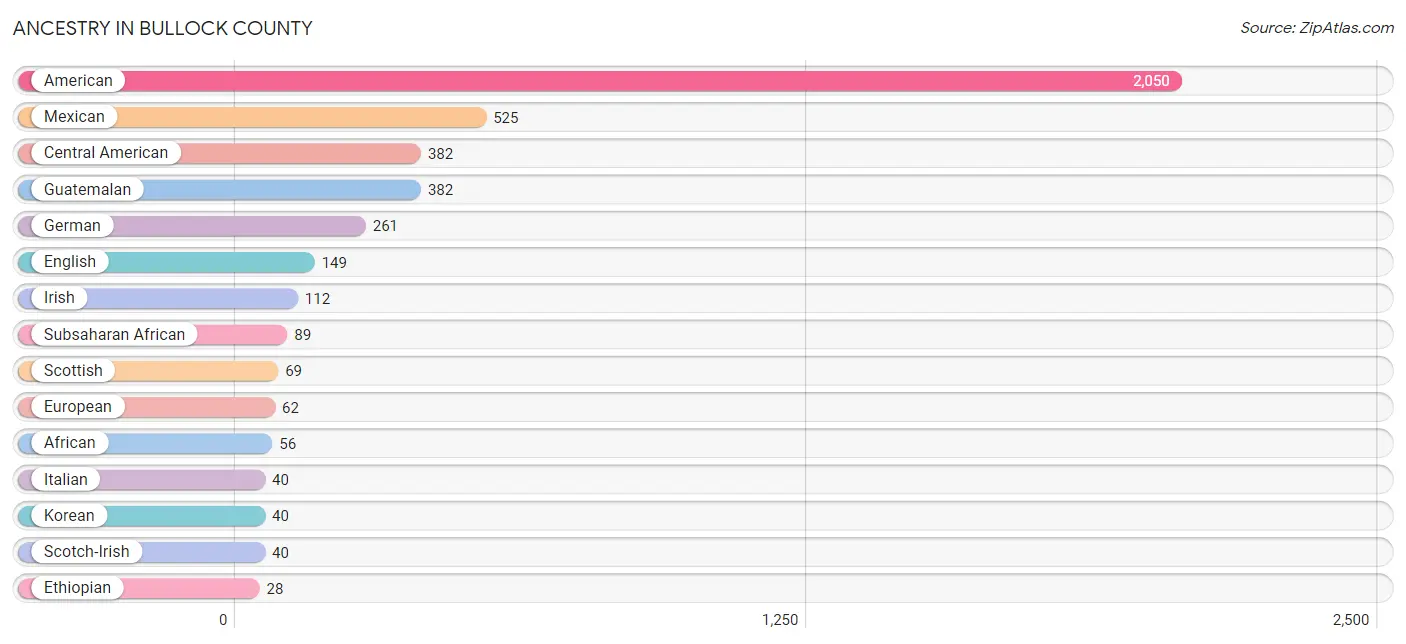
Ancestry in Bullock County
The most populous ancestries reported in Bullock County are American (2,050 | 19.9%), Mexican (525 | 5.1%), Central American (382 | 3.7%), Guatemalan (382 | 3.7%), and German (261 | 2.5%), together accounting for 34.9% of all Bullock County residents.
| Ancestry | # Population | % Population |
| African | 56 | 0.5% |
| American | 2,050 | 19.9% |
| British | 19 | 0.2% |
| Central American | 382 | 3.7% |
| Cherokee | 3 | 0.0% |
| Creek | 3 | 0.0% |
| English | 149 | 1.4% |
| Ethiopian | 28 | 0.3% |
| European | 62 | 0.6% |
| French Canadian | 5 | 0.1% |
| German | 261 | 2.5% |
| Guatemalan | 382 | 3.7% |
| Haitian | 12 | 0.1% |
| Irish | 112 | 1.1% |
| Italian | 40 | 0.4% |
| Jamaican | 12 | 0.1% |
| Korean | 40 | 0.4% |
| Mexican | 525 | 5.1% |
| Nigerian | 5 | 0.1% |
| Scotch-Irish | 40 | 0.4% |
| Scottish | 69 | 0.7% |
| Subsaharan African | 89 | 0.9% | View All 22 Rows |
Immigrants in Bullock County
The most numerous immigrant groups reported in Bullock County came from Central America (324 | 3.1%), Latin America (324 | 3.1%), Guatemala (243 | 2.4%), Mexico (81 | 0.8%), and Africa (33 | 0.3%), together accounting for 9.7% of all Bullock County residents.

| Immigration Origin | # Population | % Population |
| Africa | 33 | 0.3% |
| Central America | 324 | 3.1% |
| Eastern Africa | 28 | 0.3% |
| Ethiopia | 28 | 0.3% |
| Europe | 32 | 0.3% |
| Guatemala | 243 | 2.4% |
| Italy | 32 | 0.3% |
| Latin America | 324 | 3.1% |
| Mexico | 81 | 0.8% |
| Nigeria | 5 | 0.1% |
| Southern Europe | 32 | 0.3% |
| Western Africa | 5 | 0.1% | View All 12 Rows |
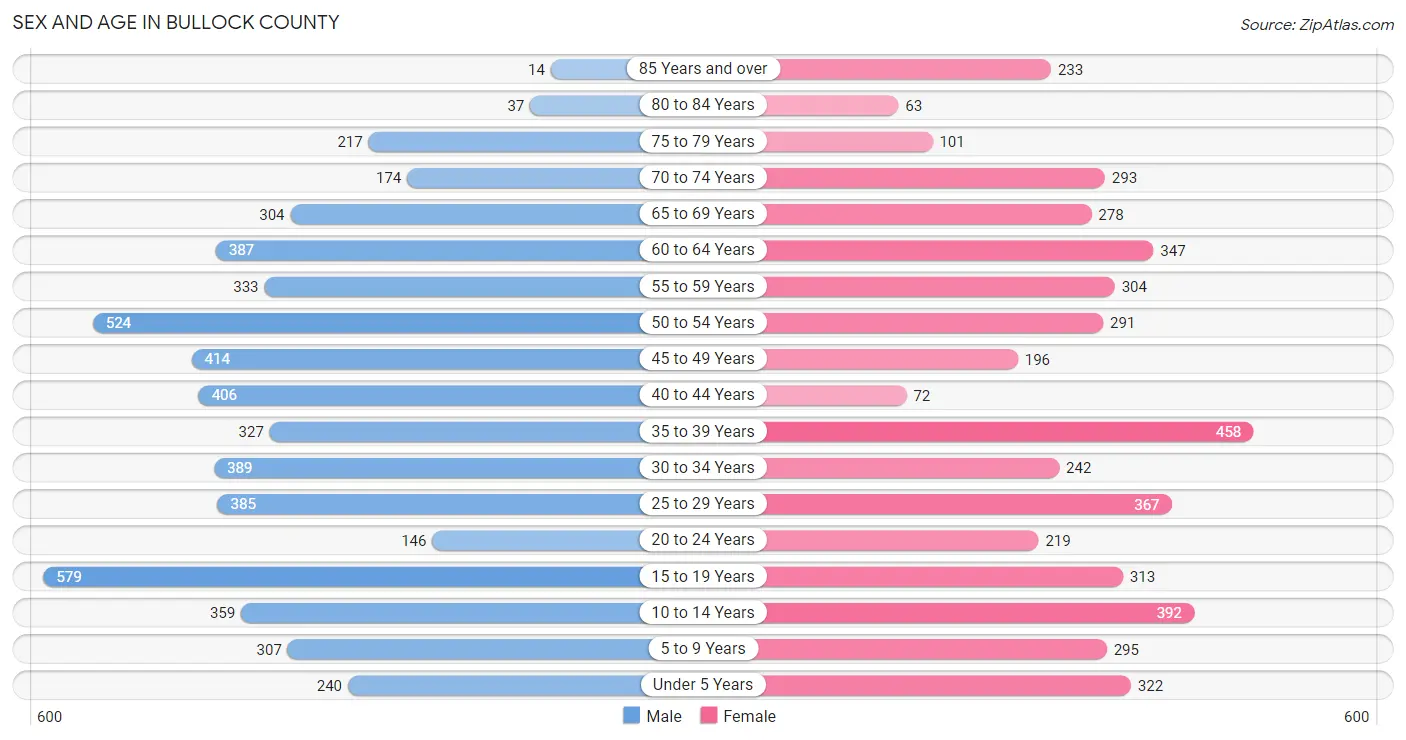
Sex and Age in Bullock County
Sex and Age in Bullock County
The most populous age groups in Bullock County are 15 to 19 Years (579 | 10.4%) for men and 35 to 39 Years (458 | 9.6%) for women.
| Age Bracket | Male | Female |
| Under 5 Years | 240 (4.3%) | 322 (6.7%) |
| 5 to 9 Years | 307 (5.5%) | 295 (6.2%) |
| 10 to 14 Years | 359 (6.5%) | 392 (8.2%) |
| 15 to 19 Years | 579 (10.4%) | 313 (6.5%) |
| 20 to 24 Years | 146 (2.6%) | 219 (4.6%) |
| 25 to 29 Years | 385 (7.0%) | 367 (7.7%) |
| 30 to 34 Years | 389 (7.0%) | 242 (5.1%) |
| 35 to 39 Years | 327 (5.9%) | 458 (9.6%) |
| 40 to 44 Years | 406 (7.3%) | 72 (1.5%) |
| 45 to 49 Years | 414 (7.5%) | 196 (4.1%) |
| 50 to 54 Years | 524 (9.5%) | 291 (6.1%) |
| 55 to 59 Years | 333 (6.0%) | 304 (6.4%) |
| 60 to 64 Years | 387 (7.0%) | 347 (7.2%) |
| 65 to 69 Years | 304 (5.5%) | 278 (5.8%) |
| 70 to 74 Years | 174 (3.1%) | 293 (6.1%) |
| 75 to 79 Years | 217 (3.9%) | 101 (2.1%) |
| 80 to 84 Years | 37 (0.7%) | 63 (1.3%) |
| 85 Years and over | 14 (0.3%) | 233 (4.9%) |
| Total | 5,542 (100.0%) | 4,786 (100.0%) |
Families and Households in Bullock County
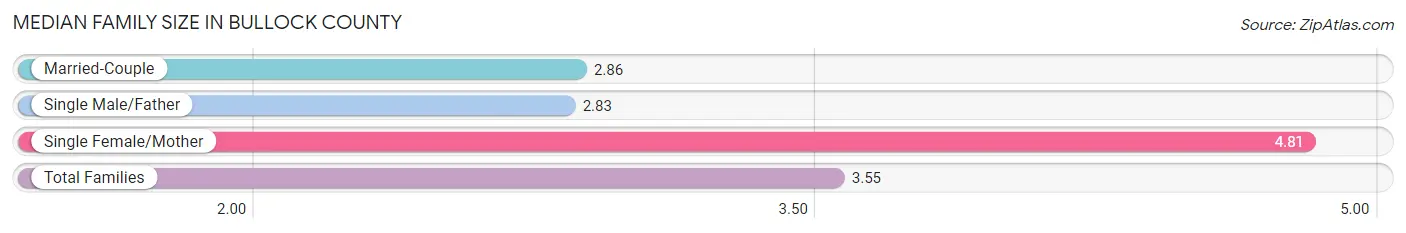
Median Family Size in Bullock County
The median family size in Bullock County is 3.55 persons per family, with single female/mother families (801 | 35.6%) accounting for the largest median family size of 4.81 persons per family. On the other hand, single male/father families (263 | 11.7%) represent the smallest median family size with 2.83 persons per family.
| Family Type | # Families | Family Size |
| Married-Couple | 1,184 (52.7%) | 2.86 |
| Single Male/Father | 263 (11.7%) | 2.83 |
| Single Female/Mother | 801 (35.6%) | 4.81 |
| Total Families | 2,248 (100.0%) | 3.55 |
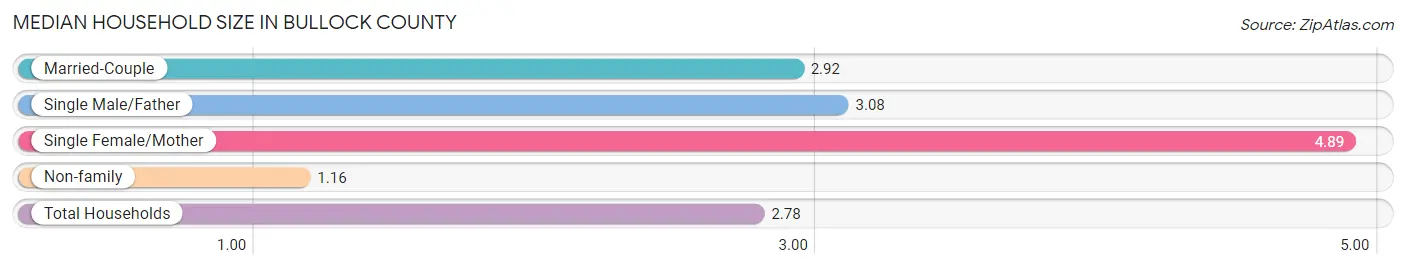
Median Household Size in Bullock County
The median household size in Bullock County is 2.78 persons per household, with single female/mother households (801 | 23.2%) accounting for the largest median household size of 4.89 persons per household. non-family households (1,202 | 34.8%) represent the smallest median household size with 1.16 persons per household.
| Household Type | # Households | Household Size |
| Married-Couple | 1,184 (34.3%) | 2.92 |
| Single Male/Father | 263 (7.6%) | 3.08 |
| Single Female/Mother | 801 (23.2%) | 4.89 |
| Non-family | 1,202 (34.8%) | 1.16 |
| Total Households | 3,450 (100.0%) | 2.78 |
Household Size by Marriage Status in Bullock County
Out of a total of 3,450 households in Bullock County, 2,248 (65.2%) are family households, while 1,202 (34.8%) are nonfamily households. The most numerous type of family households are 2-person households, comprising 1,016, and the most common type of nonfamily households are 1-person households, comprising 1,095.

| Household Size | Family Households | Nonfamily Households |
| 1-Person Households | - | 1,095 (31.7%) |
| 2-Person Households | 1,016 (29.4%) | 102 (3.0%) |
| 3-Person Households | 547 (15.9%) | 5 (0.1%) |
| 4-Person Households | 363 (10.5%) | 0 (0.0%) |
| 5-Person Households | 234 (6.8%) | 0 (0.0%) |
| 6-Person Households | 34 (1.0%) | 0 (0.0%) |
| 7+ Person Households | 54 (1.6%) | 0 (0.0%) |
| Total | 2,248 (65.2%) | 1,202 (34.8%) |
Female Fertility in Bullock County
Fertility by Age in Bullock County
Average fertility rate in Bullock County is 44.0 births per 1,000 women. Women in the age bracket of 20 to 34 years have the highest fertility rate with 105.0 births per 1,000 women. Women in the age bracket of 20 to 34 years acount for 100.0% of all women with births.

| Age Bracket | Women with Births | Births / 1,000 Women |
| 15 to 19 years | 0 (0.0%) | 0.0 |
| 20 to 34 years | 87 (100.0%) | 105.0 |
| 35 to 50 years | 0 (0.0%) | 0.0 |
| Total | 87 (100.0%) | 44.0 |
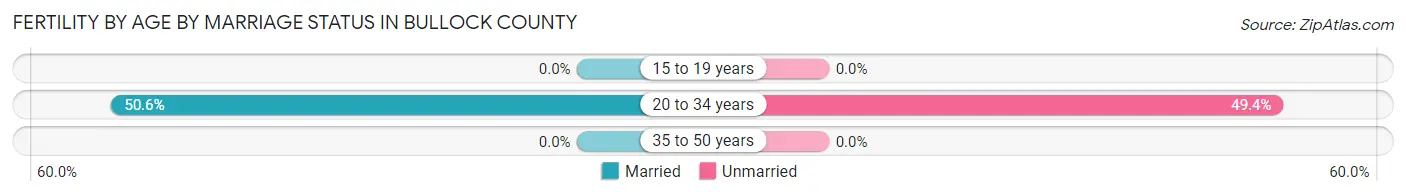
Fertility by Age by Marriage Status in Bullock County
50.6% of women with births (87) in Bullock County are married. The highest percentage of unmarried women with births falls into 20 to 34 years age bracket with 49.4% of them unmarried at the time of birth, while the lowest percentage of unmarried women with births belong to 20 to 34 years age bracket with 49.4% of them unmarried.
| Age Bracket | Married | Unmarried |
| 15 to 19 years | 0 (0.0%) | 0 (0.0%) |
| 20 to 34 years | 44 (50.6%) | 43 (49.4%) |
| 35 to 50 years | 0 (0.0%) | 0 (0.0%) |
| Total | 44 (50.6%) | 43 (49.4%) |
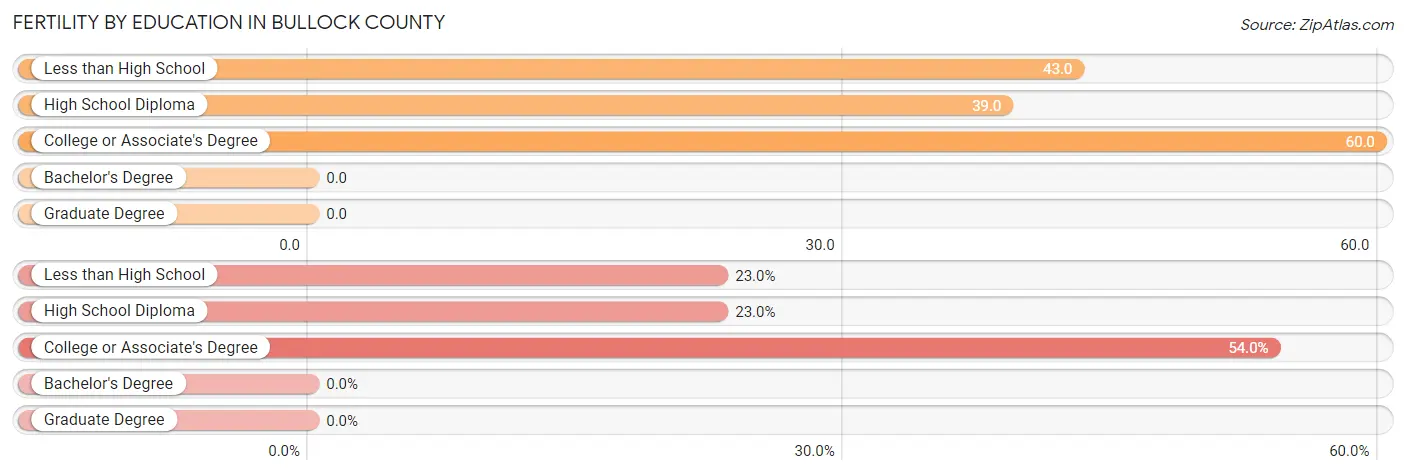
Fertility by Education in Bullock County
| Educational Attainment | Women with Births | Births / 1,000 Women |
| Less than High School | 20 (23.0%) | 43.0 |
| High School Diploma | 20 (23.0%) | 39.0 |
| College or Associate's Degree | 47 (54.0%) | 60.0 |
| Bachelor's Degree | 0 (0.0%) | 0.0 |
| Graduate Degree | 0 (0.0%) | 0.0 |
| Total | 87 (100.0%) | 44.0 |
Fertility by Education by Marriage Status in Bullock County
49.4% of women with births in Bullock County are unmarried. Women with the educational attainment of less than high school are most likely to be married with 100.0% of them married at childbirth, while women with the educational attainment of college or associate's degree are least likely to be married with 91.5% of them unmarried at childbirth.

| Educational Attainment | Married | Unmarried |
| Less than High School | 20 (100.0%) | 0 (0.0%) |
| High School Diploma | 20 (100.0%) | 0 (0.0%) |
| College or Associate's Degree | 4 (8.5%) | 43 (91.5%) |
| Bachelor's Degree | 0 (0.0%) | 0 (0.0%) |
| Graduate Degree | 0 (0.0%) | 0 (0.0%) |
| Total | 44 (50.6%) | 43 (49.4%) |
Income in Bullock County
Income Overview in Bullock County
Per Capita Income in Bullock County is $22,115, while median incomes of families and households are $43,750 and $36,136 respectively.
| Characteristic | Number | Measure |
| Per Capita Income | 10,328 | $22,115 |
| Median Family Income | 2,248 | $43,750 |
| Mean Family Income | 2,248 | $64,959 |
| Median Household Income | 3,450 | $36,136 |
| Mean Household Income | 3,450 | $52,269 |
| Income Deficit | 2,248 | $0 |
| Wage / Income Gap (%) | 10,328 | 32.02% |
| Wage / Income Gap ($) | 10,328 | 67.98¢ per $1 |
| Gini / Inequality Index | 10,328 | 0.51 |
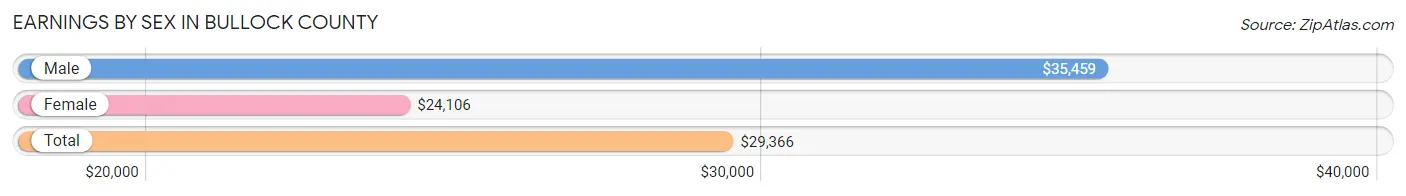
Earnings by Sex in Bullock County
Average Earnings in Bullock County are $29,366, $35,459 for men and $24,106 for women, a difference of 32.0%.
| Sex | Number | Average Earnings |
| Male | 2,651 (56.4%) | $35,459 |
| Female | 2,046 (43.6%) | $24,106 |
| Total | 4,697 (100.0%) | $29,366 |
Earnings by Sex by Income Bracket in Bullock County
The most common earnings brackets in Bullock County are $50,000 to $54,999 for men (329 | 12.4%) and $25,000 to $29,999 for women (288 | 14.1%).
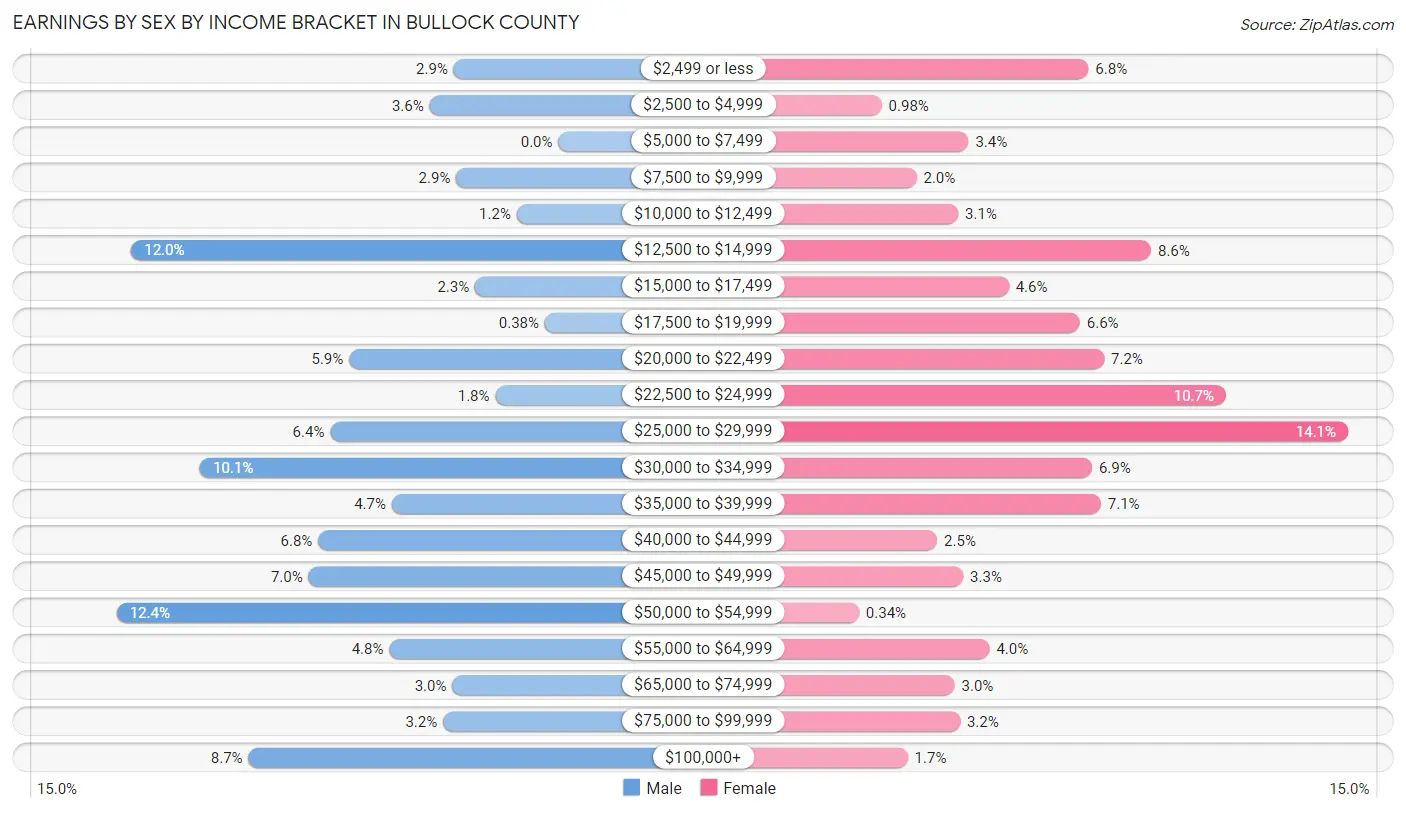
| Income | Male | Female |
| $2,499 or less | 78 (2.9%) | 139 (6.8%) |
| $2,500 to $4,999 | 96 (3.6%) | 20 (1.0%) |
| $5,000 to $7,499 | 0 (0.0%) | 70 (3.4%) |
| $7,500 to $9,999 | 76 (2.9%) | 40 (2.0%) |
| $10,000 to $12,499 | 31 (1.2%) | 64 (3.1%) |
| $12,500 to $14,999 | 318 (12.0%) | 175 (8.6%) |
| $15,000 to $17,499 | 62 (2.3%) | 93 (4.5%) |
| $17,500 to $19,999 | 10 (0.4%) | 134 (6.6%) |
| $20,000 to $22,499 | 156 (5.9%) | 148 (7.2%) |
| $22,500 to $24,999 | 47 (1.8%) | 218 (10.6%) |
| $25,000 to $29,999 | 170 (6.4%) | 288 (14.1%) |
| $30,000 to $34,999 | 267 (10.1%) | 141 (6.9%) |
| $35,000 to $39,999 | 124 (4.7%) | 146 (7.1%) |
| $40,000 to $44,999 | 179 (6.8%) | 52 (2.5%) |
| $45,000 to $49,999 | 186 (7.0%) | 67 (3.3%) |
| $50,000 to $54,999 | 329 (12.4%) | 7 (0.3%) |
| $55,000 to $64,999 | 126 (4.8%) | 82 (4.0%) |
| $65,000 to $74,999 | 79 (3.0%) | 62 (3.0%) |
| $75,000 to $99,999 | 86 (3.2%) | 65 (3.2%) |
| $100,000+ | 231 (8.7%) | 35 (1.7%) |
| Total | 2,651 (100.0%) | 2,046 (100.0%) |
Earnings by Sex by Educational Attainment in Bullock County
Average earnings in Bullock County are $38,472 for men and $25,339 for women, a difference of 34.1%. Men with an educational attainment of college or associate's degree enjoy the highest average annual earnings of $45,888, while those with high school diploma education earn the least with $32,378. Women with an educational attainment of bachelor's degree earn the most with the average annual earnings of $31,395, while those with college or associate's degree education have the smallest earnings of $23,598.
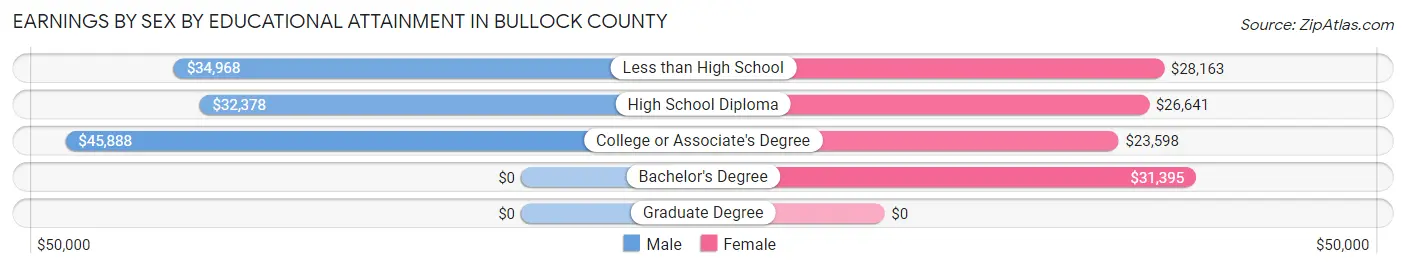
| Educational Attainment | Male Income | Female Income |
| Less than High School | $34,968 | $28,163 |
| High School Diploma | $32,378 | $26,641 |
| College or Associate's Degree | $45,888 | $23,598 |
| Bachelor's Degree | - | - |
| Graduate Degree | - | - |
| Total | $38,472 | $25,339 |
Family Income in Bullock County
Family Income Brackets in Bullock County
According to the Bullock County family income data, there are 409 families falling into the $35,000 to $49,999 income range, which is the most common income bracket and makes up 18.2% of all families. Conversely, the $150,000 to $199,999 income bracket is the least frequent group with only 52 families (2.3%) belonging to this category.

| Income Bracket | # Families | % Families |
| Less than $10,000 | 216 | 9.6% |
| $10,000 to $14,999 | 79 | 3.5% |
| $15,000 to $24,999 | 283 | 12.6% |
| $25,000 to $34,999 | 225 | 10.0% |
| $35,000 to $49,999 | 409 | 18.2% |
| $50,000 to $74,999 | 321 | 14.3% |
| $75,000 to $99,999 | 198 | 8.8% |
| $100,000 to $149,999 | 387 | 17.2% |
| $150,000 to $199,999 | 52 | 2.3% |
| $200,000+ | 79 | 3.5% |
Family Income by Famaliy Size in Bullock County
2-person families (1,105 | 49.1%) account for the highest median family income in Bullock County with $43,867 per family, while 2-person families (1,105 | 49.1%) have the highest median income of $21,934 per family member.
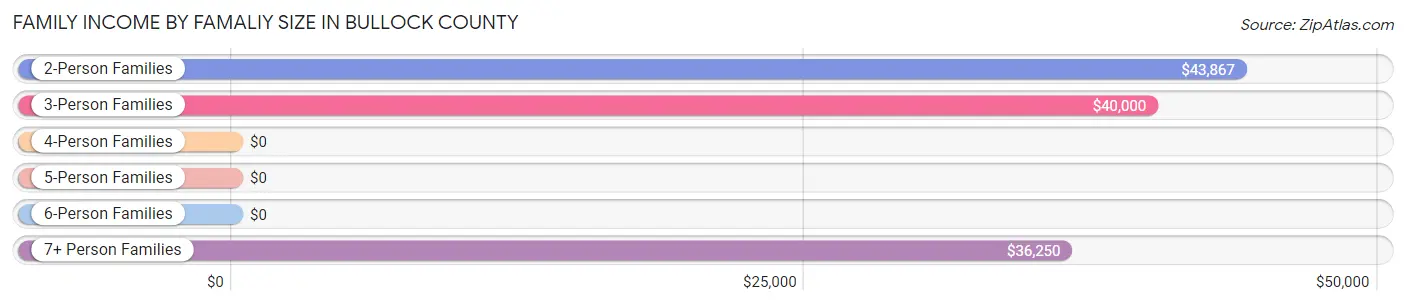
| Income Bracket | # Families | Median Income |
| 2-Person Families | 1,105 (49.1%) | $43,867 |
| 3-Person Families | 458 (20.4%) | $40,000 |
| 4-Person Families | 414 (18.4%) | $0 |
| 5-Person Families | 217 (9.7%) | $0 |
| 6-Person Families | 0 (0.0%) | $0 |
| 7+ Person Families | 54 (2.4%) | $36,250 |
| Total | 2,248 (100.0%) | $43,750 |
Family Income by Number of Earners in Bullock County
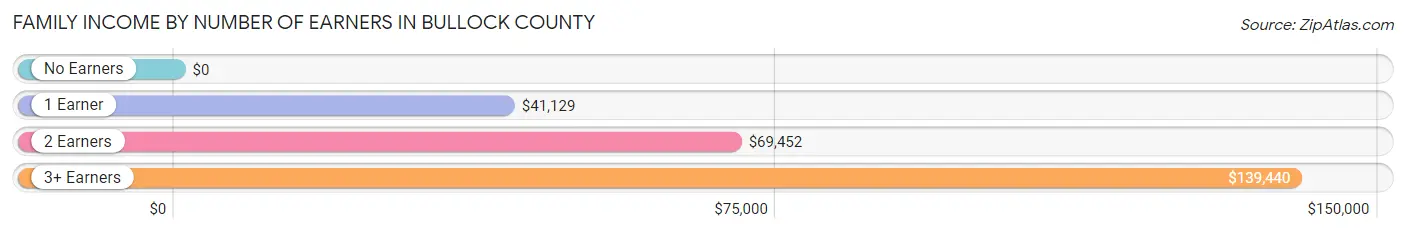
| Number of Earners | # Families | Median Income |
| No Earners | 442 (19.7%) | $0 |
| 1 Earner | 935 (41.6%) | $41,129 |
| 2 Earners | 755 (33.6%) | $69,452 |
| 3+ Earners | 116 (5.2%) | $139,440 |
| Total | 2,248 (100.0%) | $43,750 |
Household Income in Bullock County
Household Income Brackets in Bullock County
With 559 households falling in the category, the $35,000 to $49,999 income range is the most frequent in Bullock County, accounting for 16.2% of all households. In contrast, only 52 households (1.5%) fall into the $150,000 to $199,999 income bracket, making it the least populous group.
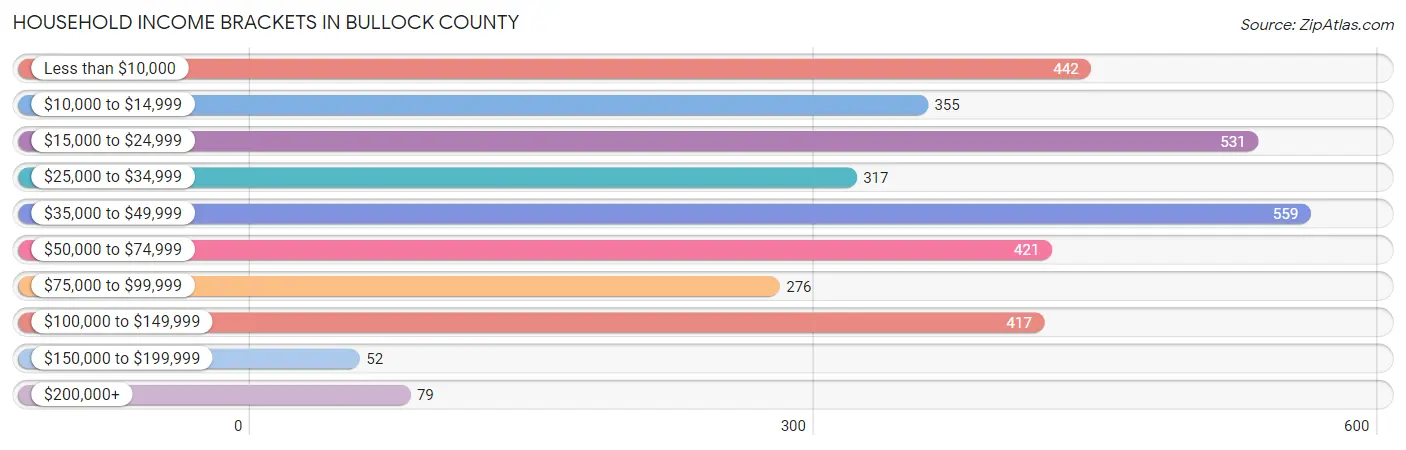
| Income Bracket | # Households | % Households |
| Less than $10,000 | 442 | 12.8% |
| $10,000 to $14,999 | 355 | 10.3% |
| $15,000 to $24,999 | 531 | 15.4% |
| $25,000 to $34,999 | 317 | 9.2% |
| $35,000 to $49,999 | 559 | 16.2% |
| $50,000 to $74,999 | 421 | 12.2% |
| $75,000 to $99,999 | 276 | 8.0% |
| $100,000 to $149,999 | 417 | 12.1% |
| $150,000 to $199,999 | 52 | 1.5% |
| $200,000+ | 79 | 2.3% |
Household Income by Householder Age in Bullock County
The median household income in Bullock County is $36,136, with the highest median household income of $63,897 found in the 15 to 24 years age bracket for the primary householder. A total of 113 households (3.3%) fall into this category. Meanwhile, the 65+ years age bracket for the primary householder has the lowest median household income of $27,899, with 1,129 households (32.7%) in this group.

| Income Bracket | # Households | Median Income |
| 15 to 24 Years | 113 (3.3%) | $63,897 |
| 25 to 44 Years | 948 (27.5%) | $37,853 |
| 45 to 64 Years | 1,260 (36.5%) | $31,694 |
| 65+ Years | 1,129 (32.7%) | $27,899 |
| Total | 3,450 (100.0%) | $36,136 |
Poverty in Bullock County
Income Below Poverty by Sex and Age in Bullock County
With 25.9% poverty level for males and 30.1% for females among the residents of Bullock County, 6 to 11 year old males and under 5 year old females are the most vulnerable to poverty, with 184 males (71.0%) and 203 females (63.0%) in their respective age groups living below the poverty level.
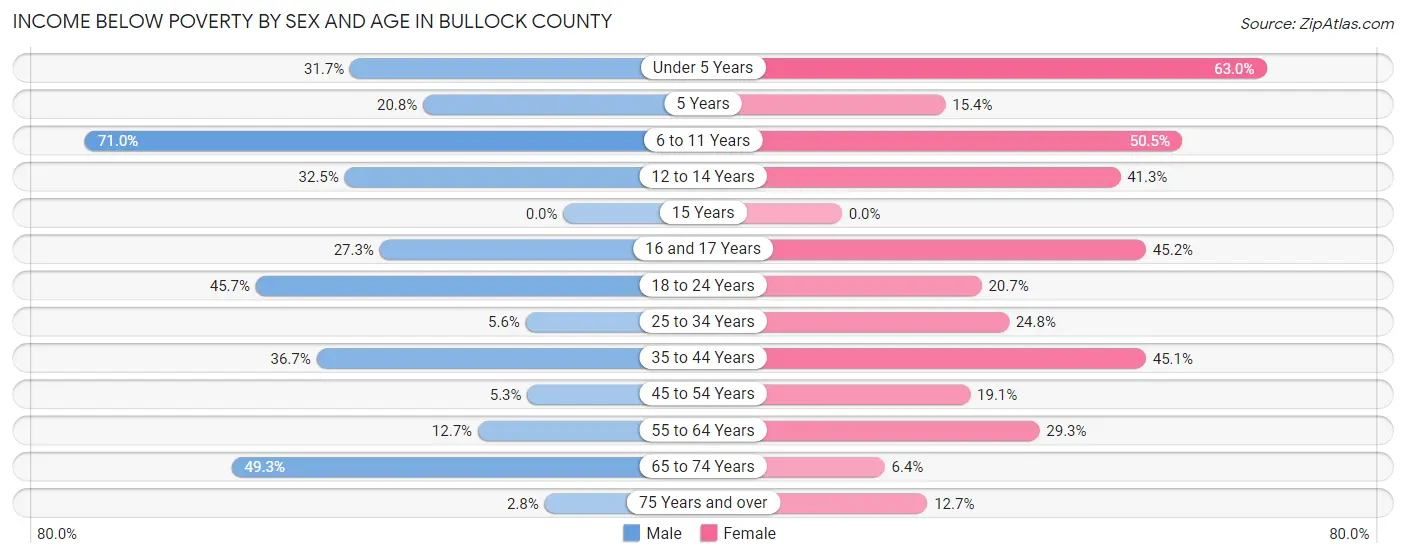
| Age Bracket | Male | Female |
| Under 5 Years | 76 (31.7%) | 203 (63.0%) |
| 5 Years | 15 (20.8%) | 2 (15.4%) |
| 6 to 11 Years | 184 (71.0%) | 212 (50.5%) |
| 12 to 14 Years | 101 (32.5%) | 105 (41.3%) |
| 15 Years | 0 (0.0%) | 0 (0.0%) |
| 16 and 17 Years | 27 (27.3%) | 56 (45.2%) |
| 18 to 24 Years | 269 (45.7%) | 84 (20.7%) |
| 25 to 34 Years | 38 (5.6%) | 151 (24.8%) |
| 35 to 44 Years | 206 (36.6%) | 237 (45.1%) |
| 45 to 54 Years | 35 (5.3%) | 92 (19.1%) |
| 55 to 64 Years | 90 (12.7%) | 191 (29.3%) |
| 65 to 74 Years | 229 (49.2%) | 35 (6.4%) |
| 75 Years and over | 7 (2.8%) | 42 (12.7%) |
| Total | 1,277 (25.9%) | 1,410 (30.1%) |
Income Above Poverty by Sex and Age in Bullock County
According to the poverty statistics in Bullock County, males aged 15 years and females aged 15 years are the age groups that are most secure financially, with 100.0% of males and 100.0% of females in these age groups living above the poverty line.
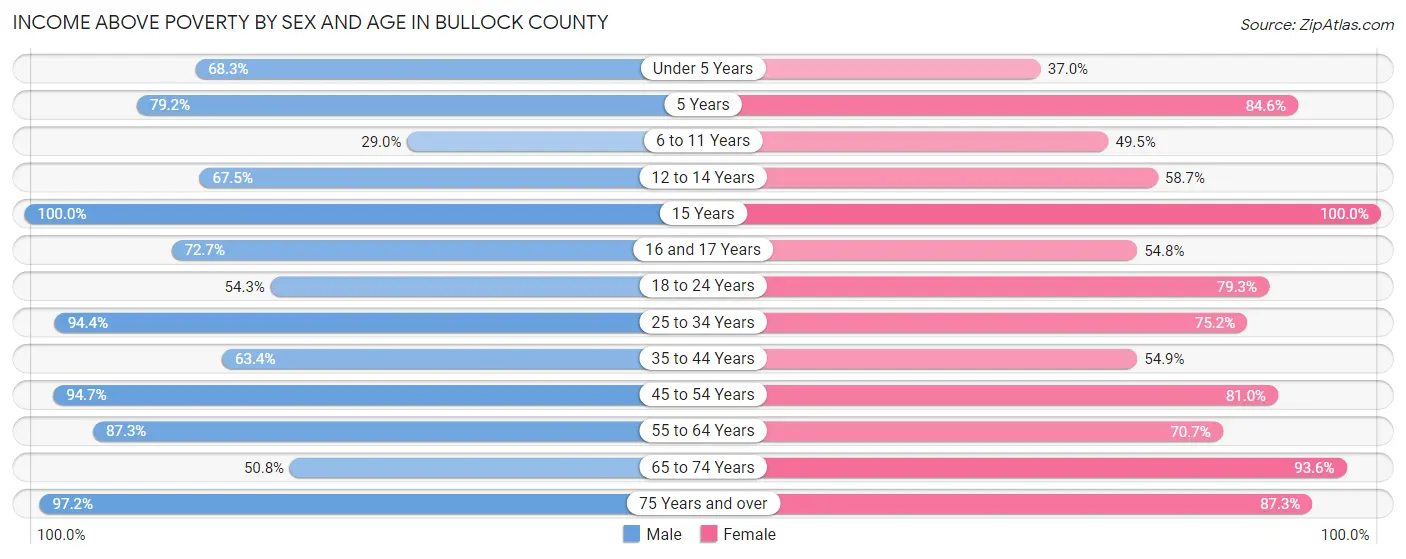
| Age Bracket | Male | Female |
| Under 5 Years | 164 (68.3%) | 119 (37.0%) |
| 5 Years | 57 (79.2%) | 11 (84.6%) |
| 6 to 11 Years | 75 (29.0%) | 208 (49.5%) |
| 12 to 14 Years | 210 (67.5%) | 149 (58.7%) |
| 15 Years | 34 (100.0%) | 3 (100.0%) |
| 16 and 17 Years | 72 (72.7%) | 68 (54.8%) |
| 18 to 24 Years | 320 (54.3%) | 321 (79.3%) |
| 25 to 34 Years | 641 (94.4%) | 458 (75.2%) |
| 35 to 44 Years | 356 (63.3%) | 288 (54.9%) |
| 45 to 54 Years | 621 (94.7%) | 391 (80.9%) |
| 55 to 64 Years | 619 (87.3%) | 460 (70.7%) |
| 65 to 74 Years | 236 (50.7%) | 515 (93.6%) |
| 75 Years and over | 244 (97.2%) | 289 (87.3%) |
| Total | 3,649 (74.1%) | 3,280 (69.9%) |
Income Below Poverty Among Married-Couple Families in Bullock County
The poverty statistics for married-couple families in Bullock County show that 16.2% or 192 of the total 1,184 families live below the poverty line. Families with 5 or more children have the highest poverty rate of 100.0%, comprising of 47 families. On the other hand, families with 3 or 4 children have the lowest poverty rate of 0.0%, which includes 0 families.
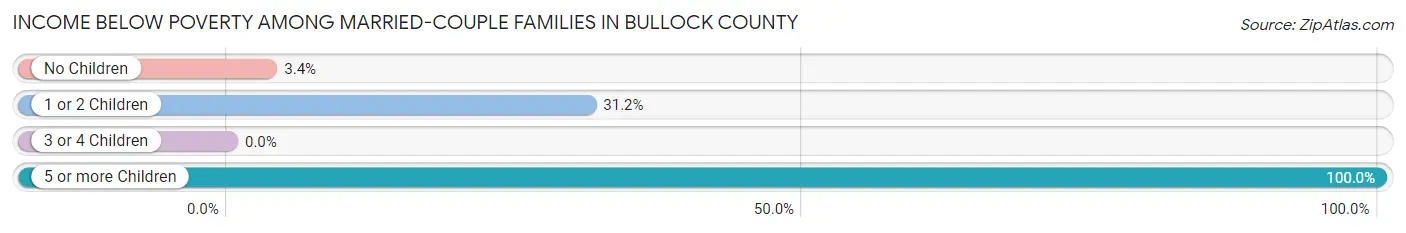
| Children | Above Poverty | Below Poverty |
| No Children | 677 (96.6%) | 24 (3.4%) |
| 1 or 2 Children | 267 (68.8%) | 121 (31.2%) |
| 3 or 4 Children | 48 (100.0%) | 0 (0.0%) |
| 5 or more Children | 0 (0.0%) | 47 (100.0%) |
| Total | 992 (83.8%) | 192 (16.2%) |
Income Below Poverty Among Single-Parent Households in Bullock County
According to the poverty data in Bullock County, 12.6% or 33 single-father households and 33.8% or 271 single-mother households are living below the poverty line. Among single-father households, those with no children have the highest poverty rate, with 33 households (32.0%) experiencing poverty. Likewise, among single-mother households, those with 3 or 4 children have the highest poverty rate, with 59 households (76.6%) falling below the poverty line.

| Children | Single Father | Single Mother |
| No Children | 33 (32.0%) | 11 (5.1%) |
| 1 or 2 Children | 0 (0.0%) | 201 (40.0%) |
| 3 or 4 Children | 0 (0.0%) | 59 (76.6%) |
| 5 or more Children | 0 (0.0%) | 0 (0.0%) |
| Total | 33 (12.6%) | 271 (33.8%) |
Income Below Poverty Among Married-Couple vs Single-Parent Households in Bullock County
The poverty data for Bullock County shows that 192 of the married-couple family households (16.2%) and 304 of the single-parent households (28.6%) are living below the poverty level. Within the married-couple family households, those with 5 or more children have the highest poverty rate, with 47 households (100.0%) falling below the poverty line. Among the single-parent households, those with 3 or 4 children have the highest poverty rate, with 59 household (72.0%) living below poverty.
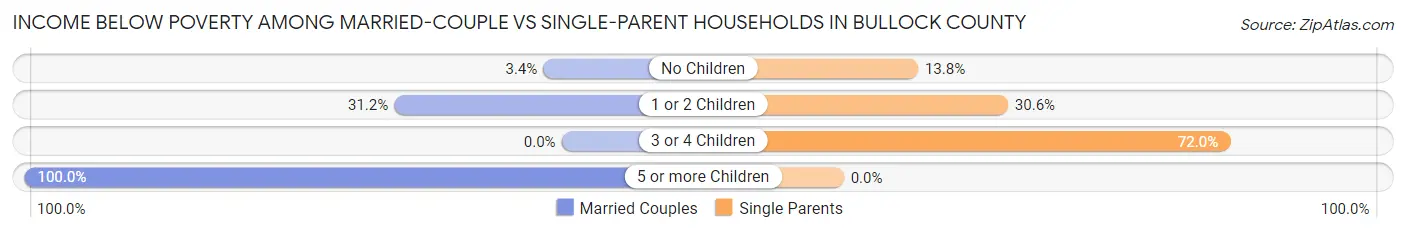
| Children | Married-Couple Families | Single-Parent Households |
| No Children | 24 (3.4%) | 44 (13.8%) |
| 1 or 2 Children | 121 (31.2%) | 201 (30.6%) |
| 3 or 4 Children | 0 (0.0%) | 59 (72.0%) |
| 5 or more Children | 47 (100.0%) | 0 (0.0%) |
| Total | 192 (16.2%) | 304 (28.6%) |
Employment Characteristics in Bullock County
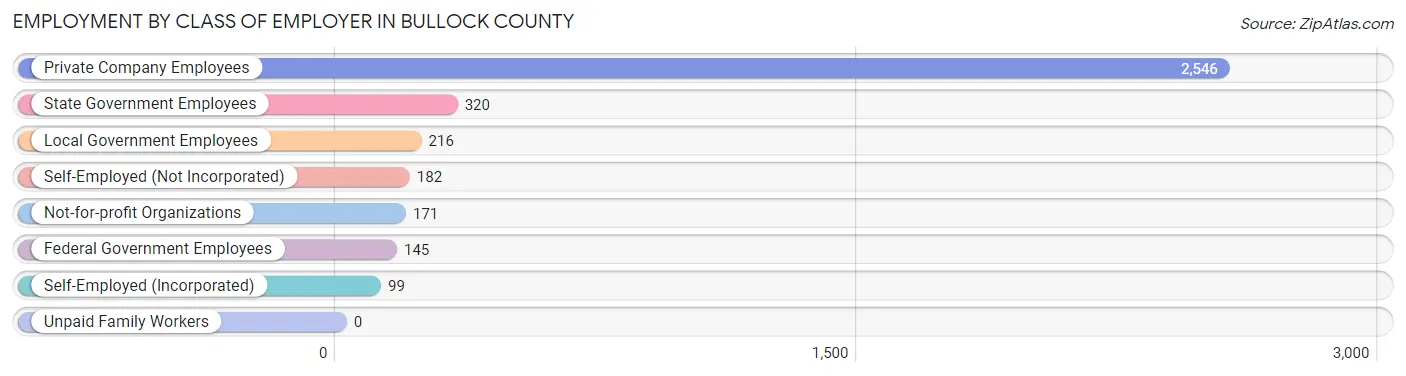
Employment by Class of Employer in Bullock County
Among the 3,679 employed individuals in Bullock County, private company employees (2,546 | 69.2%), state government employees (320 | 8.7%), and local government employees (216 | 5.9%) make up the most common classes of employment.
| Employer Class | # Employees | % Employees |
| Private Company Employees | 2,546 | 69.2% |
| Self-Employed (Incorporated) | 99 | 2.7% |
| Self-Employed (Not Incorporated) | 182 | 5.0% |
| Not-for-profit Organizations | 171 | 4.6% |
| Local Government Employees | 216 | 5.9% |
| State Government Employees | 320 | 8.7% |
| Federal Government Employees | 145 | 3.9% |
| Unpaid Family Workers | 0 | 0.0% |
| Total | 3,679 | 100.0% |
Employment Status by Age in Bullock County
According to the labor force statistics for Bullock County, out of the total population over 16 years of age (8,376), 46.4% or 3,886 individuals are in the labor force, with 3.7% or 144 of them unemployed. The age group with the highest labor force participation rate is 25 to 29 years, with 79.1% or 595 individuals in the labor force. Within the labor force, the 16 to 19 years age range has the highest percentage of unemployed individuals, with 48.1% or 76 of them being unemployed.
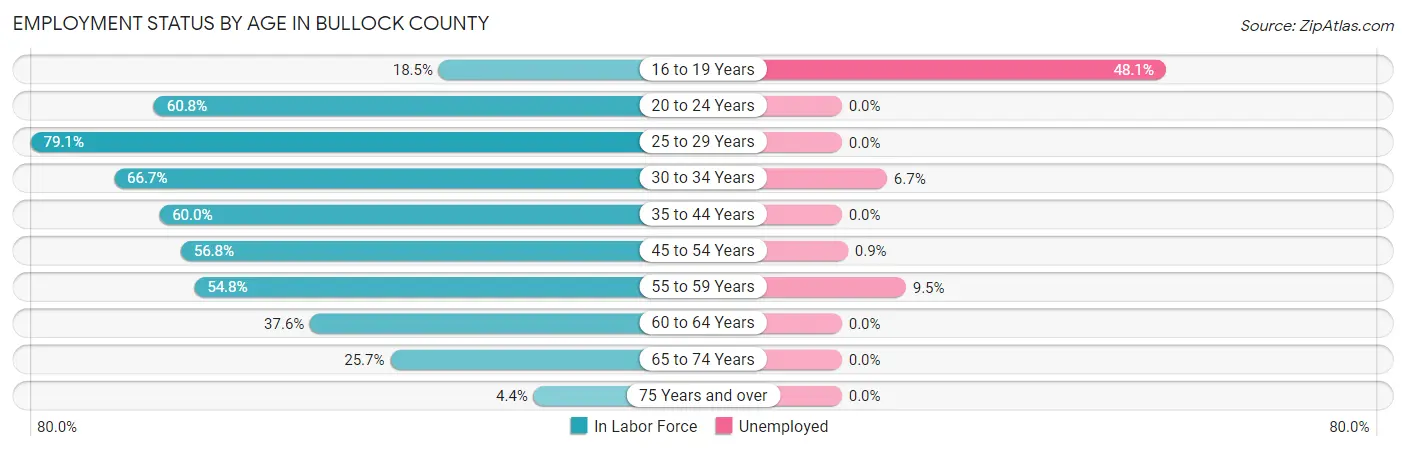
| Age Bracket | In Labor Force | Unemployed |
| 16 to 19 Years | 158 (18.5%) | 76 (48.1%) |
| 20 to 24 Years | 222 (60.8%) | 0 (0.0%) |
| 25 to 29 Years | 595 (79.1%) | 0 (0.0%) |
| 30 to 34 Years | 421 (66.7%) | 28 (6.7%) |
| 35 to 44 Years | 758 (60.0%) | 0 (0.0%) |
| 45 to 54 Years | 809 (56.8%) | 7 (0.9%) |
| 55 to 59 Years | 349 (54.8%) | 33 (9.5%) |
| 60 to 64 Years | 276 (37.6%) | 0 (0.0%) |
| 65 to 74 Years | 270 (25.7%) | 0 (0.0%) |
| 75 Years and over | 29 (4.4%) | 0 (0.0%) |
| Total | 3,886 (46.4%) | 144 (3.7%) |
Employment Status by Educational Attainment in Bullock County
According to labor force statistics for Bullock County, 59.0% of individuals (3,211) out of the total population between 25 and 64 years of age (5,442) are in the labor force, with 2.1% or 67 of them being unemployed. The group with the highest labor force participation rate are those with the educational attainment of bachelor's degree or higher, with 90.1% or 429 individuals in the labor force. Within the labor force, individuals with bachelor's degree or higher education have the highest percentage of unemployment, with 6.1% or 26 of them being unemployed.
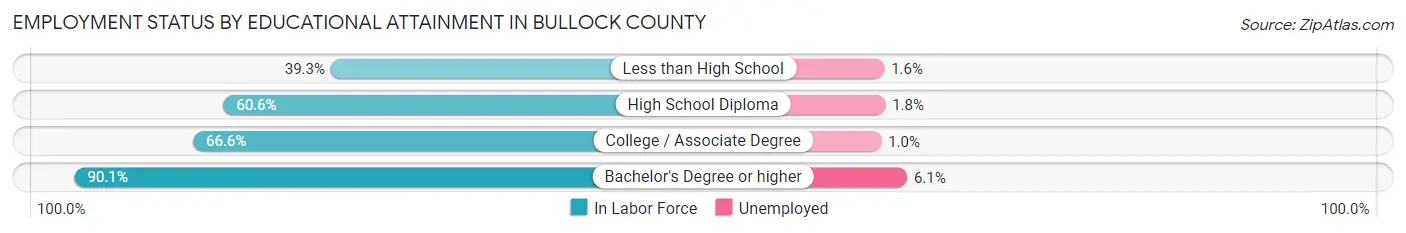
| Educational Attainment | In Labor Force | Unemployed |
| Less than High School | 564 (39.3%) | 23 (1.6%) |
| High School Diploma | 1,375 (60.6%) | 41 (1.8%) |
| College / Associate Degree | 840 (66.6%) | 13 (1.0%) |
| Bachelor's Degree or higher | 429 (90.1%) | 29 (6.1%) |
| Total | 3,211 (59.0%) | 114 (2.1%) |
Employment Occupations by Sex in Bullock County
Management, Business, Science and Arts Occupations
The most common Management, Business, Science and Arts occupations in Bullock County are Management (232 | 6.2%), Community & Social Service (203 | 5.4%), Computers, Engineering & Science (157 | 4.2%), Architecture & Engineering (145 | 3.9%), and Education Instruction & Library (138 | 3.7%).

Management, Business, Science and Arts Occupations by Sex
Within the Management, Business, Science and Arts occupations in Bullock County, the most male-oriented occupations are Legal Services & Support (100.0%), Architecture & Engineering (88.3%), and Computers, Engineering & Science (81.5%), while the most female-oriented occupations are Business & Financial (100.0%), Computers & Mathematics (100.0%), and Arts, Media & Entertainment (100.0%).

| Occupation | Male | Female |
| Management | 96 (41.4%) | 136 (58.6%) |
| Business & Financial | 0 (0.0%) | 50 (100.0%) |
| Computers, Engineering & Science | 128 (81.5%) | 29 (18.5%) |
| Computers & Mathematics | 0 (0.0%) | 12 (100.0%) |
| Architecture & Engineering | 128 (88.3%) | 17 (11.7%) |
| Life, Physical & Social Science | 0 (0.0%) | 0 (0.0%) |
| Community & Social Service | 65 (32.0%) | 138 (68.0%) |
| Education, Arts & Media | 19 (54.3%) | 16 (45.7%) |
| Legal Services & Support | 14 (100.0%) | 0 (0.0%) |
| Education Instruction & Library | 32 (23.2%) | 106 (76.8%) |
| Arts, Media & Entertainment | 0 (0.0%) | 16 (100.0%) |
| Health Diagnosing & Treating | 35 (26.1%) | 99 (73.9%) |
| Health Technologists | 35 (37.6%) | 58 (62.4%) |
| Total (Category) | 324 (41.7%) | 452 (58.3%) |
| Total (Overall) | 1,935 (51.7%) | 1,809 (48.3%) |
Services Occupations
The most common Services occupations in Bullock County are Cleaning & Maintenance (184 | 4.9%), Security & Protection (134 | 3.6%), Healthcare Support (131 | 3.5%), Food Preparation & Serving (117 | 3.1%), and Personal Care & Service (115 | 3.1%).

Services Occupations by Sex
Within the Services occupations in Bullock County, the most male-oriented occupations are Firefighting & Prevention (100.0%), Cleaning & Maintenance (68.5%), and Food Preparation & Serving (38.5%), while the most female-oriented occupations are Healthcare Support (100.0%), Law Enforcement (100.0%), and Personal Care & Service (100.0%).
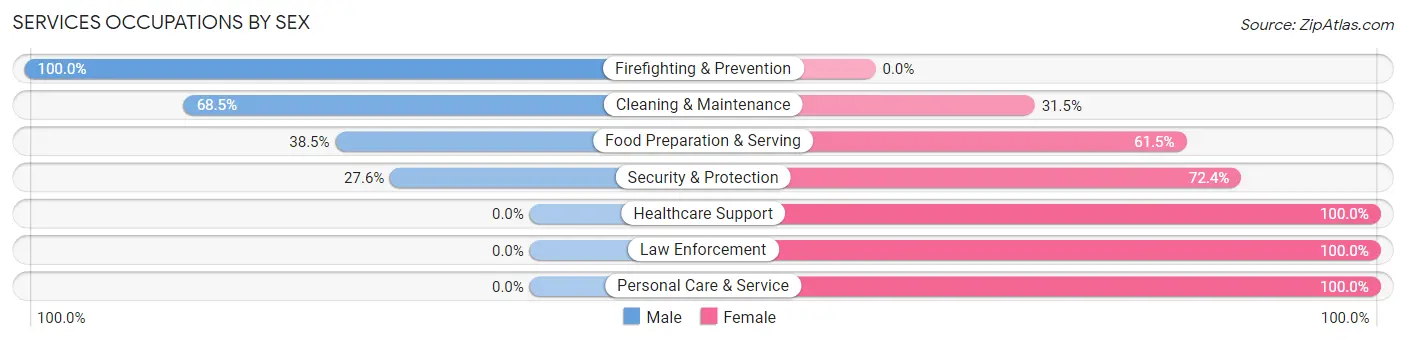
| Occupation | Male | Female |
| Healthcare Support | 0 (0.0%) | 131 (100.0%) |
| Security & Protection | 37 (27.6%) | 97 (72.4%) |
| Firefighting & Prevention | 37 (100.0%) | 0 (0.0%) |
| Law Enforcement | 0 (0.0%) | 97 (100.0%) |
| Food Preparation & Serving | 45 (38.5%) | 72 (61.5%) |
| Cleaning & Maintenance | 126 (68.5%) | 58 (31.5%) |
| Personal Care & Service | 0 (0.0%) | 115 (100.0%) |
| Total (Category) | 208 (30.5%) | 473 (69.5%) |
| Total (Overall) | 1,935 (51.7%) | 1,809 (48.3%) |
Sales and Office Occupations
The most common Sales and Office occupations in Bullock County are Sales & Related (235 | 6.3%), and Office & Administration (133 | 3.5%).

Sales and Office Occupations by Sex

| Occupation | Male | Female |
| Sales & Related | 60 (25.5%) | 175 (74.5%) |
| Office & Administration | 28 (21.0%) | 105 (78.9%) |
| Total (Category) | 88 (23.9%) | 280 (76.1%) |
| Total (Overall) | 1,935 (51.7%) | 1,809 (48.3%) |
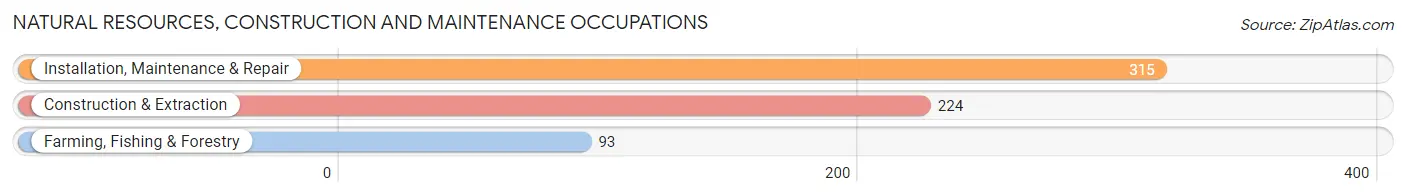
Natural Resources, Construction and Maintenance Occupations
The most common Natural Resources, Construction and Maintenance occupations in Bullock County are Installation, Maintenance & Repair (315 | 8.4%), Construction & Extraction (224 | 6.0%), and Farming, Fishing & Forestry (93 | 2.5%).
Natural Resources, Construction and Maintenance Occupations by Sex

| Occupation | Male | Female |
| Farming, Fishing & Forestry | 35 (37.6%) | 58 (62.4%) |
| Construction & Extraction | 160 (71.4%) | 64 (28.6%) |
| Installation, Maintenance & Repair | 315 (100.0%) | 0 (0.0%) |
| Total (Category) | 510 (80.7%) | 122 (19.3%) |
| Total (Overall) | 1,935 (51.7%) | 1,809 (48.3%) |
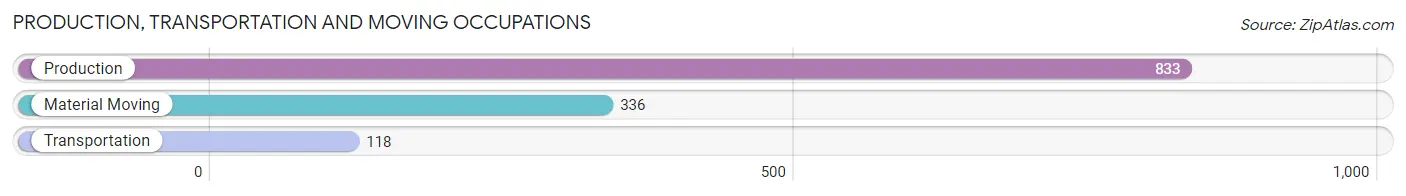
Production, Transportation and Moving Occupations
The most common Production, Transportation and Moving occupations in Bullock County are Production (833 | 22.3%), Material Moving (336 | 9.0%), and Transportation (118 | 3.2%).
Production, Transportation and Moving Occupations by Sex
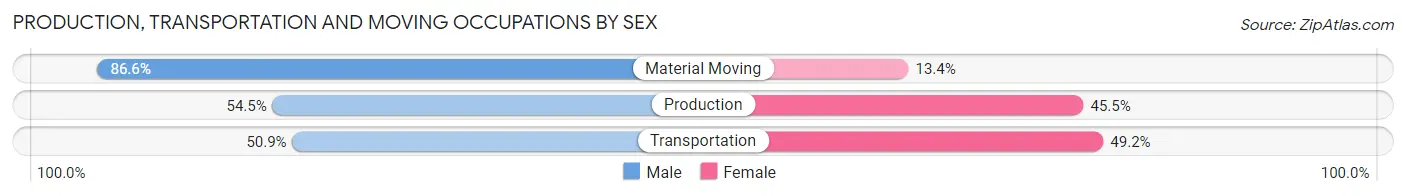
| Occupation | Male | Female |
| Production | 454 (54.5%) | 379 (45.5%) |
| Transportation | 60 (50.8%) | 58 (49.1%) |
| Material Moving | 291 (86.6%) | 45 (13.4%) |
| Total (Category) | 805 (62.5%) | 482 (37.4%) |
| Total (Overall) | 1,935 (51.7%) | 1,809 (48.3%) |
Employment Industries by Sex in Bullock County
Employment Industries in Bullock County
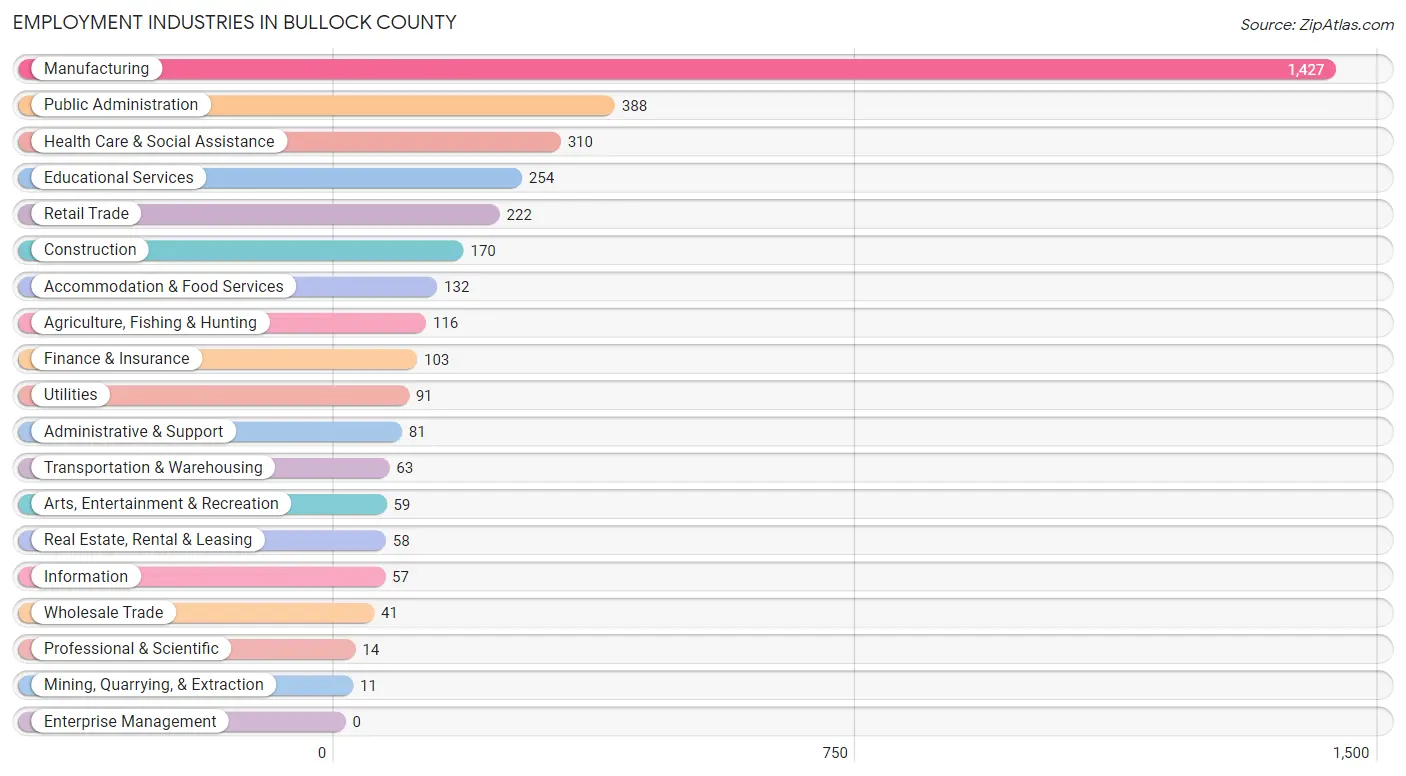
The major employment industries in Bullock County include Manufacturing (1,427 | 38.1%), Public Administration (388 | 10.4%), Health Care & Social Assistance (310 | 8.3%), Educational Services (254 | 6.8%), and Retail Trade (222 | 5.9%).
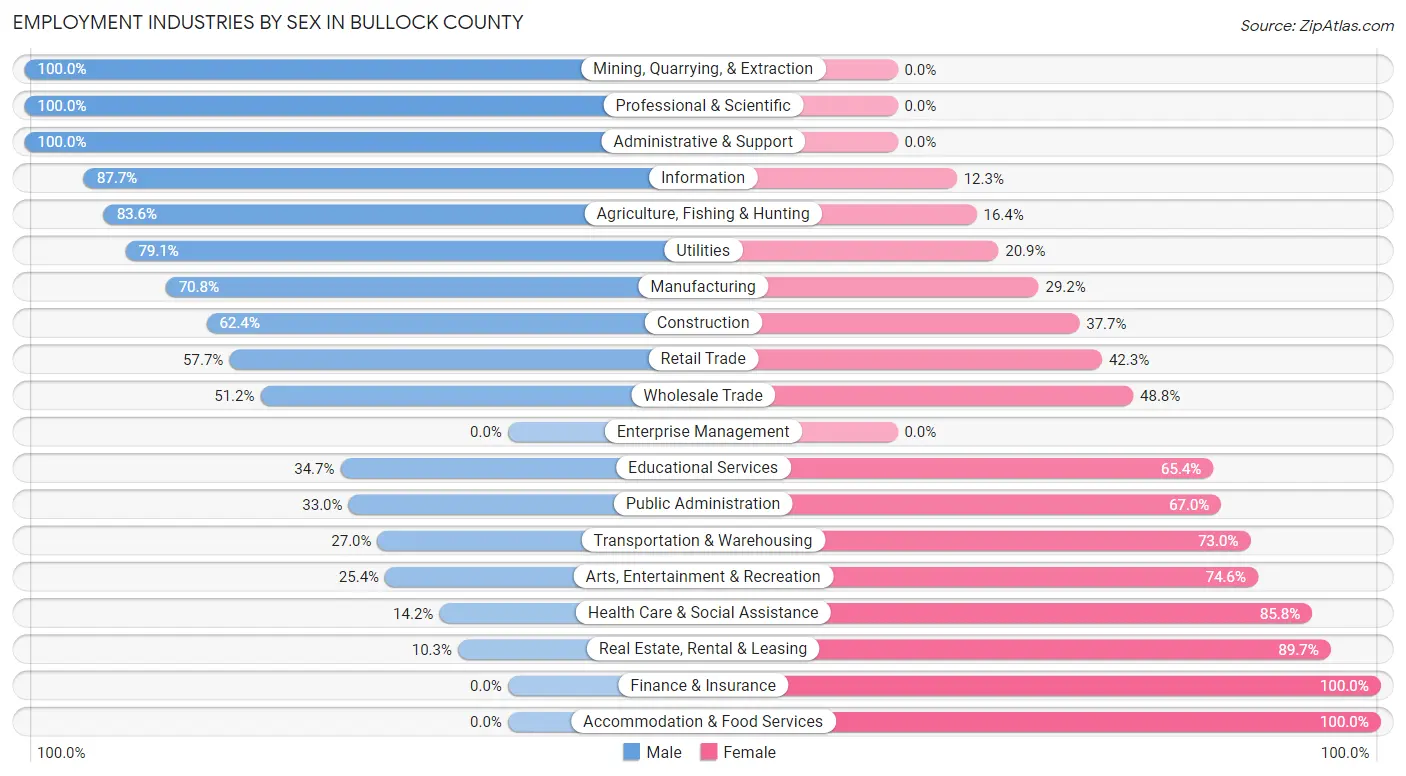
Employment Industries by Sex in Bullock County
The Bullock County industries that see more men than women are Mining, Quarrying, & Extraction (100.0%), Professional & Scientific (100.0%), and Administrative & Support (100.0%), whereas the industries that tend to have a higher number of women are Finance & Insurance (100.0%), Accommodation & Food Services (100.0%), and Real Estate, Rental & Leasing (89.7%).
| Industry | Male | Female |
| Agriculture, Fishing & Hunting | 97 (83.6%) | 19 (16.4%) |
| Mining, Quarrying, & Extraction | 11 (100.0%) | 0 (0.0%) |
| Construction | 106 (62.4%) | 64 (37.7%) |
| Manufacturing | 1,010 (70.8%) | 417 (29.2%) |
| Wholesale Trade | 21 (51.2%) | 20 (48.8%) |
| Retail Trade | 128 (57.7%) | 94 (42.3%) |
| Transportation & Warehousing | 17 (27.0%) | 46 (73.0%) |
| Utilities | 72 (79.1%) | 19 (20.9%) |
| Information | 50 (87.7%) | 7 (12.3%) |
| Finance & Insurance | 0 (0.0%) | 103 (100.0%) |
| Real Estate, Rental & Leasing | 6 (10.3%) | 52 (89.7%) |
| Professional & Scientific | 14 (100.0%) | 0 (0.0%) |
| Enterprise Management | 0 (0.0%) | 0 (0.0%) |
| Administrative & Support | 81 (100.0%) | 0 (0.0%) |
| Educational Services | 88 (34.6%) | 166 (65.3%) |
| Health Care & Social Assistance | 44 (14.2%) | 266 (85.8%) |
| Arts, Entertainment & Recreation | 15 (25.4%) | 44 (74.6%) |
| Accommodation & Food Services | 0 (0.0%) | 132 (100.0%) |
| Public Administration | 128 (33.0%) | 260 (67.0%) |
| Total | 1,935 (51.7%) | 1,809 (48.3%) |
Education in Bullock County
School Enrollment in Bullock County
The most common levels of schooling among the 2,510 students in Bullock County are high school (795 | 31.7%), middle school (575 | 22.9%), and elementary school (542 | 21.6%).

| School Level | # Students | % Students |
| Nursery / Preschool | 126 | 5.0% |
| Kindergarten | 39 | 1.5% |
| Elementary School | 542 | 21.6% |
| Middle School | 575 | 22.9% |
| High School | 795 | 31.7% |
| College / Undergraduate | 414 | 16.5% |
| Graduate / Professional | 19 | 0.8% |
| Total | 2,510 | 100.0% |
School Enrollment by Age by Funding Source in Bullock County
Out of a total of 2,510 students who are enrolled in schools in Bullock County, 525 (20.9%) attend a private institution, while the remaining 1,985 (79.1%) are enrolled in public schools. The age group of 35 years and over has the highest likelihood of being enrolled in private schools, with 128 (64.3% in the age bracket) enrolled. Conversely, the age group of 25 to 34 year olds has the lowest likelihood of being enrolled in a private school, with 129 (100.0% in the age bracket) attending a public institution.

| Age Bracket | Public School | Private School |
| 3 to 4 Year Olds | 57 (62.6%) | 34 (37.4%) |
| 5 to 9 Year Old | 469 (82.7%) | 98 (17.3%) |
| 10 to 14 Year Olds | 620 (85.9%) | 102 (14.1%) |
| 15 to 17 Year Olds | 158 (60.8%) | 102 (39.2%) |
| 18 to 19 Year Olds | 482 (88.9%) | 60 (11.1%) |
| 20 to 24 Year Olds | 0 (0.0%) | 0 (0.0%) |
| 25 to 34 Year Olds | 129 (100.0%) | 0 (0.0%) |
| 35 Years and over | 71 (35.7%) | 128 (64.3%) |
| Total | 1,985 (79.1%) | 525 (20.9%) |
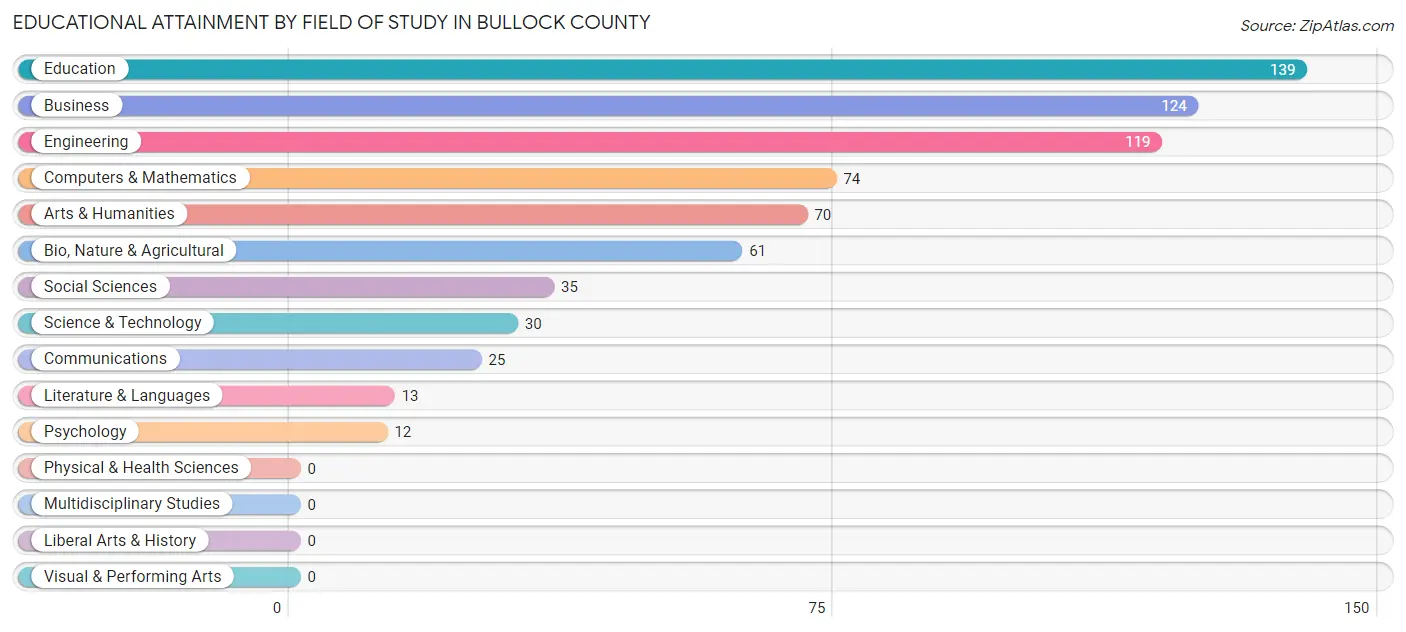
Educational Attainment by Field of Study in Bullock County
Education (139 | 19.8%), business (124 | 17.7%), engineering (119 | 17.0%), computers & mathematics (74 | 10.5%), and arts & humanities (70 | 10.0%) are the most common fields of study among 702 individuals in Bullock County who have obtained a bachelor's degree or higher.
| Field of Study | # Graduates | % Graduates |
| Computers & Mathematics | 74 | 10.5% |
| Bio, Nature & Agricultural | 61 | 8.7% |
| Physical & Health Sciences | 0 | 0.0% |
| Psychology | 12 | 1.7% |
| Social Sciences | 35 | 5.0% |
| Engineering | 119 | 17.0% |
| Multidisciplinary Studies | 0 | 0.0% |
| Science & Technology | 30 | 4.3% |
| Business | 124 | 17.7% |
| Education | 139 | 19.8% |
| Literature & Languages | 13 | 1.8% |
| Liberal Arts & History | 0 | 0.0% |
| Visual & Performing Arts | 0 | 0.0% |
| Communications | 25 | 3.6% |
| Arts & Humanities | 70 | 10.0% |
| Total | 702 | 100.0% |
Transportation & Commute in Bullock County
Vehicle Availability by Sex in Bullock County
The most prevalent vehicle ownership categories in Bullock County are males with 2 vehicles (909, accounting for 48.8%) and females with 2 vehicles (591, making up 50.4%).

| Vehicles Available | Male | Female |
| No Vehicle | 55 (2.9%) | 67 (3.7%) |
| 1 Vehicle | 363 (19.5%) | 556 (30.8%) |
| 2 Vehicles | 909 (48.8%) | 591 (32.8%) |
| 3 Vehicles | 340 (18.2%) | 390 (21.6%) |
| 4 Vehicles | 105 (5.6%) | 176 (9.8%) |
| 5 or more Vehicles | 92 (4.9%) | 24 (1.3%) |
| Total | 1,864 (100.0%) | 1,804 (100.0%) |
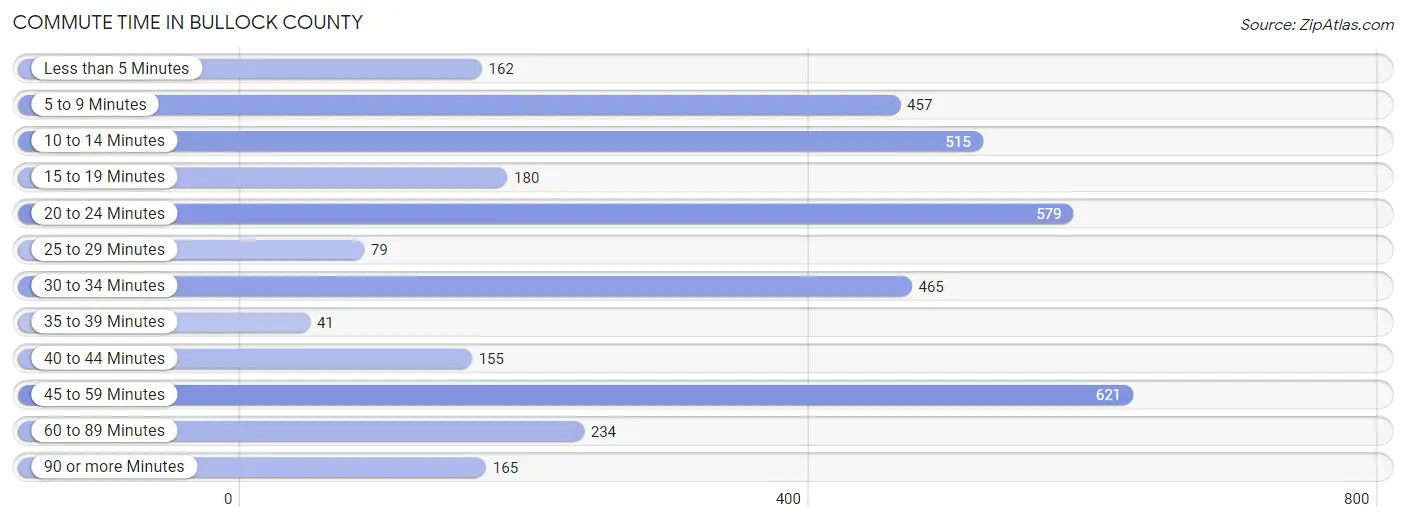
Commute Time in Bullock County
The most frequently occuring commute durations in Bullock County are 45 to 59 minutes (621 commuters, 17.0%), 20 to 24 minutes (579 commuters, 15.9%), and 10 to 14 minutes (515 commuters, 14.1%).
| Commute Time | # Commuters | % Commuters |
| Less than 5 Minutes | 162 | 4.4% |
| 5 to 9 Minutes | 457 | 12.5% |
| 10 to 14 Minutes | 515 | 14.1% |
| 15 to 19 Minutes | 180 | 4.9% |
| 20 to 24 Minutes | 579 | 15.9% |
| 25 to 29 Minutes | 79 | 2.2% |
| 30 to 34 Minutes | 465 | 12.7% |
| 35 to 39 Minutes | 41 | 1.1% |
| 40 to 44 Minutes | 155 | 4.2% |
| 45 to 59 Minutes | 621 | 17.0% |
| 60 to 89 Minutes | 234 | 6.4% |
| 90 or more Minutes | 165 | 4.5% |
Commute Time by Sex in Bullock County
The most common commute times in Bullock County are 45 to 59 minutes (498 commuters, 26.6%) for males and 30 to 34 minutes (362 commuters, 20.3%) for females.
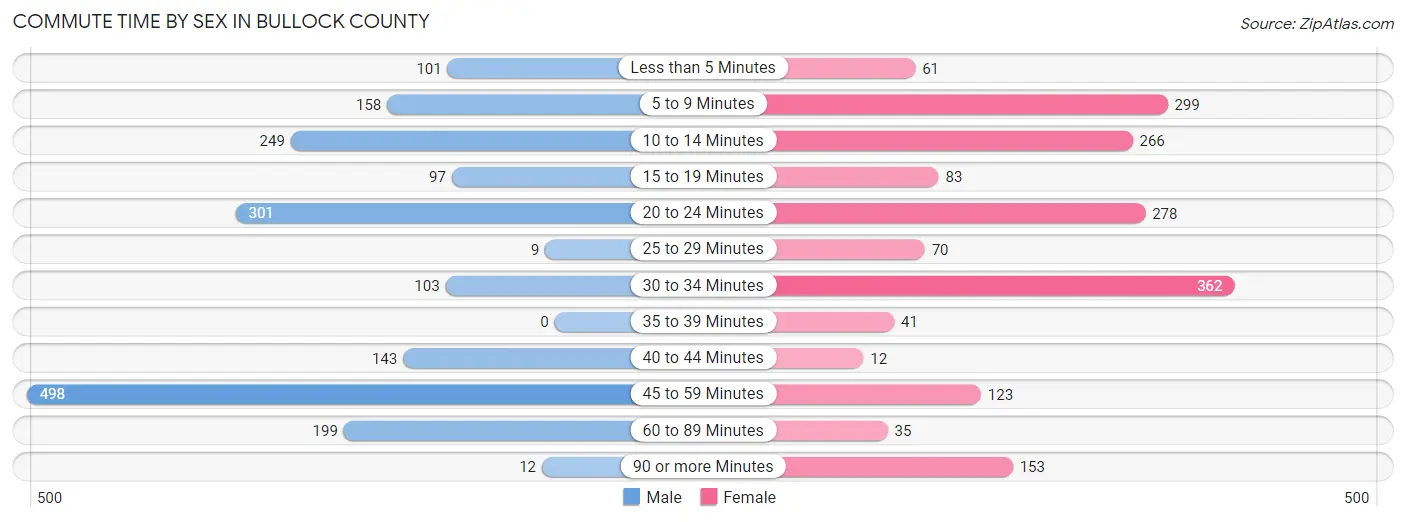
| Commute Time | Male | Female |
| Less than 5 Minutes | 101 (5.4%) | 61 (3.4%) |
| 5 to 9 Minutes | 158 (8.5%) | 299 (16.8%) |
| 10 to 14 Minutes | 249 (13.3%) | 266 (14.9%) |
| 15 to 19 Minutes | 97 (5.2%) | 83 (4.7%) |
| 20 to 24 Minutes | 301 (16.1%) | 278 (15.6%) |
| 25 to 29 Minutes | 9 (0.5%) | 70 (3.9%) |
| 30 to 34 Minutes | 103 (5.5%) | 362 (20.3%) |
| 35 to 39 Minutes | 0 (0.0%) | 41 (2.3%) |
| 40 to 44 Minutes | 143 (7.6%) | 12 (0.7%) |
| 45 to 59 Minutes | 498 (26.6%) | 123 (6.9%) |
| 60 to 89 Minutes | 199 (10.6%) | 35 (2.0%) |
| 90 or more Minutes | 12 (0.6%) | 153 (8.6%) |
Time of Departure to Work by Sex in Bullock County
The most frequent times of departure to work in Bullock County are 12:00 PM to 3:59 PM (297, 15.9%) for males and 6:30 AM to 6:59 AM (615, 34.5%) for females.
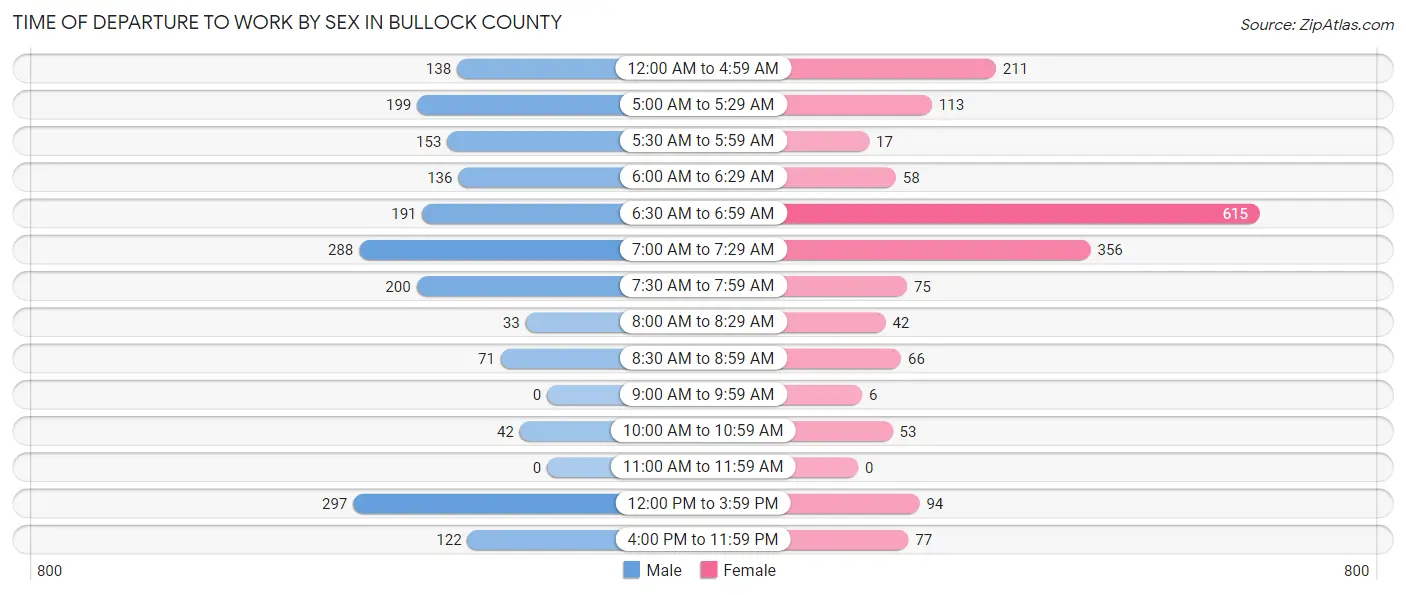
| Time of Departure | Male | Female |
| 12:00 AM to 4:59 AM | 138 (7.4%) | 211 (11.8%) |
| 5:00 AM to 5:29 AM | 199 (10.6%) | 113 (6.3%) |
| 5:30 AM to 5:59 AM | 153 (8.2%) | 17 (0.9%) |
| 6:00 AM to 6:29 AM | 136 (7.3%) | 58 (3.3%) |
| 6:30 AM to 6:59 AM | 191 (10.2%) | 615 (34.5%) |
| 7:00 AM to 7:29 AM | 288 (15.4%) | 356 (20.0%) |
| 7:30 AM to 7:59 AM | 200 (10.7%) | 75 (4.2%) |
| 8:00 AM to 8:29 AM | 33 (1.8%) | 42 (2.4%) |
| 8:30 AM to 8:59 AM | 71 (3.8%) | 66 (3.7%) |
| 9:00 AM to 9:59 AM | 0 (0.0%) | 6 (0.3%) |
| 10:00 AM to 10:59 AM | 42 (2.2%) | 53 (3.0%) |
| 11:00 AM to 11:59 AM | 0 (0.0%) | 0 (0.0%) |
| 12:00 PM to 3:59 PM | 297 (15.9%) | 94 (5.3%) |
| 4:00 PM to 11:59 PM | 122 (6.5%) | 77 (4.3%) |
| Total | 1,870 (100.0%) | 1,783 (100.0%) |
Housing Occupancy in Bullock County
Occupancy by Ownership in Bullock County
Of the total 3,450 dwellings in Bullock County, owner-occupied units account for 2,231 (64.7%), while renter-occupied units make up 1,219 (35.3%).

| Occupancy | # Housing Units | % Housing Units |
| Owner Occupied Housing Units | 2,231 | 64.7% |
| Renter-Occupied Housing Units | 1,219 | 35.3% |
| Total Occupied Housing Units | 3,450 | 100.0% |
Occupancy by Household Size in Bullock County
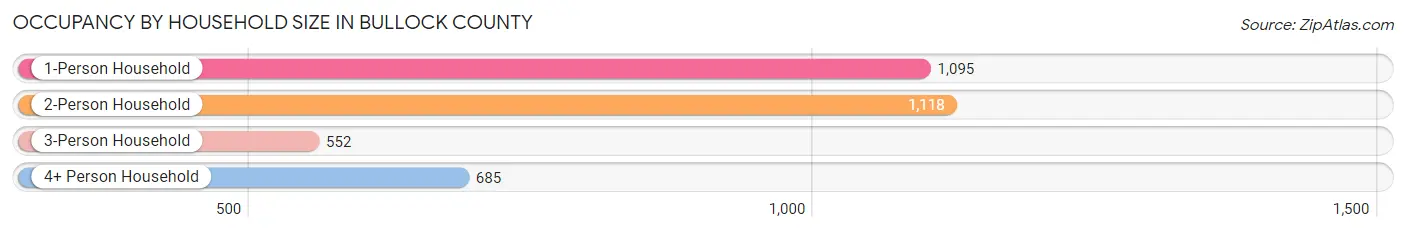
| Household Size | # Housing Units | % Housing Units |
| 1-Person Household | 1,095 | 31.7% |
| 2-Person Household | 1,118 | 32.4% |
| 3-Person Household | 552 | 16.0% |
| 4+ Person Household | 685 | 19.9% |
| Total Housing Units | 3,450 | 100.0% |
Occupancy by Ownership by Household Size in Bullock County

| Household Size | Owner-occupied | Renter-occupied |
| 1-Person Household | 714 (65.2%) | 381 (34.8%) |
| 2-Person Household | 843 (75.4%) | 275 (24.6%) |
| 3-Person Household | 304 (55.1%) | 248 (44.9%) |
| 4+ Person Household | 370 (54.0%) | 315 (46.0%) |
| Total Housing Units | 2,231 (64.7%) | 1,219 (35.3%) |
Occupancy by Educational Attainment in Bullock County

| Household Size | Owner-occupied | Renter-occupied |
| Less than High School | 394 (49.4%) | 404 (50.6%) |
| High School Diploma | 1,016 (74.7%) | 344 (25.3%) |
| College/Associate Degree | 527 (61.9%) | 324 (38.1%) |
| Bachelor's Degree or higher | 294 (66.7%) | 147 (33.3%) |
Occupancy by Age of Householder in Bullock County
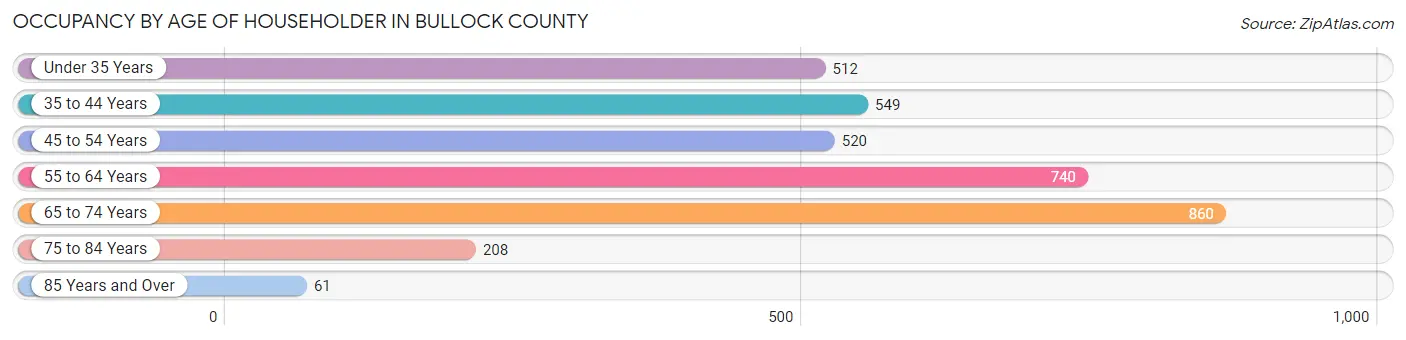
| Age Bracket | # Households | % Households |
| Under 35 Years | 512 | 14.8% |
| 35 to 44 Years | 549 | 15.9% |
| 45 to 54 Years | 520 | 15.1% |
| 55 to 64 Years | 740 | 21.4% |
| 65 to 74 Years | 860 | 24.9% |
| 75 to 84 Years | 208 | 6.0% |
| 85 Years and Over | 61 | 1.8% |
| Total | 3,450 | 100.0% |
Housing Finances in Bullock County
Median Income by Occupancy in Bullock County
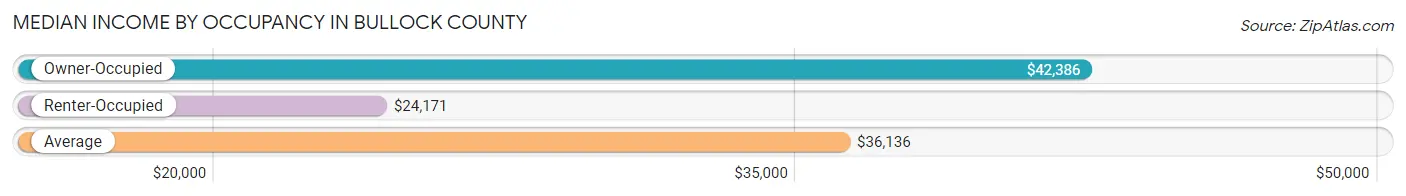
| Occupancy Type | # Households | Median Income |
| Owner-Occupied | 2,231 (64.7%) | $42,386 |
| Renter-Occupied | 1,219 (35.3%) | $24,171 |
| Average | 3,450 (100.0%) | $36,136 |
Occupancy by Householder Income Bracket in Bullock County

| Income Bracket | Owner-occupied | Renter-occupied |
| Less than $5,000 | 158 (7.1%) | 176 (14.4%) |
| $5,000 to $9,999 | 83 (3.7%) | 26 (2.1%) |
| $10,000 to $14,999 | 164 (7.3%) | 190 (15.6%) |
| $15,000 to $19,999 | 113 (5.1%) | 115 (9.4%) |
| $20,000 to $24,999 | 167 (7.5%) | 137 (11.2%) |
| $25,000 to $34,999 | 209 (9.4%) | 107 (8.8%) |
| $35,000 to $49,999 | 374 (16.8%) | 184 (15.1%) |
| $50,000 to $74,999 | 234 (10.5%) | 188 (15.4%) |
| $75,000 to $99,999 | 181 (8.1%) | 96 (7.9%) |
| $100,000 to $149,999 | 417 (18.7%) | 0 (0.0%) |
| $150,000 or more | 131 (5.9%) | 0 (0.0%) |
| Total | 2,231 (100.0%) | 1,219 (100.0%) |
Monthly Housing Cost Tiers in Bullock County
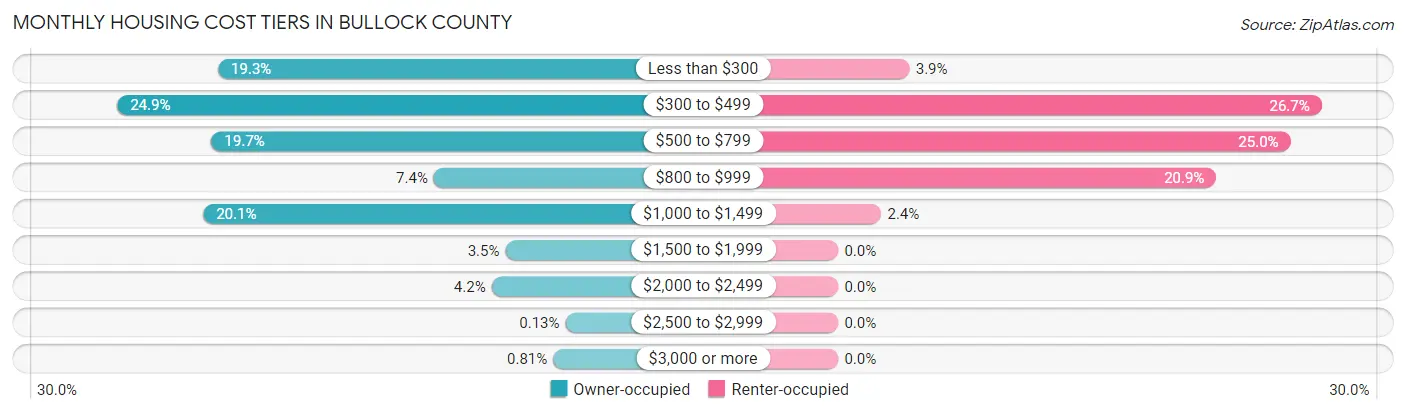
| Monthly Cost | Owner-occupied | Renter-occupied |
| Less than $300 | 431 (19.3%) | 48 (3.9%) |
| $300 to $499 | 555 (24.9%) | 326 (26.7%) |
| $500 to $799 | 439 (19.7%) | 305 (25.0%) |
| $800 to $999 | 165 (7.4%) | 255 (20.9%) |
| $1,000 to $1,499 | 449 (20.1%) | 29 (2.4%) |
| $1,500 to $1,999 | 77 (3.5%) | 0 (0.0%) |
| $2,000 to $2,499 | 94 (4.2%) | 0 (0.0%) |
| $2,500 to $2,999 | 3 (0.1%) | 0 (0.0%) |
| $3,000 or more | 18 (0.8%) | 0 (0.0%) |
| Total | 2,231 (100.0%) | 1,219 (100.0%) |
Physical Housing Characteristics in Bullock County
Housing Structures in Bullock County

| Structure Type | # Housing Units | % Housing Units |
| Single Unit, Detached | 1,438 | 41.7% |
| Single Unit, Attached | 8 | 0.2% |
| 2 Unit Apartments | 238 | 6.9% |
| 3 or 4 Unit Apartments | 35 | 1.0% |
| 5 to 9 Unit Apartments | 76 | 2.2% |
| 10 or more Apartments | 187 | 5.4% |
| Mobile Home / Other | 1,468 | 42.5% |
| Total | 3,450 | 100.0% |
Housing Structures by Occupancy in Bullock County
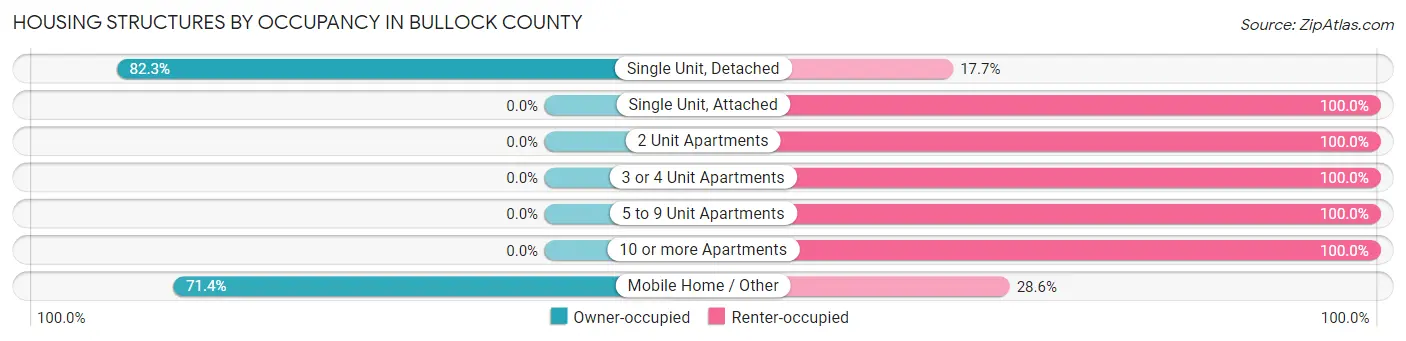
| Structure Type | Owner-occupied | Renter-occupied |
| Single Unit, Detached | 1,183 (82.3%) | 255 (17.7%) |
| Single Unit, Attached | 0 (0.0%) | 8 (100.0%) |
| 2 Unit Apartments | 0 (0.0%) | 238 (100.0%) |
| 3 or 4 Unit Apartments | 0 (0.0%) | 35 (100.0%) |
| 5 to 9 Unit Apartments | 0 (0.0%) | 76 (100.0%) |
| 10 or more Apartments | 0 (0.0%) | 187 (100.0%) |
| Mobile Home / Other | 1,048 (71.4%) | 420 (28.6%) |
| Total | 2,231 (64.7%) | 1,219 (35.3%) |
Housing Structures by Number of Rooms in Bullock County
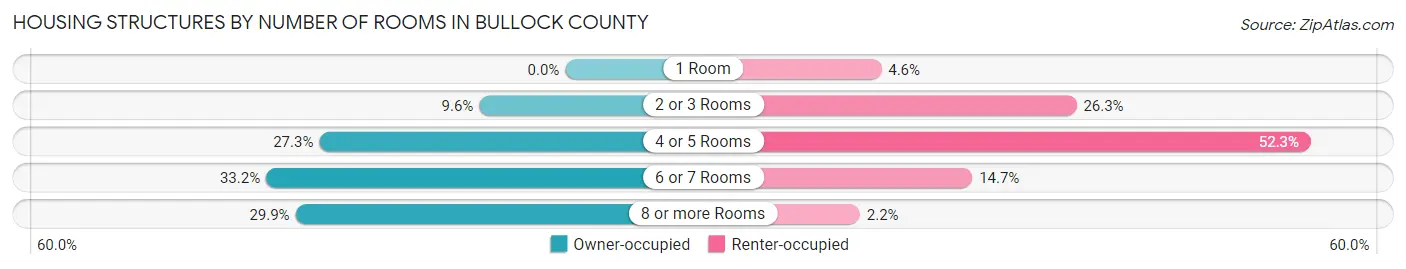
| Number of Rooms | Owner-occupied | Renter-occupied |
| 1 Room | 0 (0.0%) | 56 (4.6%) |
| 2 or 3 Rooms | 213 (9.6%) | 320 (26.3%) |
| 4 or 5 Rooms | 609 (27.3%) | 637 (52.3%) |
| 6 or 7 Rooms | 741 (33.2%) | 179 (14.7%) |
| 8 or more Rooms | 668 (29.9%) | 27 (2.2%) |
| Total | 2,231 (100.0%) | 1,219 (100.0%) |
Housing Structure by Heating Type in Bullock County

| Heating Type | Owner-occupied | Renter-occupied |
| Utility Gas | 167 (7.5%) | 69 (5.7%) |
| Bottled, Tank, or LP Gas | 519 (23.3%) | 95 (7.8%) |
| Electricity | 1,529 (68.5%) | 1,000 (82.0%) |
| Fuel Oil or Kerosene | 0 (0.0%) | 0 (0.0%) |
| Coal or Coke | 0 (0.0%) | 0 (0.0%) |
| All other Fuels | 16 (0.7%) | 55 (4.5%) |
| No Fuel Used | 0 (0.0%) | 0 (0.0%) |
| Total | 2,231 (100.0%) | 1,219 (100.0%) |
Household Vehicle Usage in Bullock County
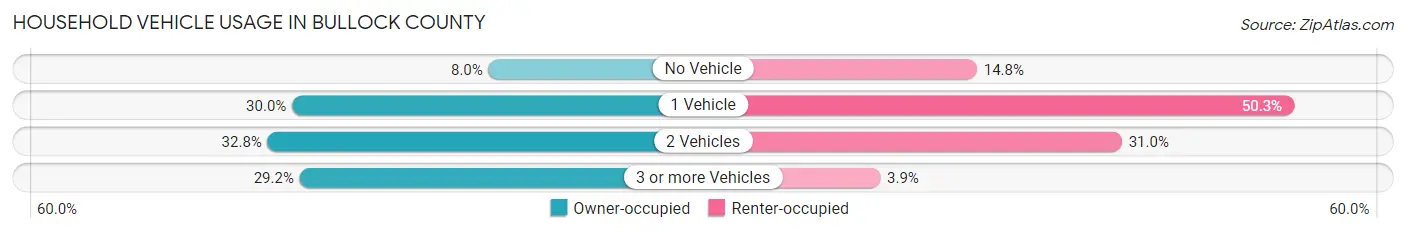
| Vehicles per Household | Owner-occupied | Renter-occupied |
| No Vehicle | 179 (8.0%) | 180 (14.8%) |
| 1 Vehicle | 670 (30.0%) | 613 (50.3%) |
| 2 Vehicles | 731 (32.8%) | 378 (31.0%) |
| 3 or more Vehicles | 651 (29.2%) | 48 (3.9%) |
| Total | 2,231 (100.0%) | 1,219 (100.0%) |
Real Estate & Mortgages in Bullock County
Real Estate and Mortgage Overview in Bullock County
| Characteristic | Without Mortgage | With Mortgage |
| Housing Units | 1,339 | 892 |
| Median Property Value | $63,600 | $128,100 |
| Median Household Income | $36,277 | $123 |
| Monthly Housing Costs | $413 | $18 |
| Real Estate Taxes | $199 | $95 |
Property Value by Mortgage Status in Bullock County
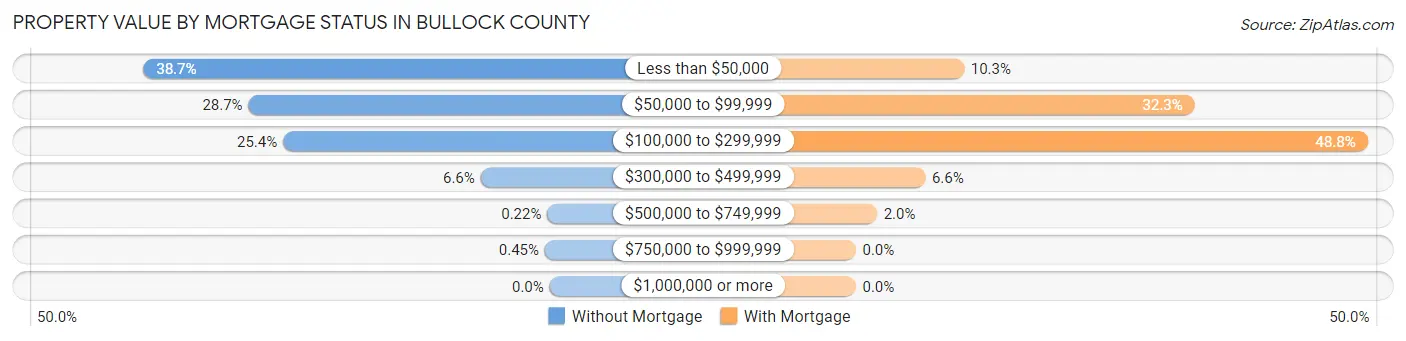
| Property Value | Without Mortgage | With Mortgage |
| Less than $50,000 | 518 (38.7%) | 92 (10.3%) |
| $50,000 to $99,999 | 384 (28.7%) | 288 (32.3%) |
| $100,000 to $299,999 | 340 (25.4%) | 435 (48.8%) |
| $300,000 to $499,999 | 88 (6.6%) | 59 (6.6%) |
| $500,000 to $749,999 | 3 (0.2%) | 18 (2.0%) |
| $750,000 to $999,999 | 6 (0.4%) | 0 (0.0%) |
| $1,000,000 or more | 0 (0.0%) | 0 (0.0%) |
| Total | 1,339 (100.0%) | 892 (100.0%) |
Household Income by Mortgage Status in Bullock County
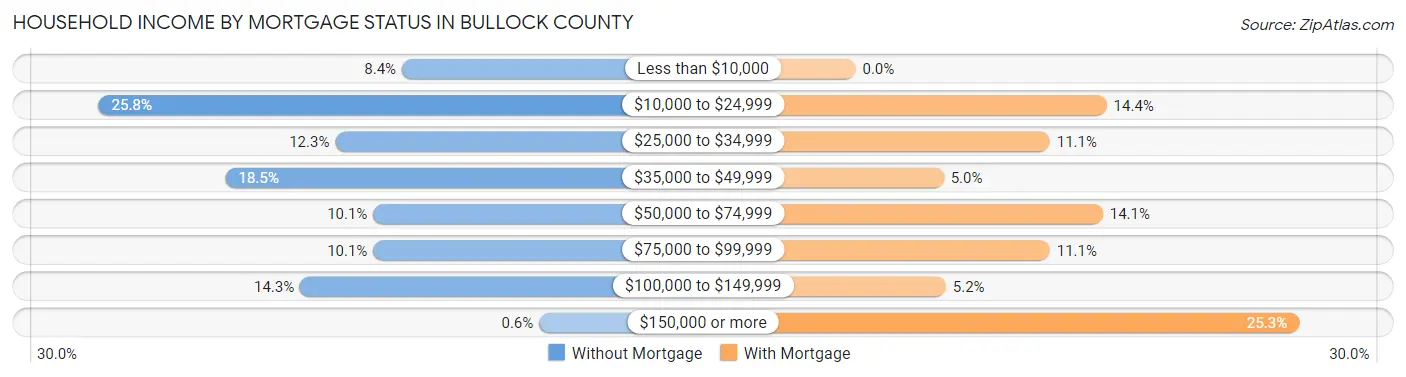
| Household Income | Without Mortgage | With Mortgage |
| Less than $10,000 | 113 (8.4%) | 0 (0.0%) |
| $10,000 to $24,999 | 345 (25.8%) | 128 (14.3%) |
| $25,000 to $34,999 | 164 (12.2%) | 99 (11.1%) |
| $35,000 to $49,999 | 248 (18.5%) | 45 (5.0%) |
| $50,000 to $74,999 | 135 (10.1%) | 126 (14.1%) |
| $75,000 to $99,999 | 135 (10.1%) | 99 (11.1%) |
| $100,000 to $149,999 | 191 (14.3%) | 46 (5.2%) |
| $150,000 or more | 8 (0.6%) | 226 (25.3%) |
| Total | 1,339 (100.0%) | 892 (100.0%) |
Property Value to Household Income Ratio in Bullock County
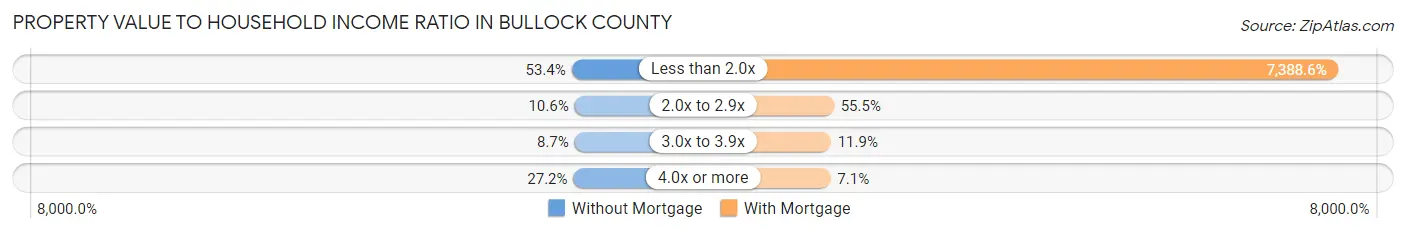
| Value-to-Income Ratio | Without Mortgage | With Mortgage |
| Less than 2.0x | 715 (53.4%) | 65,906 (7,388.6%) |
| 2.0x to 2.9x | 142 (10.6%) | 495 (55.5%) |
| 3.0x to 3.9x | 116 (8.7%) | 106 (11.9%) |
| 4.0x or more | 364 (27.2%) | 63 (7.1%) |
| Total | 1,339 (100.0%) | 892 (100.0%) |
Real Estate Taxes by Mortgage Status in Bullock County
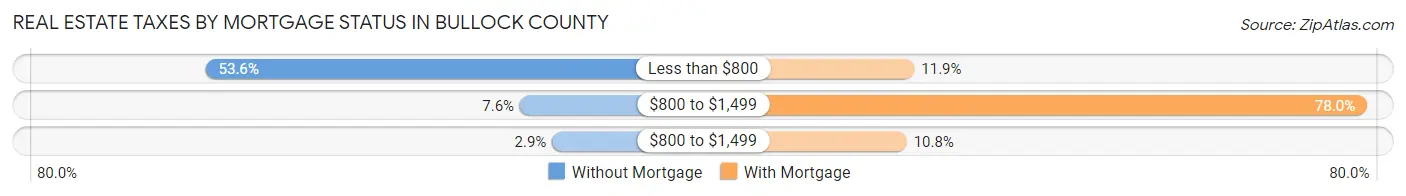
| Property Taxes | Without Mortgage | With Mortgage |
| Less than $800 | 717 (53.5%) | 106 (11.9%) |
| $800 to $1,499 | 102 (7.6%) | 696 (78.0%) |
| $800 to $1,499 | 39 (2.9%) | 96 (10.8%) |
| Total | 1,339 (100.0%) | 892 (100.0%) |
Health & Disability in Bullock County
Health Insurance Coverage by Age in Bullock County
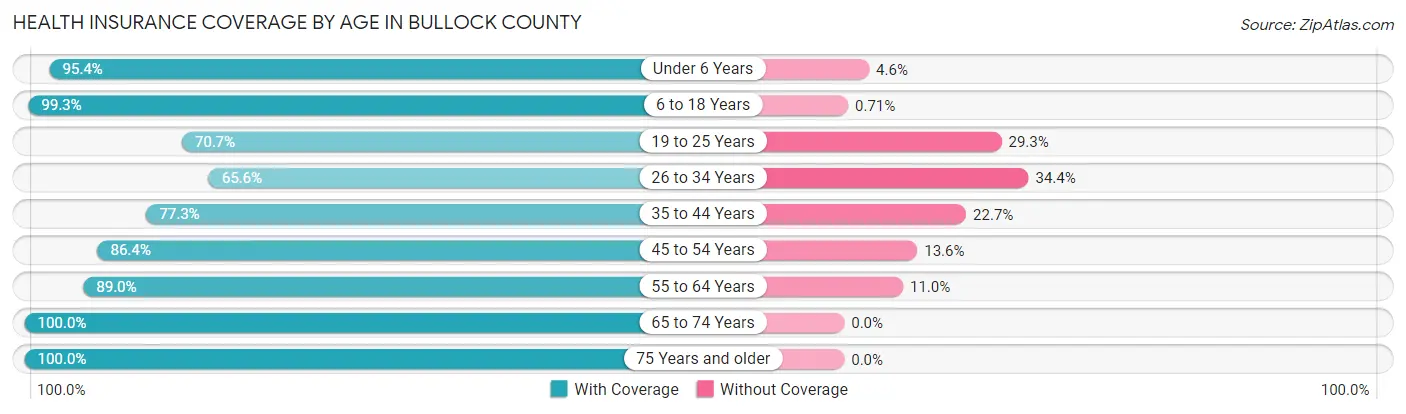
| Age Bracket | With Coverage | Without Coverage |
| Under 6 Years | 617 (95.4%) | 30 (4.6%) |
| 6 to 18 Years | 1,971 (99.3%) | 14 (0.7%) |
| 19 to 25 Years | 648 (70.7%) | 269 (29.3%) |
| 26 to 34 Years | 596 (65.6%) | 312 (34.4%) |
| 35 to 44 Years | 840 (77.3%) | 247 (22.7%) |
| 45 to 54 Years | 984 (86.4%) | 155 (13.6%) |
| 55 to 64 Years | 1,211 (89.0%) | 149 (11.0%) |
| 65 to 74 Years | 1,015 (100.0%) | 0 (0.0%) |
| 75 Years and older | 582 (100.0%) | 0 (0.0%) |
| Total | 8,464 (87.8%) | 1,176 (12.2%) |
Health Insurance Coverage by Citizenship Status in Bullock County

| Citizenship Status | With Coverage | Without Coverage |
| Native Born | 617 (95.4%) | 30 (4.6%) |
| Foreign Born, Citizen | 1,971 (99.3%) | 14 (0.7%) |
| Foreign Born, not a Citizen | 648 (70.7%) | 269 (29.3%) |
Health Insurance Coverage by Household Income in Bullock County
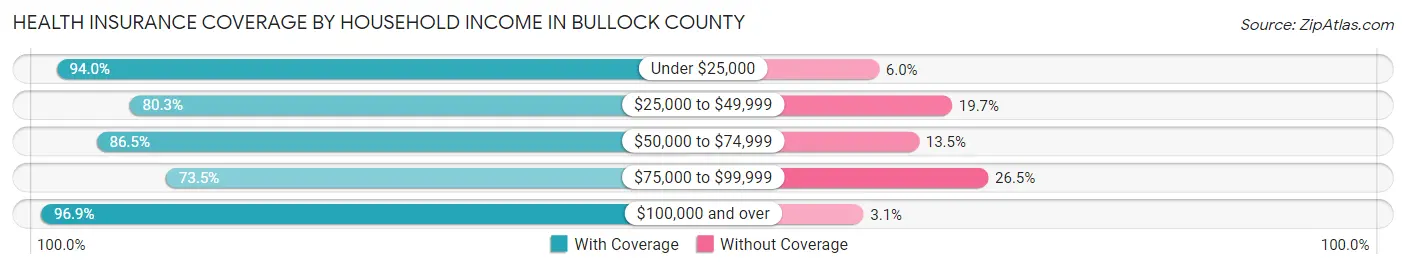
| Household Income | With Coverage | Without Coverage |
| Under $25,000 | 2,595 (94.0%) | 166 (6.0%) |
| $25,000 to $49,999 | 2,220 (80.3%) | 544 (19.7%) |
| $50,000 to $74,999 | 1,084 (86.5%) | 169 (13.5%) |
| $75,000 to $99,999 | 622 (73.5%) | 224 (26.5%) |
| $100,000 and over | 1,905 (96.9%) | 61 (3.1%) |
Public vs Private Health Insurance Coverage by Age in Bullock County

| Age Bracket | Public Insurance | Private Insurance |
| Under 6 | 511 (79.0%) | 106 (16.4%) |
| 6 to 18 Years | 1,572 (79.2%) | 441 (22.2%) |
| 19 to 25 Years | 345 (37.6%) | 303 (33.0%) |
| 25 to 34 Years | 100 (11.0%) | 518 (57.1%) |
| 35 to 44 Years | 227 (20.9%) | 667 (61.4%) |
| 45 to 54 Years | 272 (23.9%) | 818 (71.8%) |
| 55 to 64 Years | 478 (35.1%) | 794 (58.4%) |
| 65 to 74 Years | 947 (93.3%) | 461 (45.4%) |
| 75 Years and over | 582 (100.0%) | 201 (34.5%) |
| Total | 5,034 (52.2%) | 4,309 (44.7%) |
Disability Status by Sex by Age in Bullock County
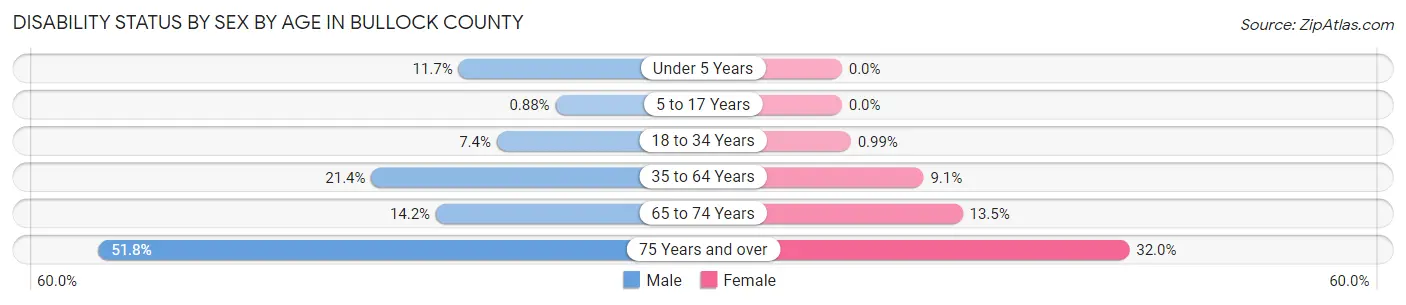
| Age Bracket | Male | Female |
| Under 5 Years | 28 (11.7%) | 0 (0.0%) |
| 5 to 17 Years | 7 (0.9%) | 0 (0.0%) |
| 18 to 34 Years | 94 (7.4%) | 10 (1.0%) |
| 35 to 64 Years | 412 (21.4%) | 151 (9.1%) |
| 65 to 74 Years | 66 (14.2%) | 74 (13.5%) |
| 75 Years and over | 130 (51.8%) | 106 (32.0%) |
Disability Class by Sex by Age in Bullock County
Disability Class: Hearing Difficulty
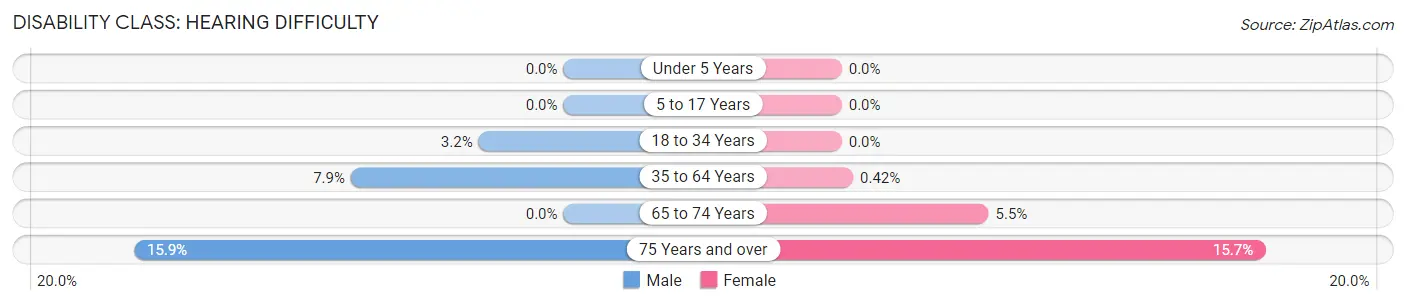
| Age Bracket | Male | Female |
| Under 5 Years | 0 (0.0%) | 0 (0.0%) |
| 5 to 17 Years | 0 (0.0%) | 0 (0.0%) |
| 18 to 34 Years | 40 (3.2%) | 0 (0.0%) |
| 35 to 64 Years | 152 (7.9%) | 7 (0.4%) |
| 65 to 74 Years | 0 (0.0%) | 30 (5.4%) |
| 75 Years and over | 40 (15.9%) | 52 (15.7%) |
Disability Class: Vision Difficulty
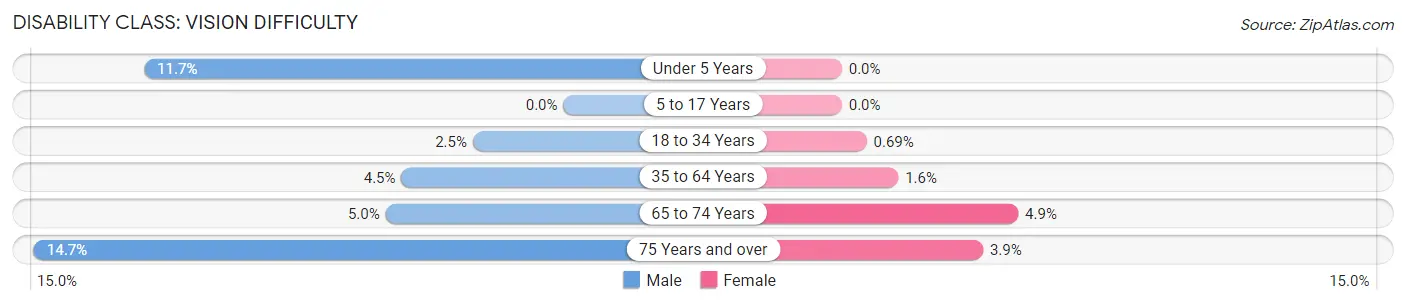
| Age Bracket | Male | Female |
| Under 5 Years | 28 (11.7%) | 0 (0.0%) |
| 5 to 17 Years | 0 (0.0%) | 0 (0.0%) |
| 18 to 34 Years | 32 (2.5%) | 7 (0.7%) |
| 35 to 64 Years | 87 (4.5%) | 26 (1.6%) |
| 65 to 74 Years | 23 (5.0%) | 27 (4.9%) |
| 75 Years and over | 37 (14.7%) | 13 (3.9%) |
Disability Class: Cognitive Difficulty
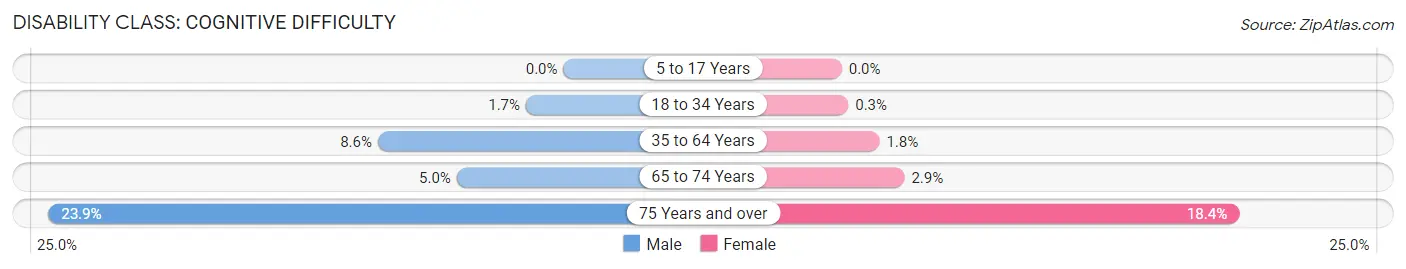
| Age Bracket | Male | Female |
| 5 to 17 Years | 0 (0.0%) | 0 (0.0%) |
| 18 to 34 Years | 22 (1.7%) | 3 (0.3%) |
| 35 to 64 Years | 166 (8.6%) | 29 (1.8%) |
| 65 to 74 Years | 23 (5.0%) | 16 (2.9%) |
| 75 Years and over | 60 (23.9%) | 61 (18.4%) |
Disability Class: Ambulatory Difficulty
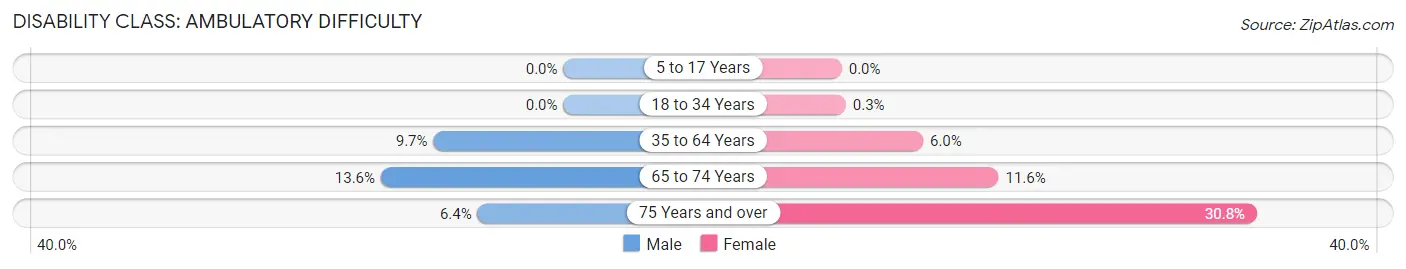
| Age Bracket | Male | Female |
| 5 to 17 Years | 0 (0.0%) | 0 (0.0%) |
| 18 to 34 Years | 0 (0.0%) | 3 (0.3%) |
| 35 to 64 Years | 186 (9.7%) | 100 (6.0%) |
| 65 to 74 Years | 63 (13.6%) | 64 (11.6%) |
| 75 Years and over | 16 (6.4%) | 102 (30.8%) |
Disability Class: Self-Care Difficulty
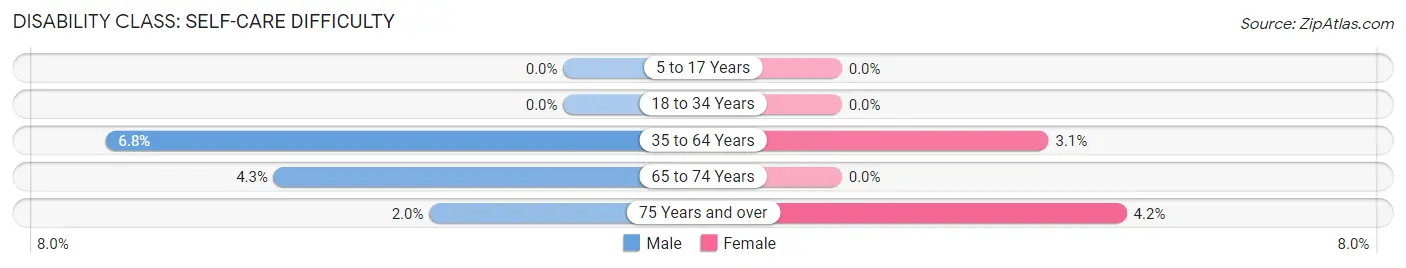
| Age Bracket | Male | Female |
| 5 to 17 Years | 0 (0.0%) | 0 (0.0%) |
| 18 to 34 Years | 0 (0.0%) | 0 (0.0%) |
| 35 to 64 Years | 131 (6.8%) | 51 (3.1%) |
| 65 to 74 Years | 20 (4.3%) | 0 (0.0%) |
| 75 Years and over | 5 (2.0%) | 14 (4.2%) |
Technology Access in Bullock County
Computing Device Access in Bullock County
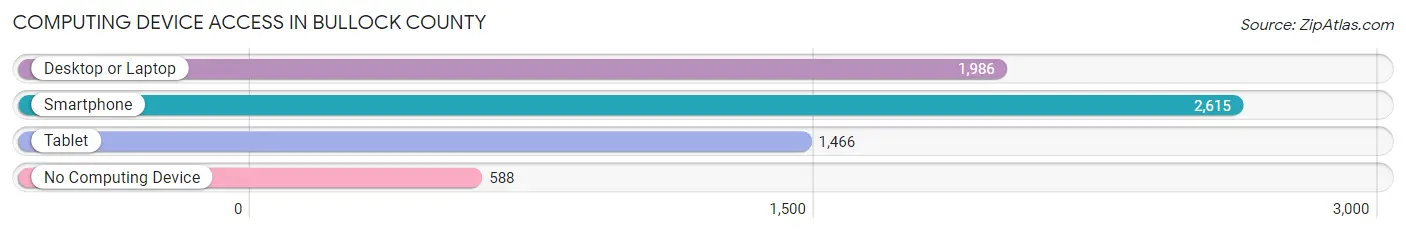
| Device Type | # Households | % Households |
| Desktop or Laptop | 1,986 | 57.6% |
| Smartphone | 2,615 | 75.8% |
| Tablet | 1,466 | 42.5% |
| No Computing Device | 588 | 17.0% |
| Total | 3,450 | 100.0% |
Internet Access in Bullock County
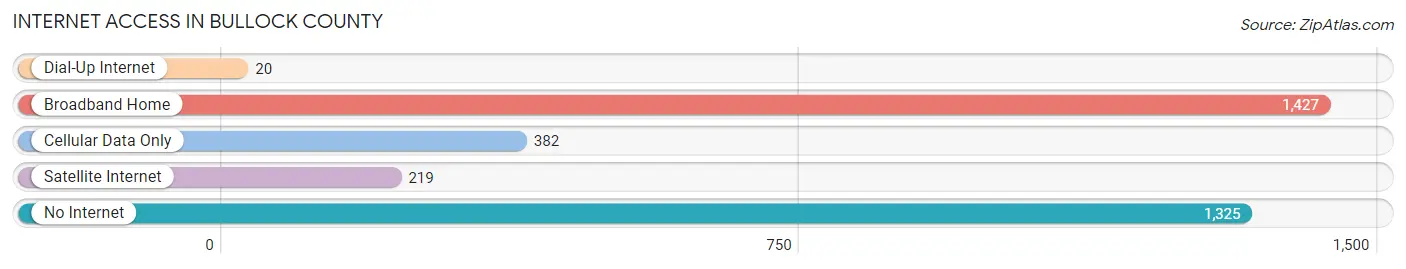
| Internet Type | # Households | % Households |
| Dial-Up Internet | 20 | 0.6% |
| Broadband Home | 1,427 | 41.4% |
| Cellular Data Only | 382 | 11.1% |
| Satellite Internet | 219 | 6.4% |
| No Internet | 1,325 | 38.4% |
| Total | 3,450 | 100.0% |
Bullock County Summary
Bullock County is located in the southeastern part of the state of Alabama, in the United States. It is bordered by Pike County to the north, Macon County to the east, Barbour County to the south, and Montgomery County to the west. The county seat is Union Springs, and the largest city is Union Springs. The county was created in 1866 from parts of Barbour and Macon counties.
Geography
Bullock County covers an area of 590 square miles, of which 588 square miles is land and 2 square miles is water. The county is located in the Coastal Plain region of Alabama, and is mostly flat with some rolling hills. The main waterway is the Choctawhatchee River, which flows through the county from the northwest to the southeast. Other major waterways include the Pea River, the Conecuh River, and the Little Choctawhatchee River.
The county is mostly covered in pine and hardwood forests, with some agricultural land. The main agricultural products are cotton, corn, soybeans, and peanuts.
Demographics
As of the 2010 census, the population of Bullock County was 10,914. The racial makeup of the county was 57.3% African American, 40.2% White, 0.3% Native American, 0.2% Asian, 0.1% Pacific Islander, 0.7% from other races, and 1.3% from two or more races. Hispanic or Latino of any race were 1.7% of the population.
The median household income was $27,945, and the median family income was $35,945. The per capita income was $14,945. About 24.3% of the population was below the poverty line.
Economy
The economy of Bullock County is largely based on agriculture and forestry. The main agricultural products are cotton, corn, soybeans, and peanuts. The county is also home to several timber companies, which harvest and process timber for use in construction and other industries.
The county is also home to several manufacturing companies, including a paper mill, a furniture factory, and a plastics factory. The county is also home to several retail stores, restaurants, and other businesses.
The county is served by the Union Springs Airport, which offers flights to several major cities in the region. The county is also served by several major highways, including Interstate 85, U.S. Route 82, and Alabama State Route 97.
Conclusion
Bullock County is a rural county located in the southeastern part of Alabama. It is mostly covered in pine and hardwood forests, with some agricultural land. The main agricultural products are cotton, corn, soybeans, and peanuts. The county is also home to several timber companies, manufacturing companies, and other businesses. The county is served by the Union Springs Airport and several major highways. The population of the county is mostly African American, and the median household income is below the state average.
Common Questions
What is the Total Population of Bullock County?
Total Population of Bullock County is 10,328.
What is the Total Male Population of Bullock County?
Total Male Population of Bullock County is 5,542.
What is the Total Female Population of Bullock County?
Total Female Population of Bullock County is 4,786.
What is the Ratio of Males per 100 Females in Bullock County?
There are 115.80 Males per 100 Females in Bullock County.
What is the Ratio of Females per 100 Males in Bullock County?
There are 86.36 Females per 100 Males in Bullock County.
What is the Median Population Age in Bullock County?
Median Population Age in Bullock County is 39.2 Years.
What is the Average Family Size in Bullock County
Average Family Size in Bullock County is 3.5 People.
What is the Average Household Size in Bullock County
Average Household Size in Bullock County is 2.8 People.
What is Per Capita Income in Bullock County?
Per Capita income in Bullock County is $22,115.
What is the Median Family Income in Bullock County?
Median Family Income in Bullock County is $43,750.
What is the Median Household income in Bullock County?
Median Household Income in Bullock County is $36,136.
What is Income or Wage Gap in Bullock County?
Income or Wage Gap in Bullock County is 32.0%.
Women in Bullock County earn 68.0 cents for every dollar earned by a man.
What is Inequality or Gini Index in Bullock County?
Inequality or Gini Index in Bullock County is 0.51.
How Large is the Labor Force in Bullock County?
There are 3,886 People in the Labor Forcein in Bullock County.
What is the Percentage of People in the Labor Force in Bullock County?
46.4% of People are in the Labor Force in Bullock County.
What is the Unemployment Rate in Bullock County?
Unemployment Rate in Bullock County is 3.7%.