Zip Codes with the Highest Percentage of Population Employed in Community & Social Service in Birmingham, AL
RELATED REPORTS & OPTIONS
Community & Social Service
Birmingham
Compare Zip Codes
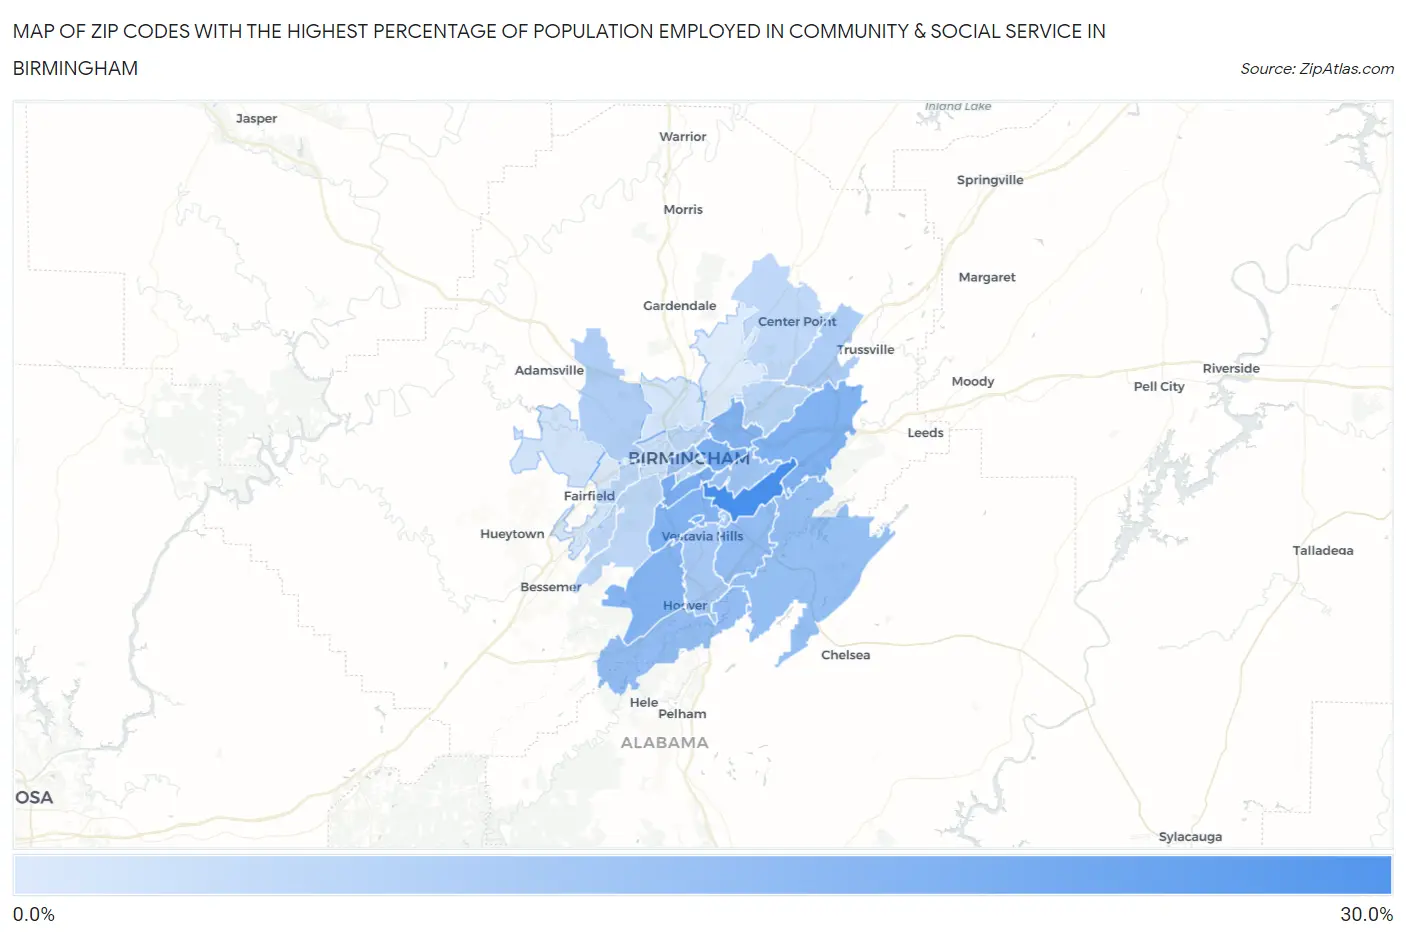
Map of Zip Codes with the Highest Percentage of Population Employed in Community & Social Service in Birmingham
0.0%
30.0%
Zip Codes with the Highest Percentage of Population Employed in Community & Social Service in Birmingham, AL
| Zip Code | % Employed | vs State | vs National | |
| 1. | 35223 | 26.1% | 10.1%(+16.0)#7 | 11.2%(+14.8)#865 |
| 2. | 35205 | 18.0% | 10.1%(+7.97)#28 | 11.2%(+6.81)#2,802 |
| 3. | 35229 | 17.9% | 10.1%(+7.87)#29 | 11.2%(+6.71)#2,856 |
| 4. | 35222 | 17.9% | 10.1%(+7.81)#30 | 11.2%(+6.64)#2,895 |
| 5. | 35210 | 17.0% | 10.1%(+6.92)#32 | 11.2%(+5.75)#3,399 |
| 6. | 35209 | 16.9% | 10.1%(+6.87)#33 | 11.2%(+5.71)#3,430 |
| 7. | 35212 | 16.6% | 10.1%(+6.59)#37 | 11.2%(+5.42)#3,622 |
| 8. | 35226 | 16.5% | 10.1%(+6.40)#38 | 11.2%(+5.24)#3,732 |
| 9. | 35244 | 14.4% | 10.1%(+4.31)#59 | 11.2%(+3.15)#5,638 |
| 10. | 35243 | 14.3% | 10.1%(+4.28)#60 | 11.2%(+3.12)#5,667 |
| 11. | 35242 | 13.8% | 10.1%(+3.77)#69 | 11.2%(+2.61)#6,311 |
| 12. | 35203 | 13.3% | 10.1%(+3.22)#83 | 11.2%(+2.06)#7,118 |
| 13. | 35213 | 12.7% | 10.1%(+2.64)#100 | 11.2%(+1.47)#8,088 |
| 14. | 35254 | 11.9% | 10.1%(+1.87)#121 | 11.2%(+0.710)#9,529 |
| 15. | 35216 | 11.5% | 10.1%(+1.41)#140 | 11.2%(+0.250)#10,538 |
| 16. | 35235 | 10.7% | 10.1%(+0.649)#176 | 11.2%(-0.513)#12,372 |
| 17. | 35214 | 10.4% | 10.1%(+0.304)#191 | 11.2%(-0.859)#13,219 |
| 18. | 35206 | 8.6% | 10.1%(-1.41)#259 | 11.2%(-2.58)#17,799 |
| 19. | 35208 | 8.4% | 10.1%(-1.62)#270 | 11.2%(-2.78)#18,346 |
| 20. | 35234 | 8.4% | 10.1%(-1.66)#273 | 11.2%(-2.83)#18,496 |
| 21. | 35211 | 8.2% | 10.1%(-1.86)#290 | 11.2%(-3.03)#19,053 |
| 22. | 35233 | 8.2% | 10.1%(-1.87)#292 | 11.2%(-3.03)#19,080 |
| 23. | 35215 | 7.9% | 10.1%(-2.12)#312 | 11.2%(-3.28)#19,767 |
| 24. | 35221 | 7.9% | 10.1%(-2.14)#315 | 11.2%(-3.30)#19,826 |
| 25. | 35204 | 6.2% | 10.1%(-3.85)#417 | 11.2%(-5.01)#23,942 |
| 26. | 35224 | 5.3% | 10.1%(-4.76)#459 | 11.2%(-5.93)#25,729 |
| 27. | 35207 | 5.1% | 10.1%(-5.00)#470 | 11.2%(-6.16)#26,102 |
| 28. | 35228 | 4.3% | 10.1%(-5.70)#489 | 11.2%(-6.86)#27,119 |
| 29. | 35218 | 4.3% | 10.1%(-5.74)#494 | 11.2%(-6.90)#27,171 |
| 30. | 35217 | 3.9% | 10.1%(-6.18)#515 | 11.2%(-7.34)#27,707 |
1
Common Questions
What are the Top 10 Zip Codes with the Highest Percentage of Population Employed in Community & Social Service in Birmingham, AL?
Top 10 Zip Codes with the Highest Percentage of Population Employed in Community & Social Service in Birmingham, AL are:
What zip code has the Highest Percentage of Population Employed in Community & Social Service in Birmingham, AL?
35223 has the Highest Percentage of Population Employed in Community & Social Service in Birmingham, AL with 26.1%.
What is the Percentage of Population Employed in Community & Social Service in Birmingham, AL?
Percentage of Population Employed in Community & Social Service in Birmingham is 10.4%.
What is the Percentage of Population Employed in Community & Social Service in Alabama?
Percentage of Population Employed in Community & Social Service in Alabama is 10.1%.
What is the Percentage of Population Employed in Community & Social Service in the United States?
Percentage of Population Employed in Community & Social Service in the United States is 11.2%.