Zip Codes with the Highest Percentage of Population Employed in Arts, Media & Entertainment in Birmingham, AL
RELATED REPORTS & OPTIONS
Arts, Media & Entertainment
Birmingham
Compare Zip Codes
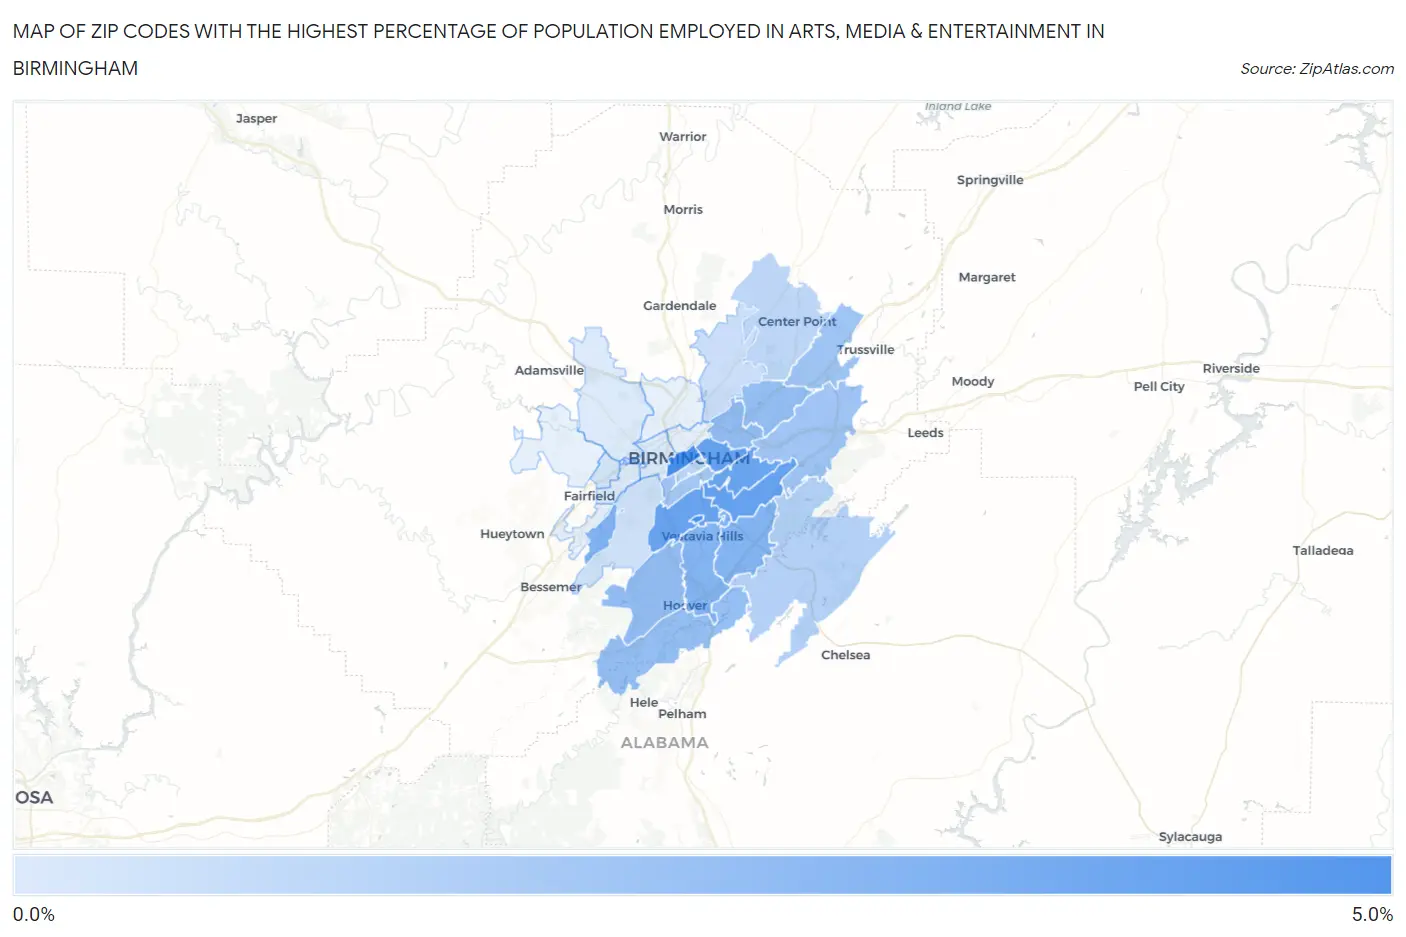
Map of Zip Codes with the Highest Percentage of Population Employed in Arts, Media & Entertainment in Birmingham
0.0%
5.0%
Zip Codes with the Highest Percentage of Population Employed in Arts, Media & Entertainment in Birmingham, AL
| Zip Code | % Employed | vs State | vs National | |
| 1. | 35229 | 4.7% | 1.3%(+3.48)#13 | 2.1%(+2.68)#1,669 |
| 2. | 35203 | 4.7% | 1.3%(+3.47)#14 | 2.1%(+2.66)#1,677 |
| 3. | 35223 | 3.8% | 1.3%(+2.58)#21 | 2.1%(+1.78)#2,568 |
| 4. | 35222 | 3.8% | 1.3%(+2.56)#22 | 2.1%(+1.76)#2,602 |
| 5. | 35209 | 3.8% | 1.3%(+2.49)#25 | 2.1%(+1.69)#2,687 |
| 6. | 35213 | 3.6% | 1.3%(+2.36)#29 | 2.1%(+1.56)#2,881 |
| 7. | 35221 | 3.0% | 1.3%(+1.74)#40 | 2.1%(+0.934)#4,092 |
| 8. | 35216 | 2.9% | 1.3%(+1.68)#43 | 2.1%(+0.881)#4,222 |
| 9. | 35243 | 2.9% | 1.3%(+1.64)#45 | 2.1%(+0.834)#4,362 |
| 10. | 35212 | 2.5% | 1.3%(+1.19)#58 | 2.1%(+0.391)#5,728 |
| 11. | 35226 | 2.4% | 1.3%(+1.14)#61 | 2.1%(+0.340)#5,933 |
| 12. | 35206 | 2.3% | 1.3%(+1.08)#63 | 2.1%(+0.277)#6,192 |
| 13. | 35244 | 2.3% | 1.3%(+1.07)#64 | 2.1%(+0.270)#6,237 |
| 14. | 35235 | 2.1% | 1.3%(+0.798)#78 | 2.1%(-0.005)#7,515 |
| 15. | 35210 | 2.0% | 1.3%(+0.741)#82 | 2.1%(-0.062)#7,820 |
| 16. | 35205 | 2.0% | 1.3%(+0.698)#86 | 2.1%(-0.105)#8,053 |
| 17. | 35242 | 1.4% | 1.3%(+0.175)#133 | 2.1%(-0.628)#11,473 |
| 18. | 35233 | 1.2% | 1.3%(-0.011)#162 | 2.1%(-0.814)#12,890 |
| 19. | 35215 | 1.2% | 1.3%(-0.098)#179 | 2.1%(-0.902)#13,512 |
| 20. | 35217 | 0.79% | 1.3%(-0.468)#246 | 2.1%(-1.27)#16,511 |
| 21. | 35211 | 0.66% | 1.3%(-0.595)#268 | 2.1%(-1.40)#17,565 |
| 22. | 35218 | 0.50% | 1.3%(-0.760)#294 | 2.1%(-1.56)#18,877 |
| 23. | 35204 | 0.25% | 1.3%(-1.00)#340 | 2.1%(-1.81)#20,645 |
| 24. | 35208 | 0.23% | 1.3%(-1.03)#345 | 2.1%(-1.83)#20,778 |
| 25. | 35214 | 0.23% | 1.3%(-1.03)#346 | 2.1%(-1.83)#20,814 |
1
Common Questions
What are the Top 10 Zip Codes with the Highest Percentage of Population Employed in Arts, Media & Entertainment in Birmingham, AL?
Top 10 Zip Codes with the Highest Percentage of Population Employed in Arts, Media & Entertainment in Birmingham, AL are:
What zip code has the Highest Percentage of Population Employed in Arts, Media & Entertainment in Birmingham, AL?
35229 has the Highest Percentage of Population Employed in Arts, Media & Entertainment in Birmingham, AL with 4.7%.
What is the Percentage of Population Employed in Arts, Media & Entertainment in Birmingham, AL?
Percentage of Population Employed in Arts, Media & Entertainment in Birmingham is 1.5%.
What is the Percentage of Population Employed in Arts, Media & Entertainment in Alabama?
Percentage of Population Employed in Arts, Media & Entertainment in Alabama is 1.3%.
What is the Percentage of Population Employed in Arts, Media & Entertainment in the United States?
Percentage of Population Employed in Arts, Media & Entertainment in the United States is 2.1%.