Ballplay, AL
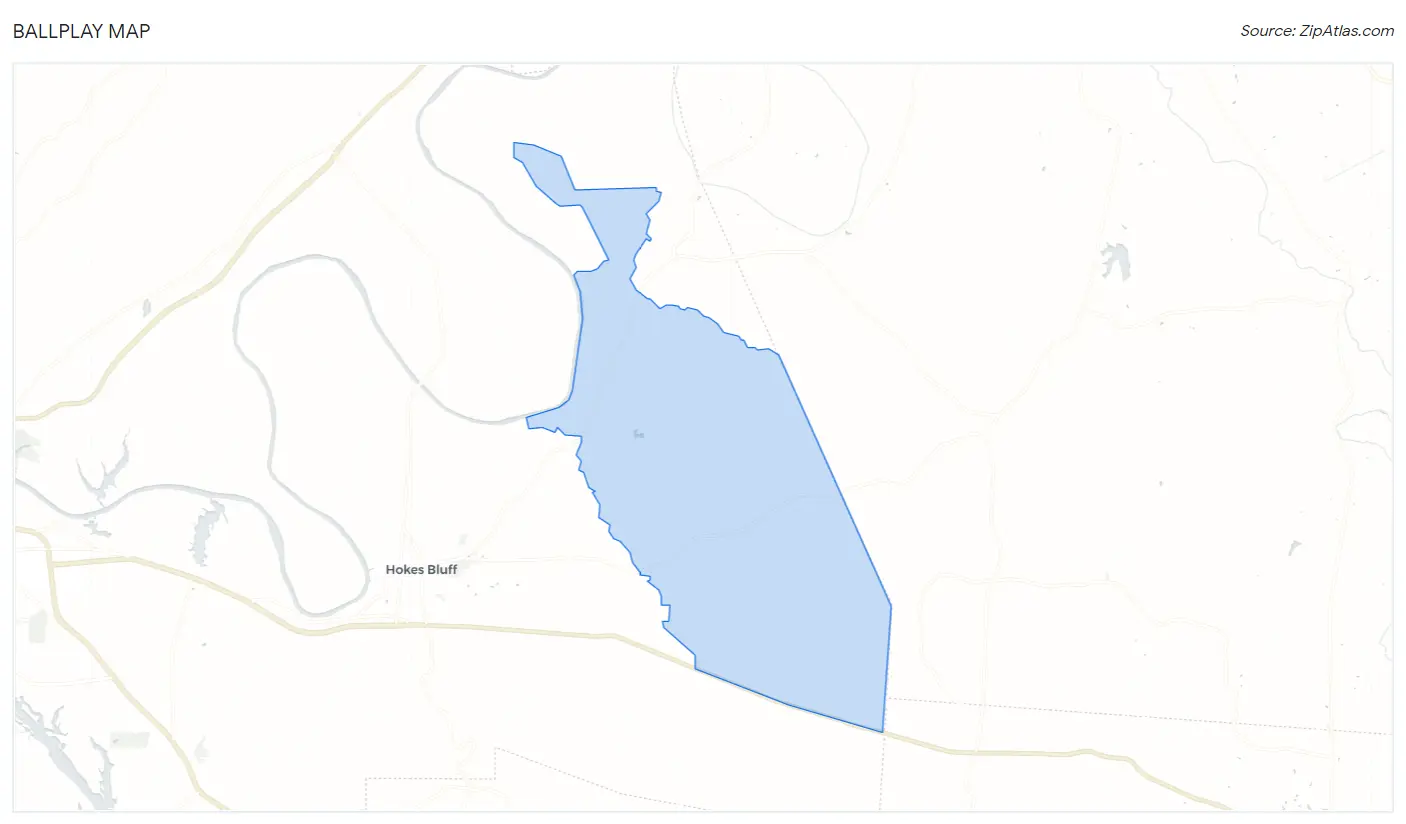
Ballplay Map
Ballplay Overview
1,181
TOTAL POPULATION
565
MALE POPULATION
616
FEMALE POPULATION
91.72
MALES / 100 FEMALES
109.03
FEMALES / 100 MALES
37.0
MEDIAN AGE
3.7
AVG FAMILY SIZE
2.9
AVG HOUSEHOLD SIZE
$22,459
PER CAPITA INCOME
$66,250
AVG FAMILY INCOME
$57,582
AVG HOUSEHOLD INCOME
49.4%
WAGE / INCOME GAP [ % ]
50.6¢/ $1
WAGE / INCOME GAP [ $ ]
0.35
INEQUALITY / GINI INDEX
598
LABOR FORCE [ PEOPLE ]
64.5%
PERCENT IN LABOR FORCE
12.9%
UNEMPLOYMENT RATE
Race in Ballplay
The most populous races in Ballplay are White / Caucasian (1,108 | 93.8%), Two or more Races (48 | 4.1%), and Native / Alaskan (25 | 2.1%).
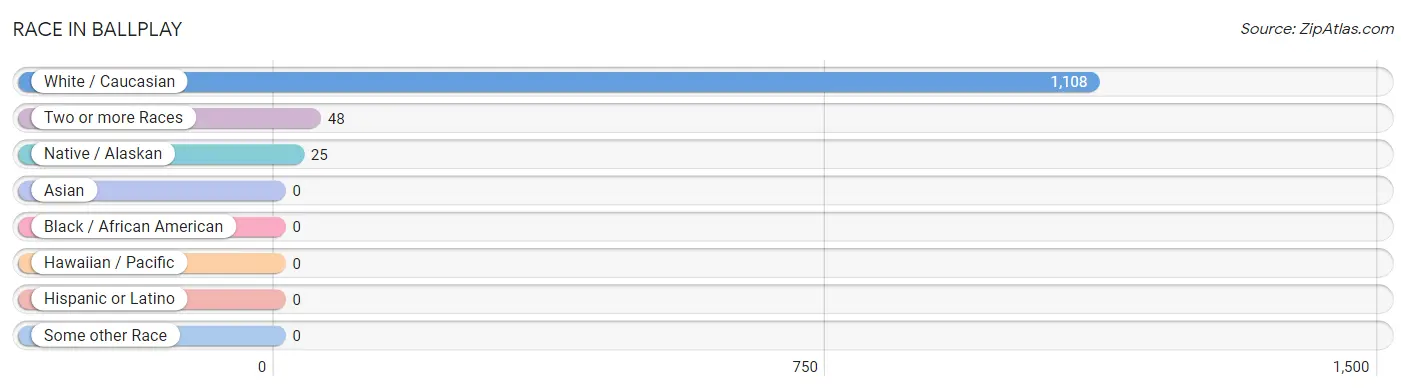
| Race | # Population | % Population |
| Asian | 0 | 0.0% |
| Black / African American | 0 | 0.0% |
| Hawaiian / Pacific | 0 | 0.0% |
| Hispanic or Latino | 0 | 0.0% |
| Native / Alaskan | 25 | 2.1% |
| White / Caucasian | 1,108 | 93.8% |
| Two or more Races | 48 | 4.1% |
| Some other Race | 0 | 0.0% |
| Total | 1,181 | 100.0% |
Ancestry in Ballplay
The most populous ancestries reported in Ballplay are American (341 | 28.9%), Irish (139 | 11.8%), English (58 | 4.9%), German (49 | 4.2%), and Cree (43 | 3.6%), together accounting for 53.3% of all Ballplay residents.
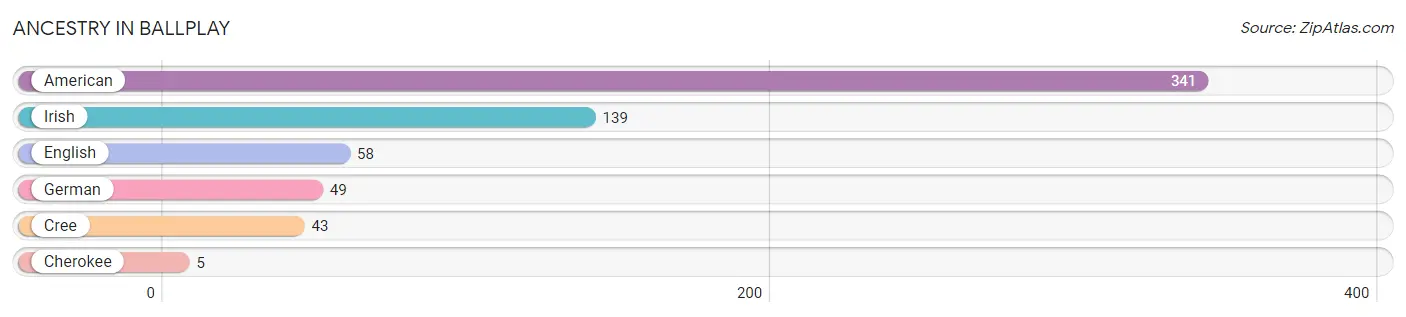
| Ancestry | # Population | % Population |
| American | 341 | 28.9% |
| Cherokee | 5 | 0.4% |
| Cree | 43 | 3.6% |
| English | 58 | 4.9% |
| German | 49 | 4.2% |
| Irish | 139 | 11.8% | View All 6 Rows |
Immigrants in Ballplay

| Immigration Origin | # Population | % Population | View All 0 Rows |
Sex and Age in Ballplay
Sex and Age in Ballplay
The most populous age groups in Ballplay are 40 to 44 Years (92 | 16.3%) for men and 30 to 34 Years (76 | 12.3%) for women.
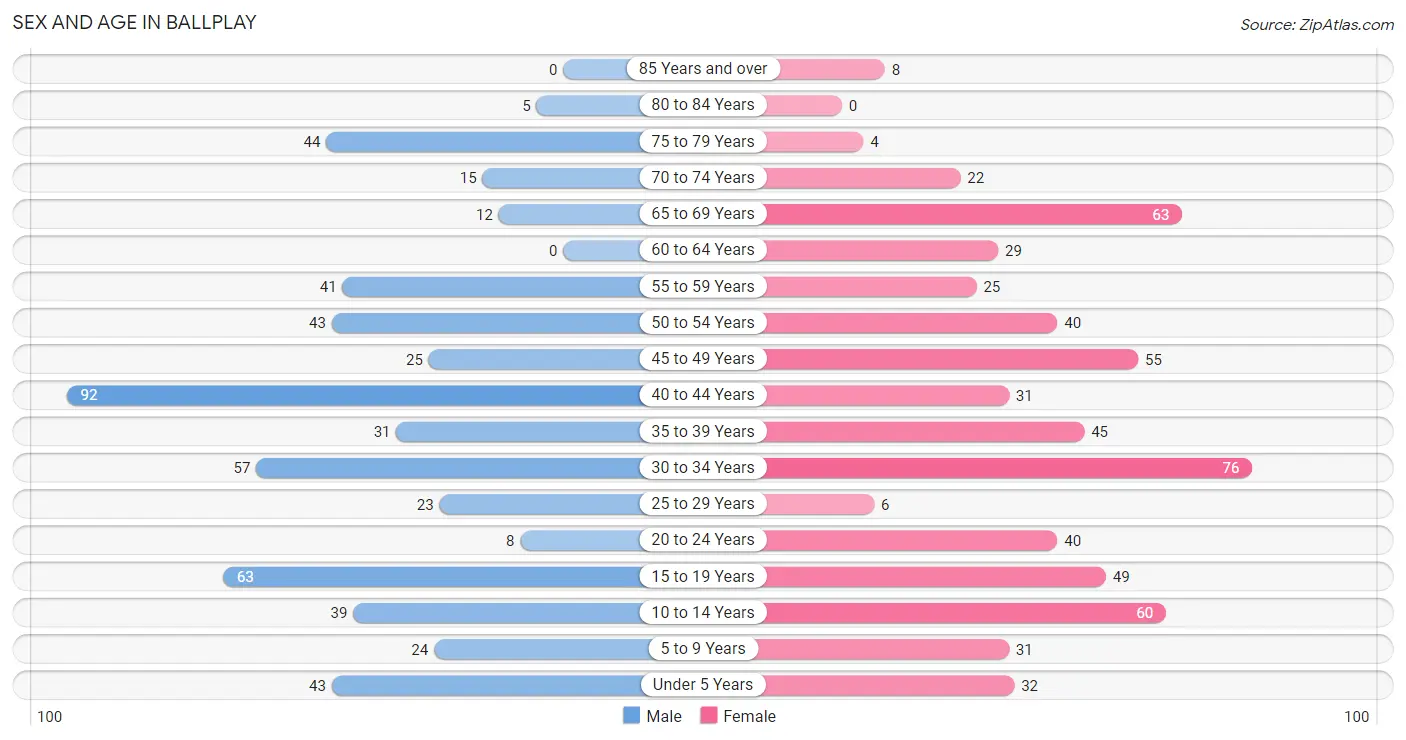
| Age Bracket | Male | Female |
| Under 5 Years | 43 (7.6%) | 32 (5.2%) |
| 5 to 9 Years | 24 (4.3%) | 31 (5.0%) |
| 10 to 14 Years | 39 (6.9%) | 60 (9.7%) |
| 15 to 19 Years | 63 (11.2%) | 49 (8.0%) |
| 20 to 24 Years | 8 (1.4%) | 40 (6.5%) |
| 25 to 29 Years | 23 (4.1%) | 6 (1.0%) |
| 30 to 34 Years | 57 (10.1%) | 76 (12.3%) |
| 35 to 39 Years | 31 (5.5%) | 45 (7.3%) |
| 40 to 44 Years | 92 (16.3%) | 31 (5.0%) |
| 45 to 49 Years | 25 (4.4%) | 55 (8.9%) |
| 50 to 54 Years | 43 (7.6%) | 40 (6.5%) |
| 55 to 59 Years | 41 (7.3%) | 25 (4.1%) |
| 60 to 64 Years | 0 (0.0%) | 29 (4.7%) |
| 65 to 69 Years | 12 (2.1%) | 63 (10.2%) |
| 70 to 74 Years | 15 (2.6%) | 22 (3.6%) |
| 75 to 79 Years | 44 (7.8%) | 4 (0.6%) |
| 80 to 84 Years | 5 (0.9%) | 0 (0.0%) |
| 85 Years and over | 0 (0.0%) | 8 (1.3%) |
| Total | 565 (100.0%) | 616 (100.0%) |
Families and Households in Ballplay
Median Family Size in Ballplay
The median family size in Ballplay is 3.74 persons per family, with single female/mother families (43 | 15.5%) accounting for the largest median family size of 3.88 persons per family. On the other hand, single male/father families (48 | 17.3%) represent the smallest median family size with 3.15 persons per family.
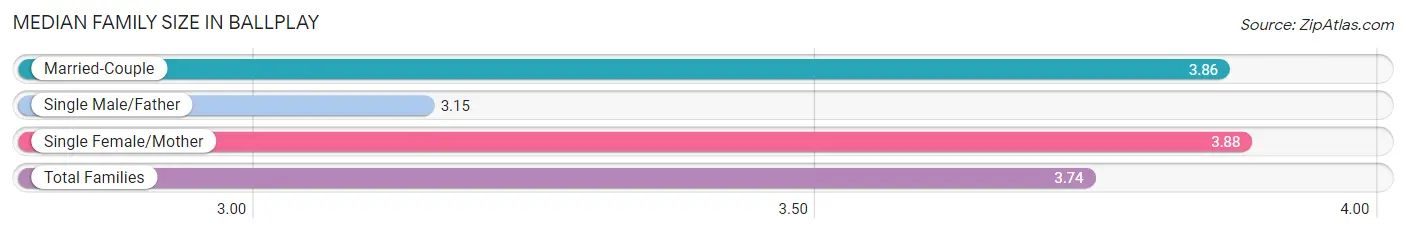
| Family Type | # Families | Family Size |
| Married-Couple | 187 (67.3%) | 3.86 |
| Single Male/Father | 48 (17.3%) | 3.15 |
| Single Female/Mother | 43 (15.5%) | 3.88 |
| Total Families | 278 (100.0%) | 3.74 |
Median Household Size in Ballplay
The median household size in Ballplay is 2.87 persons per household, with single female/mother households (43 | 10.5%) accounting for the largest median household size of 3.88 persons per household. non-family households (133 | 32.4%) represent the smallest median household size with 1.07 persons per household.
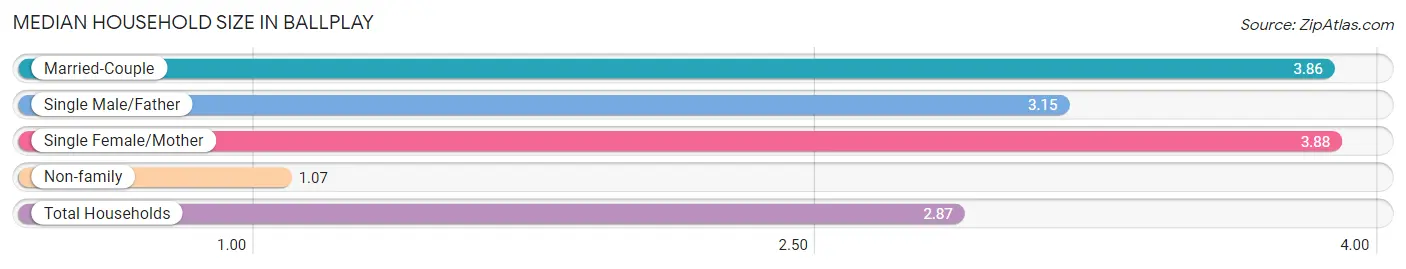
| Household Type | # Households | Household Size |
| Married-Couple | 187 (45.5%) | 3.86 |
| Single Male/Father | 48 (11.7%) | 3.15 |
| Single Female/Mother | 43 (10.5%) | 3.88 |
| Non-family | 133 (32.4%) | 1.07 |
| Total Households | 411 (100.0%) | 2.87 |
Household Size by Marriage Status in Ballplay
Out of a total of 411 households in Ballplay, 278 (67.6%) are family households, while 133 (32.4%) are nonfamily households. The most numerous type of family households are 2-person households, comprising 126, and the most common type of nonfamily households are 1-person households, comprising 124.
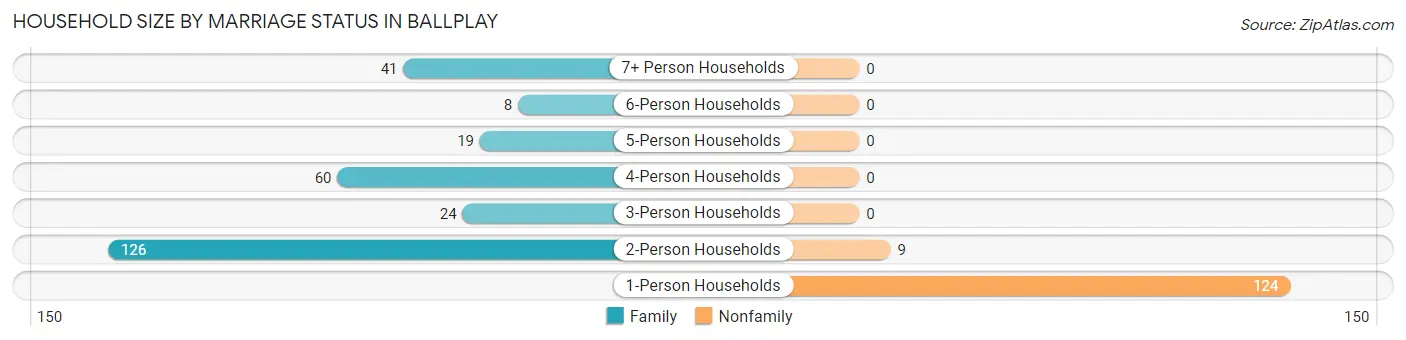
| Household Size | Family Households | Nonfamily Households |
| 1-Person Households | - | 124 (30.2%) |
| 2-Person Households | 126 (30.7%) | 9 (2.2%) |
| 3-Person Households | 24 (5.8%) | 0 (0.0%) |
| 4-Person Households | 60 (14.6%) | 0 (0.0%) |
| 5-Person Households | 19 (4.6%) | 0 (0.0%) |
| 6-Person Households | 8 (1.9%) | 0 (0.0%) |
| 7+ Person Households | 41 (10.0%) | 0 (0.0%) |
| Total | 278 (67.6%) | 133 (32.4%) |
Female Fertility in Ballplay
Fertility by Age in Ballplay
Average fertility rate in Ballplay is 26.0 births per 1,000 women. Women in the age bracket of 20 to 34 years have the highest fertility rate with 66.0 births per 1,000 women. Women in the age bracket of 20 to 34 years acount for 100.0% of all women with births.
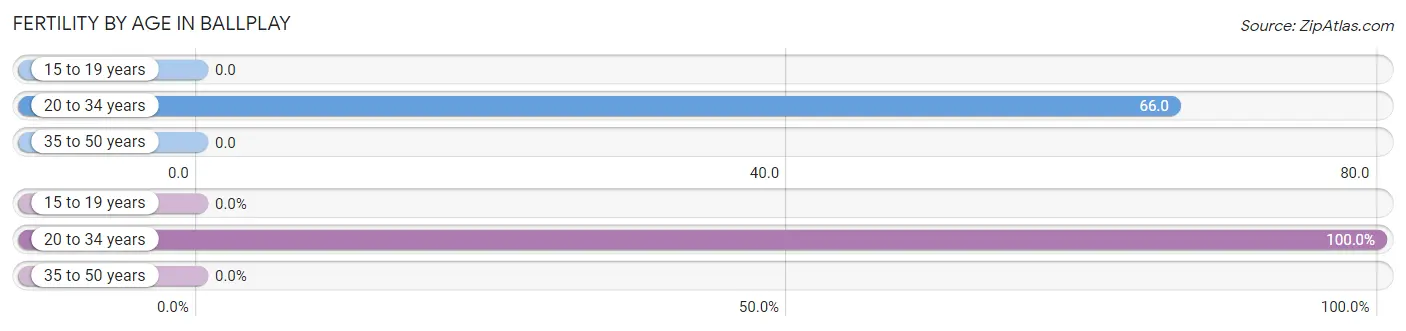
| Age Bracket | Women with Births | Births / 1,000 Women |
| 15 to 19 years | 0 (0.0%) | 0.0 |
| 20 to 34 years | 8 (100.0%) | 66.0 |
| 35 to 50 years | 0 (0.0%) | 0.0 |
| Total | 8 (100.0%) | 26.0 |
Fertility by Age by Marriage Status in Ballplay
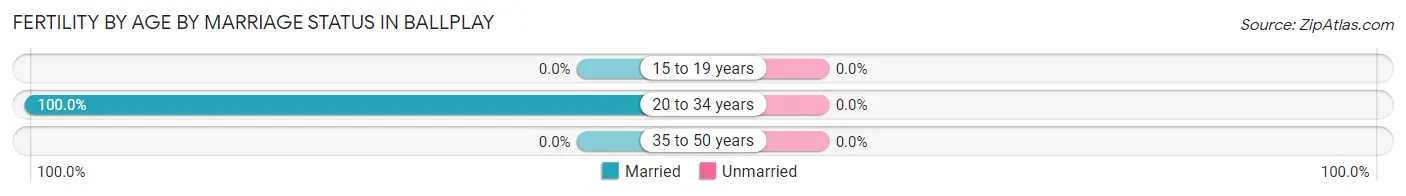
| Age Bracket | Married | Unmarried |
| 15 to 19 years | 0 (0.0%) | 0 (0.0%) |
| 20 to 34 years | 8 (100.0%) | 0 (0.0%) |
| 35 to 50 years | 0 (0.0%) | 0 (0.0%) |
| Total | 8 (100.0%) | 0 (0.0%) |
Fertility by Education in Ballplay
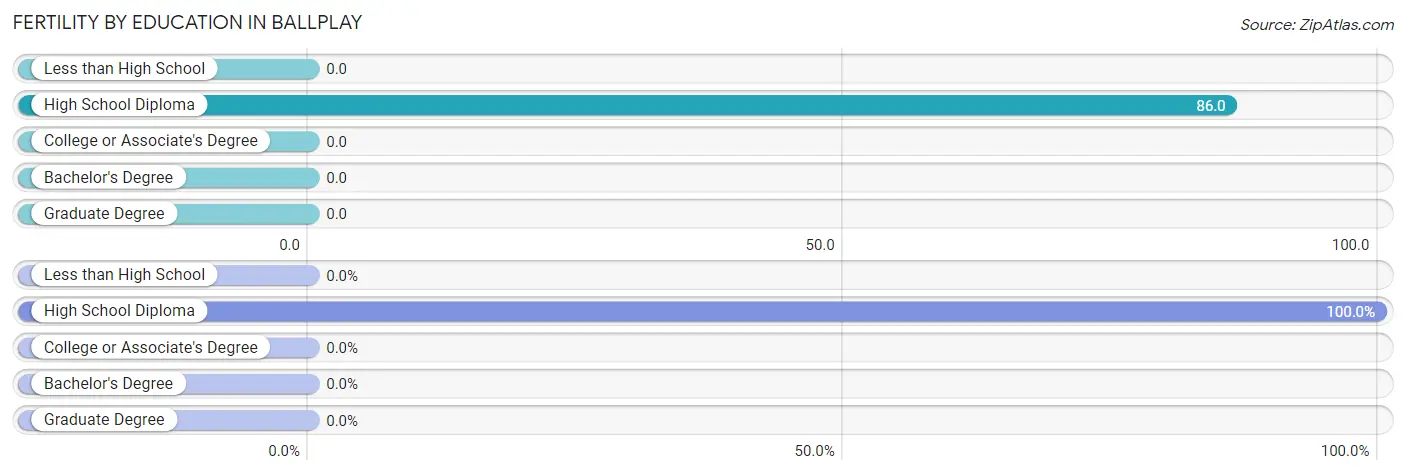
| Educational Attainment | Women with Births | Births / 1,000 Women |
| Less than High School | 0 (0.0%) | 0.0 |
| High School Diploma | 8 (100.0%) | 86.0 |
| College or Associate's Degree | 0 (0.0%) | 0.0 |
| Bachelor's Degree | 0 (0.0%) | 0.0 |
| Graduate Degree | 0 (0.0%) | 0.0 |
| Total | 8 (100.0%) | 26.0 |
Fertility by Education by Marriage Status in Ballplay
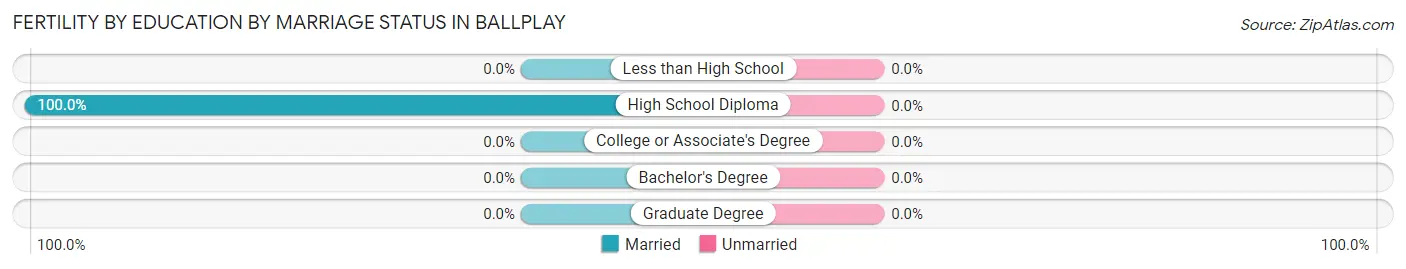
| Educational Attainment | Married | Unmarried |
| Less than High School | 0 (0.0%) | 0 (0.0%) |
| High School Diploma | 8 (100.0%) | 0 (0.0%) |
| College or Associate's Degree | 0 (0.0%) | 0 (0.0%) |
| Bachelor's Degree | 0 (0.0%) | 0 (0.0%) |
| Graduate Degree | 0 (0.0%) | 0 (0.0%) |
| Total | 8 (100.0%) | 0 (0.0%) |
Income in Ballplay
Income Overview in Ballplay
Per Capita Income in Ballplay is $22,459, while median incomes of families and households are $66,250 and $57,582 respectively.
| Characteristic | Number | Measure |
| Per Capita Income | 1,181 | $22,459 |
| Median Family Income | 278 | $66,250 |
| Mean Family Income | 278 | $72,126 |
| Median Household Income | 411 | $57,582 |
| Mean Household Income | 411 | $62,762 |
| Income Deficit | 278 | $0 |
| Wage / Income Gap (%) | 1,181 | 49.42% |
| Wage / Income Gap ($) | 1,181 | 50.58¢ per $1 |
| Gini / Inequality Index | 1,181 | 0.35 |
Earnings by Sex in Ballplay
Average Earnings in Ballplay are $27,314, $39,853 for men and $20,156 for women, a difference of 49.4%.
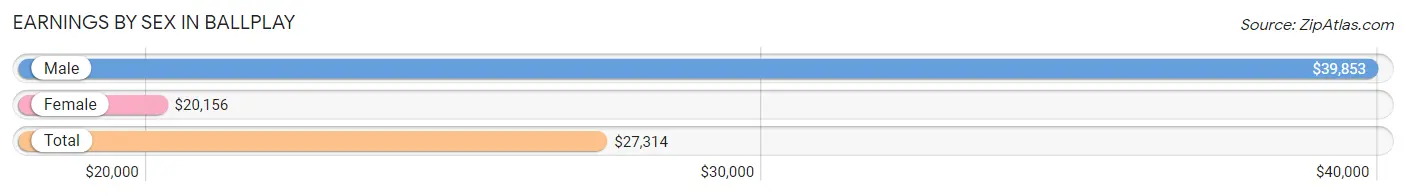
| Sex | Number | Average Earnings |
| Male | 300 (51.5%) | $39,853 |
| Female | 283 (48.5%) | $20,156 |
| Total | 583 (100.0%) | $27,314 |
Earnings by Sex by Income Bracket in Ballplay
The most common earnings brackets in Ballplay are $55,000 to $64,999 for men (50 | 16.7%) and $25,000 to $29,999 for women (58 | 20.5%).
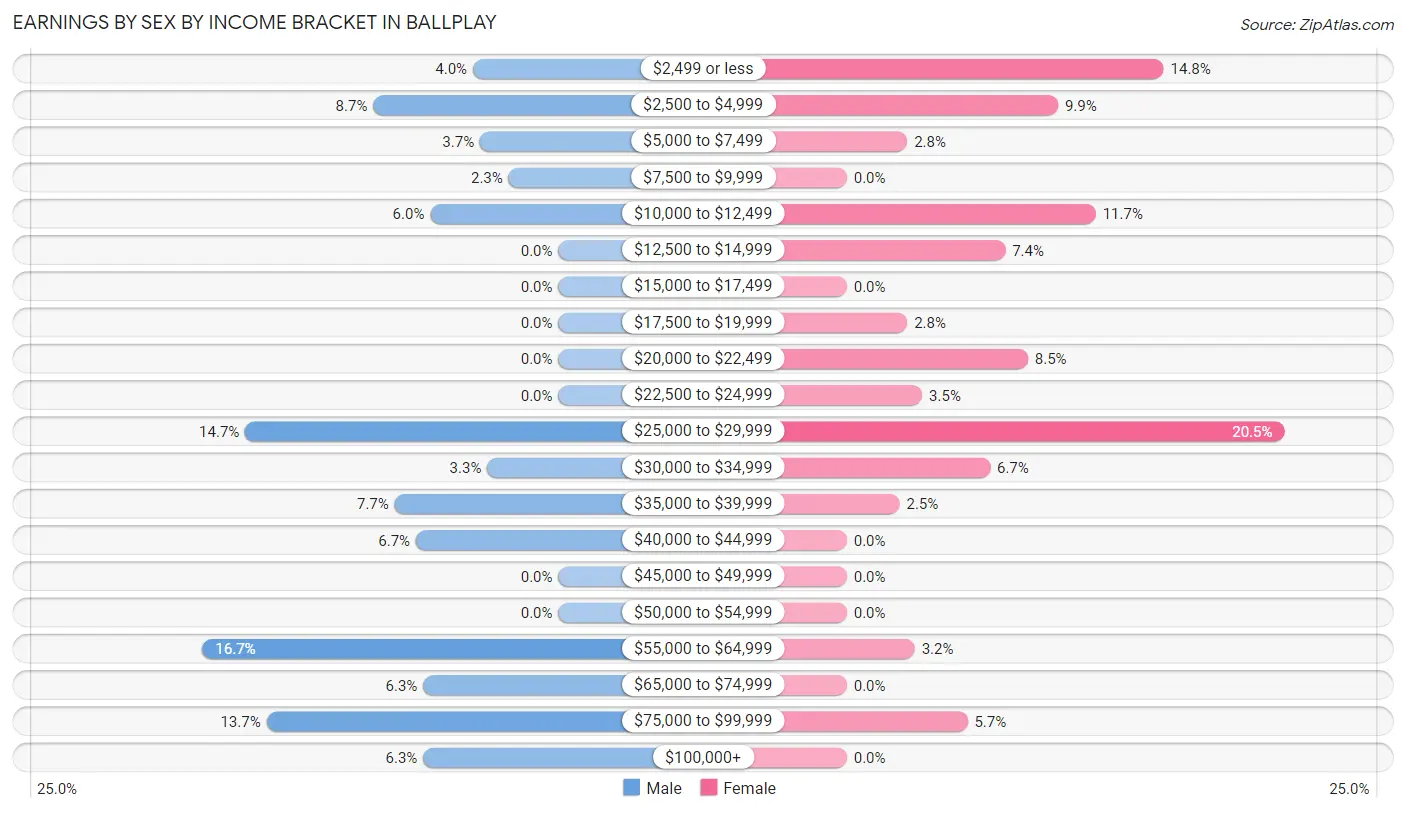
| Income | Male | Female |
| $2,499 or less | 12 (4.0%) | 42 (14.8%) |
| $2,500 to $4,999 | 26 (8.7%) | 28 (9.9%) |
| $5,000 to $7,499 | 11 (3.7%) | 8 (2.8%) |
| $7,500 to $9,999 | 7 (2.3%) | 0 (0.0%) |
| $10,000 to $12,499 | 18 (6.0%) | 33 (11.7%) |
| $12,500 to $14,999 | 0 (0.0%) | 21 (7.4%) |
| $15,000 to $17,499 | 0 (0.0%) | 0 (0.0%) |
| $17,500 to $19,999 | 0 (0.0%) | 8 (2.8%) |
| $20,000 to $22,499 | 0 (0.0%) | 24 (8.5%) |
| $22,500 to $24,999 | 0 (0.0%) | 10 (3.5%) |
| $25,000 to $29,999 | 44 (14.7%) | 58 (20.5%) |
| $30,000 to $34,999 | 10 (3.3%) | 19 (6.7%) |
| $35,000 to $39,999 | 23 (7.7%) | 7 (2.5%) |
| $40,000 to $44,999 | 20 (6.7%) | 0 (0.0%) |
| $45,000 to $49,999 | 0 (0.0%) | 0 (0.0%) |
| $50,000 to $54,999 | 0 (0.0%) | 0 (0.0%) |
| $55,000 to $64,999 | 50 (16.7%) | 9 (3.2%) |
| $65,000 to $74,999 | 19 (6.3%) | 0 (0.0%) |
| $75,000 to $99,999 | 41 (13.7%) | 16 (5.7%) |
| $100,000+ | 19 (6.3%) | 0 (0.0%) |
| Total | 300 (100.0%) | 283 (100.0%) |
Earnings by Sex by Educational Attainment in Ballplay
Average earnings in Ballplay are $57,639 for men and $21,667 for women, a difference of 62.4%. Men with an educational attainment of college or associate's degree enjoy the highest average annual earnings of $59,224, while those with college or associate's degree education earn the least with $59,224. Women with an educational attainment of less than high school earn the most with the average annual earnings of $31,250, while those with college or associate's degree education have the smallest earnings of $13,929.
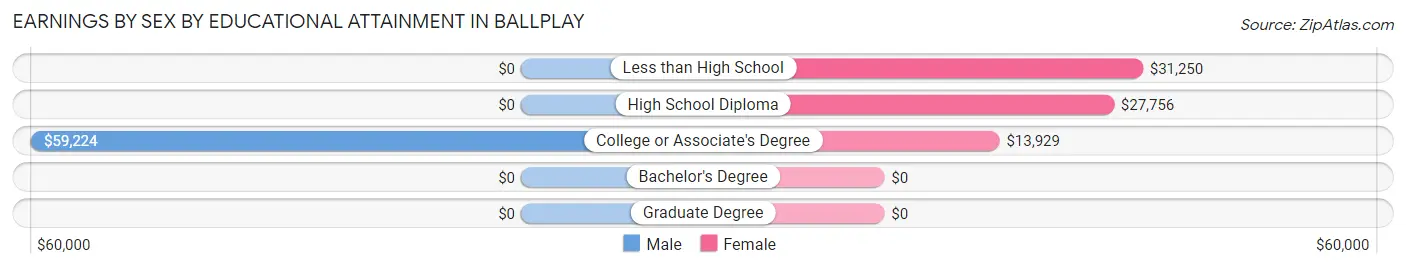
| Educational Attainment | Male Income | Female Income |
| Less than High School | - | - |
| High School Diploma | - | - |
| College or Associate's Degree | $59,224 | $13,929 |
| Bachelor's Degree | - | - |
| Graduate Degree | - | - |
| Total | $57,639 | $21,667 |
Family Income in Ballplay
Family Income Brackets in Ballplay
According to the Ballplay family income data, there are 80 families falling into the $50,000 to $74,999 income range, which is the most common income bracket and makes up 28.8% of all families.
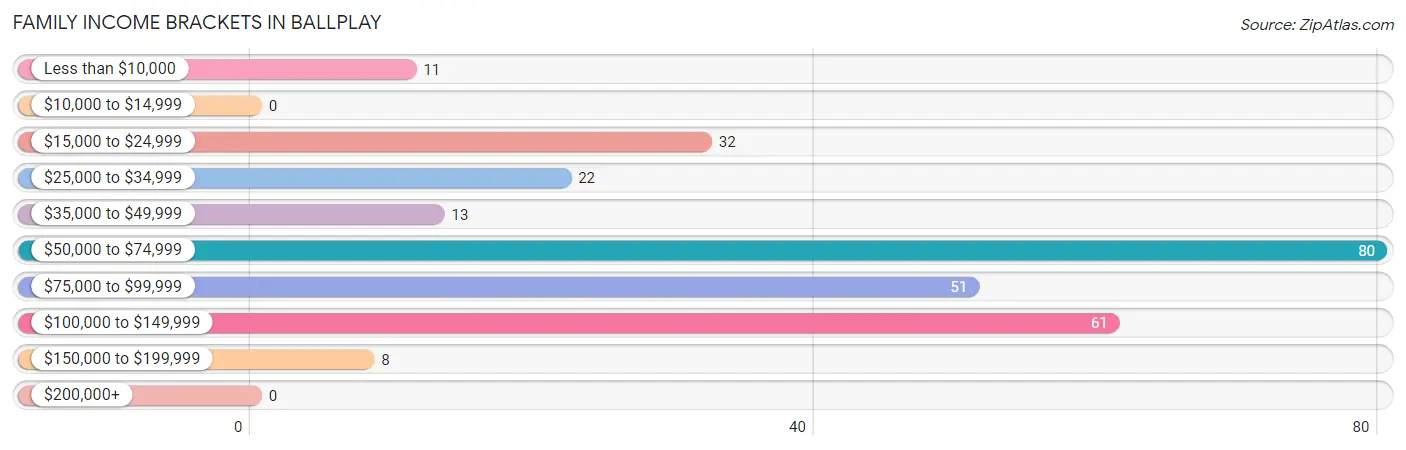
| Income Bracket | # Families | % Families |
| Less than $10,000 | 11 | 4.0% |
| $10,000 to $14,999 | 0 | 0.0% |
| $15,000 to $24,999 | 32 | 11.5% |
| $25,000 to $34,999 | 22 | 7.9% |
| $35,000 to $49,999 | 13 | 4.7% |
| $50,000 to $74,999 | 80 | 28.8% |
| $75,000 to $99,999 | 51 | 18.3% |
| $100,000 to $149,999 | 61 | 21.9% |
| $150,000 to $199,999 | 8 | 2.9% |
| $200,000+ | 0 | 0.0% |
Family Income by Famaliy Size in Ballplay
4-person families (60 | 21.6%) account for the highest median family income in Ballplay with $102,619 per family, while 3-person families (24 | 8.6%) have the highest median income of $32,083 per family member.
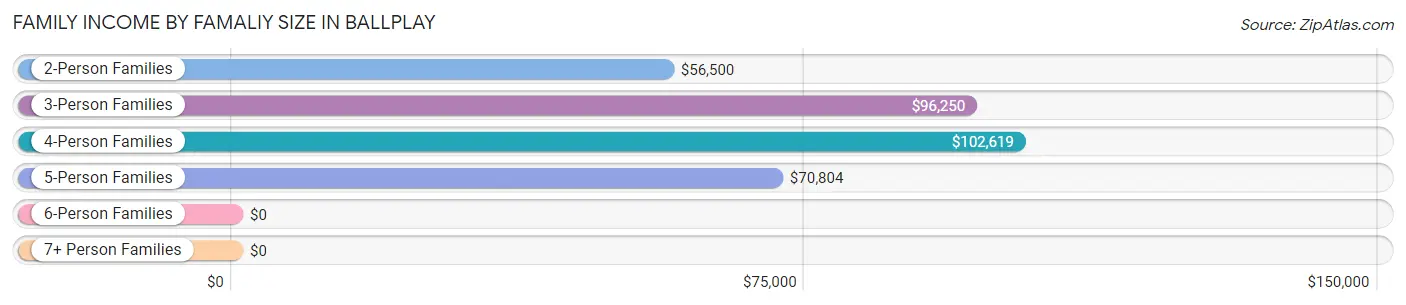
| Income Bracket | # Families | Median Income |
| 2-Person Families | 126 (45.3%) | $56,500 |
| 3-Person Families | 24 (8.6%) | $96,250 |
| 4-Person Families | 60 (21.6%) | $102,619 |
| 5-Person Families | 19 (6.8%) | $70,804 |
| 6-Person Families | 8 (2.9%) | $0 |
| 7+ Person Families | 41 (14.7%) | $0 |
| Total | 278 (100.0%) | $66,250 |
Family Income by Number of Earners in Ballplay
The median family income in Ballplay is $66,250, with families comprising 3+ earners (42) having the highest median family income of $103,452, while families with no earners (50) have the lowest median family income of $23,594, accounting for 15.1% and 18.0% of families, respectively.
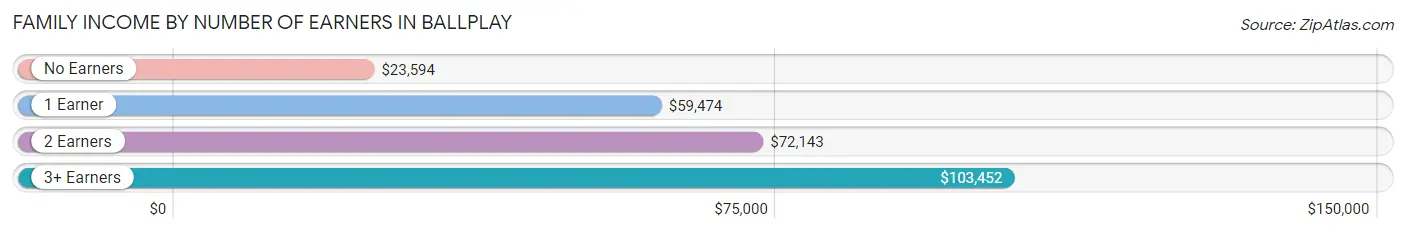
| Number of Earners | # Families | Median Income |
| No Earners | 50 (18.0%) | $23,594 |
| 1 Earner | 70 (25.2%) | $59,474 |
| 2 Earners | 116 (41.7%) | $72,143 |
| 3+ Earners | 42 (15.1%) | $103,452 |
| Total | 278 (100.0%) | $66,250 |
Household Income in Ballplay
Household Income Brackets in Ballplay
With 88 households falling in the category, the $50,000 to $74,999 income range is the most frequent in Ballplay, accounting for 21.4% of all households.
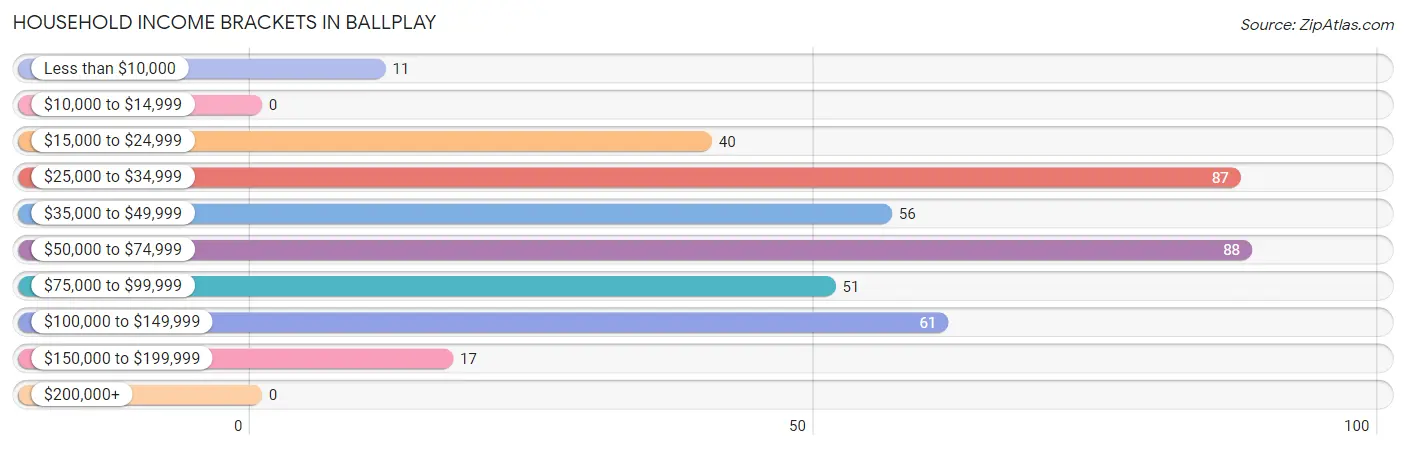
| Income Bracket | # Households | % Households |
| Less than $10,000 | 11 | 2.7% |
| $10,000 to $14,999 | 0 | 0.0% |
| $15,000 to $24,999 | 40 | 9.7% |
| $25,000 to $34,999 | 87 | 21.2% |
| $35,000 to $49,999 | 56 | 13.6% |
| $50,000 to $74,999 | 88 | 21.4% |
| $75,000 to $99,999 | 51 | 12.4% |
| $100,000 to $149,999 | 61 | 14.8% |
| $150,000 to $199,999 | 17 | 4.1% |
| $200,000+ | 0 | 0.0% |
Household Income by Householder Age in Ballplay
The median household income in Ballplay is $57,582, with the highest median household income of $81,094 found in the 45 to 64 years age bracket for the primary householder. A total of 145 households (35.3%) fall into this category.
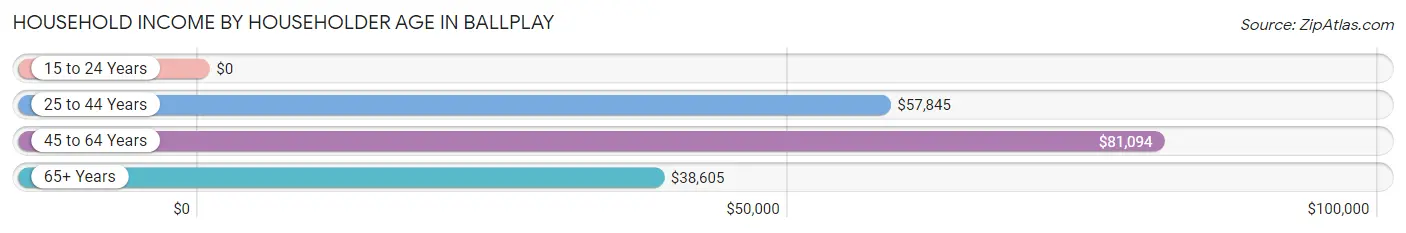
| Income Bracket | # Households | Median Income |
| 15 to 24 Years | 0 (0.0%) | $0 |
| 25 to 44 Years | 130 (31.6%) | $57,845 |
| 45 to 64 Years | 145 (35.3%) | $81,094 |
| 65+ Years | 136 (33.1%) | $38,605 |
| Total | 411 (100.0%) | $57,582 |
Poverty in Ballplay
Income Below Poverty by Sex and Age in Ballplay
With 6.2% poverty level for males and 5.7% for females among the residents of Ballplay, 6 to 11 year old males and under 5 year old females are the most vulnerable to poverty, with 15 males (29.4%) and 12 females (37.5%) in their respective age groups living below the poverty level.
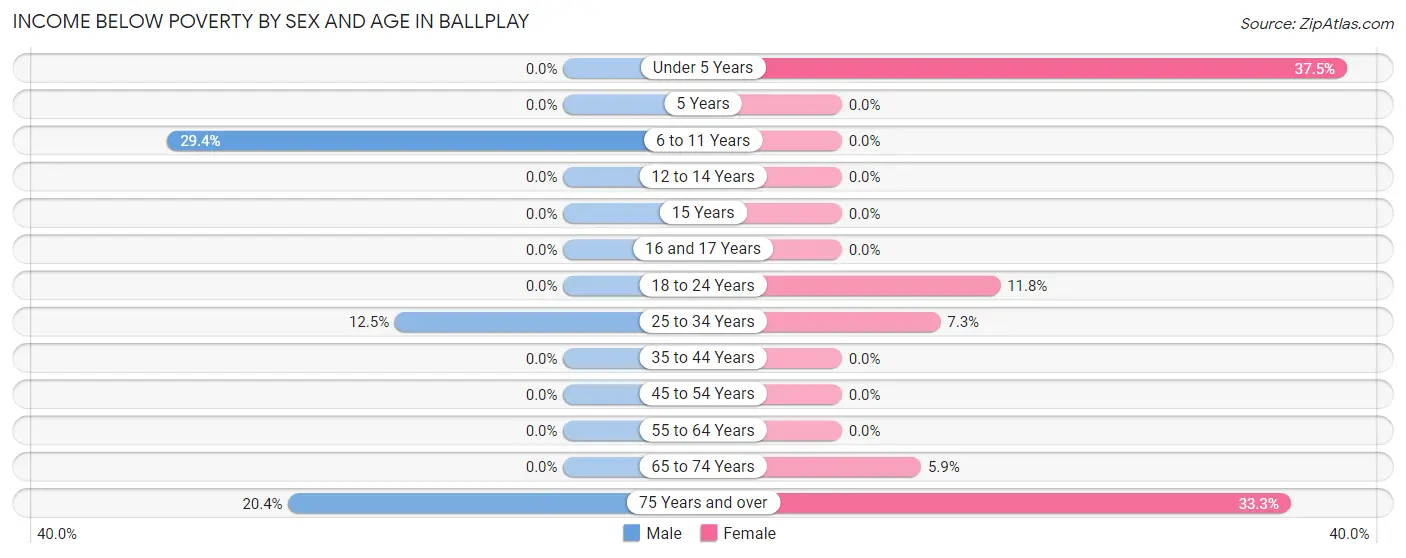
| Age Bracket | Male | Female |
| Under 5 Years | 0 (0.0%) | 12 (37.5%) |
| 5 Years | 0 (0.0%) | 0 (0.0%) |
| 6 to 11 Years | 15 (29.4%) | 0 (0.0%) |
| 12 to 14 Years | 0 (0.0%) | 0 (0.0%) |
| 15 Years | 0 (0.0%) | 0 (0.0%) |
| 16 and 17 Years | 0 (0.0%) | 0 (0.0%) |
| 18 to 24 Years | 0 (0.0%) | 8 (11.8%) |
| 25 to 34 Years | 10 (12.5%) | 6 (7.3%) |
| 35 to 44 Years | 0 (0.0%) | 0 (0.0%) |
| 45 to 54 Years | 0 (0.0%) | 0 (0.0%) |
| 55 to 64 Years | 0 (0.0%) | 0 (0.0%) |
| 65 to 74 Years | 0 (0.0%) | 5 (5.9%) |
| 75 Years and over | 10 (20.4%) | 4 (33.3%) |
| Total | 35 (6.2%) | 35 (5.7%) |
Income Above Poverty by Sex and Age in Ballplay
According to the poverty statistics in Ballplay, males aged under 5 years and females aged 6 to 11 years are the age groups that are most secure financially, with 100.0% of males and 100.0% of females in these age groups living above the poverty line.
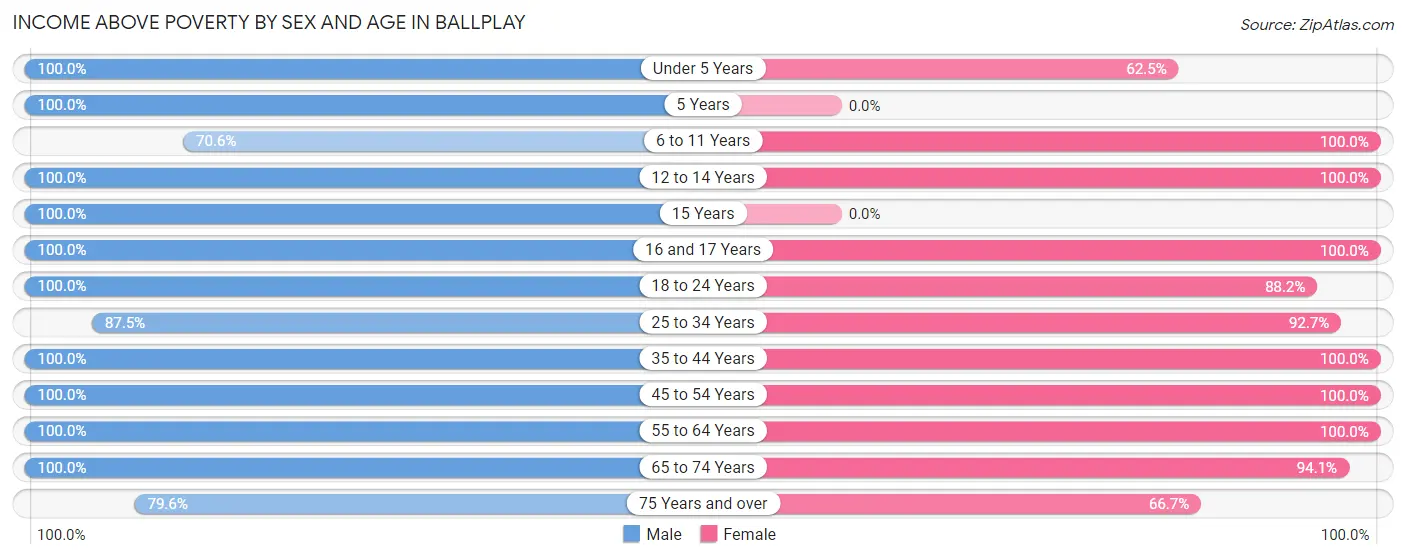
| Age Bracket | Male | Female |
| Under 5 Years | 43 (100.0%) | 20 (62.5%) |
| 5 Years | 9 (100.0%) | 0 (0.0%) |
| 6 to 11 Years | 36 (70.6%) | 56 (100.0%) |
| 12 to 14 Years | 3 (100.0%) | 35 (100.0%) |
| 15 Years | 25 (100.0%) | 0 (0.0%) |
| 16 and 17 Years | 12 (100.0%) | 21 (100.0%) |
| 18 to 24 Years | 34 (100.0%) | 60 (88.2%) |
| 25 to 34 Years | 70 (87.5%) | 76 (92.7%) |
| 35 to 44 Years | 123 (100.0%) | 76 (100.0%) |
| 45 to 54 Years | 68 (100.0%) | 95 (100.0%) |
| 55 to 64 Years | 41 (100.0%) | 54 (100.0%) |
| 65 to 74 Years | 27 (100.0%) | 80 (94.1%) |
| 75 Years and over | 39 (79.6%) | 8 (66.7%) |
| Total | 530 (93.8%) | 581 (94.3%) |
Income Below Poverty Among Married-Couple Families in Ballplay
The poverty statistics for married-couple families in Ballplay show that 5.3% or 10 of the total 187 families live below the poverty line. Families with no children have the highest poverty rate of 6.5%, comprising of 5 families. On the other hand, families with 5 or more children have the lowest poverty rate of 0.0%, which includes 0 families.
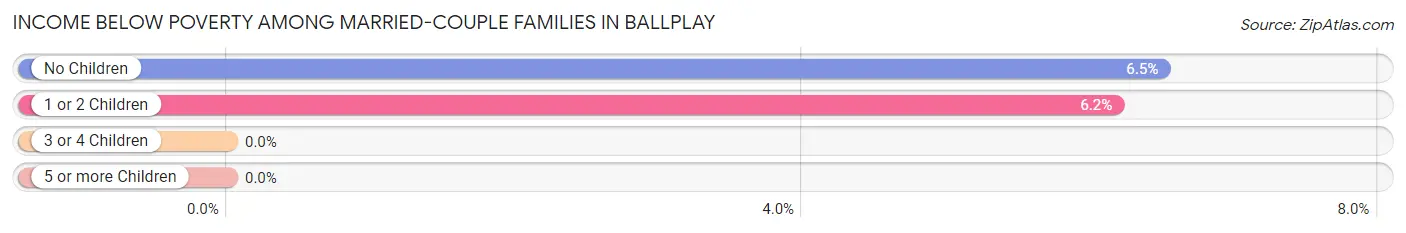
| Children | Above Poverty | Below Poverty |
| No Children | 72 (93.5%) | 5 (6.5%) |
| 1 or 2 Children | 76 (93.8%) | 5 (6.2%) |
| 3 or 4 Children | 0 (0.0%) | 0 (0.0%) |
| 5 or more Children | 29 (100.0%) | 0 (0.0%) |
| Total | 177 (94.7%) | 10 (5.3%) |
Income Below Poverty Among Single-Parent Households in Ballplay
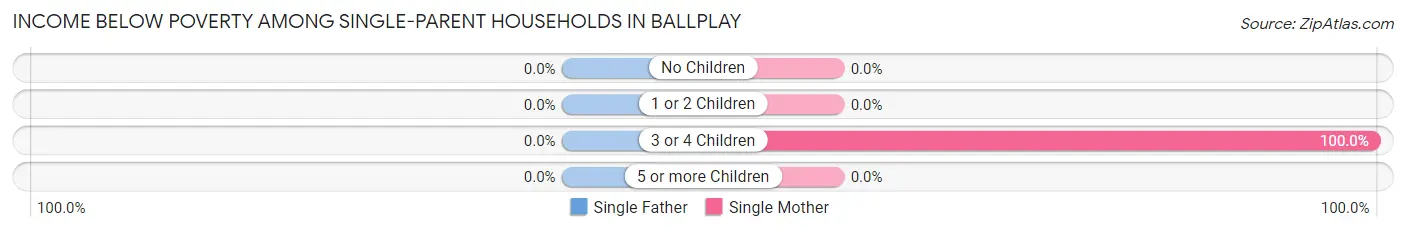
| Children | Single Father | Single Mother |
| No Children | 0 (0.0%) | 0 (0.0%) |
| 1 or 2 Children | 0 (0.0%) | 0 (0.0%) |
| 3 or 4 Children | 0 (0.0%) | 6 (100.0%) |
| 5 or more Children | 0 (0.0%) | 0 (0.0%) |
| Total | 0 (0.0%) | 6 (14.0%) |
Income Below Poverty Among Married-Couple vs Single-Parent Households in Ballplay
The poverty data for Ballplay shows that 10 of the married-couple family households (5.3%) and 6 of the single-parent households (6.6%) are living below the poverty level. Within the married-couple family households, those with no children have the highest poverty rate, with 5 households (6.5%) falling below the poverty line. Among the single-parent households, those with 3 or 4 children have the highest poverty rate, with 6 household (100.0%) living below poverty.
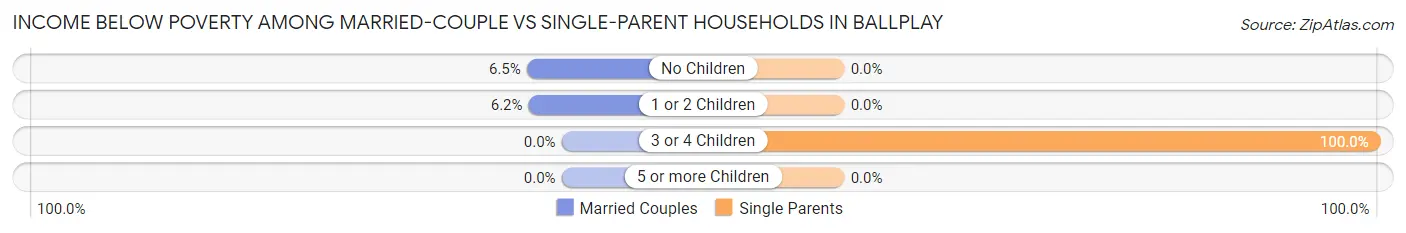
| Children | Married-Couple Families | Single-Parent Households |
| No Children | 5 (6.5%) | 0 (0.0%) |
| 1 or 2 Children | 5 (6.2%) | 0 (0.0%) |
| 3 or 4 Children | 0 (0.0%) | 6 (100.0%) |
| 5 or more Children | 0 (0.0%) | 0 (0.0%) |
| Total | 10 (5.3%) | 6 (6.6%) |
Employment Characteristics in Ballplay
Employment by Class of Employer in Ballplay
Among the 488 employed individuals in Ballplay, private company employees (344 | 70.5%), local government employees (46 | 9.4%), and self-employed (not incorporated) (40 | 8.2%) make up the most common classes of employment.
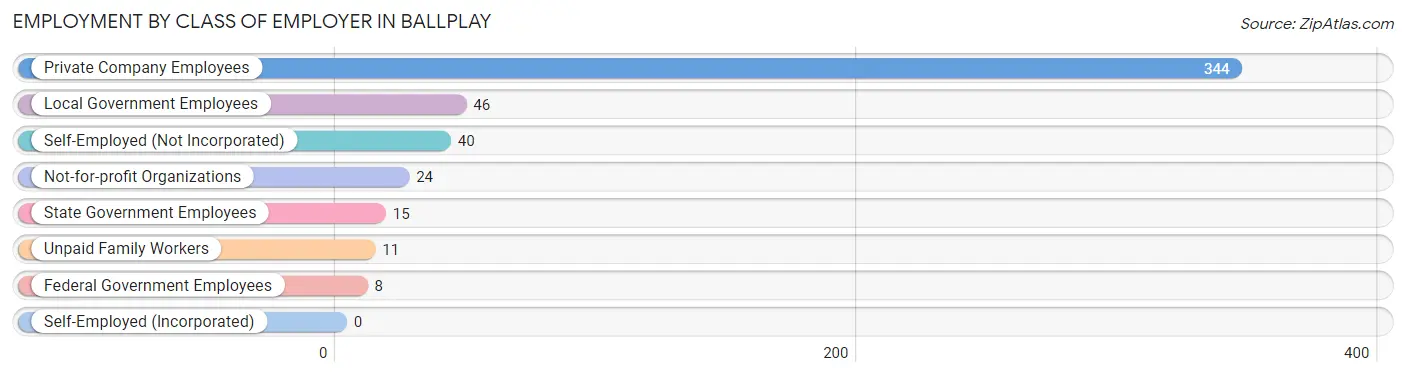
| Employer Class | # Employees | % Employees |
| Private Company Employees | 344 | 70.5% |
| Self-Employed (Incorporated) | 0 | 0.0% |
| Self-Employed (Not Incorporated) | 40 | 8.2% |
| Not-for-profit Organizations | 24 | 4.9% |
| Local Government Employees | 46 | 9.4% |
| State Government Employees | 15 | 3.1% |
| Federal Government Employees | 8 | 1.6% |
| Unpaid Family Workers | 11 | 2.2% |
| Total | 488 | 100.0% |
Employment Status by Age in Ballplay
According to the labor force statistics for Ballplay, out of the total population over 16 years of age (927), 64.5% or 598 individuals are in the labor force, with 12.9% or 77 of them unemployed. The age group with the highest labor force participation rate is 30 to 34 years, with 89.5% or 119 individuals in the labor force. Within the labor force, the 25 to 29 years age range has the highest percentage of unemployed individuals, with 56.5% or 13 of them being unemployed.
| Age Bracket | In Labor Force | Unemployed |
| 16 to 19 Years | 55 (63.2%) | 12 (21.8%) |
| 20 to 24 Years | 31 (64.6%) | 0 (0.0%) |
| 25 to 29 Years | 23 (79.3%) | 13 (56.5%) |
| 30 to 34 Years | 119 (89.5%) | 0 (0.0%) |
| 35 to 44 Years | 162 (81.4%) | 52 (32.1%) |
| 45 to 54 Years | 137 (84.0%) | 0 (0.0%) |
| 55 to 59 Years | 55 (83.3%) | 0 (0.0%) |
| 60 to 64 Years | 9 (31.0%) | 0 (0.0%) |
| 65 to 74 Years | 7 (6.3%) | 0 (0.0%) |
| 75 Years and over | 0 (0.0%) | 0 (0.0%) |
| Total | 598 (64.5%) | 77 (12.9%) |
Employment Status by Educational Attainment in Ballplay
According to labor force statistics for Ballplay, 81.6% of individuals (505) out of the total population between 25 and 64 years of age (619) are in the labor force, with 12.9% or 65 of them being unemployed. The group with the highest labor force participation rate are those with the educational attainment of bachelor's degree or higher, with 100.0% or 89 individuals in the labor force. Within the labor force, individuals with less than high school education have the highest percentage of unemployment, with 52.0% or 52 of them being unemployed.
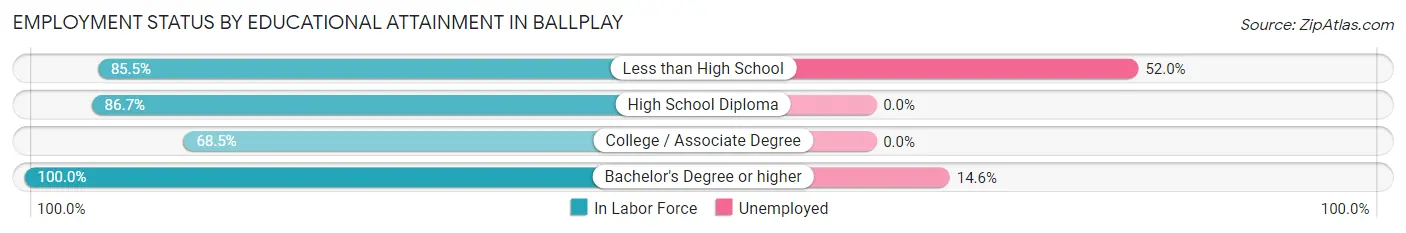
| Educational Attainment | In Labor Force | Unemployed |
| Less than High School | 100 (85.5%) | 61 (52.0%) |
| High School Diploma | 157 (86.7%) | 0 (0.0%) |
| College / Associate Degree | 159 (68.5%) | 0 (0.0%) |
| Bachelor's Degree or higher | 89 (100.0%) | 13 (14.6%) |
| Total | 505 (81.6%) | 80 (12.9%) |
Employment Occupations by Sex in Ballplay
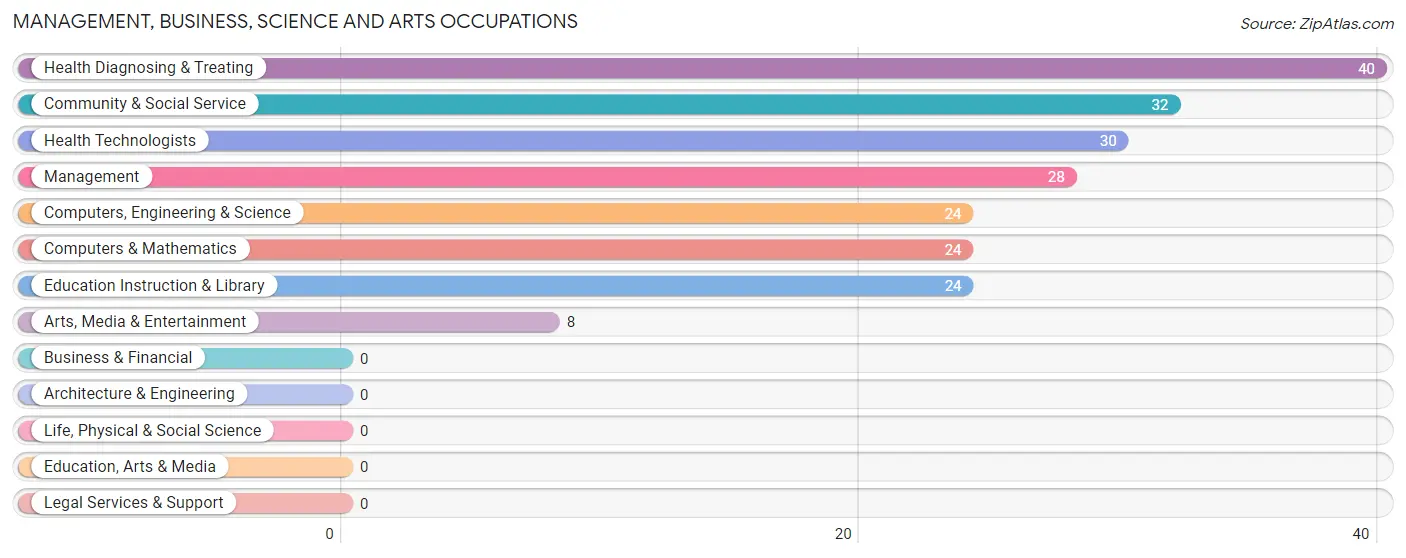
Management, Business, Science and Arts Occupations
The most common Management, Business, Science and Arts occupations in Ballplay are Health Diagnosing & Treating (40 | 7.7%), Community & Social Service (32 | 6.1%), Health Technologists (30 | 5.8%), Management (28 | 5.4%), and Computers, Engineering & Science (24 | 4.6%).
Management, Business, Science and Arts Occupations by Sex
Within the Management, Business, Science and Arts occupations in Ballplay, the most male-oriented occupations are Management (100.0%), Education Instruction & Library (29.2%), and Community & Social Service (21.9%), while the most female-oriented occupations are Computers, Engineering & Science (100.0%), Computers & Mathematics (100.0%), and Arts, Media & Entertainment (100.0%).
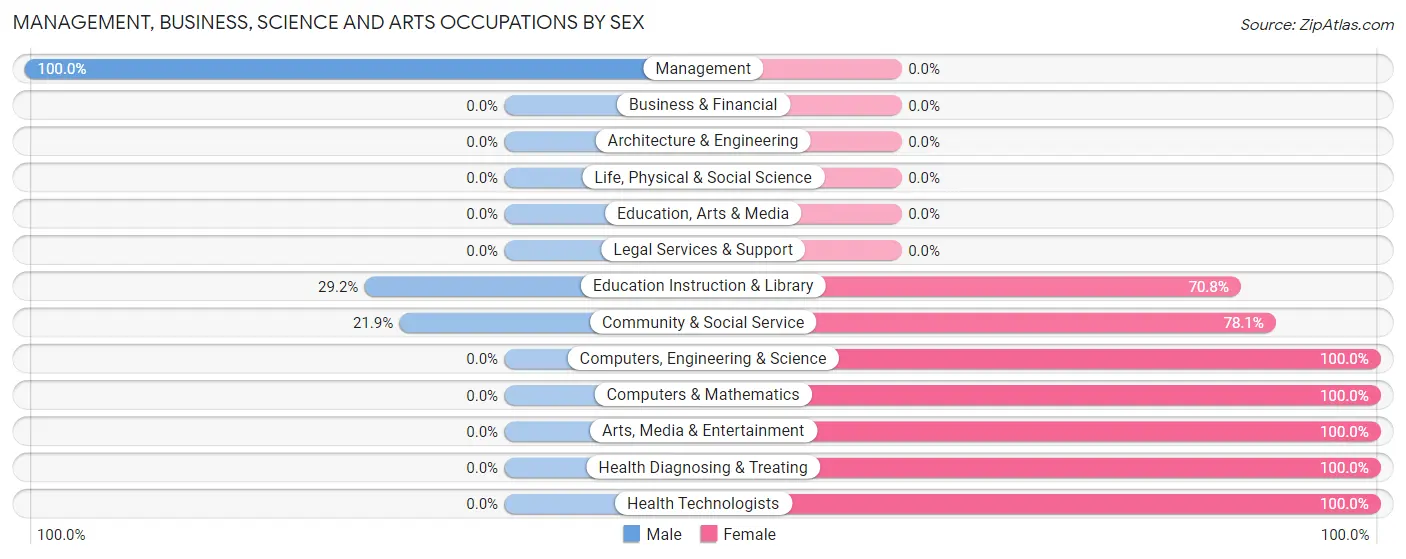
| Occupation | Male | Female |
| Management | 28 (100.0%) | 0 (0.0%) |
| Business & Financial | 0 (0.0%) | 0 (0.0%) |
| Computers, Engineering & Science | 0 (0.0%) | 24 (100.0%) |
| Computers & Mathematics | 0 (0.0%) | 24 (100.0%) |
| Architecture & Engineering | 0 (0.0%) | 0 (0.0%) |
| Life, Physical & Social Science | 0 (0.0%) | 0 (0.0%) |
| Community & Social Service | 7 (21.9%) | 25 (78.1%) |
| Education, Arts & Media | 0 (0.0%) | 0 (0.0%) |
| Legal Services & Support | 0 (0.0%) | 0 (0.0%) |
| Education Instruction & Library | 7 (29.2%) | 17 (70.8%) |
| Arts, Media & Entertainment | 0 (0.0%) | 8 (100.0%) |
| Health Diagnosing & Treating | 0 (0.0%) | 40 (100.0%) |
| Health Technologists | 0 (0.0%) | 30 (100.0%) |
| Total (Category) | 35 (28.2%) | 89 (71.8%) |
| Total (Overall) | 288 (55.3%) | 233 (44.7%) |
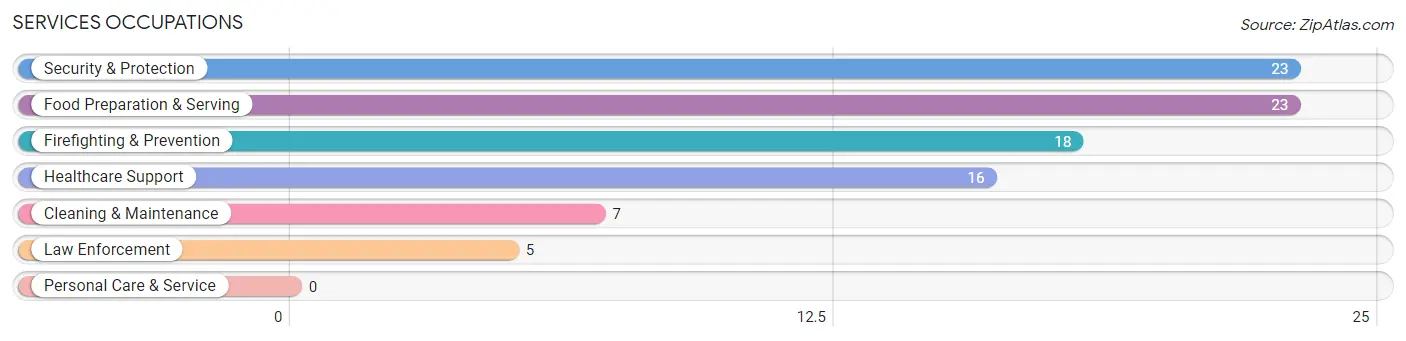
Services Occupations
The most common Services occupations in Ballplay are Security & Protection (23 | 4.4%), Food Preparation & Serving (23 | 4.4%), Firefighting & Prevention (18 | 3.5%), Healthcare Support (16 | 3.1%), and Cleaning & Maintenance (7 | 1.3%).
Services Occupations by Sex
Within the Services occupations in Ballplay, the most male-oriented occupations are Security & Protection (100.0%), Firefighting & Prevention (100.0%), and Law Enforcement (100.0%), while the most female-oriented occupations are Healthcare Support (100.0%), Cleaning & Maintenance (100.0%), and Food Preparation & Serving (56.5%).
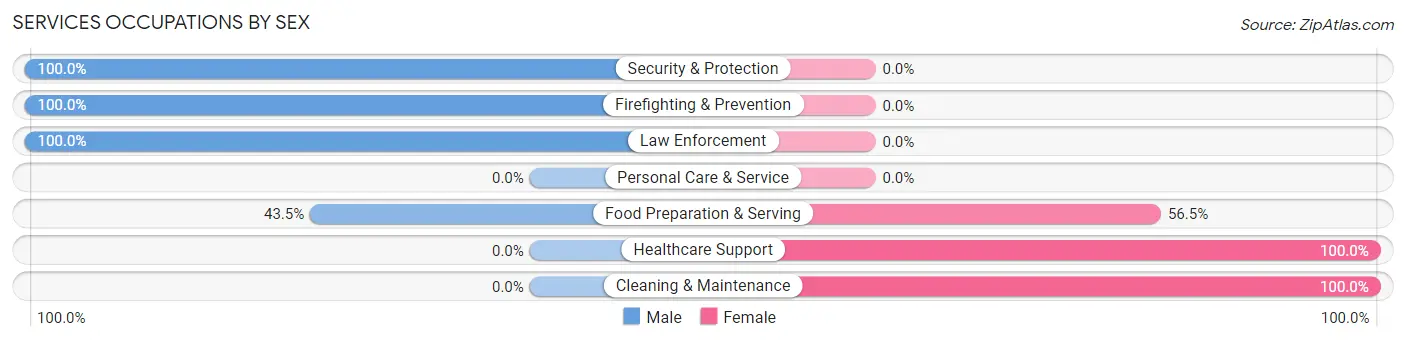
| Occupation | Male | Female |
| Healthcare Support | 0 (0.0%) | 16 (100.0%) |
| Security & Protection | 23 (100.0%) | 0 (0.0%) |
| Firefighting & Prevention | 18 (100.0%) | 0 (0.0%) |
| Law Enforcement | 5 (100.0%) | 0 (0.0%) |
| Food Preparation & Serving | 10 (43.5%) | 13 (56.5%) |
| Cleaning & Maintenance | 0 (0.0%) | 7 (100.0%) |
| Personal Care & Service | 0 (0.0%) | 0 (0.0%) |
| Total (Category) | 33 (47.8%) | 36 (52.2%) |
| Total (Overall) | 288 (55.3%) | 233 (44.7%) |
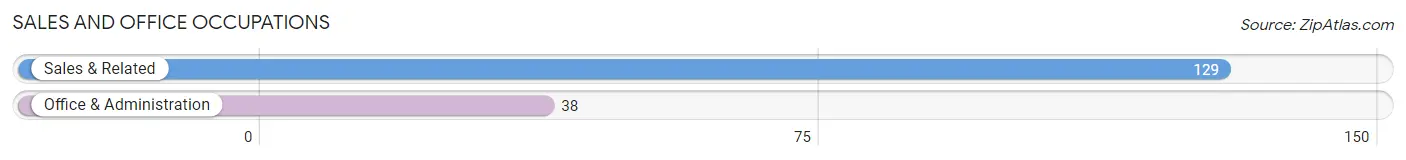
Sales and Office Occupations
The most common Sales and Office occupations in Ballplay are Sales & Related (129 | 24.8%), and Office & Administration (38 | 7.3%).
Sales and Office Occupations by Sex
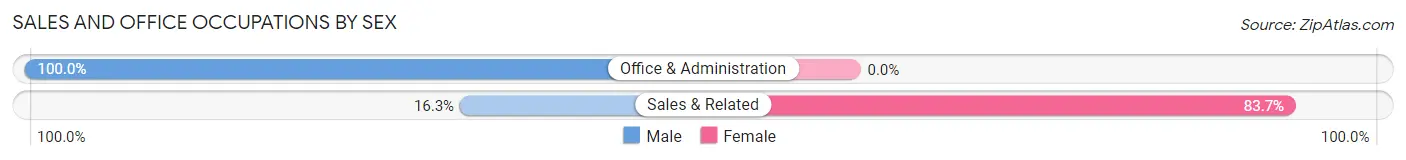
| Occupation | Male | Female |
| Sales & Related | 21 (16.3%) | 108 (83.7%) |
| Office & Administration | 38 (100.0%) | 0 (0.0%) |
| Total (Category) | 59 (35.3%) | 108 (64.7%) |
| Total (Overall) | 288 (55.3%) | 233 (44.7%) |
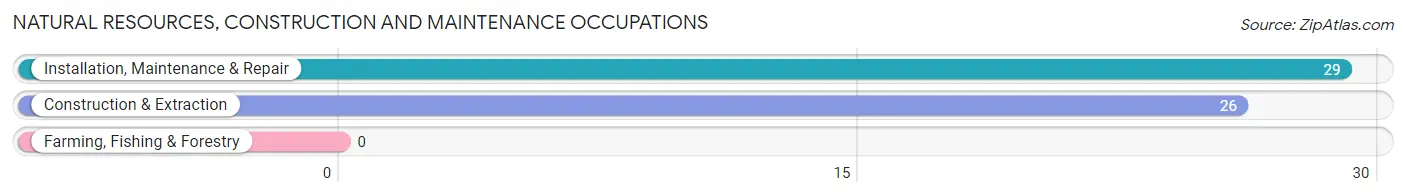
Natural Resources, Construction and Maintenance Occupations
The most common Natural Resources, Construction and Maintenance occupations in Ballplay are Installation, Maintenance & Repair (29 | 5.6%), and Construction & Extraction (26 | 5.0%).
Natural Resources, Construction and Maintenance Occupations by Sex
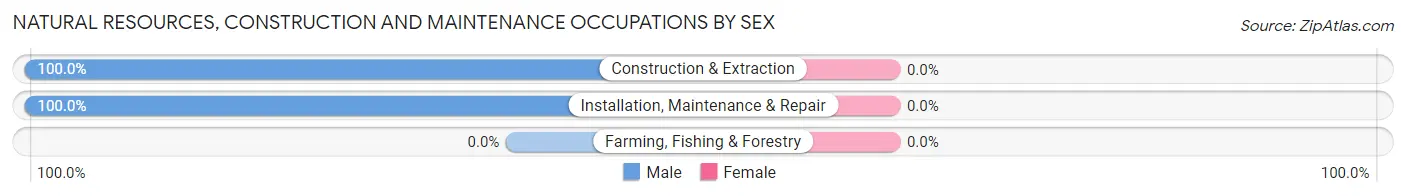
| Occupation | Male | Female |
| Farming, Fishing & Forestry | 0 (0.0%) | 0 (0.0%) |
| Construction & Extraction | 26 (100.0%) | 0 (0.0%) |
| Installation, Maintenance & Repair | 29 (100.0%) | 0 (0.0%) |
| Total (Category) | 55 (100.0%) | 0 (0.0%) |
| Total (Overall) | 288 (55.3%) | 233 (44.7%) |
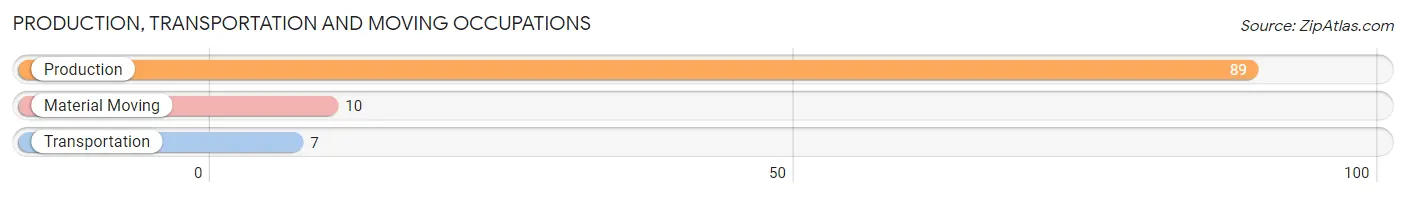
Production, Transportation and Moving Occupations
The most common Production, Transportation and Moving occupations in Ballplay are Production (89 | 17.1%), Material Moving (10 | 1.9%), and Transportation (7 | 1.3%).
Production, Transportation and Moving Occupations by Sex
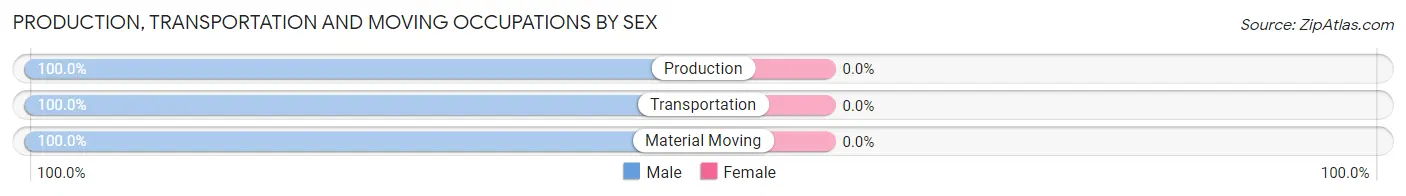
| Occupation | Male | Female |
| Production | 89 (100.0%) | 0 (0.0%) |
| Transportation | 7 (100.0%) | 0 (0.0%) |
| Material Moving | 10 (100.0%) | 0 (0.0%) |
| Total (Category) | 106 (100.0%) | 0 (0.0%) |
| Total (Overall) | 288 (55.3%) | 233 (44.7%) |
Employment Industries by Sex in Ballplay
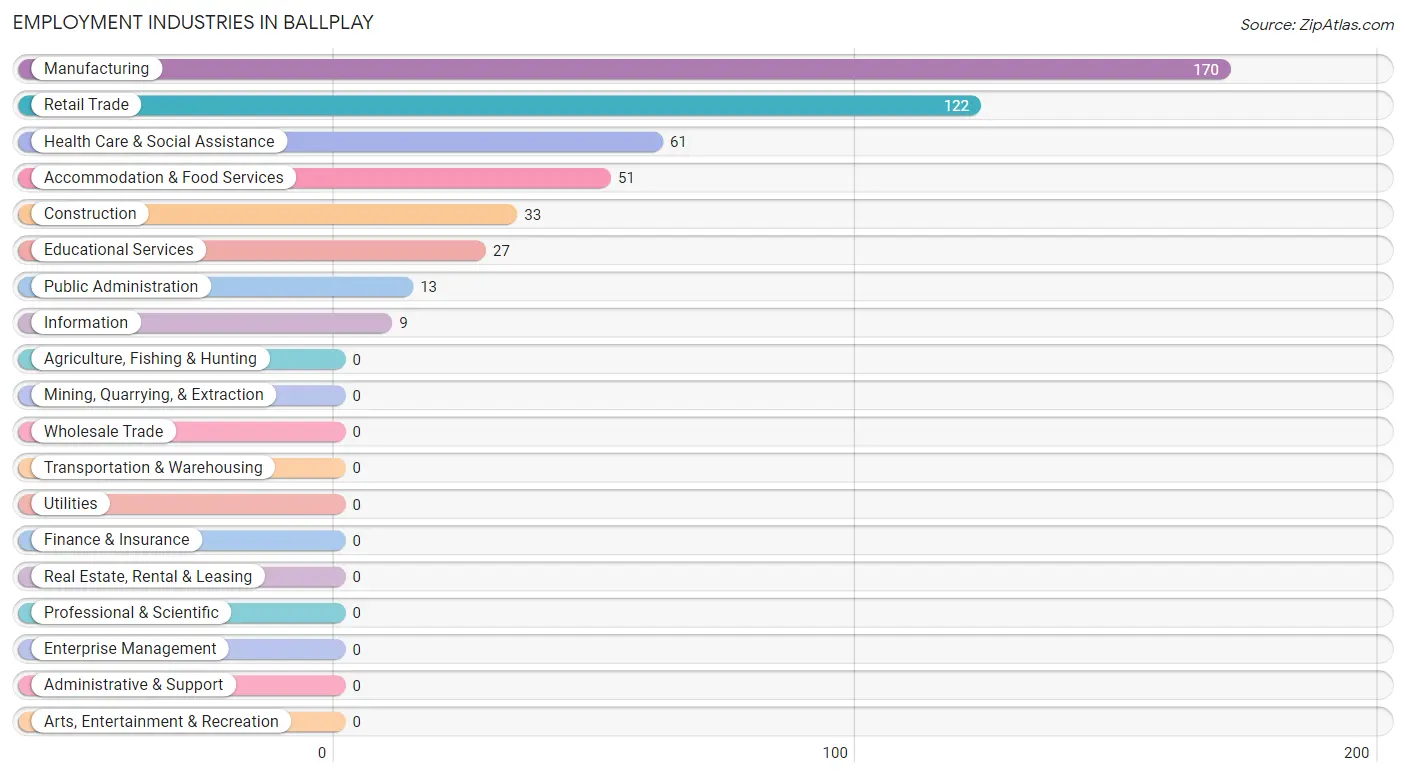
Employment Industries in Ballplay
The major employment industries in Ballplay include Manufacturing (170 | 32.6%), Retail Trade (122 | 23.4%), Health Care & Social Assistance (61 | 11.7%), Accommodation & Food Services (51 | 9.8%), and Construction (33 | 6.3%).
Employment Industries by Sex in Ballplay
The Ballplay industries that see more men than women are Construction (100.0%), Information (100.0%), and Manufacturing (74.1%), whereas the industries that tend to have a higher number of women are Educational Services (74.1%), Health Care & Social Assistance (70.5%), and Public Administration (61.5%).
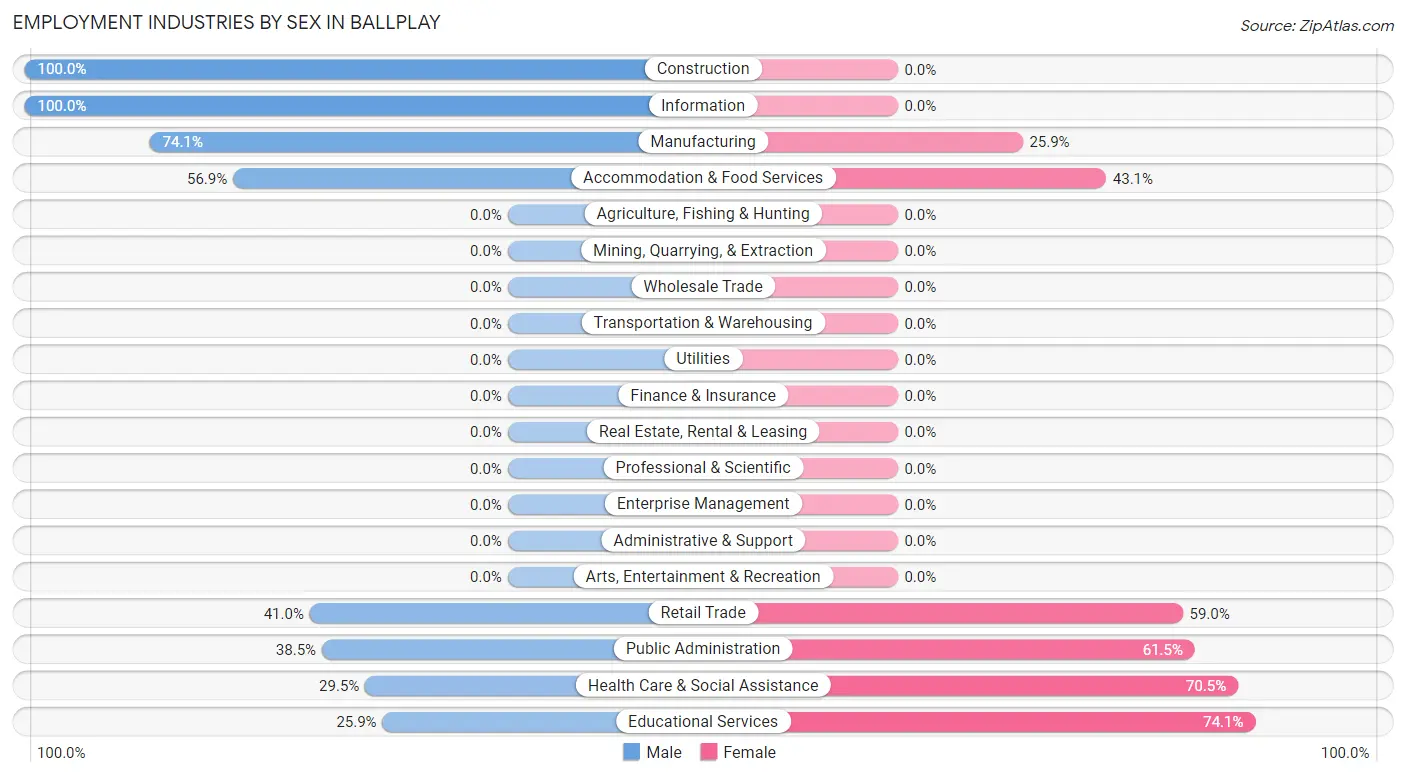
| Industry | Male | Female |
| Agriculture, Fishing & Hunting | 0 (0.0%) | 0 (0.0%) |
| Mining, Quarrying, & Extraction | 0 (0.0%) | 0 (0.0%) |
| Construction | 33 (100.0%) | 0 (0.0%) |
| Manufacturing | 126 (74.1%) | 44 (25.9%) |
| Wholesale Trade | 0 (0.0%) | 0 (0.0%) |
| Retail Trade | 50 (41.0%) | 72 (59.0%) |
| Transportation & Warehousing | 0 (0.0%) | 0 (0.0%) |
| Utilities | 0 (0.0%) | 0 (0.0%) |
| Information | 9 (100.0%) | 0 (0.0%) |
| Finance & Insurance | 0 (0.0%) | 0 (0.0%) |
| Real Estate, Rental & Leasing | 0 (0.0%) | 0 (0.0%) |
| Professional & Scientific | 0 (0.0%) | 0 (0.0%) |
| Enterprise Management | 0 (0.0%) | 0 (0.0%) |
| Administrative & Support | 0 (0.0%) | 0 (0.0%) |
| Educational Services | 7 (25.9%) | 20 (74.1%) |
| Health Care & Social Assistance | 18 (29.5%) | 43 (70.5%) |
| Arts, Entertainment & Recreation | 0 (0.0%) | 0 (0.0%) |
| Accommodation & Food Services | 29 (56.9%) | 22 (43.1%) |
| Public Administration | 5 (38.5%) | 8 (61.5%) |
| Total | 288 (55.3%) | 233 (44.7%) |
Education in Ballplay
School Enrollment in Ballplay
The most common levels of schooling among the 290 students in Ballplay are middle school (96 | 33.1%), high school (92 | 31.7%), and elementary school (43 | 14.8%).
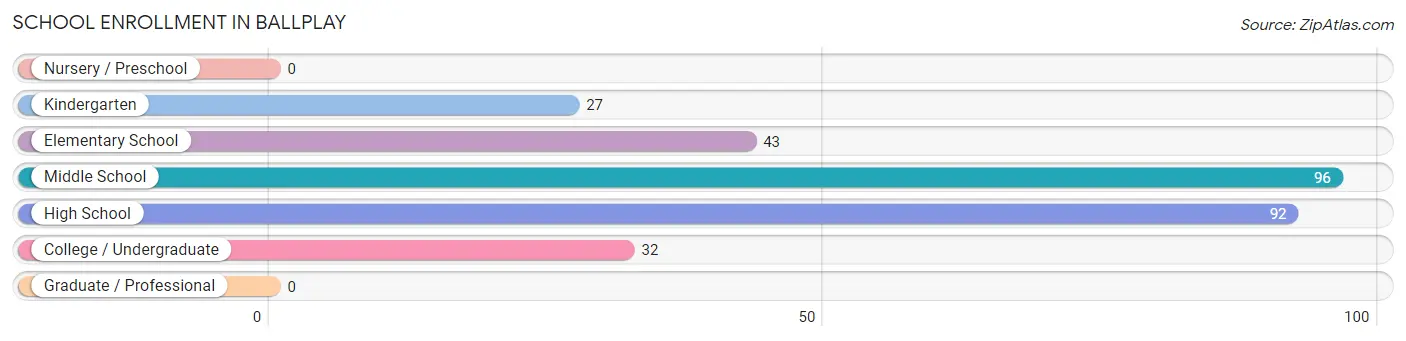
| School Level | # Students | % Students |
| Nursery / Preschool | 0 | 0.0% |
| Kindergarten | 27 | 9.3% |
| Elementary School | 43 | 14.8% |
| Middle School | 96 | 33.1% |
| High School | 92 | 31.7% |
| College / Undergraduate | 32 | 11.0% |
| Graduate / Professional | 0 | 0.0% |
| Total | 290 | 100.0% |
School Enrollment by Age by Funding Source in Ballplay
Out of a total of 290 students who are enrolled in schools in Ballplay, 29 (10.0%) attend a private institution, while the remaining 261 (90.0%) are enrolled in public schools. The age group of 5 to 9 year old has the highest likelihood of being enrolled in private schools, with 21 (38.2% in the age bracket) enrolled. Conversely, the age group of 15 to 17 year olds has the lowest likelihood of being enrolled in a private school, with 58 (100.0% in the age bracket) attending a public institution.
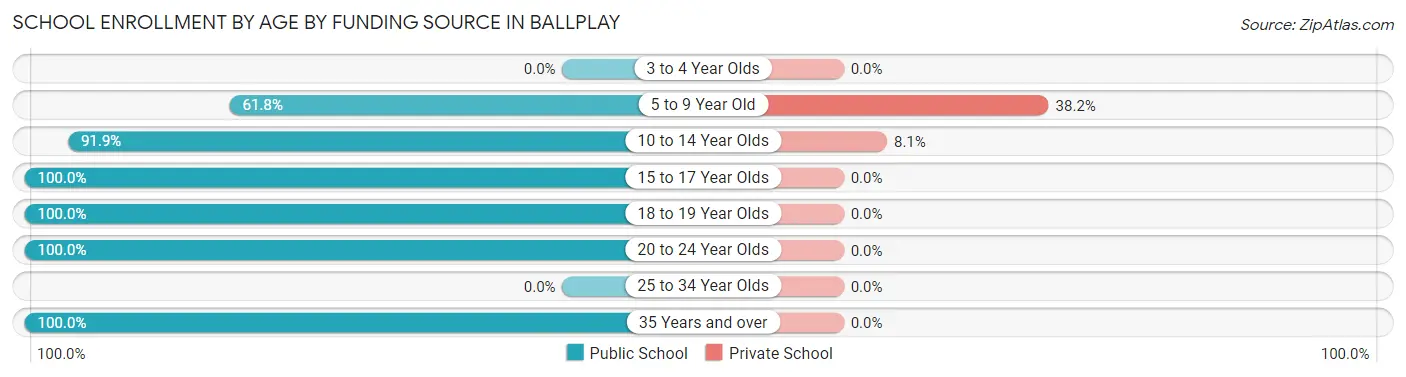
| Age Bracket | Public School | Private School |
| 3 to 4 Year Olds | 0 (0.0%) | 0 (0.0%) |
| 5 to 9 Year Old | 34 (61.8%) | 21 (38.2%) |
| 10 to 14 Year Olds | 91 (91.9%) | 8 (8.1%) |
| 15 to 17 Year Olds | 58 (100.0%) | 0 (0.0%) |
| 18 to 19 Year Olds | 54 (100.0%) | 0 (0.0%) |
| 20 to 24 Year Olds | 13 (100.0%) | 0 (0.0%) |
| 25 to 34 Year Olds | 0 (0.0%) | 0 (0.0%) |
| 35 Years and over | 11 (100.0%) | 0 (0.0%) |
| Total | 261 (90.0%) | 29 (10.0%) |
Educational Attainment by Field of Study in Ballplay
Business (28 | 31.5%), education (24 | 27.0%), science & technology (17 | 19.1%), engineering (13 | 14.6%), and bio, nature & agricultural (7 | 7.9%) are the most common fields of study among 89 individuals in Ballplay who have obtained a bachelor's degree or higher.
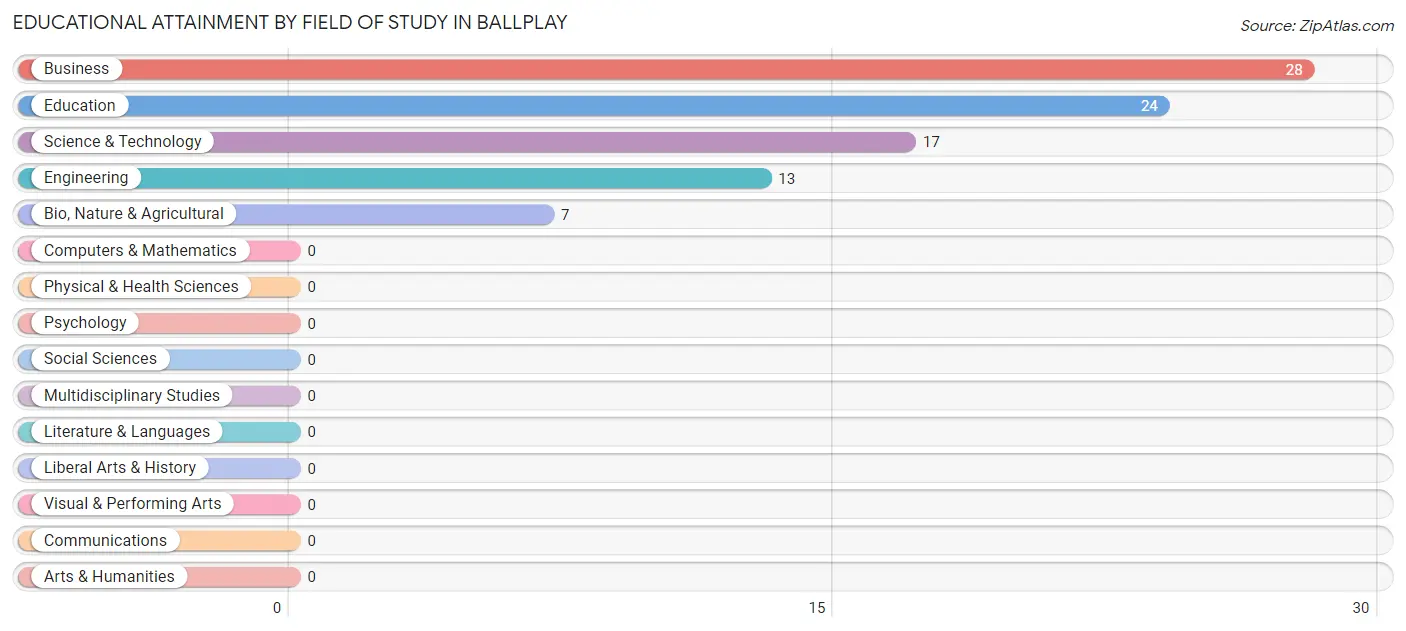
| Field of Study | # Graduates | % Graduates |
| Computers & Mathematics | 0 | 0.0% |
| Bio, Nature & Agricultural | 7 | 7.9% |
| Physical & Health Sciences | 0 | 0.0% |
| Psychology | 0 | 0.0% |
| Social Sciences | 0 | 0.0% |
| Engineering | 13 | 14.6% |
| Multidisciplinary Studies | 0 | 0.0% |
| Science & Technology | 17 | 19.1% |
| Business | 28 | 31.5% |
| Education | 24 | 27.0% |
| Literature & Languages | 0 | 0.0% |
| Liberal Arts & History | 0 | 0.0% |
| Visual & Performing Arts | 0 | 0.0% |
| Communications | 0 | 0.0% |
| Arts & Humanities | 0 | 0.0% |
| Total | 89 | 100.0% |
Transportation & Commute in Ballplay
Vehicle Availability by Sex in Ballplay
The most prevalent vehicle ownership categories in Ballplay are males with 3 vehicles (142, accounting for 52.0%) and females with 3 vehicles (93, making up 66.0%).
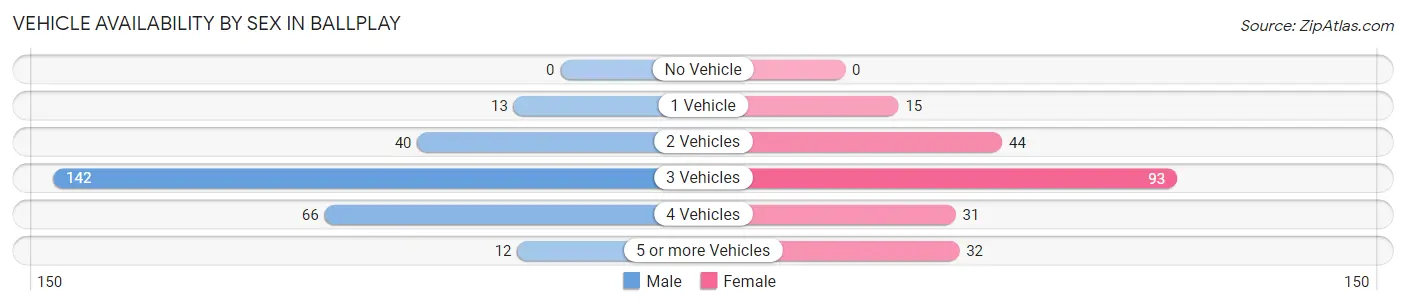
| Vehicles Available | Male | Female |
| No Vehicle | 0 (0.0%) | 0 (0.0%) |
| 1 Vehicle | 13 (4.8%) | 15 (7.0%) |
| 2 Vehicles | 40 (14.6%) | 44 (20.5%) |
| 3 Vehicles | 142 (52.0%) | 93 (43.3%) |
| 4 Vehicles | 66 (24.2%) | 31 (14.4%) |
| 5 or more Vehicles | 12 (4.4%) | 32 (14.9%) |
| Total | 273 (100.0%) | 215 (100.0%) |
Commute Time in Ballplay
The most frequently occuring commute durations in Ballplay are 60 to 89 minutes (106 commuters, 22.2%), 30 to 34 minutes (104 commuters, 21.8%), and 20 to 24 minutes (83 commuters, 17.4%).
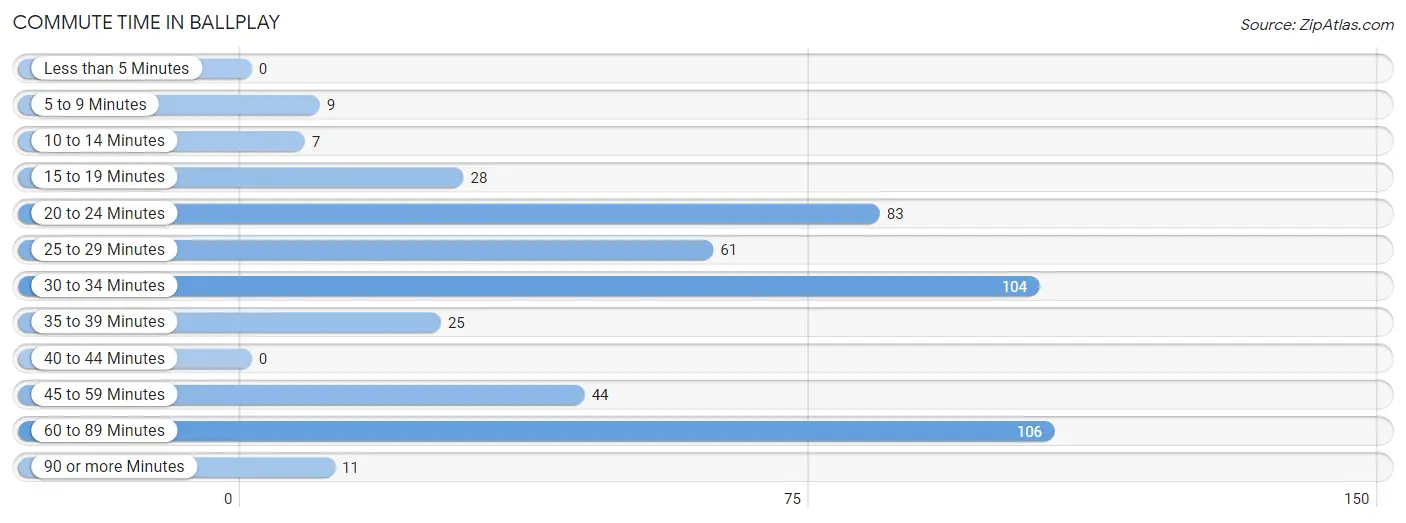
| Commute Time | # Commuters | % Commuters |
| Less than 5 Minutes | 0 | 0.0% |
| 5 to 9 Minutes | 9 | 1.9% |
| 10 to 14 Minutes | 7 | 1.5% |
| 15 to 19 Minutes | 28 | 5.9% |
| 20 to 24 Minutes | 83 | 17.4% |
| 25 to 29 Minutes | 61 | 12.8% |
| 30 to 34 Minutes | 104 | 21.8% |
| 35 to 39 Minutes | 25 | 5.2% |
| 40 to 44 Minutes | 0 | 0.0% |
| 45 to 59 Minutes | 44 | 9.2% |
| 60 to 89 Minutes | 106 | 22.2% |
| 90 or more Minutes | 11 | 2.3% |
Commute Time by Sex in Ballplay
The most common commute times in Ballplay are 20 to 24 minutes (63 commuters, 23.9%) for males and 60 to 89 minutes (70 commuters, 32.6%) for females.
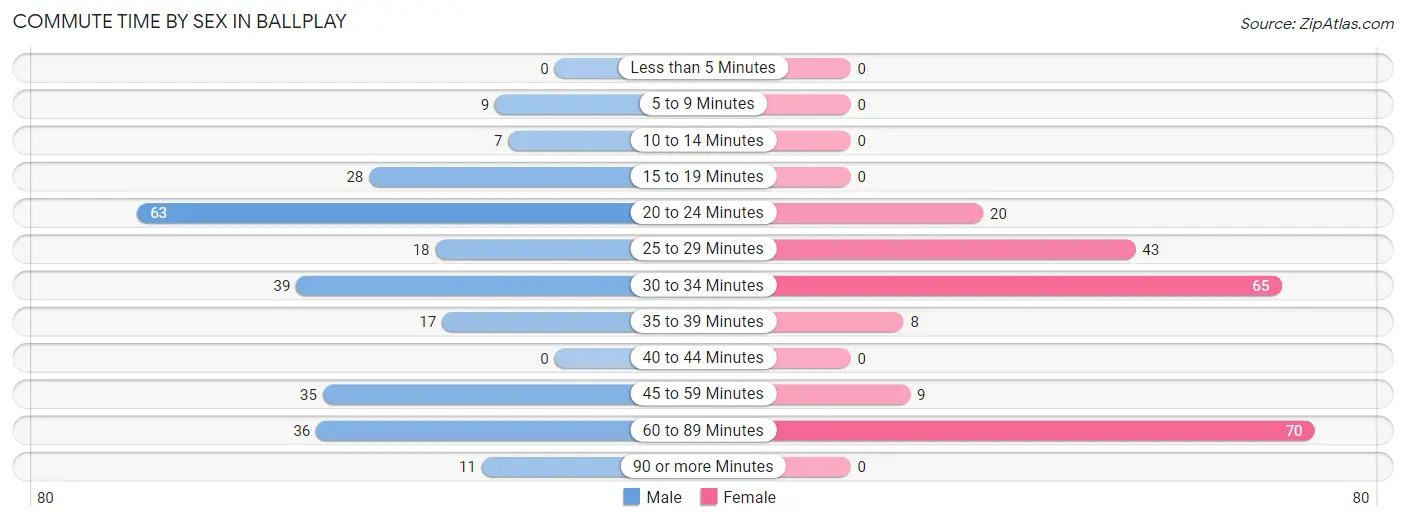
| Commute Time | Male | Female |
| Less than 5 Minutes | 0 (0.0%) | 0 (0.0%) |
| 5 to 9 Minutes | 9 (3.4%) | 0 (0.0%) |
| 10 to 14 Minutes | 7 (2.7%) | 0 (0.0%) |
| 15 to 19 Minutes | 28 (10.6%) | 0 (0.0%) |
| 20 to 24 Minutes | 63 (23.9%) | 20 (9.3%) |
| 25 to 29 Minutes | 18 (6.8%) | 43 (20.0%) |
| 30 to 34 Minutes | 39 (14.8%) | 65 (30.2%) |
| 35 to 39 Minutes | 17 (6.5%) | 8 (3.7%) |
| 40 to 44 Minutes | 0 (0.0%) | 0 (0.0%) |
| 45 to 59 Minutes | 35 (13.3%) | 9 (4.2%) |
| 60 to 89 Minutes | 36 (13.7%) | 70 (32.6%) |
| 90 or more Minutes | 11 (4.2%) | 0 (0.0%) |
Time of Departure to Work by Sex in Ballplay
The most frequent times of departure to work in Ballplay are 5:00 AM to 5:29 AM (74, 28.1%) for males and 7:00 AM to 7:29 AM (64, 29.8%) for females.
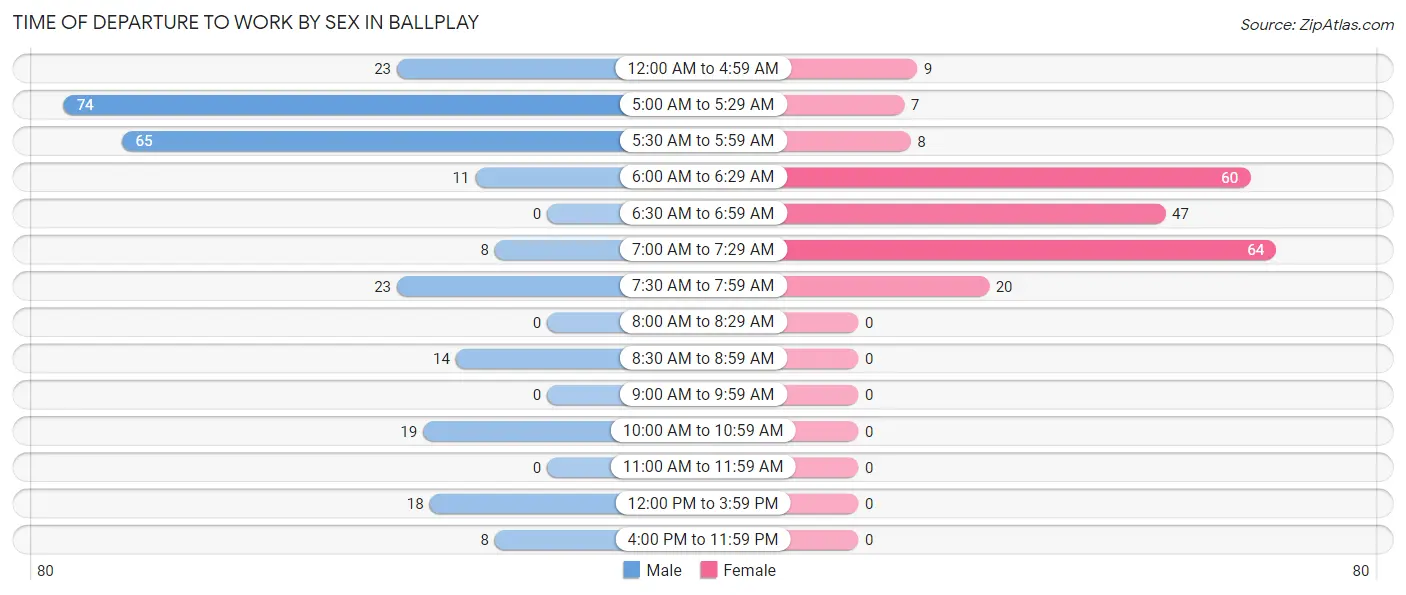
| Time of Departure | Male | Female |
| 12:00 AM to 4:59 AM | 23 (8.7%) | 9 (4.2%) |
| 5:00 AM to 5:29 AM | 74 (28.1%) | 7 (3.3%) |
| 5:30 AM to 5:59 AM | 65 (24.7%) | 8 (3.7%) |
| 6:00 AM to 6:29 AM | 11 (4.2%) | 60 (27.9%) |
| 6:30 AM to 6:59 AM | 0 (0.0%) | 47 (21.9%) |
| 7:00 AM to 7:29 AM | 8 (3.0%) | 64 (29.8%) |
| 7:30 AM to 7:59 AM | 23 (8.7%) | 20 (9.3%) |
| 8:00 AM to 8:29 AM | 0 (0.0%) | 0 (0.0%) |
| 8:30 AM to 8:59 AM | 14 (5.3%) | 0 (0.0%) |
| 9:00 AM to 9:59 AM | 0 (0.0%) | 0 (0.0%) |
| 10:00 AM to 10:59 AM | 19 (7.2%) | 0 (0.0%) |
| 11:00 AM to 11:59 AM | 0 (0.0%) | 0 (0.0%) |
| 12:00 PM to 3:59 PM | 18 (6.8%) | 0 (0.0%) |
| 4:00 PM to 11:59 PM | 8 (3.0%) | 0 (0.0%) |
| Total | 263 (100.0%) | 215 (100.0%) |
Housing Occupancy in Ballplay
Occupancy by Ownership in Ballplay
Of the total 411 dwellings in Ballplay, owner-occupied units account for 390 (94.9%), while renter-occupied units make up 21 (5.1%).
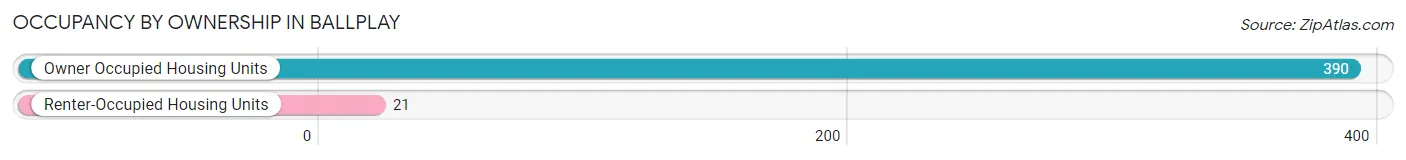
| Occupancy | # Housing Units | % Housing Units |
| Owner Occupied Housing Units | 390 | 94.9% |
| Renter-Occupied Housing Units | 21 | 5.1% |
| Total Occupied Housing Units | 411 | 100.0% |
Occupancy by Household Size in Ballplay
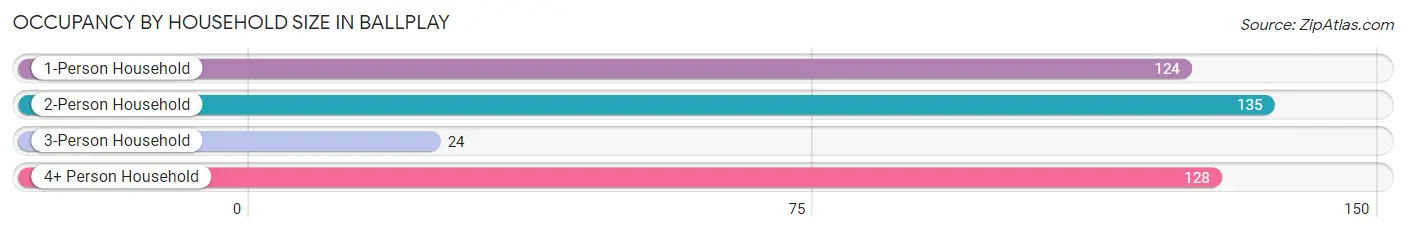
| Household Size | # Housing Units | % Housing Units |
| 1-Person Household | 124 | 30.2% |
| 2-Person Household | 135 | 32.9% |
| 3-Person Household | 24 | 5.8% |
| 4+ Person Household | 128 | 31.1% |
| Total Housing Units | 411 | 100.0% |
Occupancy by Ownership by Household Size in Ballplay
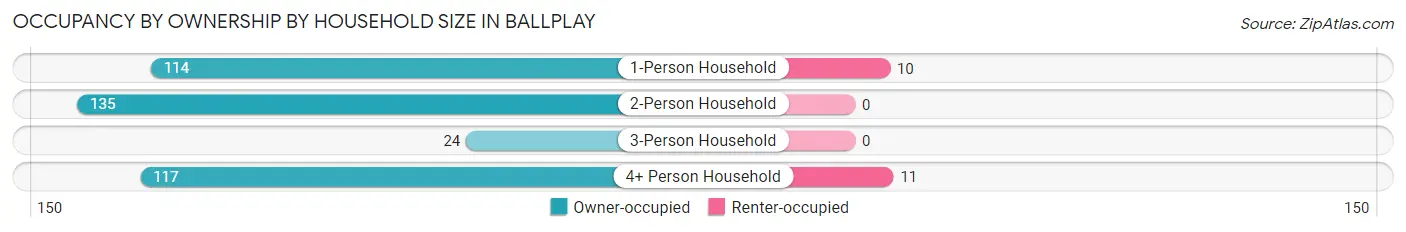
| Household Size | Owner-occupied | Renter-occupied |
| 1-Person Household | 114 (91.9%) | 10 (8.1%) |
| 2-Person Household | 135 (100.0%) | 0 (0.0%) |
| 3-Person Household | 24 (100.0%) | 0 (0.0%) |
| 4+ Person Household | 117 (91.4%) | 11 (8.6%) |
| Total Housing Units | 390 (94.9%) | 21 (5.1%) |
Occupancy by Educational Attainment in Ballplay
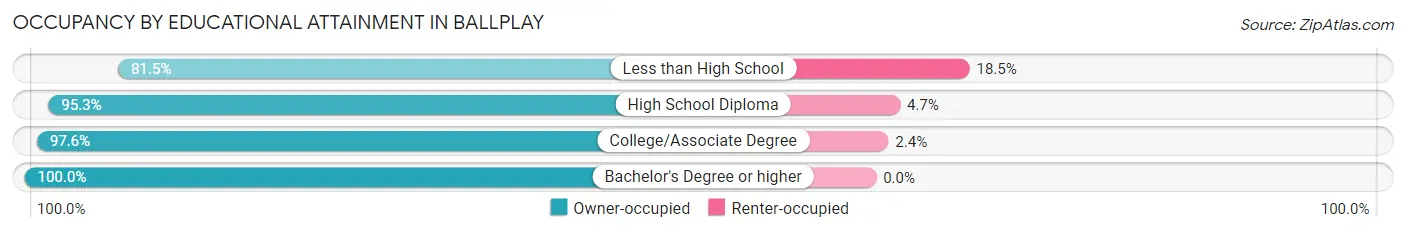
| Household Size | Owner-occupied | Renter-occupied |
| Less than High School | 44 (81.5%) | 10 (18.5%) |
| High School Diploma | 121 (95.3%) | 6 (4.7%) |
| College/Associate Degree | 201 (97.6%) | 5 (2.4%) |
| Bachelor's Degree or higher | 24 (100.0%) | 0 (0.0%) |
Occupancy by Age of Householder in Ballplay
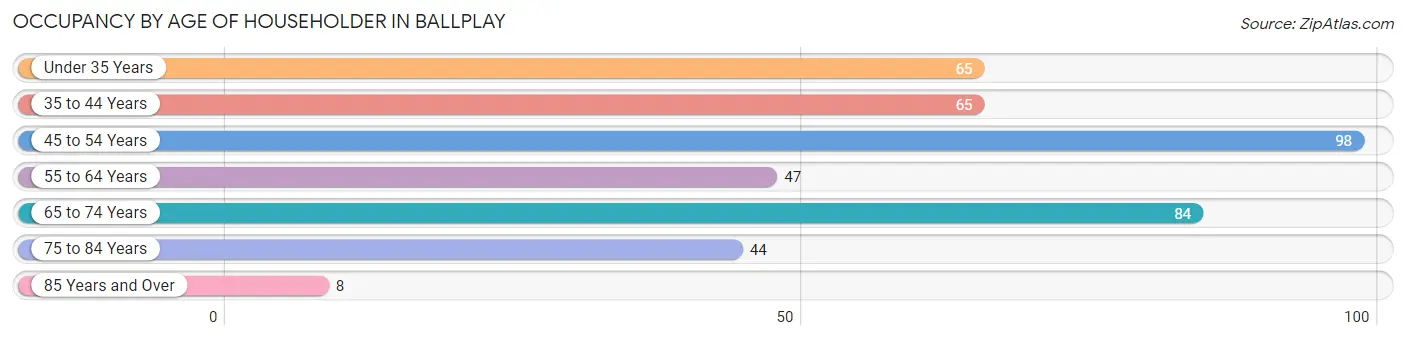
| Age Bracket | # Households | % Households |
| Under 35 Years | 65 | 15.8% |
| 35 to 44 Years | 65 | 15.8% |
| 45 to 54 Years | 98 | 23.8% |
| 55 to 64 Years | 47 | 11.4% |
| 65 to 74 Years | 84 | 20.4% |
| 75 to 84 Years | 44 | 10.7% |
| 85 Years and Over | 8 | 1.9% |
| Total | 411 | 100.0% |
Housing Finances in Ballplay
Median Income by Occupancy in Ballplay
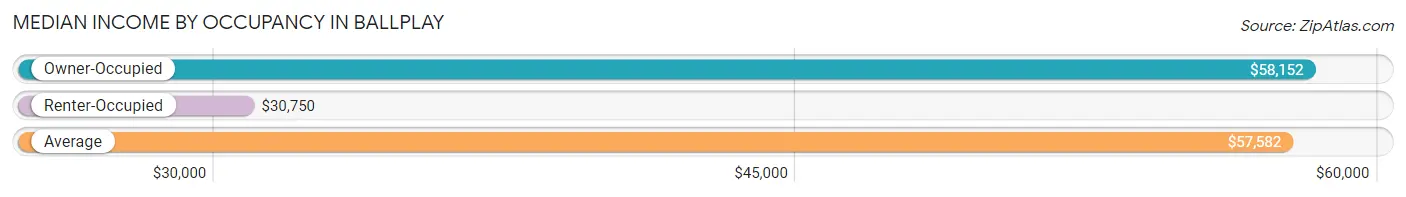
| Occupancy Type | # Households | Median Income |
| Owner-Occupied | 390 (94.9%) | $58,152 |
| Renter-Occupied | 21 (5.1%) | $30,750 |
| Average | 411 (100.0%) | $57,582 |
Occupancy by Householder Income Bracket in Ballplay
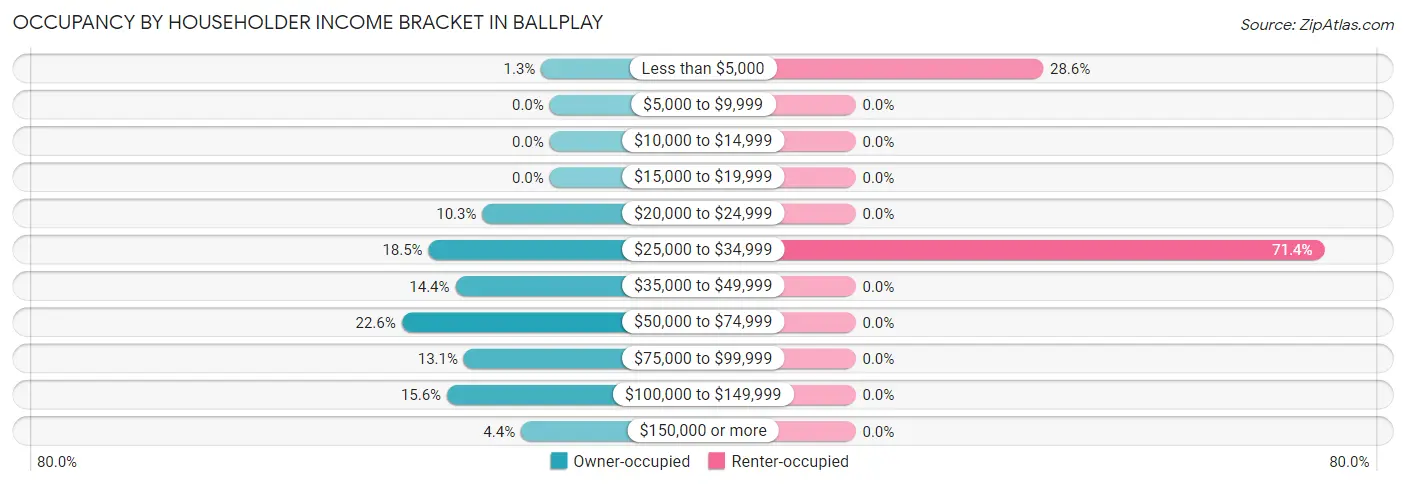
| Income Bracket | Owner-occupied | Renter-occupied |
| Less than $5,000 | 5 (1.3%) | 6 (28.6%) |
| $5,000 to $9,999 | 0 (0.0%) | 0 (0.0%) |
| $10,000 to $14,999 | 0 (0.0%) | 0 (0.0%) |
| $15,000 to $19,999 | 0 (0.0%) | 0 (0.0%) |
| $20,000 to $24,999 | 40 (10.3%) | 0 (0.0%) |
| $25,000 to $34,999 | 72 (18.5%) | 15 (71.4%) |
| $35,000 to $49,999 | 56 (14.4%) | 0 (0.0%) |
| $50,000 to $74,999 | 88 (22.6%) | 0 (0.0%) |
| $75,000 to $99,999 | 51 (13.1%) | 0 (0.0%) |
| $100,000 to $149,999 | 61 (15.6%) | 0 (0.0%) |
| $150,000 or more | 17 (4.4%) | 0 (0.0%) |
| Total | 390 (100.0%) | 21 (100.0%) |
Monthly Housing Cost Tiers in Ballplay
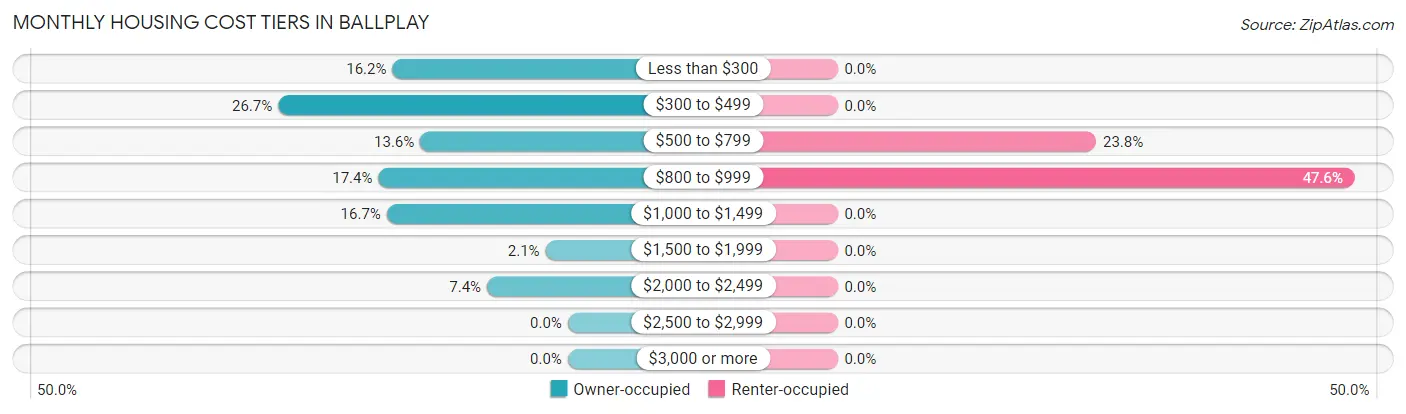
| Monthly Cost | Owner-occupied | Renter-occupied |
| Less than $300 | 63 (16.2%) | 0 (0.0%) |
| $300 to $499 | 104 (26.7%) | 0 (0.0%) |
| $500 to $799 | 53 (13.6%) | 5 (23.8%) |
| $800 to $999 | 68 (17.4%) | 10 (47.6%) |
| $1,000 to $1,499 | 65 (16.7%) | 0 (0.0%) |
| $1,500 to $1,999 | 8 (2.1%) | 0 (0.0%) |
| $2,000 to $2,499 | 29 (7.4%) | 0 (0.0%) |
| $2,500 to $2,999 | 0 (0.0%) | 0 (0.0%) |
| $3,000 or more | 0 (0.0%) | 0 (0.0%) |
| Total | 390 (100.0%) | 21 (100.0%) |
Physical Housing Characteristics in Ballplay
Housing Structures in Ballplay
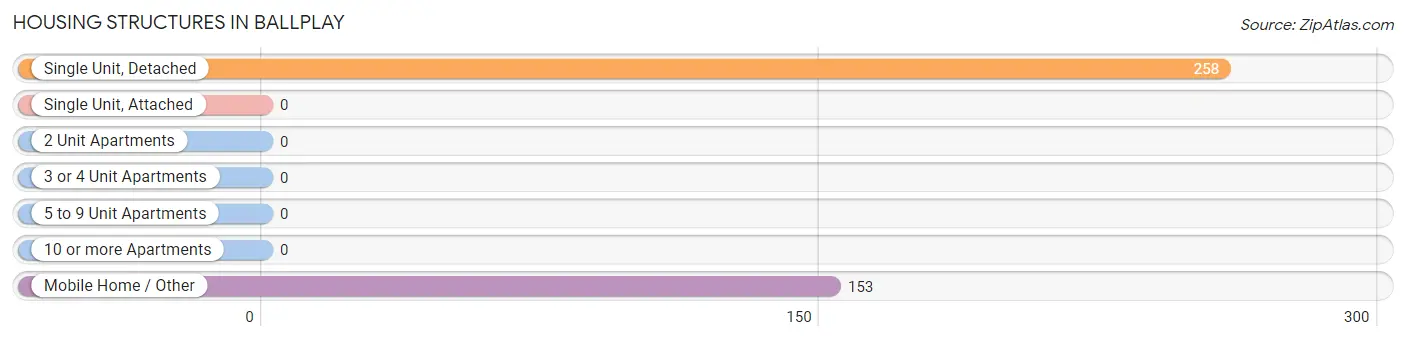
| Structure Type | # Housing Units | % Housing Units |
| Single Unit, Detached | 258 | 62.8% |
| Single Unit, Attached | 0 | 0.0% |
| 2 Unit Apartments | 0 | 0.0% |
| 3 or 4 Unit Apartments | 0 | 0.0% |
| 5 to 9 Unit Apartments | 0 | 0.0% |
| 10 or more Apartments | 0 | 0.0% |
| Mobile Home / Other | 153 | 37.2% |
| Total | 411 | 100.0% |
Housing Structures by Occupancy in Ballplay
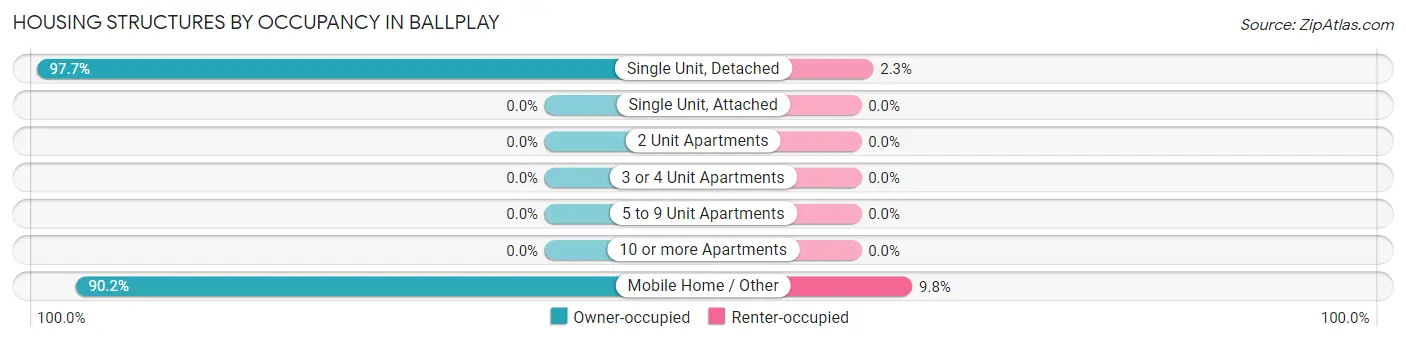
| Structure Type | Owner-occupied | Renter-occupied |
| Single Unit, Detached | 252 (97.7%) | 6 (2.3%) |
| Single Unit, Attached | 0 (0.0%) | 0 (0.0%) |
| 2 Unit Apartments | 0 (0.0%) | 0 (0.0%) |
| 3 or 4 Unit Apartments | 0 (0.0%) | 0 (0.0%) |
| 5 to 9 Unit Apartments | 0 (0.0%) | 0 (0.0%) |
| 10 or more Apartments | 0 (0.0%) | 0 (0.0%) |
| Mobile Home / Other | 138 (90.2%) | 15 (9.8%) |
| Total | 390 (94.9%) | 21 (5.1%) |
Housing Structures by Number of Rooms in Ballplay
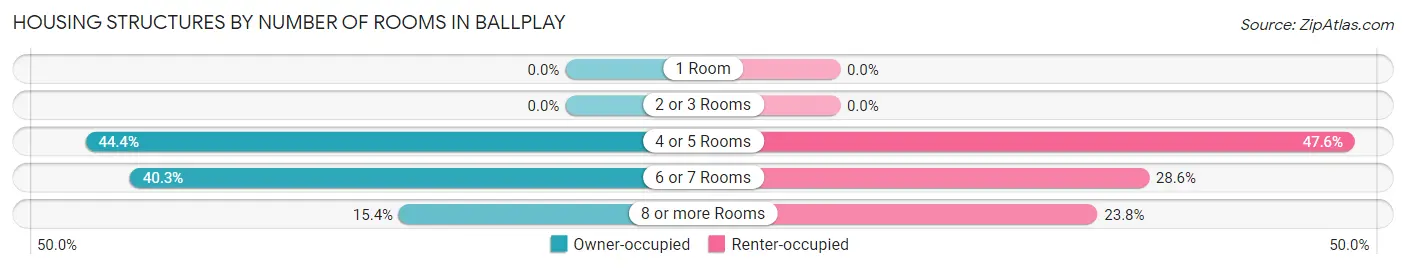
| Number of Rooms | Owner-occupied | Renter-occupied |
| 1 Room | 0 (0.0%) | 0 (0.0%) |
| 2 or 3 Rooms | 0 (0.0%) | 0 (0.0%) |
| 4 or 5 Rooms | 173 (44.4%) | 10 (47.6%) |
| 6 or 7 Rooms | 157 (40.3%) | 6 (28.6%) |
| 8 or more Rooms | 60 (15.4%) | 5 (23.8%) |
| Total | 390 (100.0%) | 21 (100.0%) |
Housing Structure by Heating Type in Ballplay
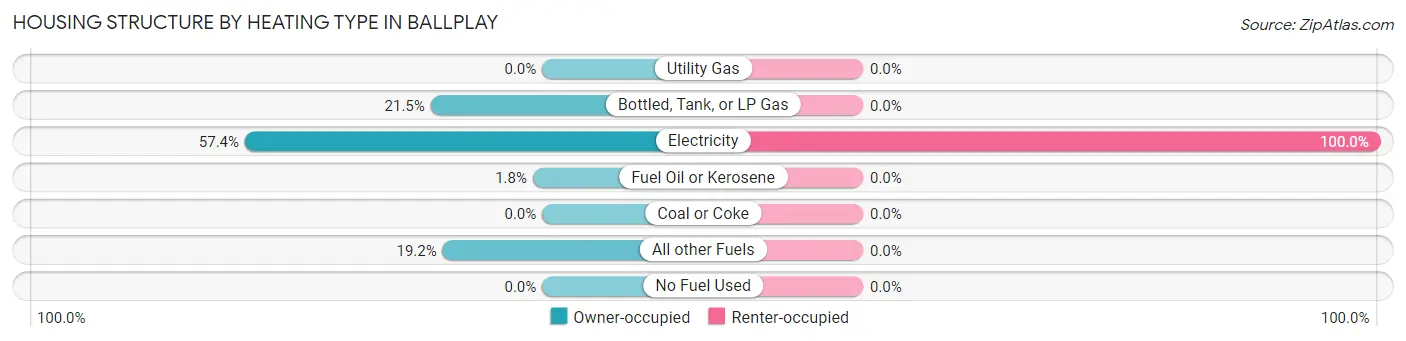
| Heating Type | Owner-occupied | Renter-occupied |
| Utility Gas | 0 (0.0%) | 0 (0.0%) |
| Bottled, Tank, or LP Gas | 84 (21.5%) | 0 (0.0%) |
| Electricity | 224 (57.4%) | 21 (100.0%) |
| Fuel Oil or Kerosene | 7 (1.8%) | 0 (0.0%) |
| Coal or Coke | 0 (0.0%) | 0 (0.0%) |
| All other Fuels | 75 (19.2%) | 0 (0.0%) |
| No Fuel Used | 0 (0.0%) | 0 (0.0%) |
| Total | 390 (100.0%) | 21 (100.0%) |
Household Vehicle Usage in Ballplay
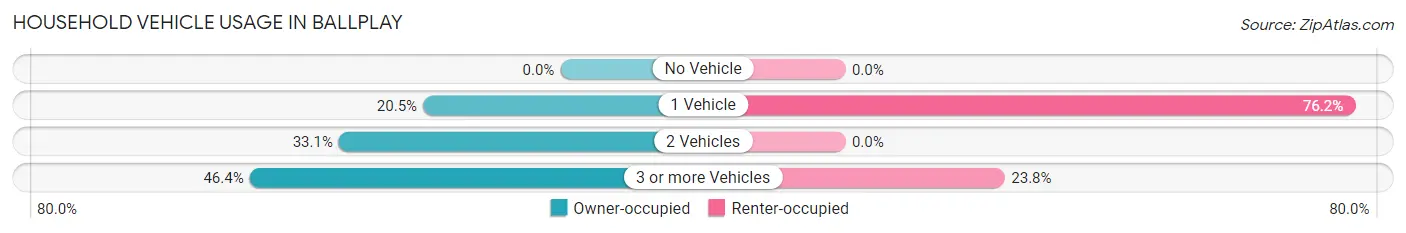
| Vehicles per Household | Owner-occupied | Renter-occupied |
| No Vehicle | 0 (0.0%) | 0 (0.0%) |
| 1 Vehicle | 80 (20.5%) | 16 (76.2%) |
| 2 Vehicles | 129 (33.1%) | 0 (0.0%) |
| 3 or more Vehicles | 181 (46.4%) | 5 (23.8%) |
| Total | 390 (100.0%) | 21 (100.0%) |
Real Estate & Mortgages in Ballplay
Real Estate and Mortgage Overview in Ballplay
| Characteristic | Without Mortgage | With Mortgage |
| Housing Units | 201 | 189 |
| Median Property Value | $143,300 | $116,200 |
| Median Household Income | $45,673 | $9 |
| Monthly Housing Costs | $397 | $0 |
| Real Estate Taxes | $373 | $18 |
Property Value by Mortgage Status in Ballplay
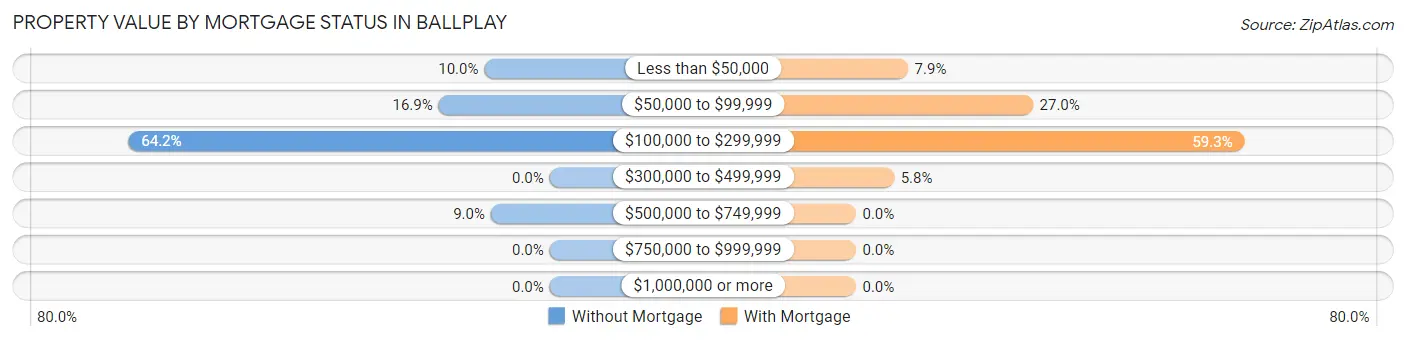
| Property Value | Without Mortgage | With Mortgage |
| Less than $50,000 | 20 (10.0%) | 15 (7.9%) |
| $50,000 to $99,999 | 34 (16.9%) | 51 (27.0%) |
| $100,000 to $299,999 | 129 (64.2%) | 112 (59.3%) |
| $300,000 to $499,999 | 0 (0.0%) | 11 (5.8%) |
| $500,000 to $749,999 | 18 (9.0%) | 0 (0.0%) |
| $750,000 to $999,999 | 0 (0.0%) | 0 (0.0%) |
| $1,000,000 or more | 0 (0.0%) | 0 (0.0%) |
| Total | 201 (100.0%) | 189 (100.0%) |
Household Income by Mortgage Status in Ballplay
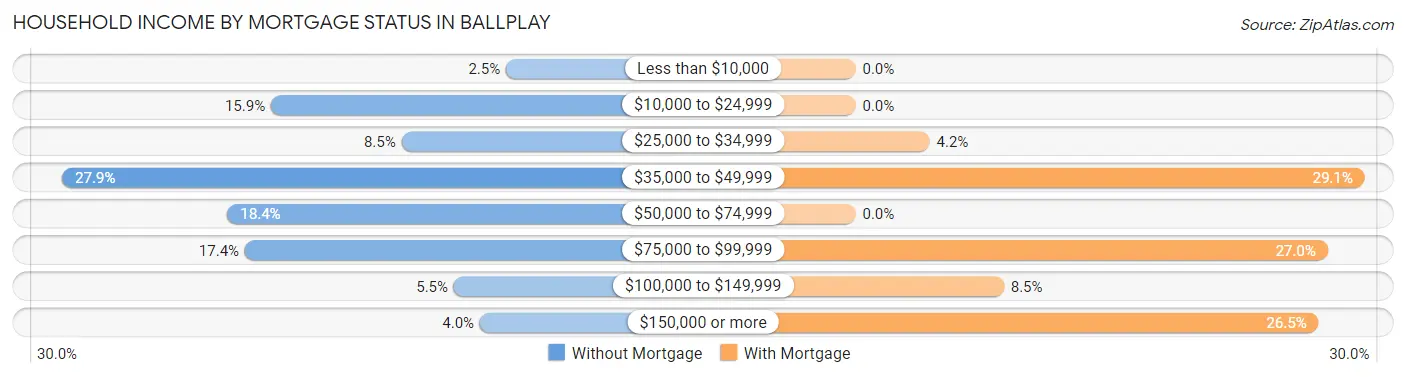
| Household Income | Without Mortgage | With Mortgage |
| Less than $10,000 | 5 (2.5%) | 0 (0.0%) |
| $10,000 to $24,999 | 32 (15.9%) | 0 (0.0%) |
| $25,000 to $34,999 | 17 (8.5%) | 8 (4.2%) |
| $35,000 to $49,999 | 56 (27.9%) | 55 (29.1%) |
| $50,000 to $74,999 | 37 (18.4%) | 0 (0.0%) |
| $75,000 to $99,999 | 35 (17.4%) | 51 (27.0%) |
| $100,000 to $149,999 | 11 (5.5%) | 16 (8.5%) |
| $150,000 or more | 8 (4.0%) | 50 (26.5%) |
| Total | 201 (100.0%) | 189 (100.0%) |
Property Value to Household Income Ratio in Ballplay
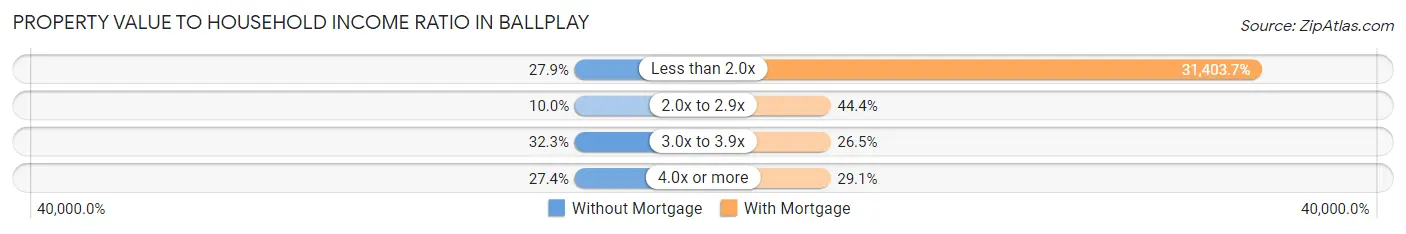
| Value-to-Income Ratio | Without Mortgage | With Mortgage |
| Less than 2.0x | 56 (27.9%) | 59,353 (31,403.7%) |
| 2.0x to 2.9x | 20 (10.0%) | 84 (44.4%) |
| 3.0x to 3.9x | 65 (32.3%) | 50 (26.5%) |
| 4.0x or more | 55 (27.4%) | 55 (29.1%) |
| Total | 201 (100.0%) | 189 (100.0%) |
Real Estate Taxes by Mortgage Status in Ballplay
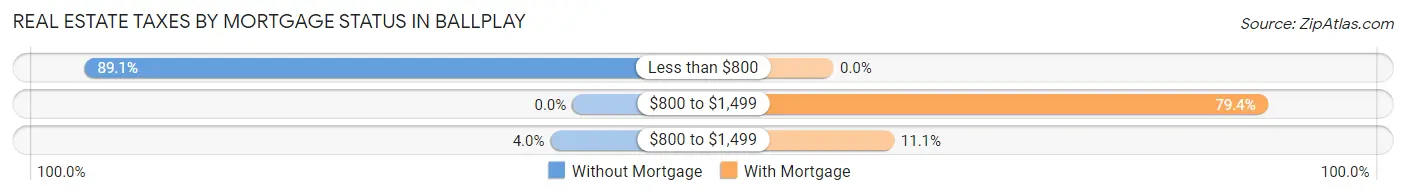
| Property Taxes | Without Mortgage | With Mortgage |
| Less than $800 | 179 (89.0%) | 0 (0.0%) |
| $800 to $1,499 | 0 (0.0%) | 150 (79.4%) |
| $800 to $1,499 | 8 (4.0%) | 21 (11.1%) |
| Total | 201 (100.0%) | 189 (100.0%) |
Health & Disability in Ballplay
Health Insurance Coverage by Age in Ballplay
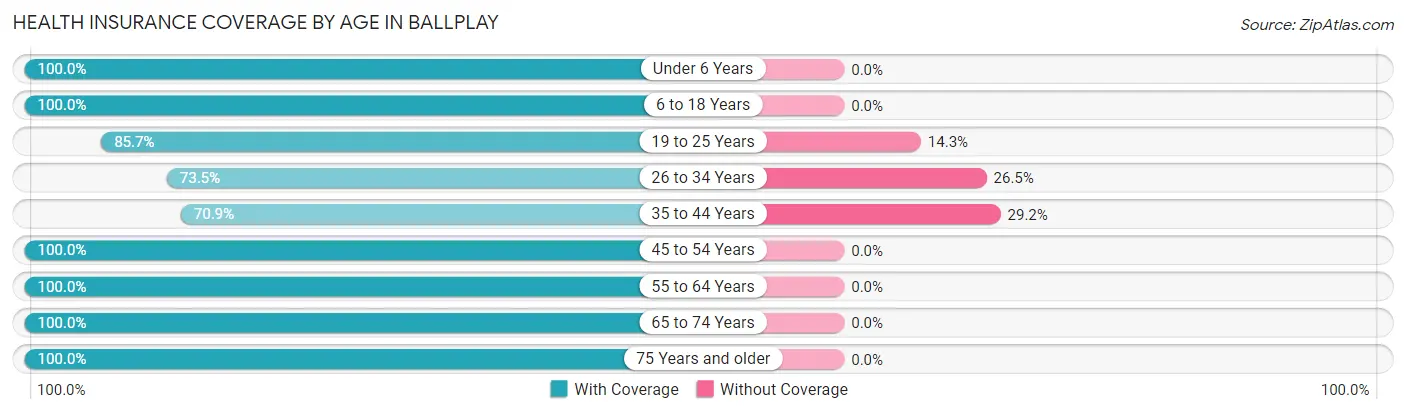
| Age Bracket | With Coverage | Without Coverage |
| Under 6 Years | 84 (100.0%) | 0 (0.0%) |
| 6 to 18 Years | 249 (100.0%) | 0 (0.0%) |
| 19 to 25 Years | 48 (85.7%) | 8 (14.3%) |
| 26 to 34 Years | 119 (73.5%) | 43 (26.5%) |
| 35 to 44 Years | 141 (70.9%) | 58 (29.1%) |
| 45 to 54 Years | 163 (100.0%) | 0 (0.0%) |
| 55 to 64 Years | 95 (100.0%) | 0 (0.0%) |
| 65 to 74 Years | 112 (100.0%) | 0 (0.0%) |
| 75 Years and older | 61 (100.0%) | 0 (0.0%) |
| Total | 1,072 (90.8%) | 109 (9.2%) |
Health Insurance Coverage by Citizenship Status in Ballplay
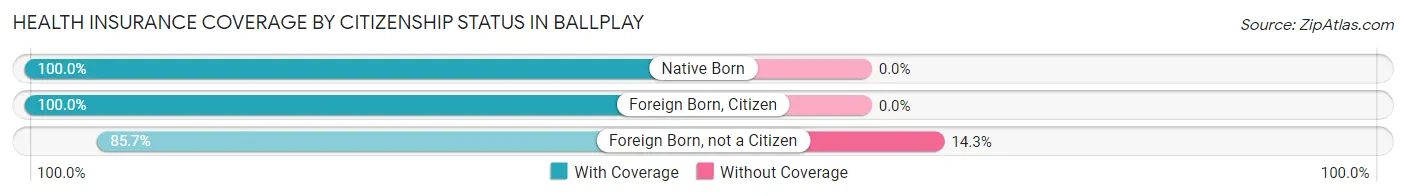
| Citizenship Status | With Coverage | Without Coverage |
| Native Born | 84 (100.0%) | 0 (0.0%) |
| Foreign Born, Citizen | 249 (100.0%) | 0 (0.0%) |
| Foreign Born, not a Citizen | 48 (85.7%) | 8 (14.3%) |
Health Insurance Coverage by Household Income in Ballplay
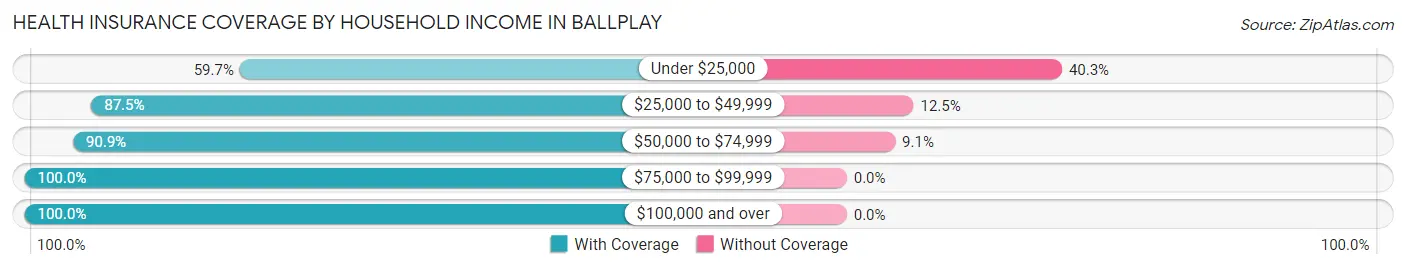
| Household Income | With Coverage | Without Coverage |
| Under $25,000 | 77 (59.7%) | 52 (40.3%) |
| $25,000 to $49,999 | 203 (87.5%) | 29 (12.5%) |
| $50,000 to $74,999 | 281 (90.9%) | 28 (9.1%) |
| $75,000 to $99,999 | 239 (100.0%) | 0 (0.0%) |
| $100,000 and over | 272 (100.0%) | 0 (0.0%) |
Public vs Private Health Insurance Coverage by Age in Ballplay
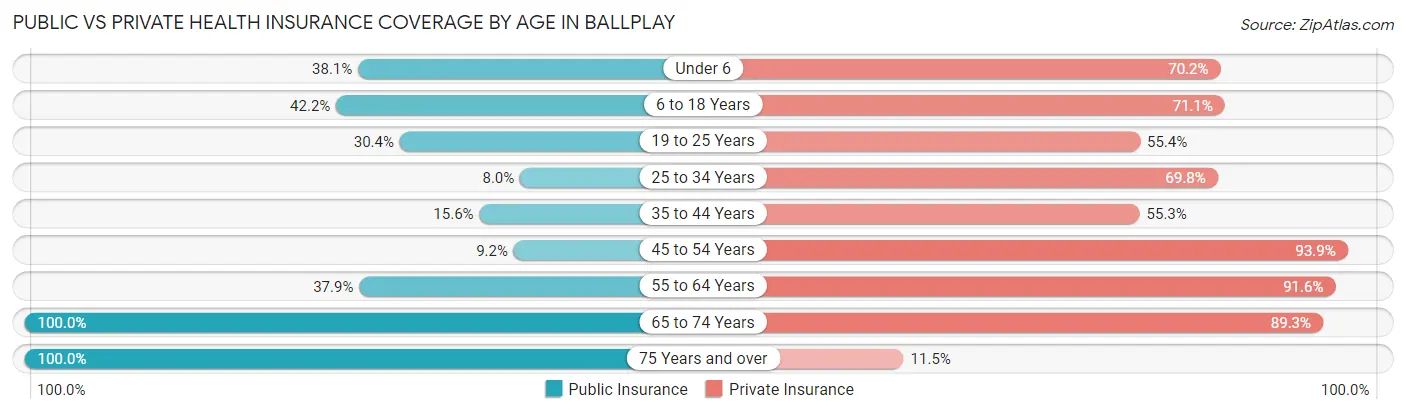
| Age Bracket | Public Insurance | Private Insurance |
| Under 6 | 32 (38.1%) | 59 (70.2%) |
| 6 to 18 Years | 105 (42.2%) | 177 (71.1%) |
| 19 to 25 Years | 17 (30.4%) | 31 (55.4%) |
| 25 to 34 Years | 13 (8.0%) | 113 (69.8%) |
| 35 to 44 Years | 31 (15.6%) | 110 (55.3%) |
| 45 to 54 Years | 15 (9.2%) | 153 (93.9%) |
| 55 to 64 Years | 36 (37.9%) | 87 (91.6%) |
| 65 to 74 Years | 112 (100.0%) | 100 (89.3%) |
| 75 Years and over | 61 (100.0%) | 7 (11.5%) |
| Total | 422 (35.7%) | 837 (70.9%) |
Disability Status by Sex by Age in Ballplay
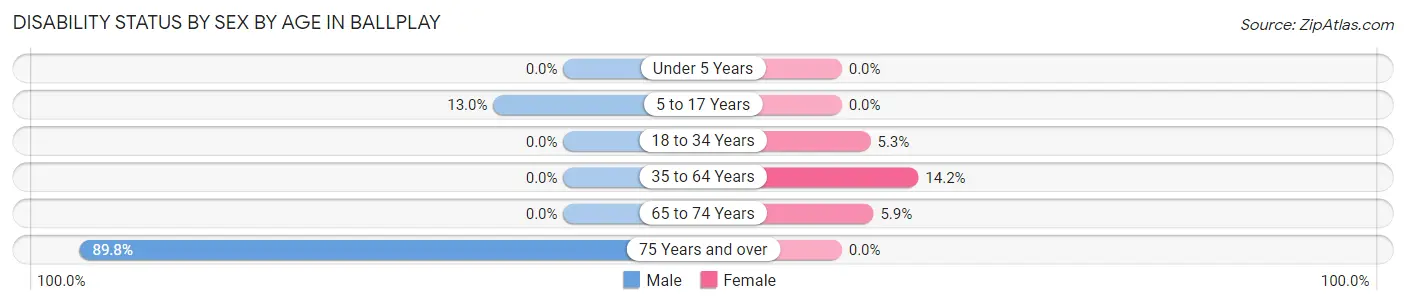
| Age Bracket | Male | Female |
| Under 5 Years | 0 (0.0%) | 0 (0.0%) |
| 5 to 17 Years | 13 (13.0%) | 0 (0.0%) |
| 18 to 34 Years | 0 (0.0%) | 8 (5.3%) |
| 35 to 64 Years | 0 (0.0%) | 32 (14.2%) |
| 65 to 74 Years | 0 (0.0%) | 5 (5.9%) |
| 75 Years and over | 44 (89.8%) | 0 (0.0%) |
Disability Class by Sex by Age in Ballplay
Disability Class: Hearing Difficulty
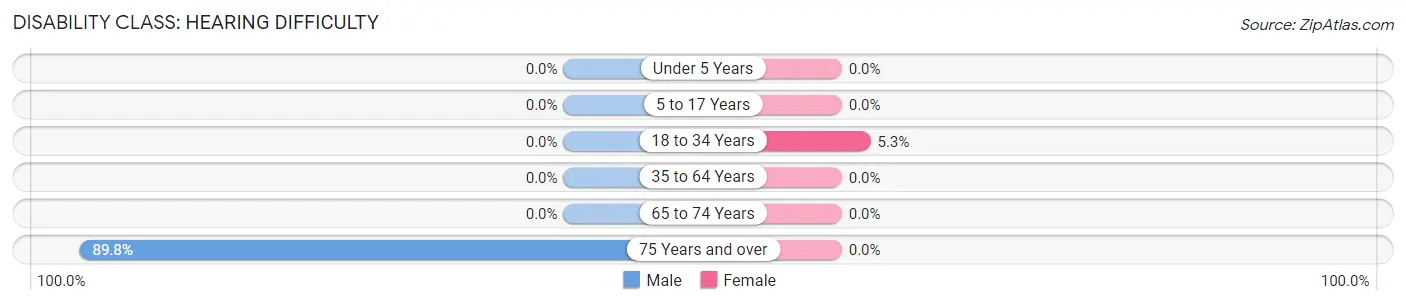
| Age Bracket | Male | Female |
| Under 5 Years | 0 (0.0%) | 0 (0.0%) |
| 5 to 17 Years | 0 (0.0%) | 0 (0.0%) |
| 18 to 34 Years | 0 (0.0%) | 8 (5.3%) |
| 35 to 64 Years | 0 (0.0%) | 0 (0.0%) |
| 65 to 74 Years | 0 (0.0%) | 0 (0.0%) |
| 75 Years and over | 44 (89.8%) | 0 (0.0%) |
Disability Class: Vision Difficulty
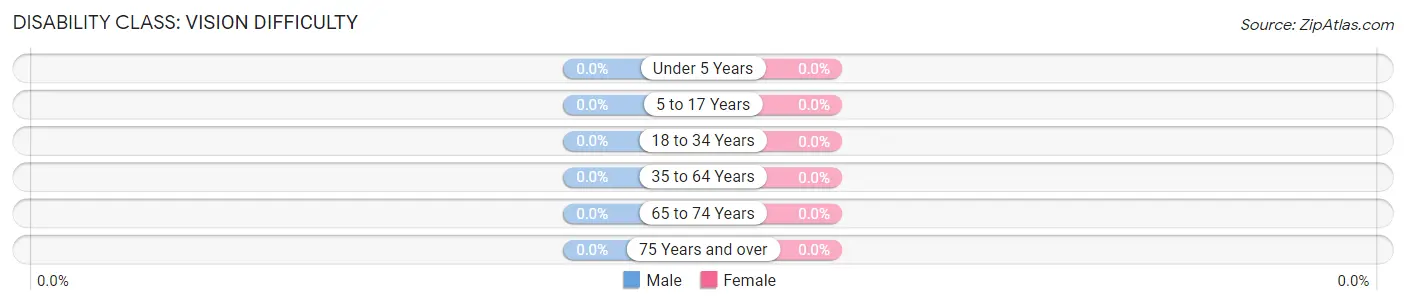
| Age Bracket | Male | Female |
| Under 5 Years | 0 (0.0%) | 0 (0.0%) |
| 5 to 17 Years | 0 (0.0%) | 0 (0.0%) |
| 18 to 34 Years | 0 (0.0%) | 0 (0.0%) |
| 35 to 64 Years | 0 (0.0%) | 0 (0.0%) |
| 65 to 74 Years | 0 (0.0%) | 0 (0.0%) |
| 75 Years and over | 0 (0.0%) | 0 (0.0%) |
Disability Class: Cognitive Difficulty
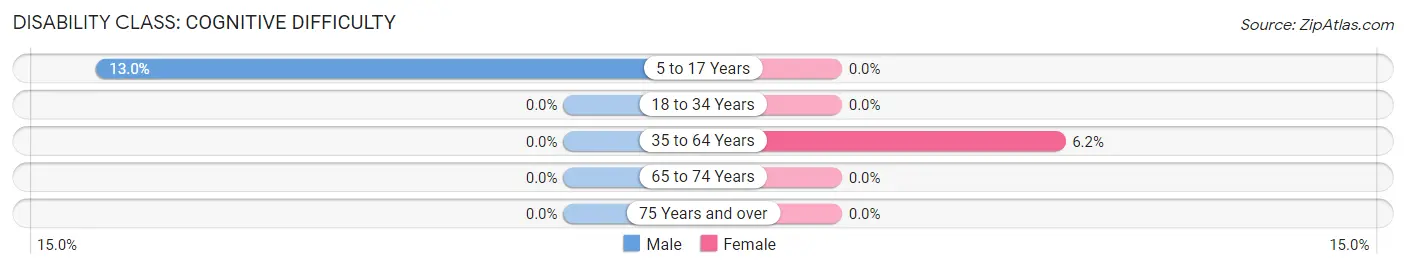
| Age Bracket | Male | Female |
| 5 to 17 Years | 13 (13.0%) | 0 (0.0%) |
| 18 to 34 Years | 0 (0.0%) | 0 (0.0%) |
| 35 to 64 Years | 0 (0.0%) | 14 (6.2%) |
| 65 to 74 Years | 0 (0.0%) | 0 (0.0%) |
| 75 Years and over | 0 (0.0%) | 0 (0.0%) |
Disability Class: Ambulatory Difficulty
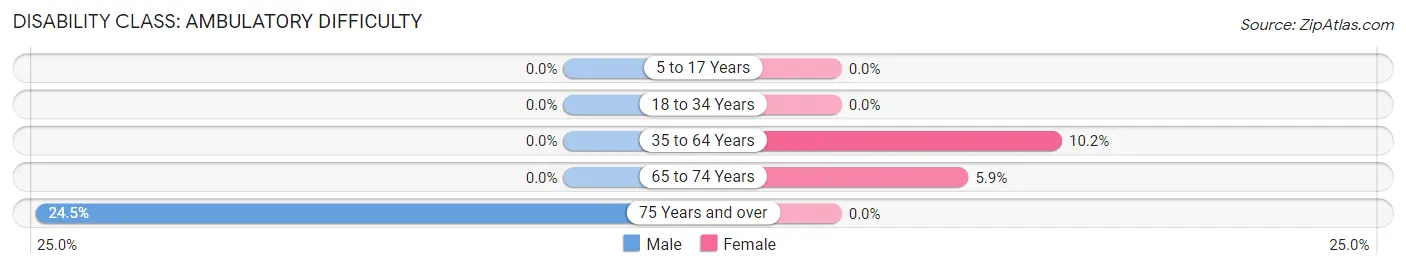
| Age Bracket | Male | Female |
| 5 to 17 Years | 0 (0.0%) | 0 (0.0%) |
| 18 to 34 Years | 0 (0.0%) | 0 (0.0%) |
| 35 to 64 Years | 0 (0.0%) | 23 (10.2%) |
| 65 to 74 Years | 0 (0.0%) | 5 (5.9%) |
| 75 Years and over | 12 (24.5%) | 0 (0.0%) |
Disability Class: Self-Care Difficulty
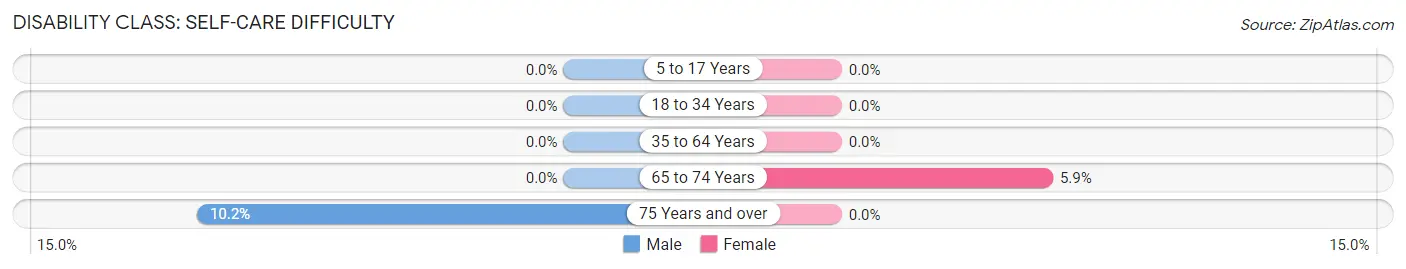
| Age Bracket | Male | Female |
| 5 to 17 Years | 0 (0.0%) | 0 (0.0%) |
| 18 to 34 Years | 0 (0.0%) | 0 (0.0%) |
| 35 to 64 Years | 0 (0.0%) | 0 (0.0%) |
| 65 to 74 Years | 0 (0.0%) | 5 (5.9%) |
| 75 Years and over | 5 (10.2%) | 0 (0.0%) |
Technology Access in Ballplay
Computing Device Access in Ballplay
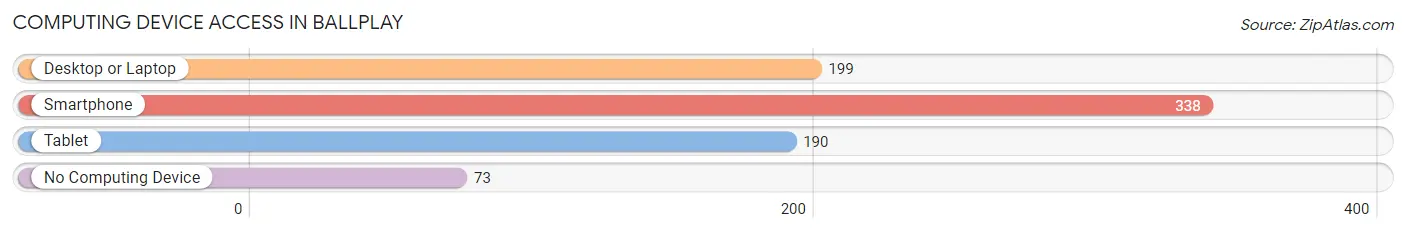
| Device Type | # Households | % Households |
| Desktop or Laptop | 199 | 48.4% |
| Smartphone | 338 | 82.2% |
| Tablet | 190 | 46.2% |
| No Computing Device | 73 | 17.8% |
| Total | 411 | 100.0% |
Internet Access in Ballplay
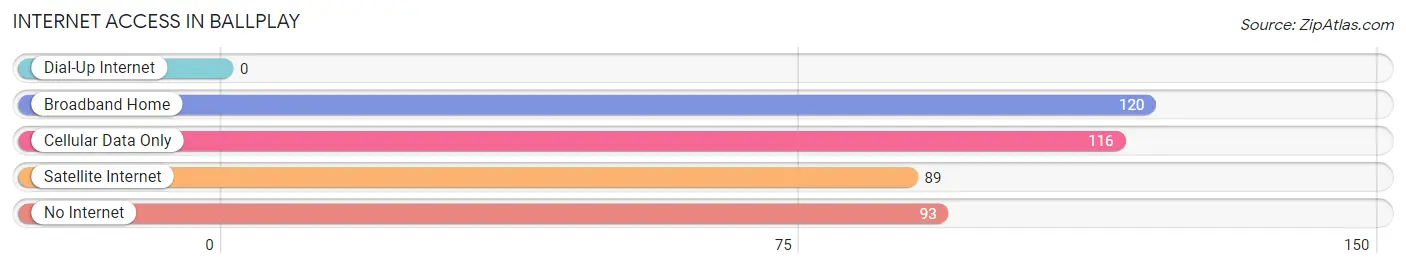
| Internet Type | # Households | % Households |
| Dial-Up Internet | 0 | 0.0% |
| Broadband Home | 120 | 29.2% |
| Cellular Data Only | 116 | 28.2% |
| Satellite Internet | 89 | 21.6% |
| No Internet | 93 | 22.6% |
| Total | 411 | 100.0% |
Ballplay Summary
Playball, AL is a small town located in the northwest corner of Alabama, in the foothills of the Appalachian Mountains. It is situated in the county of Jackson, and is part of the Huntsville-Decatur Combined Statistical Area. The town has a population of approximately 1,500 people, and is known for its rural charm and friendly atmosphere.
Geography
Playball, AL is located in the northwest corner of Alabama, in the foothills of the Appalachian Mountains. It is situated in the county of Jackson, and is part of the Huntsville-Decatur Combined Statistical Area. The town is located at the intersection of two major highways, US Highway 72 and Alabama State Route 65. The town is surrounded by rolling hills and lush forests, and is home to several small lakes and streams. The town is located approximately 30 miles from the city of Huntsville, and is within a two-hour drive of several major cities, including Birmingham, Nashville, and Chattanooga.
History
Playball, AL was founded in 1820 by a group of settlers from North Carolina. The town was originally known as “Playball”, after the game of baseball, which was popular among the settlers. The town was officially incorporated in 1887, and the first post office was established in 1891. The town grew slowly over the years, and by the early 1900s, it had become a popular destination for tourists and outdoor enthusiasts.
Economy
Playball, AL is a small, rural town, and the economy is largely based on agriculture and tourism. The town is home to several small farms, which produce a variety of crops, including corn, soybeans, and hay. The town is also home to several small businesses, including restaurants, shops, and a few small manufacturing companies. Tourism is also an important part of the local economy, as the town is home to several popular attractions, including a historic downtown area, a state park, and several outdoor recreation areas.
Demographics
As of the 2010 census, Playball, AL had a population of 1,500 people. The racial makeup of the town was 95.3% White, 1.7% African American, 0.7% Native American, 0.3% Asian, and 2.0% from other races. The median household income was $37,500, and the median age was 38.7 years. The town is home to several churches, and the most common religious affiliations are Baptist, Methodist, and Presbyterian.
Conclusion
Playball, AL is a small, rural town located in the northwest corner of Alabama. The town has a population of approximately 1,500 people, and is known for its rural charm and friendly atmosphere. The economy is largely based on agriculture and tourism, and the town is home to several small businesses and popular attractions. The town is also home to several churches, and the most common religious affiliations are Baptist, Methodist, and Presbyterian.
Common Questions
What is the Total Population of Ballplay?
Total Population of Ballplay is 1,181.
What is the Total Male Population of Ballplay?
Total Male Population of Ballplay is 565.
What is the Total Female Population of Ballplay?
Total Female Population of Ballplay is 616.
What is the Ratio of Males per 100 Females in Ballplay?
There are 91.72 Males per 100 Females in Ballplay.
What is the Ratio of Females per 100 Males in Ballplay?
There are 109.03 Females per 100 Males in Ballplay.
What is the Median Population Age in Ballplay?
Median Population Age in Ballplay is 37.0 Years.
What is the Average Family Size in Ballplay
Average Family Size in Ballplay is 3.7 People.
What is the Average Household Size in Ballplay
Average Household Size in Ballplay is 2.9 People.
What is Per Capita Income in Ballplay?
Per Capita income in Ballplay is $22,459.
What is the Median Family Income in Ballplay?
Median Family Income in Ballplay is $66,250.
What is the Median Household income in Ballplay?
Median Household Income in Ballplay is $57,582.
What is Income or Wage Gap in Ballplay?
Income or Wage Gap in Ballplay is 49.4%.
Women in Ballplay earn 50.6 cents for every dollar earned by a man.
What is Inequality or Gini Index in Ballplay?
Inequality or Gini Index in Ballplay is 0.35.
How Large is the Labor Force in Ballplay?
There are 598 People in the Labor Forcein in Ballplay.
What is the Percentage of People in the Labor Force in Ballplay?
64.5% of People are in the Labor Force in Ballplay.
What is the Unemployment Rate in Ballplay?
Unemployment Rate in Ballplay is 12.9%.