Zip Codes with the Highest Percentage of Population Employed in Administrative & Support Services in Anniston, AL
RELATED REPORTS & OPTIONS
Administrative & Support Services
Anniston
Compare Zip Codes
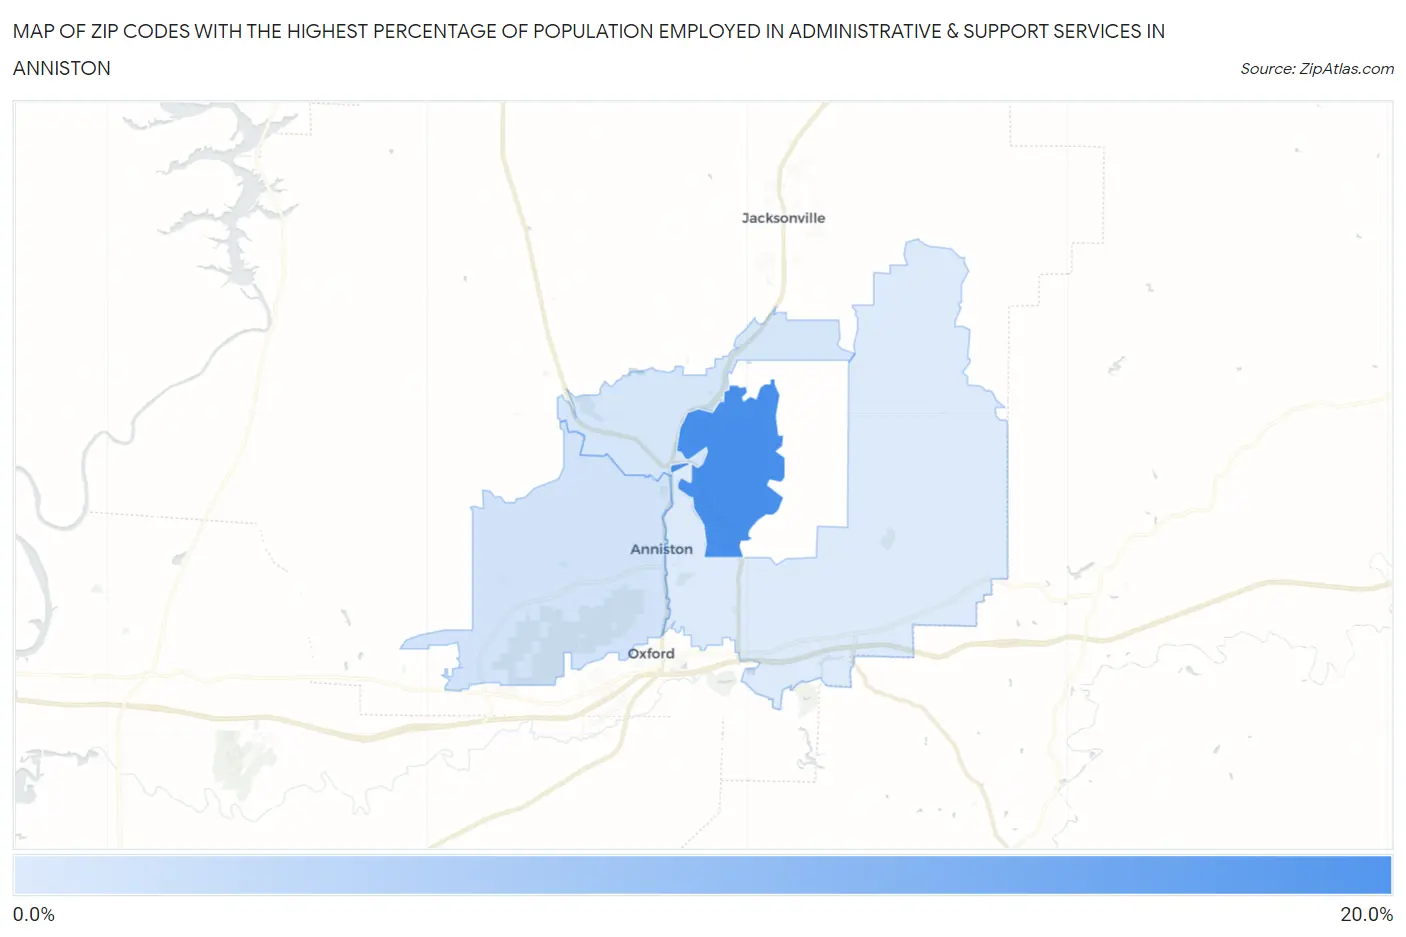
Map of Zip Codes with the Highest Percentage of Population Employed in Administrative & Support Services in Anniston
0.0%
20.0%
Zip Codes with the Highest Percentage of Population Employed in Administrative & Support Services in Anniston, AL
| Zip Code | % Employed | vs State | vs National | |
| 1. | 36205 | 17.9% | 4.0%(+13.9)#7 | 4.1%(+13.7)#358 |
| 2. | 36201 | 4.8% | 4.0%(+0.783)#156 | 4.1%(+0.602)#7,867 |
| 3. | 36206 | 4.4% | 4.0%(+0.413)#181 | 4.1%(+0.232)#9,155 |
| 4. | 36207 | 3.8% | 4.0%(-0.164)#244 | 4.1%(-0.346)#11,515 |
1
Common Questions
What are the Top 3 Zip Codes with the Highest Percentage of Population Employed in Administrative & Support Services in Anniston, AL?
Top 3 Zip Codes with the Highest Percentage of Population Employed in Administrative & Support Services in Anniston, AL are:
What zip code has the Highest Percentage of Population Employed in Administrative & Support Services in Anniston, AL?
36205 has the Highest Percentage of Population Employed in Administrative & Support Services in Anniston, AL with 17.9%.
What is the Percentage of Population Employed in Administrative & Support Services in Anniston, AL?
Percentage of Population Employed in Administrative & Support Services in Anniston is 5.0%.
What is the Percentage of Population Employed in Administrative & Support Services in Alabama?
Percentage of Population Employed in Administrative & Support Services in Alabama is 4.0%.
What is the Percentage of Population Employed in Administrative & Support Services in the United States?
Percentage of Population Employed in Administrative & Support Services in the United States is 4.1%.