Zip Codes with the Highest Percentage of Immigrants from Asia in Anniston, AL
RELATED REPORTS & OPTIONS
Asia
Anniston
Compare Zip Codes
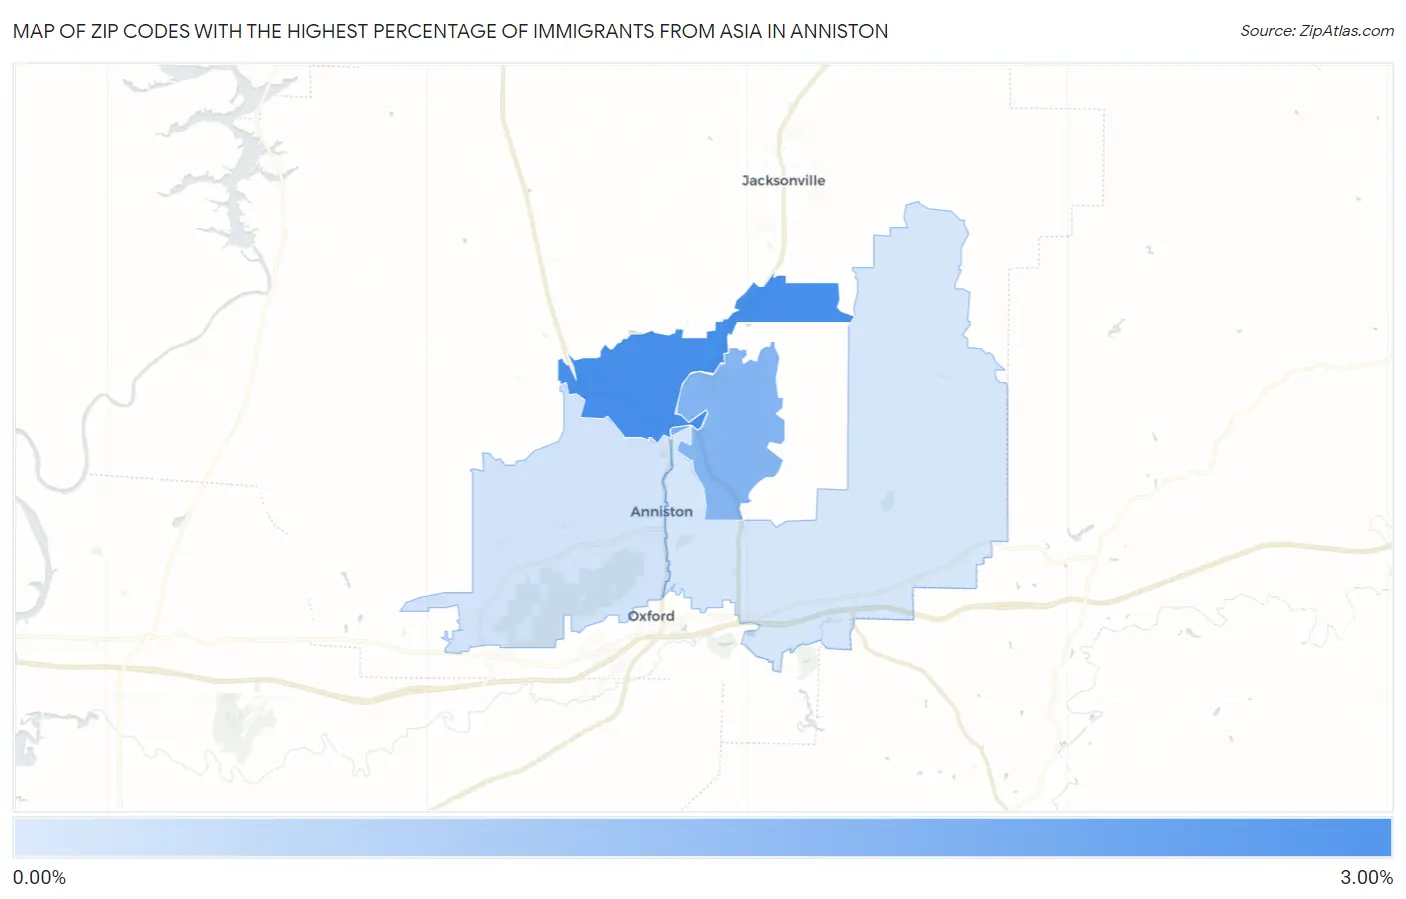
Map of Zip Codes with the Highest Percentage of Immigrants from Asia in Anniston
0.00%
3.00%
Zip Codes with the Highest Percentage of Immigrants from Asia in Anniston, AL
| Zip Code | Asia | vs State | vs National | |
| 1. | 36206 | 2.87% | 1.10%(+1.77)#26 | 4.26%(-1.39)#5,098 |
| 2. | 36205 | 1.71% | 1.10%(+0.615)#54 | 4.26%(-2.55)#7,577 |
| 3. | 36201 | 0.23% | 1.10%(-0.868)#255 | 4.26%(-4.03)#16,685 |
| 4. | 36207 | 0.12% | 1.10%(-0.979)#297 | 4.26%(-4.14)#18,109 |
1
Common Questions
What are the Top 3 Zip Codes with the Highest Percentage of Immigrants from Asia in Anniston, AL?
Top 3 Zip Codes with the Highest Percentage of Immigrants from Asia in Anniston, AL are:
What zip code has the Highest Percentage of Immigrants from Asia in Anniston, AL?
36206 has the Highest Percentage of Immigrants from Asia in Anniston, AL with 2.87%.
What is the Percentage of Immigrants from Asia in Anniston, AL?
Percentage of Immigrants from Asia in Anniston is 0.16%.
What is the Percentage of Immigrants from Asia in Alabama?
Percentage of Immigrants from Asia in Alabama is 1.10%.
What is the Percentage of Immigrants from Asia in the United States?
Percentage of Immigrants from Asia in the United States is 4.26%.