Zip Codes with the Highest Percentage of Population Employed in Farming, Fishing & Forestry in Olympia, WA
RELATED REPORTS & OPTIONS
Farming, Fishing & Forestry
Olympia
Compare Zip Codes
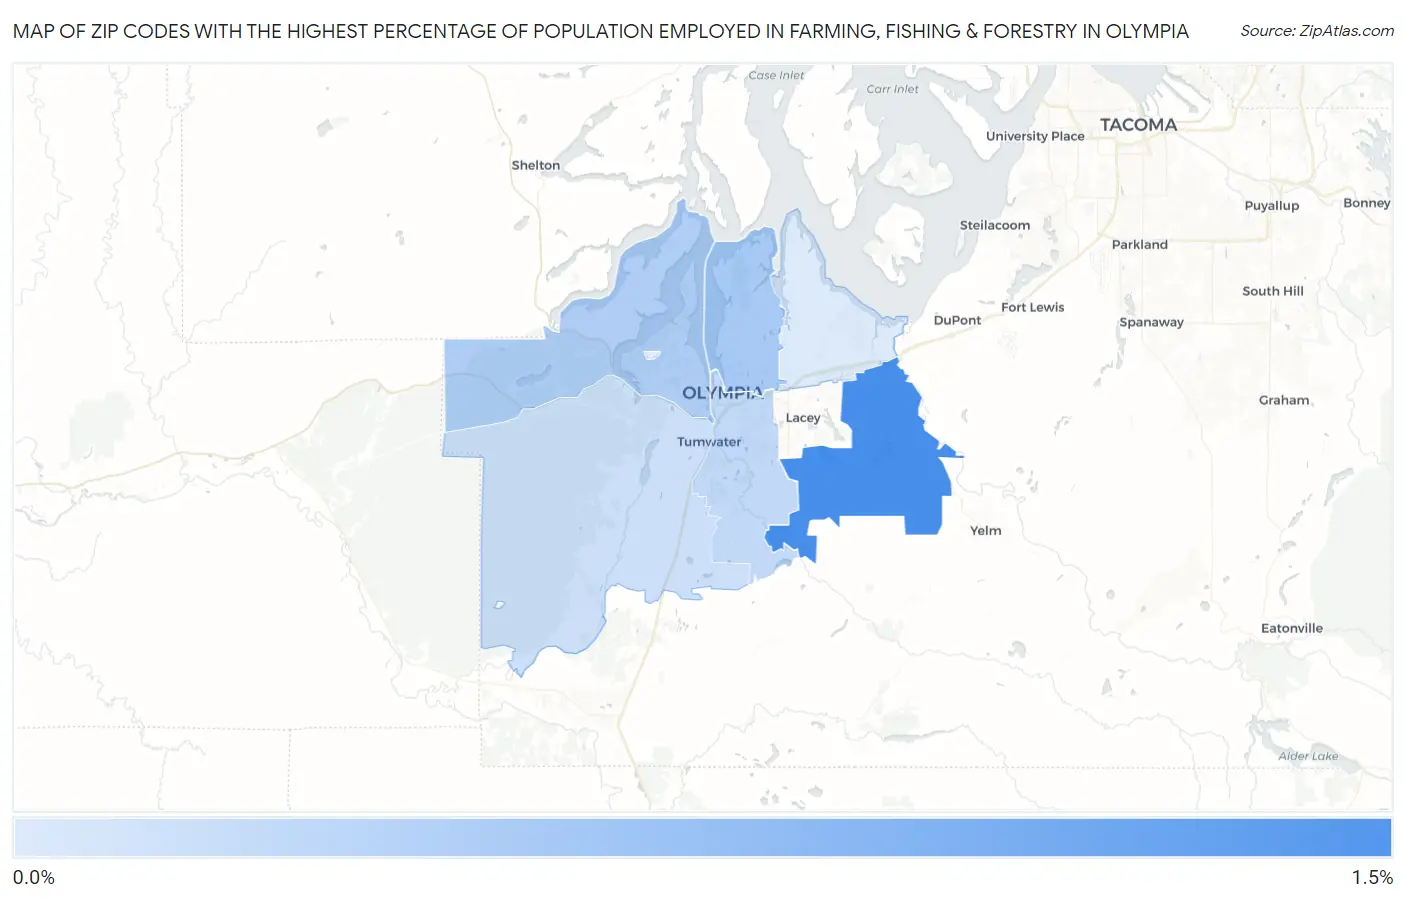
Map of Zip Codes with the Highest Percentage of Population Employed in Farming, Fishing & Forestry in Olympia
0.0%
1.5%
Zip Codes with the Highest Percentage of Population Employed in Farming, Fishing & Forestry in Olympia, WA
| Zip Code | % Employed | vs State | vs National | |
| 1. | 98513 | 1.3% | 1.5%(-0.236)#233 | 0.61%(+0.669)#8,663 |
| 2. | 98506 | 0.54% | 1.5%(-0.972)#299 | 0.61%(-0.067)#12,533 |
| 3. | 98502 | 0.50% | 1.5%(-1.01)#304 | 0.61%(-0.108)#12,860 |
| 4. | 98501 | 0.35% | 1.5%(-1.16)#338 | 0.61%(-0.259)#14,301 |
| 5. | 98512 | 0.27% | 1.5%(-1.24)#357 | 0.61%(-0.337)#15,182 |
| 6. | 98516 | 0.15% | 1.5%(-1.36)#400 | 0.61%(-0.458)#16,975 |
1
Common Questions
What are the Top 5 Zip Codes with the Highest Percentage of Population Employed in Farming, Fishing & Forestry in Olympia, WA?
Top 5 Zip Codes with the Highest Percentage of Population Employed in Farming, Fishing & Forestry in Olympia, WA are:
What zip code has the Highest Percentage of Population Employed in Farming, Fishing & Forestry in Olympia, WA?
98513 has the Highest Percentage of Population Employed in Farming, Fishing & Forestry in Olympia, WA with 1.3%.
What is the Percentage of Population Employed in Farming, Fishing & Forestry in Olympia, WA?
Percentage of Population Employed in Farming, Fishing & Forestry in Olympia is 0.60%.
What is the Percentage of Population Employed in Farming, Fishing & Forestry in Washington?
Percentage of Population Employed in Farming, Fishing & Forestry in Washington is 1.5%.
What is the Percentage of Population Employed in Farming, Fishing & Forestry in the United States?
Percentage of Population Employed in Farming, Fishing & Forestry in the United States is 0.61%.