Zip Codes with the Highest Percentage of Population Taking Taxi / Cab to Work in Burlington, VT
RELATED REPORTS & OPTIONS
Taxi / Cab
Burlington
Compare Zip Codes
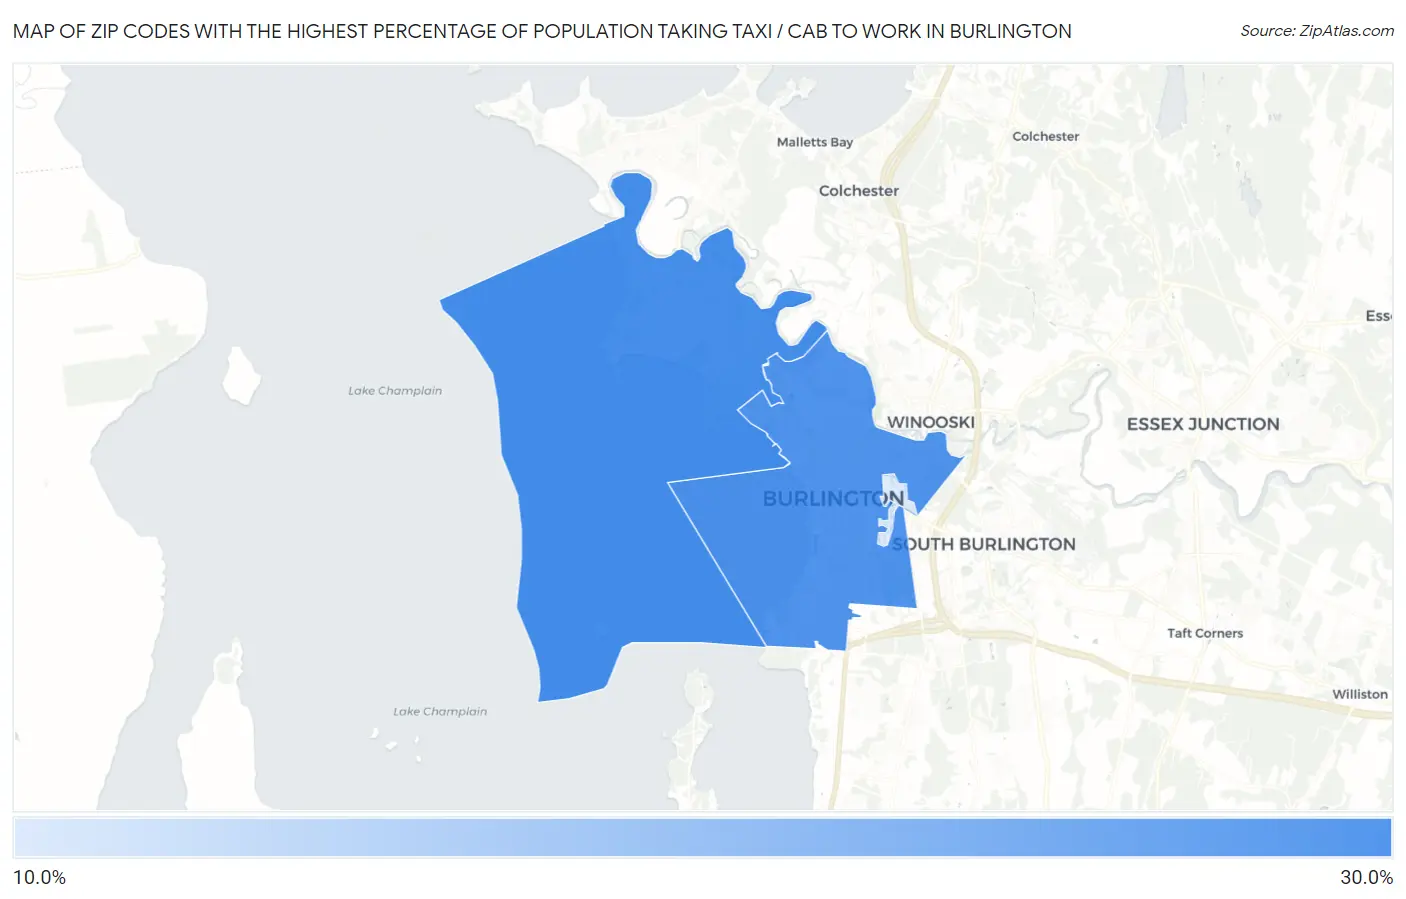
Map of Zip Codes with the Highest Percentage of Population Taking Taxi / Cab to Work in Burlington
0.0%
30.0%
Zip Codes with the Highest Percentage of Population Taking Taxi / Cab to Work in Burlington, VT
| Zip Code | % Take Taxi / Cab | vs State | vs National | |
| 1. | 05408 | 29.0% | 39.9%(-10.9)#35 | 38.2%(-9.20)#11,256 |
| 2. | 05401 | 28.6% | 39.9%(-11.3)#36 | 38.2%(-9.60)#11,385 |
| 3. | 05405 | 19.3% | 39.9%(-20.6)#44 | 38.2%(-18.9)#13,129 |
1
Common Questions
What are the Top Zip Codes with the Highest Percentage of Population Taking Taxi / Cab to Work in Burlington, VT?
Top Zip Codes with the Highest Percentage of Population Taking Taxi / Cab to Work in Burlington, VT are:
What zip code has the Highest Percentage of Population Taking Taxi / Cab to Work in Burlington, VT?
05408 has the Highest Percentage of Population Taking Taxi / Cab to Work in Burlington, VT with 29.0%.
What is the Percentage of Population Taking Taxi / Cab to Work in Burlington, VT?
Percentage of Population Taking Taxi / Cab to Work in Burlington is 28.5%.
What is the Percentage of Population Taking Taxi / Cab to Work in Vermont?
Percentage of Population Taking Taxi / Cab to Work in Vermont is 39.9%.
What is the Percentage of Population Taking Taxi / Cab to Work in the United States?
Percentage of Population Taking Taxi / Cab to Work in the United States is 38.2%.