Zip Codes with the Highest Percentage of Population Employed in Accommodation & Food Services in Burlington, VT
RELATED REPORTS & OPTIONS
Accommodation & Food Services
Burlington
Compare Zip Codes
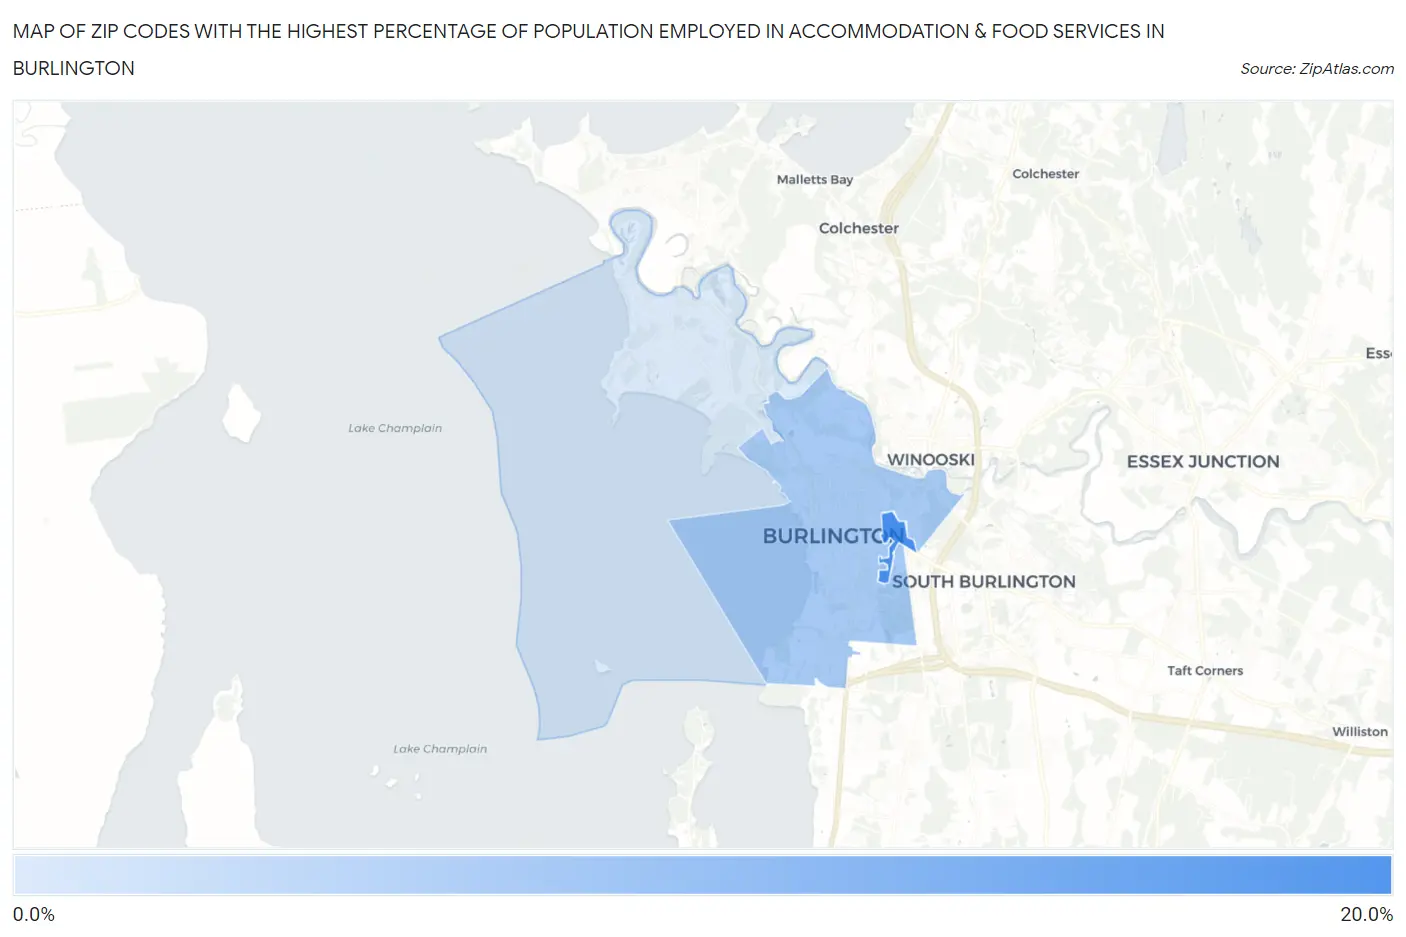
Map of Zip Codes with the Highest Percentage of Population Employed in Accommodation & Food Services in Burlington
0.0%
20.0%
Zip Codes with the Highest Percentage of Population Employed in Accommodation & Food Services in Burlington, VT
| Zip Code | % Employed | vs State | vs National | |
| 1. | 05405 | 19.4% | 6.7%(+12.7)#9 | 6.9%(+12.5)#896 |
| 2. | 05401 | 10.4% | 6.7%(+3.70)#42 | 6.9%(+3.50)#4,112 |
| 3. | 05408 | 5.7% | 6.7%(-0.968)#109 | 6.9%(-1.17)#14,332 |
1
Common Questions
What are the Top Zip Codes with the Highest Percentage of Population Employed in Accommodation & Food Services in Burlington, VT?
Top Zip Codes with the Highest Percentage of Population Employed in Accommodation & Food Services in Burlington, VT are:
What zip code has the Highest Percentage of Population Employed in Accommodation & Food Services in Burlington, VT?
05405 has the Highest Percentage of Population Employed in Accommodation & Food Services in Burlington, VT with 19.4%.
What is the Percentage of Population Employed in Accommodation & Food Services in Burlington, VT?
Percentage of Population Employed in Accommodation & Food Services in Burlington is 9.6%.
What is the Percentage of Population Employed in Accommodation & Food Services in Vermont?
Percentage of Population Employed in Accommodation & Food Services in Vermont is 6.7%.
What is the Percentage of Population Employed in Accommodation & Food Services in the United States?
Percentage of Population Employed in Accommodation & Food Services in the United States is 6.9%.