U.S. Virgin Islander vs Pima No Vehicles in Household
COMPARE
U.S. Virgin Islander
Pima
No Vehicles in Household
No Vehicles in Household Comparison
U.S. Virgin Islanders
Pima
15.4%
NO VEHICLES IN HOUSEHOLD
0.0/ 100
METRIC RATING
308th/ 347
METRIC RANK
14.1%
NO VEHICLES IN HOUSEHOLD
0.0/ 100
METRIC RATING
292nd/ 347
METRIC RANK
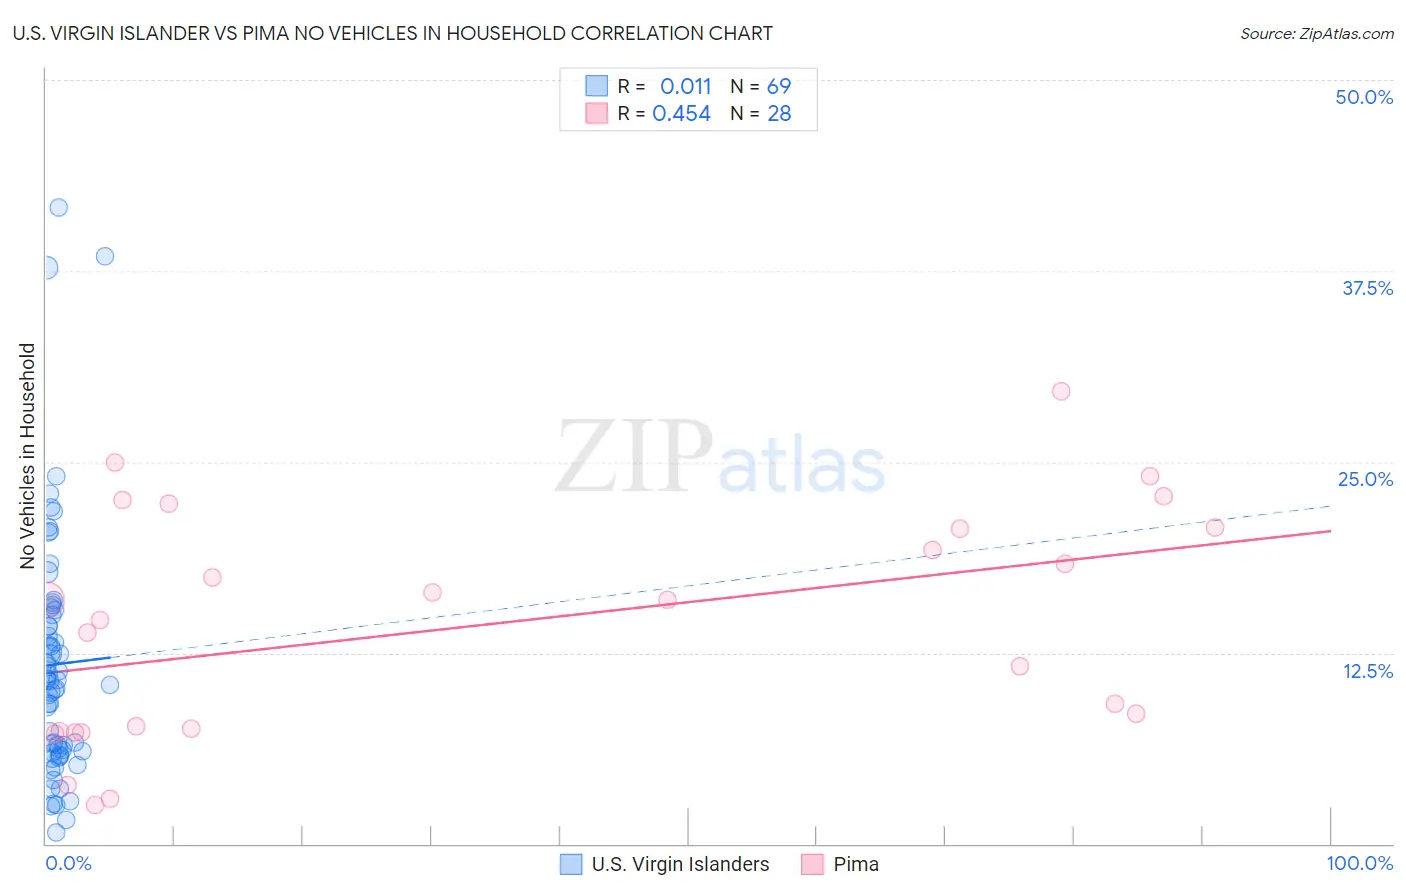
U.S. Virgin Islander vs Pima No Vehicles in Household Correlation Chart
The statistical analysis conducted on geographies consisting of 87,426,886 people shows no correlation between the proportion of U.S. Virgin Islanders and percentage of households with no vehicle available in the United States with a correlation coefficient (R) of 0.011 and weighted average of 15.4%. Similarly, the statistical analysis conducted on geographies consisting of 61,491,377 people shows a moderate positive correlation between the proportion of Pima and percentage of households with no vehicle available in the United States with a correlation coefficient (R) of 0.454 and weighted average of 14.1%, a difference of 8.9%.
No Vehicles in Household Correlation Summary
| Measurement | U.S. Virgin Islander | Pima |
| Minimum | 0.71% | 2.5% |
| Maximum | 41.7% | 29.6% |
| Range | 41.0% | 27.1% |
| Mean | 11.7% | 14.4% |
| Median | 10.6% | 15.3% |
| Interquartile 25% (IQ1) | 6.0% | 7.4% |
| Interquartile 75% (IQ3) | 15.1% | 20.7% |
| Interquartile Range (IQR) | 9.1% | 13.3% |
| Standard Deviation (Sample) | 8.2% | 7.5% |
| Standard Deviation (Population) | 8.1% | 7.4% |
Demographics Similar to U.S. Virgin Islanders and Pima by No Vehicles in Household
In terms of no vehicles in household, the demographic groups most similar to U.S. Virgin Islanders are Immigrants from Haiti (15.4%, a difference of 0.030%), Immigrants from Belize (15.4%, a difference of 0.17%), Puerto Rican (15.5%, a difference of 0.65%), Cape Verdean (15.6%, a difference of 1.2%), and Immigrants from China (15.2%, a difference of 1.5%). Similarly, the demographic groups most similar to Pima are Okinawan (14.1%, a difference of 0.48%), Indian (Asian) (14.1%, a difference of 0.49%), Immigrants from Jamaica (14.2%, a difference of 0.66%), Belizean (14.3%, a difference of 1.5%), and Paraguayan (14.4%, a difference of 1.6%).
| Demographics | Rating | Rank | No Vehicles in Household |
| Indians (Asian) | 0.0 /100 | #290 | Tragic 14.1% |
| Okinawans | 0.0 /100 | #291 | Tragic 14.1% |
| Pima | 0.0 /100 | #292 | Tragic 14.1% |
| Immigrants | Jamaica | 0.0 /100 | #293 | Tragic 14.2% |
| Belizeans | 0.0 /100 | #294 | Tragic 14.3% |
| Paraguayans | 0.0 /100 | #295 | Tragic 14.4% |
| Immigrants | Spain | 0.0 /100 | #296 | Tragic 14.5% |
| Immigrants | Panama | 0.0 /100 | #297 | Tragic 14.6% |
| Moroccans | 0.0 /100 | #298 | Tragic 14.7% |
| Immigrants | Greece | 0.0 /100 | #299 | Tragic 14.7% |
| Yuman | 0.0 /100 | #300 | Tragic 14.9% |
| Immigrants | Ukraine | 0.0 /100 | #301 | Tragic 14.9% |
| Haitians | 0.0 /100 | #302 | Tragic 14.9% |
| Immigrants | Western Africa | 0.0 /100 | #303 | Tragic 15.0% |
| Immigrants | Russia | 0.0 /100 | #304 | Tragic 15.1% |
| Immigrants | China | 0.0 /100 | #305 | Tragic 15.2% |
| Immigrants | Belize | 0.0 /100 | #306 | Tragic 15.4% |
| Immigrants | Haiti | 0.0 /100 | #307 | Tragic 15.4% |
| U.S. Virgin Islanders | 0.0 /100 | #308 | Tragic 15.4% |
| Puerto Ricans | 0.0 /100 | #309 | Tragic 15.5% |
| Cape Verdeans | 0.0 /100 | #310 | Tragic 15.6% |