Spanish American vs Guamanian/Chamorro No Vehicles in Household
COMPARE
Spanish American
Guamanian/Chamorro
No Vehicles in Household
No Vehicles in Household Comparison
Spanish Americans
Guamanians/Chamorros
9.1%
NO VEHICLES IN HOUSEHOLD
97.9/ 100
METRIC RATING
105th/ 347
METRIC RANK
8.0%
NO VEHICLES IN HOUSEHOLD
99.9/ 100
METRIC RATING
49th/ 347
METRIC RANK
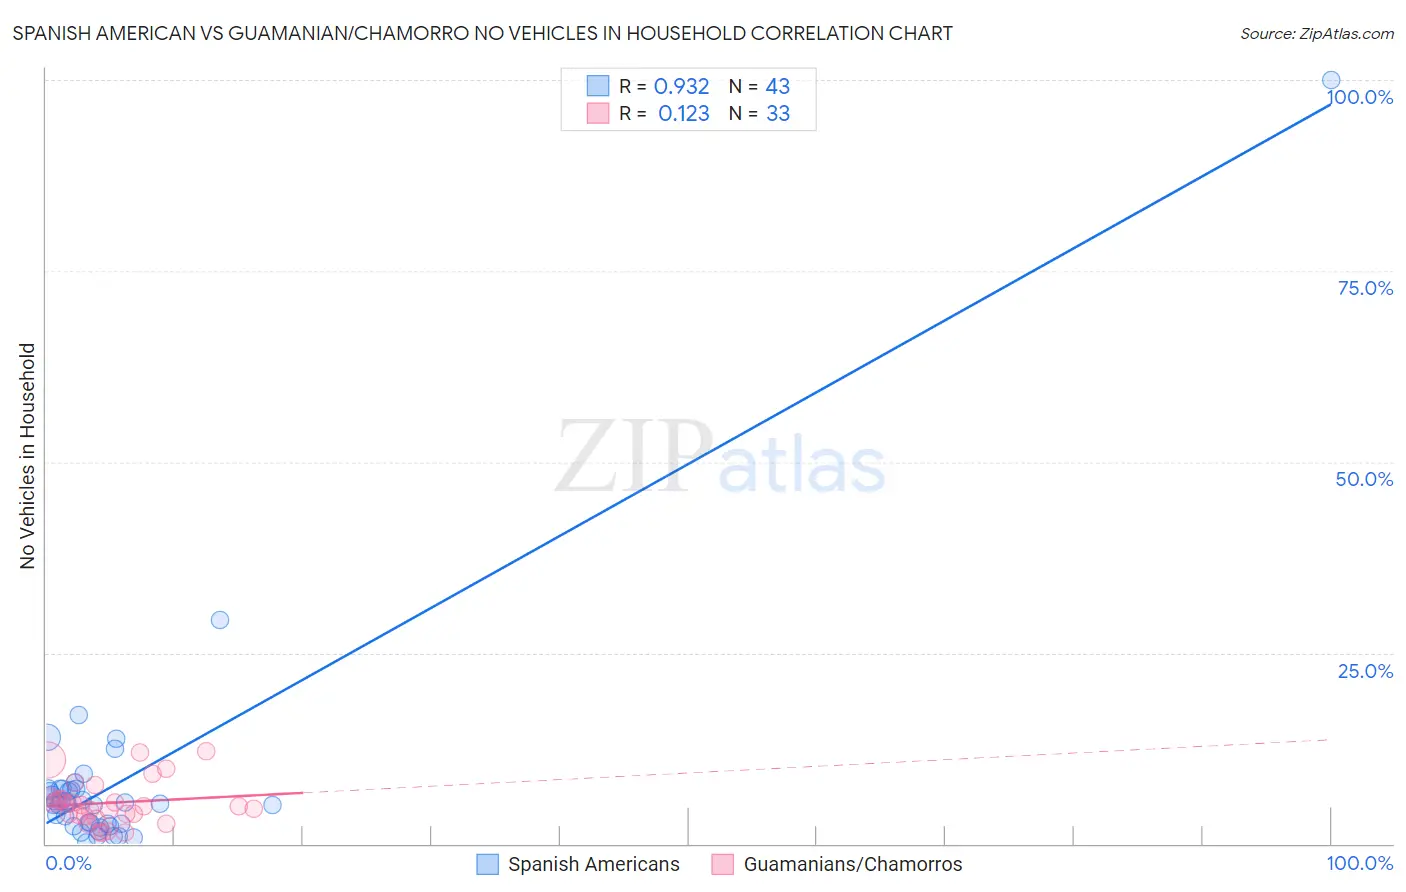
Spanish American vs Guamanian/Chamorro No Vehicles in Household Correlation Chart
The statistical analysis conducted on geographies consisting of 103,117,894 people shows a near-perfect positive correlation between the proportion of Spanish Americans and percentage of households with no vehicle available in the United States with a correlation coefficient (R) of 0.932 and weighted average of 9.1%. Similarly, the statistical analysis conducted on geographies consisting of 221,696,459 people shows a poor positive correlation between the proportion of Guamanians/Chamorros and percentage of households with no vehicle available in the United States with a correlation coefficient (R) of 0.123 and weighted average of 8.0%, a difference of 13.4%.
No Vehicles in Household Correlation Summary
| Measurement | Spanish American | Guamanian/Chamorro |
| Minimum | 0.089% | 1.4% |
| Maximum | 100.0% | 12.1% |
| Range | 99.9% | 10.7% |
| Mean | 8.1% | 5.4% |
| Median | 5.3% | 5.0% |
| Interquartile 25% (IQ1) | 2.6% | 3.7% |
| Interquartile 75% (IQ3) | 7.1% | 6.0% |
| Interquartile Range (IQR) | 4.6% | 2.3% |
| Standard Deviation (Sample) | 15.2% | 2.9% |
| Standard Deviation (Population) | 15.1% | 2.8% |
Similar Demographics by No Vehicles in Household
Demographics Similar to Spanish Americans by No Vehicles in Household
In terms of no vehicles in household, the demographic groups most similar to Spanish Americans are Laotian (9.1%, a difference of 0.090%), Zimbabwean (9.0%, a difference of 0.16%), Hispanic or Latino (9.1%, a difference of 0.36%), Mexican American Indian (9.1%, a difference of 0.44%), and Maltese (9.1%, a difference of 0.57%).
| Demographics | Rating | Rank | No Vehicles in Household |
| Slavs | 98.4 /100 | #98 | Exceptional 9.0% |
| Bulgarians | 98.4 /100 | #99 | Exceptional 9.0% |
| Asians | 98.3 /100 | #100 | Exceptional 9.0% |
| Pakistanis | 98.3 /100 | #101 | Exceptional 9.0% |
| Yugoslavians | 98.3 /100 | #102 | Exceptional 9.0% |
| Seminole | 98.3 /100 | #103 | Exceptional 9.0% |
| Zimbabweans | 98.0 /100 | #104 | Exceptional 9.0% |
| Spanish Americans | 97.9 /100 | #105 | Exceptional 9.1% |
| Laotians | 97.8 /100 | #106 | Exceptional 9.1% |
| Hispanics or Latinos | 97.7 /100 | #107 | Exceptional 9.1% |
| Mexican American Indians | 97.6 /100 | #108 | Exceptional 9.1% |
| Maltese | 97.6 /100 | #109 | Exceptional 9.1% |
| Delaware | 97.2 /100 | #110 | Exceptional 9.2% |
| Immigrants | Kuwait | 95.1 /100 | #111 | Exceptional 9.4% |
| Armenians | 95.0 /100 | #112 | Exceptional 9.4% |
Demographics Similar to Guamanians/Chamorros by No Vehicles in Household
In terms of no vehicles in household, the demographic groups most similar to Guamanians/Chamorros are Belgian (8.0%, a difference of 0.070%), Afghan (8.0%, a difference of 0.17%), Korean (8.0%, a difference of 0.17%), Northern European (7.9%, a difference of 0.65%), and Hawaiian (8.0%, a difference of 0.75%).
| Demographics | Rating | Rank | No Vehicles in Household |
| Swiss | 99.9 /100 | #42 | Exceptional 7.9% |
| Chickasaw | 99.9 /100 | #43 | Exceptional 7.9% |
| Choctaw | 99.9 /100 | #44 | Exceptional 7.9% |
| Immigrants | Nonimmigrants | 99.9 /100 | #45 | Exceptional 7.9% |
| Spanish | 99.9 /100 | #46 | Exceptional 7.9% |
| Northern Europeans | 99.9 /100 | #47 | Exceptional 7.9% |
| Afghans | 99.9 /100 | #48 | Exceptional 8.0% |
| Guamanians/Chamorros | 99.9 /100 | #49 | Exceptional 8.0% |
| Belgians | 99.9 /100 | #50 | Exceptional 8.0% |
| Koreans | 99.9 /100 | #51 | Exceptional 8.0% |
| Hawaiians | 99.9 /100 | #52 | Exceptional 8.0% |
| Slovenes | 99.9 /100 | #53 | Exceptional 8.0% |
| Immigrants | Venezuela | 99.9 /100 | #54 | Exceptional 8.1% |
| Celtics | 99.9 /100 | #55 | Exceptional 8.1% |
| Immigrants | Afghanistan | 99.9 /100 | #56 | Exceptional 8.1% |