Slovene vs Malaysian No Vehicles in Household

COMPARE

Slovene
Race
Ancestry
AfghanAfricanAlaska NativeAlaskan AthabascanAlbanianAleutAlsatianAmericanApacheArabArapahoArgentineanArmenianAssyrian/Chaldean/SyriacAustralianAustrianBahamianBangladeshiBarbadianBasqueBelgianBelizeanBermudanBhutaneseBlackfeetBolivianBrazilianBritishBritish West IndianBulgarianBurmeseCajunCambodianCanadianCape VerdeanCarpatho RusynCelticCentral AmericanCentral American IndianCherokeeCheyenneChickasawChileanChineseChippewaChoctawColombianColvilleComancheCosta RicanCreeCreekCroatianCrowCubanCypriotCzechCzechoslovakianDanishDelawareDominicanDutchDutch West IndianEastern EuropeanEcuadorianEgyptianEnglishEstonianEthiopianEuropeanFijianFilipinoFinnishFrenchFrench American IndianFrench CanadianGermanGerman RussianGhanaianGreekGuamanian/ChamorroGuatemalanGuyaneseHaitianHmongHonduranHopiHoumaHungarianIcelanderIndian (Asian)IndonesianInupiatIranianIraqiIrishIroquoisIsraeliItalianJamaicanJapaneseJordanianKenyanKiowaKoreanLaotianLatvianLebaneseLiberianLithuanianLumbeeLuxembourgerMacedonianMalteseMarshalleseMenomineeMexicanMexican American IndianMongolianMoroccanNative HawaiianNavajoNepaleseNew ZealanderNicaraguanNigerianNorthern EuropeanNorwegianOkinawanOsageOttawaPaiutePakistaniPalestinianPanamanianParaguayanPennsylvania GermanPeruvianPimaPolishPortuguesePotawatomiPuebloPuerto RicanPuget Sound SalishRomanianRussianSalvadoranSamoanScandinavianScotch-IrishScottishSeminoleSenegaleseSerbianShoshoneSierra LeoneanSiouxSlavicSlovakSloveneSomaliSouth AfricanSouth AmericanSouth American IndianSoviet UnionSpaniardSpanishSpanish AmericanSpanish American IndianSri LankanSubsaharan AfricanSudaneseSwedishSwissSyrianTaiwaneseThaiTlingit-HaidaTohono O'OdhamTonganTrinidadian and TobagonianTsimshianTurkishU.S. Virgin IslanderUgandanUkrainianUruguayanUteVenezuelanVietnameseWelshWest IndianYakamaYaquiYugoslavianYumanYup'ikZimbabwean
Immigration
NonimmigrantsImmigrantsAfghanistanAfricaAlbaniaArgentinaArmeniaAsiaAustraliaAustriaBahamasBangladeshBarbadosBelarusBelgiumBelizeBoliviaBosnia and HerzegovinaBrazilBulgariaBurma/MyanmarCabo VerdeCambodiaCameroonCanadaCaribbeanCentral AmericaChileChinaColombiaCongoCosta RicaCroatiaCubaCzechoslovakiaDenmarkDominicaDominican RepublicEastern AfricaEastern AsiaEastern EuropeEcuadorEgyptEl SalvadorEnglandEritreaEthiopiaEuropeFijiFranceGermanyGhanaGreeceGrenadaGuatemalaGuyanaHaitiHondurasHong KongHungaryIndiaIndonesiaIranIraqIrelandIsraelItalyJamaicaJapanJordanKazakhstanKenyaKoreaKuwaitLaosLatin AmericaLatviaLebanonLiberiaLithuaniaMalaysiaMexicoMicronesiaMiddle AfricaMoldovaMoroccoNepalNetherlandsNicaraguaNigeriaNorth AmericaNorth MacedoniaNorthern AfricaNorthern EuropeNorwayOceaniaPakistanPanamaPeruPhilippinesPolandPortugalRomaniaRussiaSaudi ArabiaScotlandSenegalSerbiaSierra LeoneSingaporeSomaliaSouth AfricaSouth AmericaSouth Central AsiaSouth Eastern AsiaSouthern EuropeSpainSri LankaSt. Vincent and the GrenadinesSudanSwedenSwitzerlandSyriaTaiwanThailandTrinidad and TobagoTurkeyUgandaUkraineUruguayUzbekistanVenezuelaVietnamWest IndiesWestern AfricaWestern AsiaWestern EuropeYemenZaireZimbabweAzores
Malaysian
Race
Ancestry
AfghanAfricanAlaska NativeAlaskan AthabascanAlbanianAleutAlsatianAmericanApacheArabArapahoArgentineanArmenianAssyrian/Chaldean/SyriacAustralianAustrianBahamianBangladeshiBarbadianBasqueBelgianBelizeanBermudanBhutaneseBlackfeetBolivianBrazilianBritishBritish West IndianBulgarianBurmeseCajunCambodianCanadianCape VerdeanCarpatho RusynCelticCentral AmericanCentral American IndianCherokeeCheyenneChickasawChileanChineseChippewaChoctawColombianColvilleComancheCosta RicanCreeCreekCroatianCrowCubanCypriotCzechCzechoslovakianDanishDelawareDominicanDutchDutch West IndianEastern EuropeanEcuadorianEgyptianEnglishEstonianEthiopianEuropeanFijianFilipinoFinnishFrenchFrench American IndianFrench CanadianGermanGerman RussianGhanaianGreekGuamanian/ChamorroGuatemalanGuyaneseHaitianHmongHonduranHopiHoumaHungarianIcelanderIndian (Asian)IndonesianInupiatIranianIraqiIrishIroquoisIsraeliItalianJamaicanJapaneseJordanianKenyanKiowaKoreanLaotianLatvianLebaneseLiberianLithuanianLumbeeLuxembourgerMacedonianMalaysianMalteseMarshalleseMenomineeMexicanMexican American IndianMongolianMoroccanNative HawaiianNavajoNepaleseNew ZealanderNicaraguanNigerianNorthern EuropeanNorwegianOkinawanOsageOttawaPaiutePakistaniPalestinianPanamanianParaguayanPennsylvania GermanPeruvianPimaPolishPortuguesePotawatomiPuebloPuerto RicanPuget Sound SalishRomanianRussianSalvadoranSamoanScandinavianScotch-IrishScottishSeminoleSenegaleseSerbianShoshoneSierra LeoneanSiouxSlavicSlovakSomaliSouth AfricanSouth AmericanSouth American IndianSoviet UnionSpaniardSpanishSpanish AmericanSpanish American IndianSri LankanSubsaharan AfricanSudaneseSwedishSwissSyrianTaiwaneseThaiTlingit-HaidaTohono O'OdhamTonganTrinidadian and TobagonianTsimshianTurkishU.S. Virgin IslanderUgandanUkrainianUruguayanUteVenezuelanVietnameseWelshWest IndianYakamaYaquiYugoslavianYumanYup'ikZimbabwean
Immigration
NonimmigrantsImmigrantsAfghanistanAfricaAlbaniaArgentinaArmeniaAsiaAustraliaAustriaBahamasBangladeshBarbadosBelarusBelgiumBelizeBoliviaBosnia and HerzegovinaBrazilBulgariaBurma/MyanmarCabo VerdeCambodiaCameroonCanadaCaribbeanCentral AmericaChileChinaColombiaCongoCosta RicaCroatiaCubaCzechoslovakiaDenmarkDominicaDominican RepublicEastern AfricaEastern AsiaEastern EuropeEcuadorEgyptEl SalvadorEnglandEritreaEthiopiaEuropeFijiFranceGermanyGhanaGreeceGrenadaGuatemalaGuyanaHaitiHondurasHong KongHungaryIndiaIndonesiaIranIraqIrelandIsraelItalyJamaicaJapanJordanKazakhstanKenyaKoreaKuwaitLaosLatin AmericaLatviaLebanonLiberiaLithuaniaMalaysiaMexicoMicronesiaMiddle AfricaMoldovaMoroccoNepalNetherlandsNicaraguaNigeriaNorth AmericaNorth MacedoniaNorthern AfricaNorthern EuropeNorwayOceaniaPakistanPanamaPeruPhilippinesPolandPortugalRomaniaRussiaSaudi ArabiaScotlandSenegalSerbiaSierra LeoneSingaporeSomaliaSouth AfricaSouth AmericaSouth Central AsiaSouth Eastern AsiaSouthern EuropeSpainSri LankaSt. Vincent and the GrenadinesSudanSwedenSwitzerlandSyriaTaiwanThailandTrinidad and TobagoTurkeyUgandaUkraineUruguayUzbekistanVenezuelaVietnamWest IndiesWestern AfricaWestern AsiaWestern EuropeYemenZaireZimbabweAzores
No Vehicles in Household
Income
Poverty
Unemployment
Labor Participation
Family Structure
Vehicle Availability
Education Level
Disability

No Vehicles in Household Comparison

Slovenes

Malaysians

Exceptional
Exceptional
8.0%
NO VEHICLES IN HOUSEHOLD
99.9/ 100
METRIC RATING
53rd/ 347
METRIC RANK
7.7%
NO VEHICLES IN HOUSEHOLD
100.0/ 100
METRIC RATING
32nd/ 347
METRIC RANK

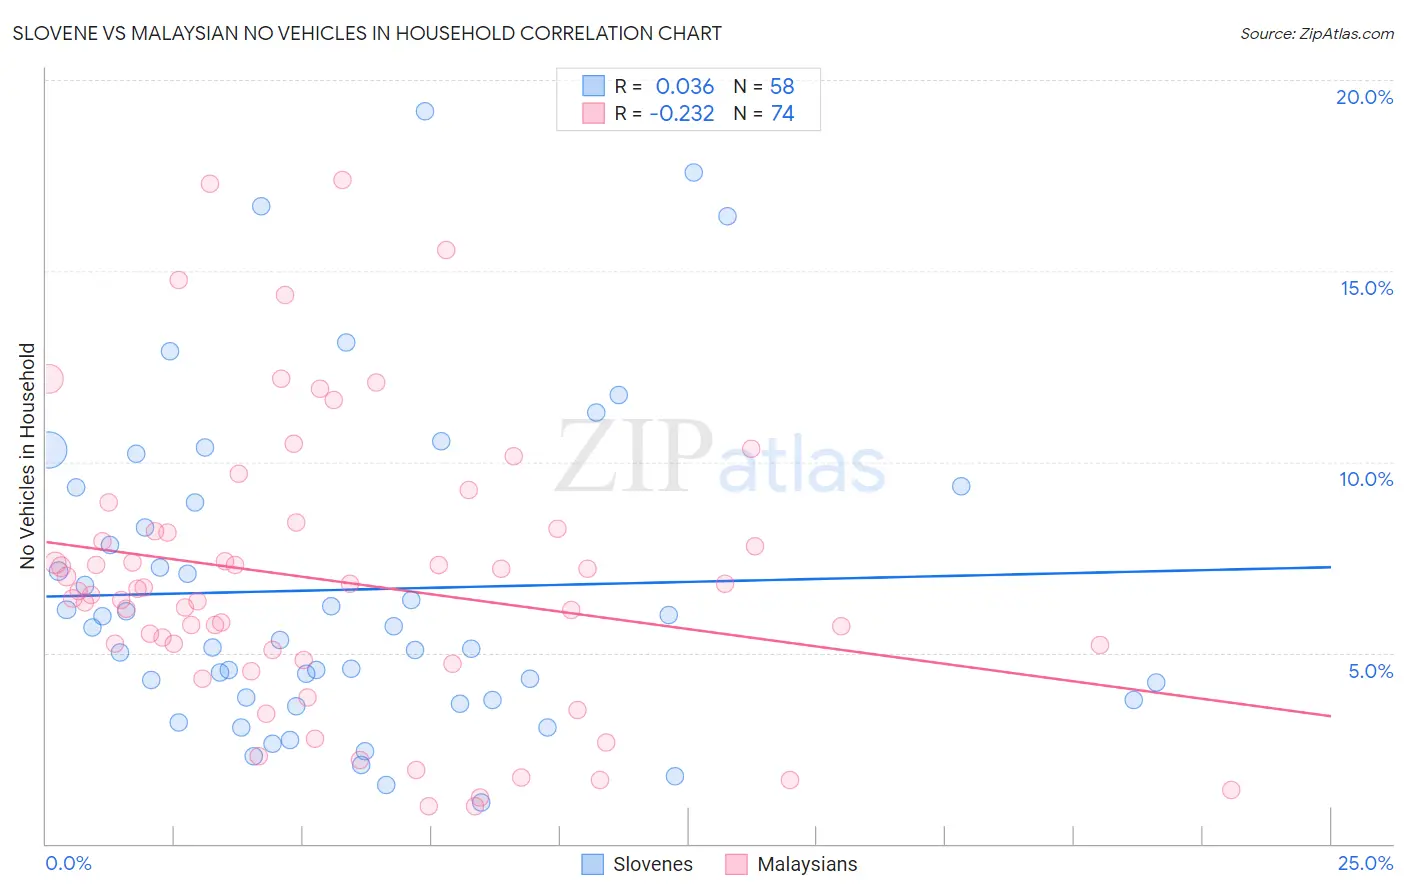
Slovene vs Malaysian No Vehicles in Household Correlation Chart

The statistical analysis conducted on geographies consisting of 260,894,292 people shows no correlation between the proportion of Slovenes and percentage of households with no vehicle available in the United States with a correlation coefficient (R) of 0.036 and weighted average of 8.0%. Similarly, the statistical analysis conducted on geographies consisting of 225,868,450 people shows a weak negative correlation between the proportion of Malaysians and percentage of households with no vehicle available in the United States with a correlation coefficient (R) of -0.232 and weighted average of 7.7%, a difference of 4.3%.
Slovene vs Malaysian No Vehicles in Household

No Vehicles in Household Correlation Summary

MeasurementSloveneMalaysian
Minimum1.1%0.99%
Maximum19.2%17.4%
Range18.1%16.4%
Mean6.7%6.9%
Median5.5%6.6%
Interquartile 25% (IQ1)3.8%4.8%
Interquartile 75% (IQ3)8.9%8.2%
Interquartile Range (IQR)5.2%3.4%
Standard Deviation (Sample)4.2%3.7%
Standard Deviation (Population)4.1%3.7%

Similar Demographics by No Vehicles in Household

Demographics Similar to Slovenes by No Vehicles in Household

In terms of no vehicles in household, the demographic groups most similar to Slovenes are Hawaiian (8.0%, a difference of 0.0%), Immigrants from Venezuela (8.1%, a difference of 0.31%), Celtic (8.1%, a difference of 0.40%), Korean (8.0%, a difference of 0.58%), and Belgian (8.0%, a difference of 0.68%).
DemographicsRating | RankNo Vehicles in Household
Spanish
99.9
/100
|
#46
Exceptional
7.9%
Northern Europeans
99.9
/100
|
#47
Exceptional
7.9%
Afghans
99.9
/100
|
#48
Exceptional
8.0%
Guamanians/Chamorros
99.9
/100
|
#49
Exceptional
8.0%
Belgians
99.9
/100
|
#50
Exceptional
8.0%
Koreans
99.9
/100
|
#51
Exceptional
8.0%
Hawaiians
99.9
/100
|
#52
Exceptional
8.0%
Slovenes
99.9
/100
|
#53
Exceptional
8.0%
Immigrants | Venezuela
99.9
/100
|
#54
Exceptional
8.1%
Celtics
99.9
/100
|
#55
Exceptional
8.1%
Immigrants | Afghanistan
99.9
/100
|
#56
Exceptional
8.1%
Venezuelans
99.8
/100
|
#57
Exceptional
8.1%
Immigrants | Mexico
99.8
/100
|
#58
Exceptional
8.1%
Immigrants | India
99.8
/100
|
#59
Exceptional
8.2%
Immigrants | Laos
99.8
/100
|
#60
Exceptional
8.2%

Demographics Similar to Malaysians by No Vehicles in Household

In terms of no vehicles in household, the demographic groups most similar to Malaysians are Immigrants from Taiwan (7.7%, a difference of 0.11%), Immigrants from Vietnam (7.7%, a difference of 0.24%), Native Hawaiian (7.7%, a difference of 0.25%), Cherokee (7.7%, a difference of 0.38%), and Finnish (7.7%, a difference of 0.40%).
DemographicsRating | RankNo Vehicles in Household
Yaqui
100.0
/100
|
#25
Exceptional
7.5%
Sri Lankans
100.0
/100
|
#26
Exceptional
7.6%
British
100.0
/100
|
#27
Exceptional
7.6%
Samoans
100.0
/100
|
#28
Exceptional
7.6%
Americans
100.0
/100
|
#29
Exceptional
7.7%
Finns
100.0
/100
|
#30
Exceptional
7.7%
Native Hawaiians
100.0
/100
|
#31
Exceptional
7.7%
Malaysians
100.0
/100
|
#32
Exceptional
7.7%
Immigrants | Taiwan
100.0
/100
|
#33
Exceptional
7.7%
Immigrants | Vietnam
100.0
/100
|
#34
Exceptional
7.7%
Cherokee
99.9
/100
|
#35
Exceptional
7.7%
Iraqis
99.9
/100
|
#36
Exceptional
7.7%
Basques
99.9
/100
|
#37
Exceptional
7.8%
Creek
99.9
/100
|
#38
Exceptional
7.8%
Immigrants | Fiji
99.9
/100
|
#39
Exceptional
7.8%