Latvian vs Mongolian No Vehicles in Household
COMPARE
Latvian
Mongolian
No Vehicles in Household
No Vehicles in Household Comparison
Latvians
Mongolians
9.8%
NO VEHICLES IN HOUSEHOLD
85.1/ 100
METRIC RATING
135th/ 347
METRIC RANK
13.1%
NO VEHICLES IN HOUSEHOLD
0.0/ 100
METRIC RATING
279th/ 347
METRIC RANK
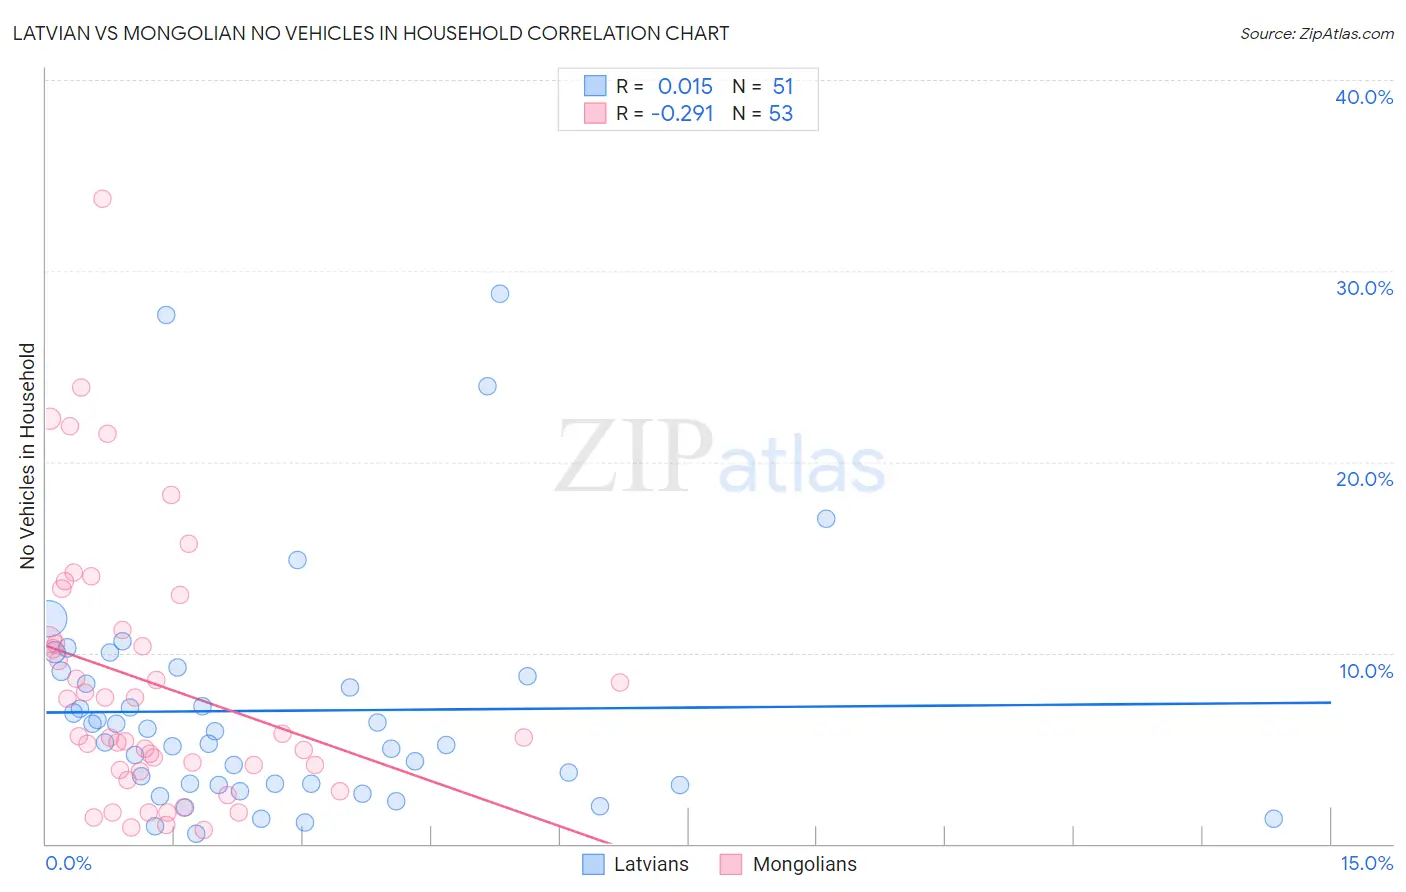
Latvian vs Mongolian No Vehicles in Household Correlation Chart
The statistical analysis conducted on geographies consisting of 220,382,965 people shows no correlation between the proportion of Latvians and percentage of households with no vehicle available in the United States with a correlation coefficient (R) of 0.015 and weighted average of 9.8%. Similarly, the statistical analysis conducted on geographies consisting of 140,111,412 people shows a weak negative correlation between the proportion of Mongolians and percentage of households with no vehicle available in the United States with a correlation coefficient (R) of -0.291 and weighted average of 13.1%, a difference of 34.1%.
No Vehicles in Household Correlation Summary
| Measurement | Latvian | Mongolian |
| Minimum | 0.54% | 0.73% |
| Maximum | 28.8% | 33.8% |
| Range | 28.3% | 33.1% |
| Mean | 7.0% | 8.4% |
| Median | 5.3% | 5.6% |
| Interquartile 25% (IQ1) | 3.1% | 3.8% |
| Interquartile 75% (IQ3) | 8.8% | 11.0% |
| Interquartile Range (IQR) | 5.7% | 7.1% |
| Standard Deviation (Sample) | 6.1% | 6.9% |
| Standard Deviation (Population) | 6.1% | 6.9% |
Similar Demographics by No Vehicles in Household
Demographics Similar to Latvians by No Vehicles in Household
In terms of no vehicles in household, the demographic groups most similar to Latvians are Immigrants from South Africa (9.8%, a difference of 0.050%), Immigrants from Moldova (9.8%, a difference of 0.15%), Estonian (9.8%, a difference of 0.27%), Marshallese (9.8%, a difference of 0.31%), and Immigrants from Lithuania (9.8%, a difference of 0.32%).
| Demographics | Rating | Rank | No Vehicles in Household |
| Immigrants | Syria | 89.5 /100 | #128 | Excellent 9.6% |
| Nicaraguans | 89.5 /100 | #129 | Excellent 9.7% |
| Burmese | 88.8 /100 | #130 | Excellent 9.7% |
| Immigrants | Azores | 88.2 /100 | #131 | Excellent 9.7% |
| Kenyans | 88.0 /100 | #132 | Excellent 9.7% |
| Immigrants | Oceania | 87.1 /100 | #133 | Excellent 9.7% |
| Syrians | 87.1 /100 | #134 | Excellent 9.7% |
| Latvians | 85.1 /100 | #135 | Excellent 9.8% |
| Immigrants | South Africa | 85.0 /100 | #136 | Excellent 9.8% |
| Immigrants | Moldova | 84.6 /100 | #137 | Excellent 9.8% |
| Estonians | 84.2 /100 | #138 | Excellent 9.8% |
| Marshallese | 84.0 /100 | #139 | Excellent 9.8% |
| Immigrants | Lithuania | 84.0 /100 | #140 | Excellent 9.8% |
| Sudanese | 83.1 /100 | #141 | Excellent 9.8% |
| Immigrants | Zimbabwe | 82.6 /100 | #142 | Excellent 9.9% |
Demographics Similar to Mongolians by No Vehicles in Household
In terms of no vehicles in household, the demographic groups most similar to Mongolians are Alsatian (13.2%, a difference of 0.27%), Immigrants from Croatia (13.0%, a difference of 0.69%), Aleut (13.0%, a difference of 0.73%), Immigrants from Southern Europe (13.0%, a difference of 0.81%), and Immigrants from Albania (13.0%, a difference of 1.2%).
| Demographics | Rating | Rank | No Vehicles in Household |
| Bermudans | 0.1 /100 | #272 | Tragic 12.8% |
| Immigrants | France | 0.1 /100 | #273 | Tragic 12.9% |
| Immigrants | Singapore | 0.1 /100 | #274 | Tragic 12.9% |
| Immigrants | Albania | 0.1 /100 | #275 | Tragic 13.0% |
| Immigrants | Southern Europe | 0.1 /100 | #276 | Tragic 13.0% |
| Aleuts | 0.1 /100 | #277 | Tragic 13.0% |
| Immigrants | Croatia | 0.1 /100 | #278 | Tragic 13.0% |
| Mongolians | 0.0 /100 | #279 | Tragic 13.1% |
| Alsatians | 0.0 /100 | #280 | Tragic 13.2% |
| Central American Indians | 0.0 /100 | #281 | Tragic 13.3% |
| Immigrants | Eastern Asia | 0.0 /100 | #282 | Tragic 13.5% |
| Immigrants | Kazakhstan | 0.0 /100 | #283 | Tragic 13.6% |
| Immigrants | Malaysia | 0.0 /100 | #284 | Tragic 13.6% |
| Immigrants | Eastern Europe | 0.0 /100 | #285 | Tragic 13.6% |
| Colville | 0.0 /100 | #286 | Tragic 13.7% |