Immigrants from Ukraine vs Nonimmigrants No Vehicles in Household
COMPARE
Immigrants from Ukraine
Nonimmigrants
No Vehicles in Household
No Vehicles in Household Comparison
Immigrants from Ukraine
Nonimmigrants
14.9%
NO VEHICLES IN HOUSEHOLD
0.0/ 100
METRIC RATING
301st/ 347
METRIC RANK
7.9%
NO VEHICLES IN HOUSEHOLD
99.9/ 100
METRIC RATING
45th/ 347
METRIC RANK
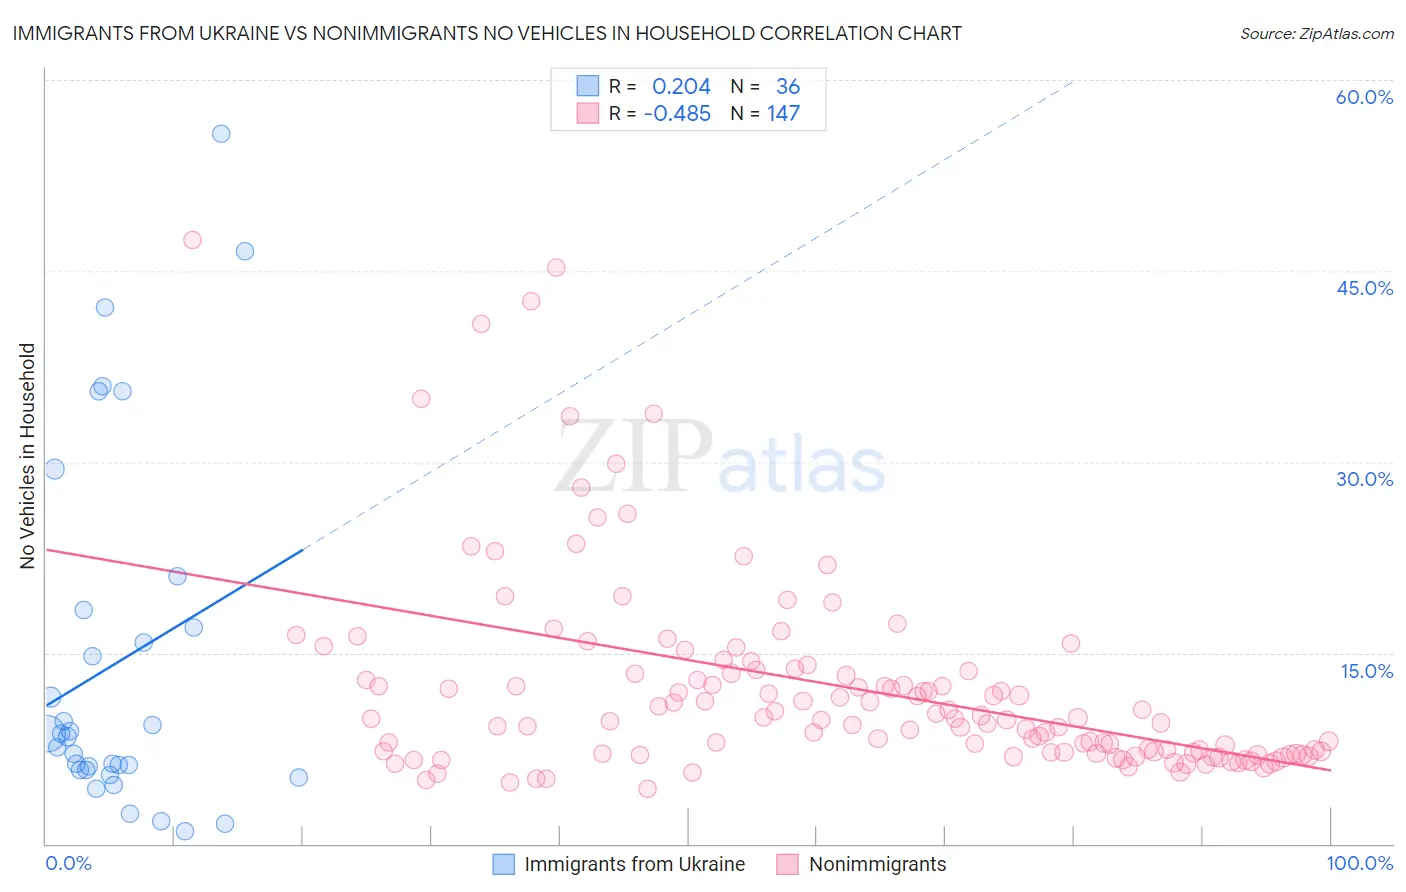
Immigrants from Ukraine vs Nonimmigrants No Vehicles in Household Correlation Chart
The statistical analysis conducted on geographies consisting of 289,279,042 people shows a weak positive correlation between the proportion of Immigrants from Ukraine and percentage of households with no vehicle available in the United States with a correlation coefficient (R) of 0.204 and weighted average of 14.9%. Similarly, the statistical analysis conducted on geographies consisting of 566,903,421 people shows a moderate negative correlation between the proportion of Nonimmigrants and percentage of households with no vehicle available in the United States with a correlation coefficient (R) of -0.485 and weighted average of 7.9%, a difference of 88.0%.
No Vehicles in Household Correlation Summary
| Measurement | Immigrants from Ukraine | Nonimmigrants |
| Minimum | 1.0% | 4.3% |
| Maximum | 55.8% | 47.4% |
| Range | 54.7% | 43.1% |
| Mean | 14.3% | 12.3% |
| Median | 8.5% | 9.8% |
| Interquartile 25% (IQ1) | 5.8% | 7.1% |
| Interquartile 75% (IQ3) | 17.6% | 13.6% |
| Interquartile Range (IQR) | 11.8% | 6.5% |
| Standard Deviation (Sample) | 14.1% | 8.0% |
| Standard Deviation (Population) | 13.9% | 8.0% |
Similar Demographics by No Vehicles in Household
Demographics Similar to Immigrants from Ukraine by No Vehicles in Household
In terms of no vehicles in household, the demographic groups most similar to Immigrants from Ukraine are Yuman (14.9%, a difference of 0.0%), Haitian (14.9%, a difference of 0.47%), Immigrants from Western Africa (15.0%, a difference of 0.99%), Immigrants from Greece (14.7%, a difference of 1.1%), and Moroccan (14.7%, a difference of 1.3%).
| Demographics | Rating | Rank | No Vehicles in Household |
| Belizeans | 0.0 /100 | #294 | Tragic 14.3% |
| Paraguayans | 0.0 /100 | #295 | Tragic 14.4% |
| Immigrants | Spain | 0.0 /100 | #296 | Tragic 14.5% |
| Immigrants | Panama | 0.0 /100 | #297 | Tragic 14.6% |
| Moroccans | 0.0 /100 | #298 | Tragic 14.7% |
| Immigrants | Greece | 0.0 /100 | #299 | Tragic 14.7% |
| Yuman | 0.0 /100 | #300 | Tragic 14.9% |
| Immigrants | Ukraine | 0.0 /100 | #301 | Tragic 14.9% |
| Haitians | 0.0 /100 | #302 | Tragic 14.9% |
| Immigrants | Western Africa | 0.0 /100 | #303 | Tragic 15.0% |
| Immigrants | Russia | 0.0 /100 | #304 | Tragic 15.1% |
| Immigrants | China | 0.0 /100 | #305 | Tragic 15.2% |
| Immigrants | Belize | 0.0 /100 | #306 | Tragic 15.4% |
| Immigrants | Haiti | 0.0 /100 | #307 | Tragic 15.4% |
| U.S. Virgin Islanders | 0.0 /100 | #308 | Tragic 15.4% |
Demographics Similar to Nonimmigrants by No Vehicles in Household
In terms of no vehicles in household, the demographic groups most similar to Nonimmigrants are Choctaw (7.9%, a difference of 0.17%), Spanish (7.9%, a difference of 0.26%), Northern European (7.9%, a difference of 0.38%), Chickasaw (7.9%, a difference of 0.53%), and Swiss (7.9%, a difference of 0.61%).
| Demographics | Rating | Rank | No Vehicles in Household |
| Creek | 99.9 /100 | #38 | Exceptional 7.8% |
| Immigrants | Fiji | 99.9 /100 | #39 | Exceptional 7.8% |
| Czechoslovakians | 99.9 /100 | #40 | Exceptional 7.8% |
| French Canadians | 99.9 /100 | #41 | Exceptional 7.8% |
| Swiss | 99.9 /100 | #42 | Exceptional 7.9% |
| Chickasaw | 99.9 /100 | #43 | Exceptional 7.9% |
| Choctaw | 99.9 /100 | #44 | Exceptional 7.9% |
| Immigrants | Nonimmigrants | 99.9 /100 | #45 | Exceptional 7.9% |
| Spanish | 99.9 /100 | #46 | Exceptional 7.9% |
| Northern Europeans | 99.9 /100 | #47 | Exceptional 7.9% |
| Afghans | 99.9 /100 | #48 | Exceptional 8.0% |
| Guamanians/Chamorros | 99.9 /100 | #49 | Exceptional 8.0% |
| Belgians | 99.9 /100 | #50 | Exceptional 8.0% |
| Koreans | 99.9 /100 | #51 | Exceptional 8.0% |
| Hawaiians | 99.9 /100 | #52 | Exceptional 8.0% |