Immigrants from St. Vincent and the Grenadines vs Panamanian No Vehicles in Household
COMPARE
Immigrants from St. Vincent and the Grenadines
Panamanian
No Vehicles in Household
No Vehicles in Household Comparison
Immigrants from St. Vincent and the Grenadines
Panamanians
35.4%
NO VEHICLES IN HOUSEHOLD
0.0/ 100
METRIC RATING
345th/ 347
METRIC RANK
12.5%
NO VEHICLES IN HOUSEHOLD
0.2/ 100
METRIC RATING
269th/ 347
METRIC RANK
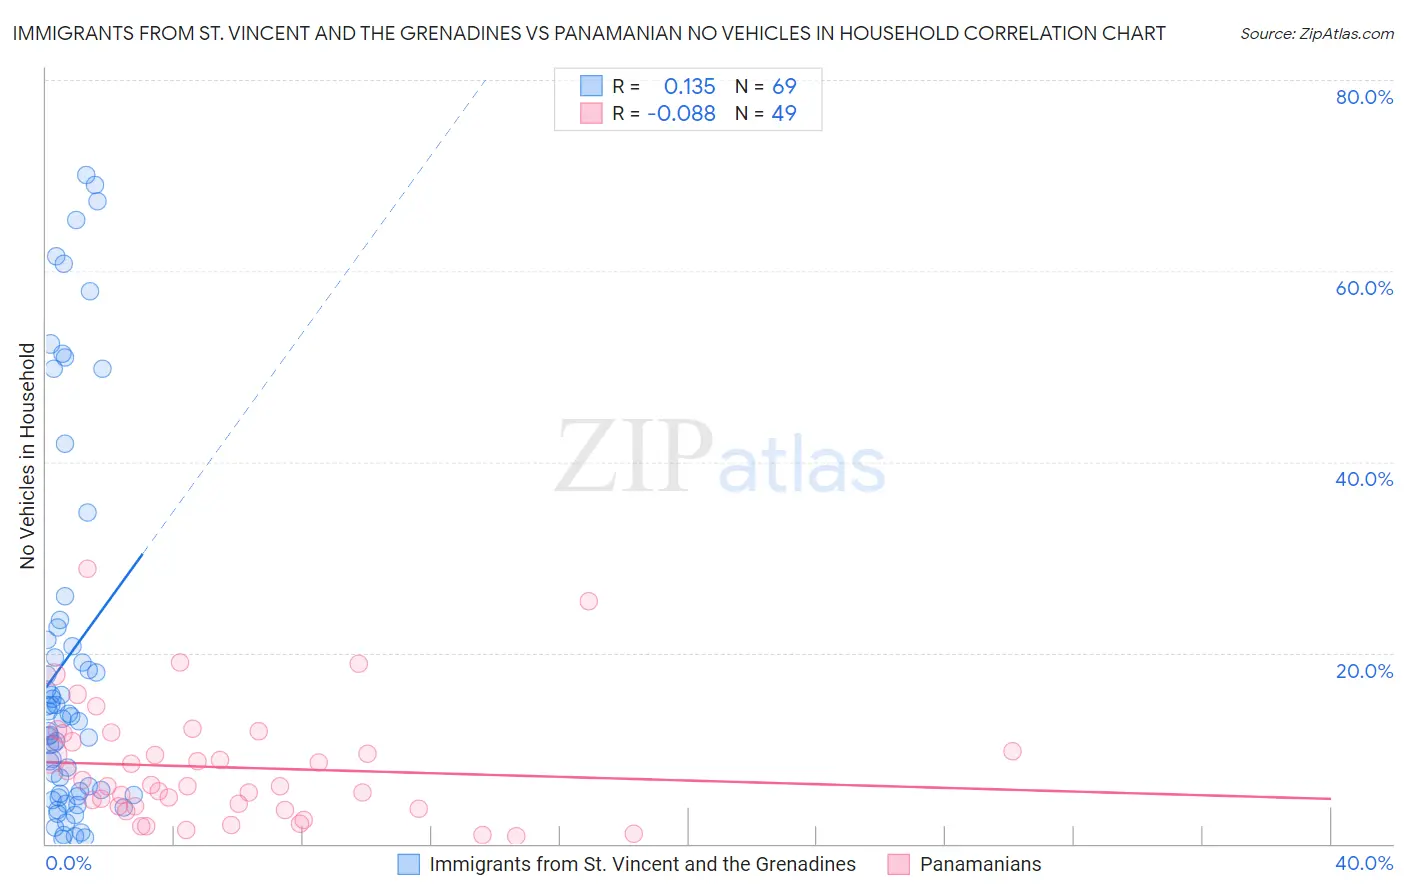
Immigrants from St. Vincent and the Grenadines vs Panamanian No Vehicles in Household Correlation Chart
The statistical analysis conducted on geographies consisting of 56,176,539 people shows a poor positive correlation between the proportion of Immigrants from St. Vincent and the Grenadines and percentage of households with no vehicle available in the United States with a correlation coefficient (R) of 0.135 and weighted average of 35.4%. Similarly, the statistical analysis conducted on geographies consisting of 280,874,828 people shows a slight negative correlation between the proportion of Panamanians and percentage of households with no vehicle available in the United States with a correlation coefficient (R) of -0.088 and weighted average of 12.5%, a difference of 182.4%.
No Vehicles in Household Correlation Summary
| Measurement | Immigrants from St. Vincent and the Grenadines | Panamanian |
| Minimum | 0.54% | 0.82% |
| Maximum | 70.0% | 28.8% |
| Range | 69.5% | 27.9% |
| Mean | 19.6% | 8.0% |
| Median | 13.1% | 6.1% |
| Interquartile 25% (IQ1) | 5.1% | 3.8% |
| Interquartile 75% (IQ3) | 22.0% | 11.1% |
| Interquartile Range (IQR) | 16.8% | 7.3% |
| Standard Deviation (Sample) | 19.9% | 6.1% |
| Standard Deviation (Population) | 19.8% | 6.1% |
Similar Demographics by No Vehicles in Household
Demographics Similar to Immigrants from St. Vincent and the Grenadines by No Vehicles in Household
In terms of no vehicles in household, the demographic groups most similar to Immigrants from St. Vincent and the Grenadines are Immigrants from Grenada (37.5%, a difference of 5.8%), Immigrants from Dominican Republic (31.4%, a difference of 12.7%), Inupiat (29.9%, a difference of 18.5%), British West Indian (29.7%, a difference of 19.0%), and Immigrants from Guyana (29.5%, a difference of 20.0%).
| Demographics | Rating | Rank | No Vehicles in Household |
| Immigrants | Trinidad and Tobago | 0.0 /100 | #333 | Tragic 24.6% |
| Immigrants | Bangladesh | 0.0 /100 | #334 | Tragic 25.8% |
| Barbadians | 0.0 /100 | #335 | Tragic 26.1% |
| Vietnamese | 0.0 /100 | #336 | Tragic 26.2% |
| Immigrants | Uzbekistan | 0.0 /100 | #337 | Tragic 26.7% |
| Guyanese | 0.0 /100 | #338 | Tragic 29.3% |
| Dominicans | 0.0 /100 | #339 | Tragic 29.4% |
| Immigrants | Barbados | 0.0 /100 | #340 | Tragic 29.5% |
| Immigrants | Guyana | 0.0 /100 | #341 | Tragic 29.5% |
| British West Indians | 0.0 /100 | #342 | Tragic 29.7% |
| Inupiat | 0.0 /100 | #343 | Tragic 29.9% |
| Immigrants | Dominican Republic | 0.0 /100 | #344 | Tragic 31.4% |
| Immigrants | St. Vincent and the Grenadines | 0.0 /100 | #345 | Tragic 35.4% |
| Immigrants | Grenada | 0.0 /100 | #346 | Tragic 37.5% |
| Yup'ik | 0.0 /100 | #347 | Tragic 45.9% |
Demographics Similar to Panamanians by No Vehicles in Household
In terms of no vehicles in household, the demographic groups most similar to Panamanians are Immigrants from Africa (12.5%, a difference of 0.13%), Immigrants from Europe (12.5%, a difference of 0.18%), Immigrants from Northern Africa (12.6%, a difference of 0.55%), Immigrants from Morocco (12.6%, a difference of 0.67%), and Israeli (12.4%, a difference of 0.76%).
| Demographics | Rating | Rank | No Vehicles in Household |
| Immigrants | Liberia | 0.6 /100 | #262 | Tragic 12.2% |
| Immigrants | Egypt | 0.6 /100 | #263 | Tragic 12.2% |
| Immigrants | Switzerland | 0.5 /100 | #264 | Tragic 12.3% |
| Africans | 0.4 /100 | #265 | Tragic 12.3% |
| Israelis | 0.3 /100 | #266 | Tragic 12.4% |
| Immigrants | Europe | 0.3 /100 | #267 | Tragic 12.5% |
| Immigrants | Africa | 0.2 /100 | #268 | Tragic 12.5% |
| Panamanians | 0.2 /100 | #269 | Tragic 12.5% |
| Immigrants | Northern Africa | 0.2 /100 | #270 | Tragic 12.6% |
| Immigrants | Morocco | 0.2 /100 | #271 | Tragic 12.6% |
| Bermudans | 0.1 /100 | #272 | Tragic 12.8% |
| Immigrants | France | 0.1 /100 | #273 | Tragic 12.9% |
| Immigrants | Singapore | 0.1 /100 | #274 | Tragic 12.9% |
| Immigrants | Albania | 0.1 /100 | #275 | Tragic 13.0% |
| Immigrants | Southern Europe | 0.1 /100 | #276 | Tragic 13.0% |