Immigrants from Greece vs Paraguayan No Vehicles in Household

COMPARE

Immigrants from Greece
Race
Ancestry
AfghanAfricanAlaska NativeAlaskan AthabascanAlbanianAleutAlsatianAmericanApacheArabArapahoArgentineanArmenianAssyrian/Chaldean/SyriacAustralianAustrianBahamianBangladeshiBarbadianBasqueBelgianBelizeanBermudanBhutaneseBlackfeetBolivianBrazilianBritishBritish West IndianBulgarianBurmeseCajunCambodianCanadianCape VerdeanCarpatho RusynCelticCentral AmericanCentral American IndianCherokeeCheyenneChickasawChileanChineseChippewaChoctawColombianColvilleComancheCosta RicanCreeCreekCroatianCrowCubanCypriotCzechCzechoslovakianDanishDelawareDominicanDutchDutch West IndianEastern EuropeanEcuadorianEgyptianEnglishEstonianEthiopianEuropeanFijianFilipinoFinnishFrenchFrench American IndianFrench CanadianGermanGerman RussianGhanaianGreekGuamanian/ChamorroGuatemalanGuyaneseHaitianHmongHonduranHopiHoumaHungarianIcelanderIndian (Asian)IndonesianInupiatIranianIraqiIrishIroquoisIsraeliItalianJamaicanJapaneseJordanianKenyanKiowaKoreanLaotianLatvianLebaneseLiberianLithuanianLumbeeLuxembourgerMacedonianMalaysianMalteseMarshalleseMenomineeMexicanMexican American IndianMongolianMoroccanNative HawaiianNavajoNepaleseNew ZealanderNicaraguanNigerianNorthern EuropeanNorwegianOkinawanOsageOttawaPaiutePakistaniPalestinianPanamanianPennsylvania GermanPeruvianPimaPolishPortuguesePotawatomiPuebloPuerto RicanPuget Sound SalishRomanianRussianSalvadoranSamoanScandinavianScotch-IrishScottishSeminoleSenegaleseSerbianShoshoneSierra LeoneanSiouxSlavicSlovakSloveneSomaliSouth AfricanSouth AmericanSouth American IndianSoviet UnionSpaniardSpanishSpanish AmericanSpanish American IndianSri LankanSubsaharan AfricanSudaneseSwedishSwissSyrianTaiwaneseThaiTlingit-HaidaTohono O'OdhamTonganTrinidadian and TobagonianTsimshianTurkishU.S. Virgin IslanderUgandanUkrainianUruguayanUteVenezuelanVietnameseWelshWest IndianYakamaYaquiYugoslavianYumanYup'ikZimbabwean
Immigration
NonimmigrantsImmigrantsAfghanistanAfricaAlbaniaArgentinaArmeniaAsiaAustraliaAustriaBahamasBangladeshBarbadosBelarusBelgiumBelizeBoliviaBosnia and HerzegovinaBrazilBulgariaBurma/MyanmarCabo VerdeCambodiaCameroonCanadaCaribbeanCentral AmericaChileChinaColombiaCongoCosta RicaCroatiaCubaCzechoslovakiaDenmarkDominicaDominican RepublicEastern AfricaEastern AsiaEastern EuropeEcuadorEgyptEl SalvadorEnglandEritreaEthiopiaEuropeFijiFranceGermanyGhanaGreeceGrenadaGuatemalaGuyanaHaitiHondurasHong KongHungaryIndiaIndonesiaIranIraqIrelandIsraelItalyJamaicaJapanJordanKazakhstanKenyaKoreaKuwaitLaosLatin AmericaLatviaLebanonLiberiaLithuaniaMalaysiaMexicoMicronesiaMiddle AfricaMoldovaMoroccoNepalNetherlandsNicaraguaNigeriaNorth AmericaNorth MacedoniaNorthern AfricaNorthern EuropeNorwayOceaniaPakistanPanamaPeruPhilippinesPolandPortugalRomaniaRussiaSaudi ArabiaScotlandSenegalSerbiaSierra LeoneSingaporeSomaliaSouth AfricaSouth AmericaSouth Central AsiaSouth Eastern AsiaSouthern EuropeSpainSri LankaSt. Vincent and the GrenadinesSudanSwedenSwitzerlandSyriaTaiwanThailandTrinidad and TobagoTurkeyUgandaUkraineUruguayUzbekistanVenezuelaVietnamWest IndiesWestern AfricaWestern AsiaWestern EuropeYemenZaireZimbabweAzores
Paraguayan
Race
Ancestry
AfghanAfricanAlaska NativeAlaskan AthabascanAlbanianAleutAlsatianAmericanApacheArabArapahoArgentineanArmenianAssyrian/Chaldean/SyriacAustralianAustrianBahamianBangladeshiBarbadianBasqueBelgianBelizeanBermudanBhutaneseBlackfeetBolivianBrazilianBritishBritish West IndianBulgarianBurmeseCajunCambodianCanadianCape VerdeanCarpatho RusynCelticCentral AmericanCentral American IndianCherokeeCheyenneChickasawChileanChineseChippewaChoctawColombianColvilleComancheCosta RicanCreeCreekCroatianCrowCubanCypriotCzechCzechoslovakianDanishDelawareDominicanDutchDutch West IndianEastern EuropeanEcuadorianEgyptianEnglishEstonianEthiopianEuropeanFijianFilipinoFinnishFrenchFrench American IndianFrench CanadianGermanGerman RussianGhanaianGreekGuamanian/ChamorroGuatemalanGuyaneseHaitianHmongHonduranHopiHoumaHungarianIcelanderIndian (Asian)IndonesianInupiatIranianIraqiIrishIroquoisIsraeliItalianJamaicanJapaneseJordanianKenyanKiowaKoreanLaotianLatvianLebaneseLiberianLithuanianLumbeeLuxembourgerMacedonianMalaysianMalteseMarshalleseMenomineeMexicanMexican American IndianMongolianMoroccanNative HawaiianNavajoNepaleseNew ZealanderNicaraguanNigerianNorthern EuropeanNorwegianOkinawanOsageOttawaPaiutePakistaniPalestinianPanamanianParaguayanPennsylvania GermanPeruvianPimaPolishPortuguesePotawatomiPuebloPuerto RicanPuget Sound SalishRomanianRussianSalvadoranSamoanScandinavianScotch-IrishScottishSeminoleSenegaleseSerbianShoshoneSierra LeoneanSiouxSlavicSlovakSloveneSomaliSouth AfricanSouth AmericanSouth American IndianSoviet UnionSpaniardSpanishSpanish AmericanSpanish American IndianSri LankanSubsaharan AfricanSudaneseSwedishSwissSyrianTaiwaneseThaiTlingit-HaidaTohono O'OdhamTonganTrinidadian and TobagonianTsimshianTurkishU.S. Virgin IslanderUgandanUkrainianUruguayanUteVenezuelanVietnameseWelshWest IndianYakamaYaquiYugoslavianYumanYup'ikZimbabwean
Immigration
NonimmigrantsImmigrantsAfghanistanAfricaAlbaniaArgentinaArmeniaAsiaAustraliaAustriaBahamasBangladeshBarbadosBelarusBelgiumBelizeBoliviaBosnia and HerzegovinaBrazilBulgariaBurma/MyanmarCabo VerdeCambodiaCameroonCanadaCaribbeanCentral AmericaChileChinaColombiaCongoCosta RicaCroatiaCubaCzechoslovakiaDenmarkDominicaDominican RepublicEastern AfricaEastern AsiaEastern EuropeEcuadorEgyptEl SalvadorEnglandEritreaEthiopiaEuropeFijiFranceGermanyGhanaGrenadaGuatemalaGuyanaHaitiHondurasHong KongHungaryIndiaIndonesiaIranIraqIrelandIsraelItalyJamaicaJapanJordanKazakhstanKenyaKoreaKuwaitLaosLatin AmericaLatviaLebanonLiberiaLithuaniaMalaysiaMexicoMicronesiaMiddle AfricaMoldovaMoroccoNepalNetherlandsNicaraguaNigeriaNorth AmericaNorth MacedoniaNorthern AfricaNorthern EuropeNorwayOceaniaPakistanPanamaPeruPhilippinesPolandPortugalRomaniaRussiaSaudi ArabiaScotlandSenegalSerbiaSierra LeoneSingaporeSomaliaSouth AfricaSouth AmericaSouth Central AsiaSouth Eastern AsiaSouthern EuropeSpainSri LankaSt. Vincent and the GrenadinesSudanSwedenSwitzerlandSyriaTaiwanThailandTrinidad and TobagoTurkeyUgandaUkraineUruguayUzbekistanVenezuelaVietnamWest IndiesWestern AfricaWestern AsiaWestern EuropeYemenZaireZimbabweAzores
No Vehicles in Household
Income
Poverty
Unemployment
Labor Participation
Family Structure
Vehicle Availability
Education Level
Disability

No Vehicles in Household Comparison

Immigrants from Greece

Paraguayans

Tragic
Tragic
14.7%
NO VEHICLES IN HOUSEHOLD
0.0/ 100
METRIC RATING
299th/ 347
METRIC RANK
14.4%
NO VEHICLES IN HOUSEHOLD
0.0/ 100
METRIC RATING
295th/ 347
METRIC RANK

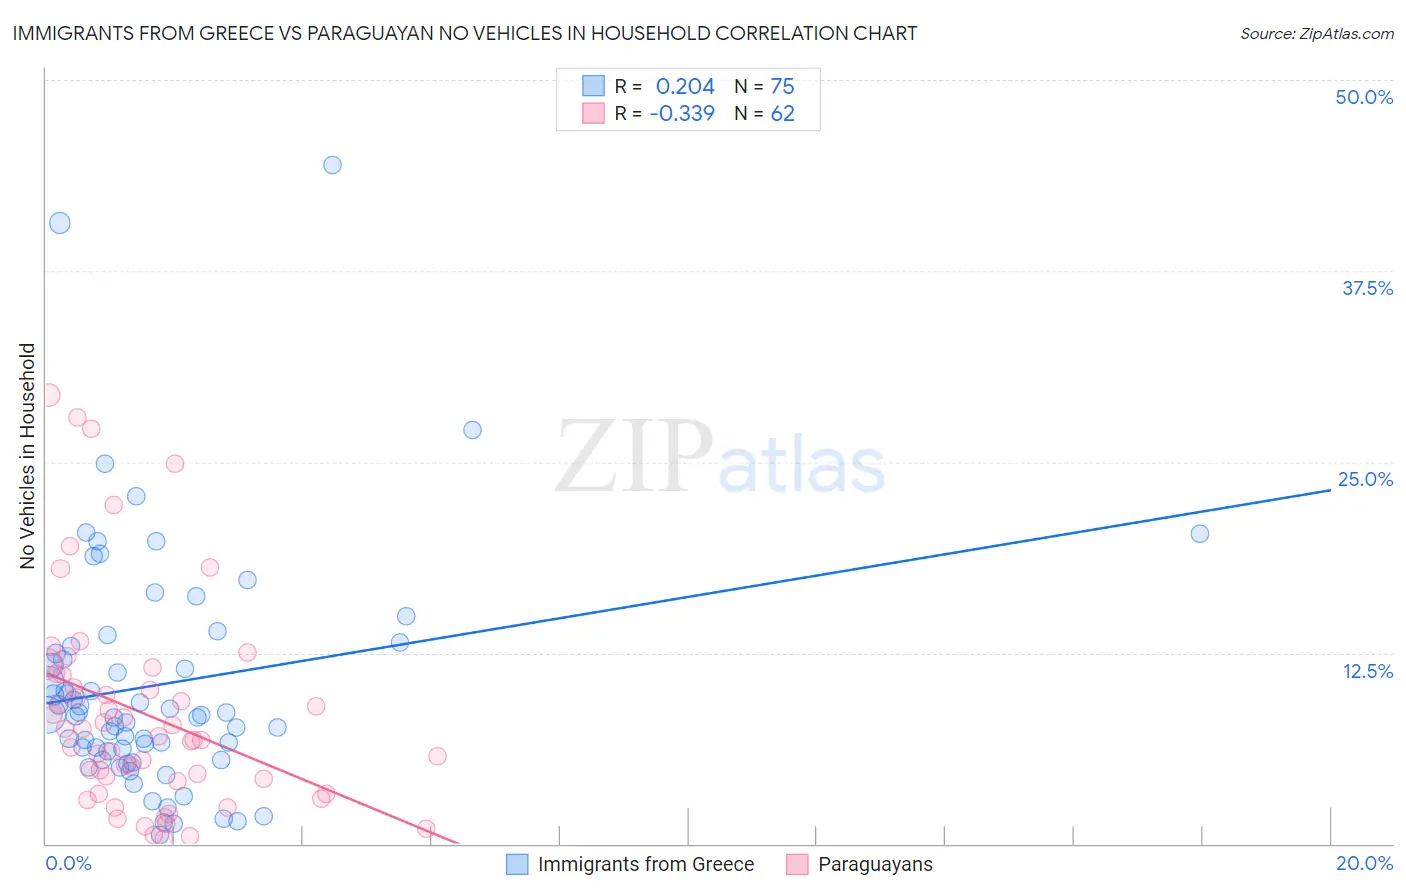
Immigrants from Greece vs Paraguayan No Vehicles in Household Correlation Chart

The statistical analysis conducted on geographies consisting of 216,580,557 people shows a weak positive correlation between the proportion of Immigrants from Greece and percentage of households with no vehicle available in the United States with a correlation coefficient (R) of 0.204 and weighted average of 14.7%. Similarly, the statistical analysis conducted on geographies consisting of 94,954,022 people shows a mild negative correlation between the proportion of Paraguayans and percentage of households with no vehicle available in the United States with a correlation coefficient (R) of -0.339 and weighted average of 14.4%, a difference of 2.4%.
Immigrants from Greece vs Paraguayan No Vehicles in Household

No Vehicles in Household Correlation Summary

MeasurementImmigrants from GreeceParaguayan
Minimum0.60%0.32%
Maximum44.5%29.4%
Range43.9%29.0%
Mean10.4%8.5%
Median8.4%6.9%
Interquartile 25% (IQ1)6.1%4.1%
Interquartile 75% (IQ3)13.0%11.1%
Interquartile Range (IQR)6.9%7.0%
Standard Deviation (Sample)7.9%6.9%
Standard Deviation (Population)7.8%6.8%

Demographics Similar to Immigrants from Greece and Paraguayans by No Vehicles in Household

In terms of no vehicles in household, the demographic groups most similar to Immigrants from Greece are Moroccan (14.7%, a difference of 0.20%), Immigrants from Panama (14.6%, a difference of 0.35%), Immigrants from Spain (14.5%, a difference of 1.0%), Yuman (14.9%, a difference of 1.1%), and Immigrants from Ukraine (14.9%, a difference of 1.1%). Similarly, the demographic groups most similar to Paraguayans are Belizean (14.3%, a difference of 0.13%), Immigrants from Jamaica (14.2%, a difference of 0.91%), Immigrants from Spain (14.5%, a difference of 1.3%), Pima (14.1%, a difference of 1.6%), and Immigrants from Panama (14.6%, a difference of 2.0%).
DemographicsRating | RankNo Vehicles in Household
Immigrants | Ireland
0.0
/100
|
#287
Tragic
13.7%
Hopi
0.0
/100
|
#288
Tragic
13.7%
Immigrants | Australia
0.0
/100
|
#289
Tragic
13.8%
Indians (Asian)
0.0
/100
|
#290
Tragic
14.1%
Okinawans
0.0
/100
|
#291
Tragic
14.1%
Pima
0.0
/100
|
#292
Tragic
14.1%
Immigrants | Jamaica
0.0
/100
|
#293
Tragic
14.2%
Belizeans
0.0
/100
|
#294
Tragic
14.3%
Paraguayans
0.0
/100
|
#295
Tragic
14.4%
Immigrants | Spain
0.0
/100
|
#296
Tragic
14.5%
Immigrants | Panama
0.0
/100
|
#297
Tragic
14.6%
Moroccans
0.0
/100
|
#298
Tragic
14.7%
Immigrants | Greece
0.0
/100
|
#299
Tragic
14.7%
Yuman
0.0
/100
|
#300
Tragic
14.9%
Immigrants | Ukraine
0.0
/100
|
#301
Tragic
14.9%
Haitians
0.0
/100
|
#302
Tragic
14.9%
Immigrants | Western Africa
0.0
/100
|
#303
Tragic
15.0%
Immigrants | Russia
0.0
/100
|
#304
Tragic
15.1%
Immigrants | China
0.0
/100
|
#305
Tragic
15.2%
Immigrants | Belize
0.0
/100
|
#306
Tragic
15.4%
Immigrants | Haiti
0.0
/100
|
#307
Tragic
15.4%