Comanche vs Immigrants from Eastern Africa No Vehicles in Household
COMPARE
Comanche
Immigrants from Eastern Africa
No Vehicles in Household
No Vehicles in Household Comparison
Comanche
Immigrants from Eastern Africa
10.2%
NO VEHICLES IN HOUSEHOLD
60.8/ 100
METRIC RATING
165th/ 347
METRIC RANK
10.0%
NO VEHICLES IN HOUSEHOLD
73.8/ 100
METRIC RATING
151st/ 347
METRIC RANK
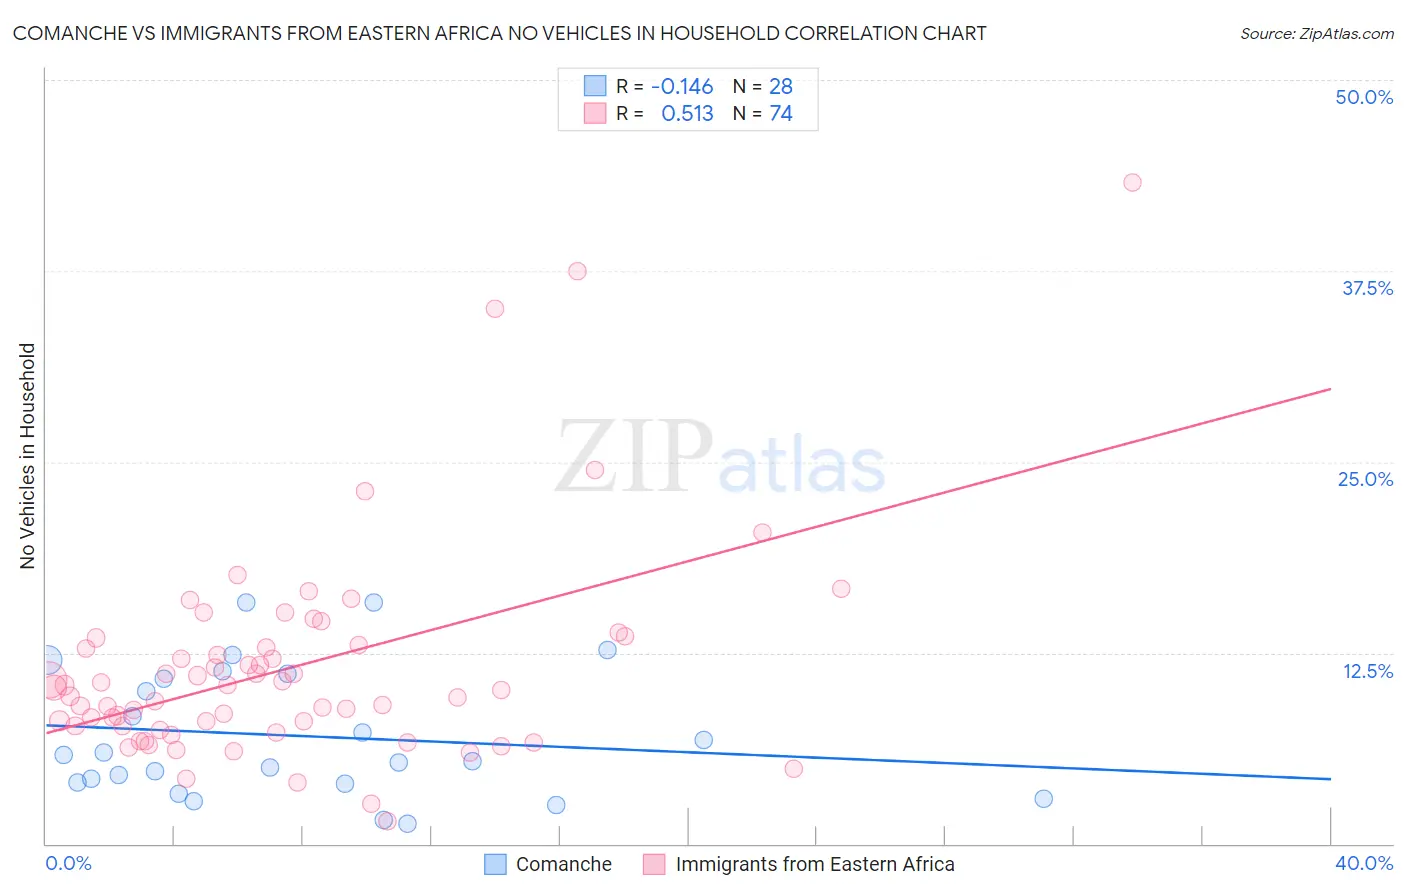
Comanche vs Immigrants from Eastern Africa No Vehicles in Household Correlation Chart
The statistical analysis conducted on geographies consisting of 109,677,271 people shows a poor negative correlation between the proportion of Comanche and percentage of households with no vehicle available in the United States with a correlation coefficient (R) of -0.146 and weighted average of 10.2%. Similarly, the statistical analysis conducted on geographies consisting of 354,399,030 people shows a substantial positive correlation between the proportion of Immigrants from Eastern Africa and percentage of households with no vehicle available in the United States with a correlation coefficient (R) of 0.513 and weighted average of 10.0%, a difference of 2.1%.
No Vehicles in Household Correlation Summary
| Measurement | Comanche | Immigrants from Eastern Africa |
| Minimum | 1.3% | 1.4% |
| Maximum | 15.8% | 43.3% |
| Range | 14.5% | 41.9% |
| Mean | 7.1% | 11.5% |
| Median | 5.6% | 10.1% |
| Interquartile 25% (IQ1) | 4.0% | 7.7% |
| Interquartile 75% (IQ3) | 11.0% | 13.0% |
| Interquartile Range (IQR) | 7.0% | 5.3% |
| Standard Deviation (Sample) | 4.2% | 7.1% |
| Standard Deviation (Population) | 4.1% | 7.0% |
Demographics Similar to Comanche and Immigrants from Eastern Africa by No Vehicles in Household
In terms of no vehicles in household, the demographic groups most similar to Comanche are South African (10.2%, a difference of 0.040%), Immigrants from Costa Rica (10.3%, a difference of 0.050%), Immigrants from Saudi Arabia (10.3%, a difference of 0.30%), Immigrants from Cambodia (10.2%, a difference of 0.42%), and Immigrants from Austria (10.2%, a difference of 0.52%). Similarly, the demographic groups most similar to Immigrants from Eastern Africa are Colombian (10.0%, a difference of 0.010%), Immigrants from Congo (10.1%, a difference of 0.14%), Tlingit-Haida (10.1%, a difference of 0.23%), Sioux (10.1%, a difference of 0.25%), and Salvadoran (10.1%, a difference of 0.26%).
| Demographics | Rating | Rank | No Vehicles in Household |
| Immigrants | Bosnia and Herzegovina | 79.1 /100 | #148 | Good 9.9% |
| Immigrants | Uganda | 76.1 /100 | #149 | Good 10.0% |
| Colombians | 73.9 /100 | #150 | Good 10.0% |
| Immigrants | Eastern Africa | 73.8 /100 | #151 | Good 10.0% |
| Immigrants | Congo | 73.0 /100 | #152 | Good 10.1% |
| Tlingit-Haida | 72.5 /100 | #153 | Good 10.1% |
| Sioux | 72.4 /100 | #154 | Good 10.1% |
| Salvadorans | 72.4 /100 | #155 | Good 10.1% |
| Immigrants | Micronesia | 70.9 /100 | #156 | Good 10.1% |
| Australians | 70.6 /100 | #157 | Good 10.1% |
| Spanish American Indians | 70.2 /100 | #158 | Good 10.1% |
| Immigrants | Indonesia | 69.3 /100 | #159 | Good 10.1% |
| Immigrants | Middle Africa | 65.7 /100 | #160 | Good 10.2% |
| New Zealanders | 65.1 /100 | #161 | Good 10.2% |
| Immigrants | Austria | 64.4 /100 | #162 | Good 10.2% |
| Immigrants | Cambodia | 63.7 /100 | #163 | Good 10.2% |
| South Africans | 61.1 /100 | #164 | Good 10.2% |
| Comanche | 60.8 /100 | #165 | Good 10.2% |
| Immigrants | Costa Rica | 60.5 /100 | #166 | Good 10.3% |
| Immigrants | Saudi Arabia | 58.8 /100 | #167 | Average 10.3% |
| Indonesians | 56.7 /100 | #168 | Average 10.3% |