Assyrian/Chaldean/Syriac vs Immigrants from Zimbabwe No Vehicles in Household

COMPARE

Assyrian/Chaldean/Syriac
Race
Ancestry
AfghanAfricanAlaska NativeAlaskan AthabascanAlbanianAleutAlsatianAmericanApacheArabArapahoArgentineanArmenianAssyrian/Chaldean/SyriacAustralianAustrianBahamianBangladeshiBarbadianBasqueBelgianBelizeanBermudanBhutaneseBlackfeetBolivianBrazilianBritishBritish West IndianBulgarianBurmeseCajunCambodianCanadianCape VerdeanCarpatho RusynCelticCentral AmericanCentral American IndianCherokeeCheyenneChickasawChileanChineseChippewaChoctawColombianColvilleComancheCosta RicanCreeCreekCroatianCrowCubanCypriotCzechCzechoslovakianDanishDelawareDominicanDutchDutch West IndianEastern EuropeanEcuadorianEgyptianEnglishEstonianEthiopianEuropeanFijianFilipinoFinnishFrenchFrench American IndianFrench CanadianGermanGerman RussianGhanaianGreekGuamanian/ChamorroGuatemalanGuyaneseHaitianHmongHonduranHopiHoumaHungarianIcelanderIndian (Asian)IndonesianInupiatIranianIraqiIrishIroquoisIsraeliItalianJamaicanJapaneseJordanianKenyanKiowaKoreanLaotianLatvianLebaneseLiberianLithuanianLumbeeLuxembourgerMacedonianMalaysianMalteseMarshalleseMenomineeMexicanMexican American IndianMongolianMoroccanNative HawaiianNavajoNepaleseNew ZealanderNicaraguanNigerianNorthern EuropeanNorwegianOkinawanOsageOttawaPaiutePakistaniPalestinianPanamanianParaguayanPennsylvania GermanPeruvianPimaPolishPortuguesePotawatomiPuebloPuerto RicanPuget Sound SalishRomanianRussianSalvadoranSamoanScandinavianScotch-IrishScottishSeminoleSenegaleseSerbianShoshoneSierra LeoneanSiouxSlavicSlovakSloveneSomaliSouth AfricanSouth AmericanSouth American IndianSoviet UnionSpaniardSpanishSpanish AmericanSpanish American IndianSri LankanSubsaharan AfricanSudaneseSwedishSwissSyrianTaiwaneseThaiTlingit-HaidaTohono O'OdhamTonganTrinidadian and TobagonianTsimshianTurkishU.S. Virgin IslanderUgandanUkrainianUruguayanUteVenezuelanVietnameseWelshWest IndianYakamaYaquiYugoslavianYumanYup'ikZimbabwean
Immigration
NonimmigrantsImmigrantsAfghanistanAfricaAlbaniaArgentinaArmeniaAsiaAustraliaAustriaBahamasBangladeshBarbadosBelarusBelgiumBelizeBoliviaBosnia and HerzegovinaBrazilBulgariaBurma/MyanmarCabo VerdeCambodiaCameroonCanadaCaribbeanCentral AmericaChileChinaColombiaCongoCosta RicaCroatiaCubaCzechoslovakiaDenmarkDominicaDominican RepublicEastern AfricaEastern AsiaEastern EuropeEcuadorEgyptEl SalvadorEnglandEritreaEthiopiaEuropeFijiFranceGermanyGhanaGreeceGrenadaGuatemalaGuyanaHaitiHondurasHong KongHungaryIndiaIndonesiaIranIraqIrelandIsraelItalyJamaicaJapanJordanKazakhstanKenyaKoreaKuwaitLaosLatin AmericaLatviaLebanonLiberiaLithuaniaMalaysiaMexicoMicronesiaMiddle AfricaMoldovaMoroccoNepalNetherlandsNicaraguaNigeriaNorth AmericaNorth MacedoniaNorthern AfricaNorthern EuropeNorwayOceaniaPakistanPanamaPeruPhilippinesPolandPortugalRomaniaRussiaSaudi ArabiaScotlandSenegalSerbiaSierra LeoneSingaporeSomaliaSouth AfricaSouth AmericaSouth Central AsiaSouth Eastern AsiaSouthern EuropeSpainSri LankaSt. Vincent and the GrenadinesSudanSwedenSwitzerlandSyriaTaiwanThailandTrinidad and TobagoTurkeyUgandaUkraineUruguayUzbekistanVenezuelaVietnamWest IndiesWestern AfricaWestern AsiaWestern EuropeYemenZaireAzores
Immigrants from Zimbabwe
Race
Ancestry
AfghanAfricanAlaska NativeAlaskan AthabascanAlbanianAleutAlsatianAmericanApacheArabArapahoArgentineanArmenianAustralianAustrianBahamianBangladeshiBarbadianBasqueBelgianBelizeanBermudanBhutaneseBlackfeetBolivianBrazilianBritishBritish West IndianBulgarianBurmeseCajunCambodianCanadianCape VerdeanCarpatho RusynCelticCentral AmericanCentral American IndianCherokeeCheyenneChickasawChileanChineseChippewaChoctawColombianColvilleComancheCosta RicanCreeCreekCroatianCrowCubanCypriotCzechCzechoslovakianDanishDelawareDominicanDutchDutch West IndianEastern EuropeanEcuadorianEgyptianEnglishEstonianEthiopianEuropeanFijianFilipinoFinnishFrenchFrench American IndianFrench CanadianGermanGerman RussianGhanaianGreekGuamanian/ChamorroGuatemalanGuyaneseHaitianHmongHonduranHopiHoumaHungarianIcelanderIndian (Asian)IndonesianInupiatIranianIraqiIrishIroquoisIsraeliItalianJamaicanJapaneseJordanianKenyanKiowaKoreanLaotianLatvianLebaneseLiberianLithuanianLumbeeLuxembourgerMacedonianMalaysianMalteseMarshalleseMenomineeMexicanMexican American IndianMongolianMoroccanNative HawaiianNavajoNepaleseNew ZealanderNicaraguanNigerianNorthern EuropeanNorwegianOkinawanOsageOttawaPaiutePakistaniPalestinianPanamanianParaguayanPennsylvania GermanPeruvianPimaPolishPortuguesePotawatomiPuebloPuerto RicanPuget Sound SalishRomanianRussianSalvadoranSamoanScandinavianScotch-IrishScottishSeminoleSenegaleseSerbianShoshoneSierra LeoneanSiouxSlavicSlovakSloveneSomaliSouth AfricanSouth AmericanSouth American IndianSoviet UnionSpaniardSpanishSpanish AmericanSpanish American IndianSri LankanSubsaharan AfricanSudaneseSwedishSwissSyrianTaiwaneseThaiTlingit-HaidaTohono O'OdhamTonganTrinidadian and TobagonianTsimshianTurkishU.S. Virgin IslanderUgandanUkrainianUruguayanUteVenezuelanVietnameseWelshWest IndianYakamaYaquiYugoslavianYumanYup'ikZimbabwean
Immigration
NonimmigrantsImmigrantsAfghanistanAfricaAlbaniaArgentinaArmeniaAsiaAustraliaAustriaBahamasBangladeshBarbadosBelarusBelgiumBelizeBoliviaBosnia and HerzegovinaBrazilBulgariaBurma/MyanmarCabo VerdeCambodiaCameroonCanadaCaribbeanCentral AmericaChileChinaColombiaCongoCosta RicaCroatiaCubaCzechoslovakiaDenmarkDominicaDominican RepublicEastern AfricaEastern AsiaEastern EuropeEcuadorEgyptEl SalvadorEnglandEritreaEthiopiaEuropeFijiFranceGermanyGhanaGreeceGrenadaGuatemalaGuyanaHaitiHondurasHong KongHungaryIndiaIndonesiaIranIraqIrelandIsraelItalyJamaicaJapanJordanKazakhstanKenyaKoreaKuwaitLaosLatin AmericaLatviaLebanonLiberiaLithuaniaMalaysiaMexicoMicronesiaMiddle AfricaMoldovaMoroccoNepalNetherlandsNicaraguaNigeriaNorth AmericaNorth MacedoniaNorthern AfricaNorthern EuropeNorwayOceaniaPakistanPanamaPeruPhilippinesPolandPortugalRomaniaRussiaSaudi ArabiaScotlandSenegalSerbiaSierra LeoneSingaporeSomaliaSouth AfricaSouth AmericaSouth Central AsiaSouth Eastern AsiaSouthern EuropeSpainSri LankaSt. Vincent and the GrenadinesSudanSwedenSwitzerlandSyriaTaiwanThailandTrinidad and TobagoTurkeyUgandaUkraineUruguayUzbekistanVenezuelaVietnamWest IndiesWestern AfricaWestern AsiaWestern EuropeYemenZaireZimbabweAzores
No Vehicles in Household
Income
Poverty
Unemployment
Labor Participation
Family Structure
Vehicle Availability
Education Level
Disability

No Vehicles in Household Comparison

Assyrians/Chaldeans/Syriacs

Immigrants from Zimbabwe

Exceptional
Excellent
7.0%
NO VEHICLES IN HOUSEHOLD
100.0/ 100
METRIC RATING
12th/ 347
METRIC RANK
9.9%
NO VEHICLES IN HOUSEHOLD
82.6/ 100
METRIC RATING
142nd/ 347
METRIC RANK

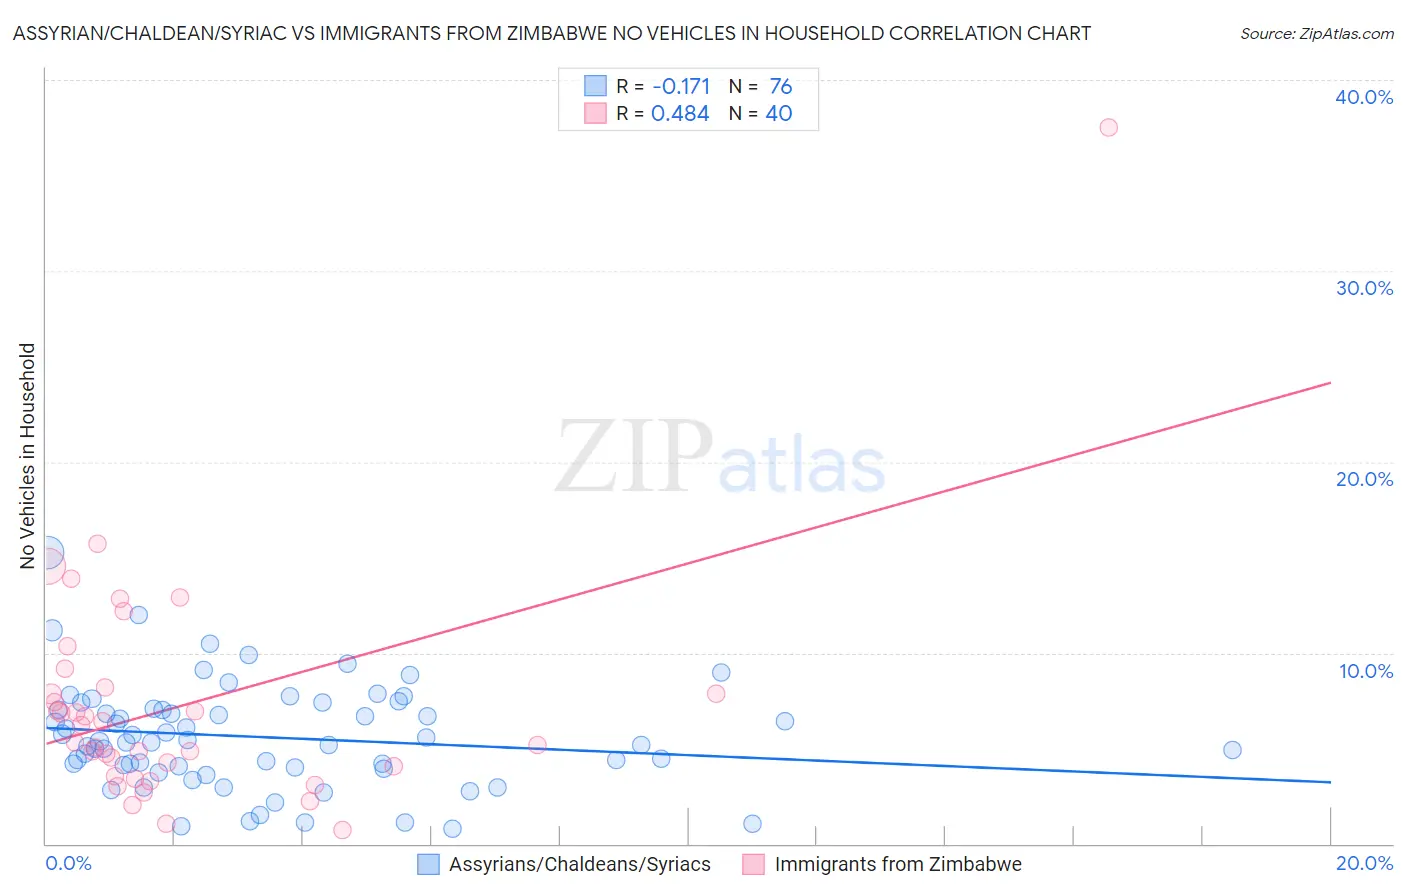
Assyrian/Chaldean/Syriac vs Immigrants from Zimbabwe No Vehicles in Household Correlation Chart

The statistical analysis conducted on geographies consisting of 110,265,900 people shows a poor negative correlation between the proportion of Assyrians/Chaldeans/Syriacs and percentage of households with no vehicle available in the United States with a correlation coefficient (R) of -0.171 and weighted average of 7.0%. Similarly, the statistical analysis conducted on geographies consisting of 117,693,810 people shows a moderate positive correlation between the proportion of Immigrants from Zimbabwe and percentage of households with no vehicle available in the United States with a correlation coefficient (R) of 0.484 and weighted average of 9.9%, a difference of 41.2%.
Assyrian/Chaldean/Syriac vs Immigrants from Zimbabwe No Vehicles in Household

No Vehicles in Household Correlation Summary

MeasurementAssyrian/Chaldean/SyriacImmigrants from Zimbabwe
Minimum0.78%0.74%
Maximum15.3%37.5%
Range14.5%36.8%
Mean5.6%7.2%
Median5.3%5.8%
Interquartile 25% (IQ1)4.0%3.8%
Interquartile 75% (IQ3)7.0%8.0%
Interquartile Range (IQR)3.0%4.2%
Standard Deviation (Sample)2.7%6.2%
Standard Deviation (Population)2.7%6.1%

Similar Demographics by No Vehicles in Household

Demographics Similar to Assyrians/Chaldeans/Syriacs by No Vehicles in Household

In terms of no vehicles in household, the demographic groups most similar to Assyrians/Chaldeans/Syriacs are Scandinavian (7.0%, a difference of 0.50%), Mexican (7.0%, a difference of 0.67%), White/Caucasian (7.0%, a difference of 0.80%), Czech (6.9%, a difference of 1.4%), and European (7.1%, a difference of 2.0%).
DemographicsRating | RankNo Vehicles in Household
Yakama
100.0
/100
|
#5
Exceptional
6.6%
Germans
100.0
/100
|
#6
Exceptional
6.7%
Scottish
100.0
/100
|
#7
Exceptional
6.8%
Swedes
100.0
/100
|
#8
Exceptional
6.8%
Scotch-Irish
100.0
/100
|
#9
Exceptional
6.8%
Dutch
100.0
/100
|
#10
Exceptional
6.8%
Czechs
100.0
/100
|
#11
Exceptional
6.9%
Assyrians/Chaldeans/Syriacs
100.0
/100
|
#12
Exceptional
7.0%
Scandinavians
100.0
/100
|
#13
Exceptional
7.0%
Mexicans
100.0
/100
|
#14
Exceptional
7.0%
Whites/Caucasians
100.0
/100
|
#15
Exceptional
7.0%
Europeans
100.0
/100
|
#16
Exceptional
7.1%
Welsh
100.0
/100
|
#17
Exceptional
7.2%
Tongans
100.0
/100
|
#18
Exceptional
7.2%
Arapaho
100.0
/100
|
#19
Exceptional
7.4%

Demographics Similar to Immigrants from Zimbabwe by No Vehicles in Household

In terms of no vehicles in household, the demographic groups most similar to Immigrants from Zimbabwe are Sudanese (9.8%, a difference of 0.13%), Immigrants from Lithuania (9.8%, a difference of 0.35%), Chilean (9.9%, a difference of 0.35%), Immigrants from Bahamas (9.9%, a difference of 0.35%), and Marshallese (9.8%, a difference of 0.36%).
DemographicsRating | RankNo Vehicles in Household
Latvians
85.1
/100
|
#135
Excellent
9.8%
Immigrants | South Africa
85.0
/100
|
#136
Excellent
9.8%
Immigrants | Moldova
84.6
/100
|
#137
Excellent
9.8%
Estonians
84.2
/100
|
#138
Excellent
9.8%
Marshallese
84.0
/100
|
#139
Excellent
9.8%
Immigrants | Lithuania
84.0
/100
|
#140
Excellent
9.8%
Sudanese
83.1
/100
|
#141
Excellent
9.8%
Immigrants | Zimbabwe
82.6
/100
|
#142
Excellent
9.9%
Chileans
81.2
/100
|
#143
Excellent
9.9%
Immigrants | Bahamas
81.2
/100
|
#144
Excellent
9.9%
Bahamians
81.0
/100
|
#145
Excellent
9.9%
Hungarians
80.0
/100
|
#146
Excellent
9.9%
Immigrants | Nicaragua
79.8
/100
|
#147
Good
9.9%
Immigrants | Bosnia and Herzegovina
79.1
/100
|
#148
Good
9.9%
Immigrants | Uganda
76.1
/100
|
#149
Good
10.0%