Zip Codes with the Highest Percentage of Population Employed in Administrative & Support Services in Saint George, UT
RELATED REPORTS & OPTIONS
Administrative & Support Services
Saint George
Compare Zip Codes
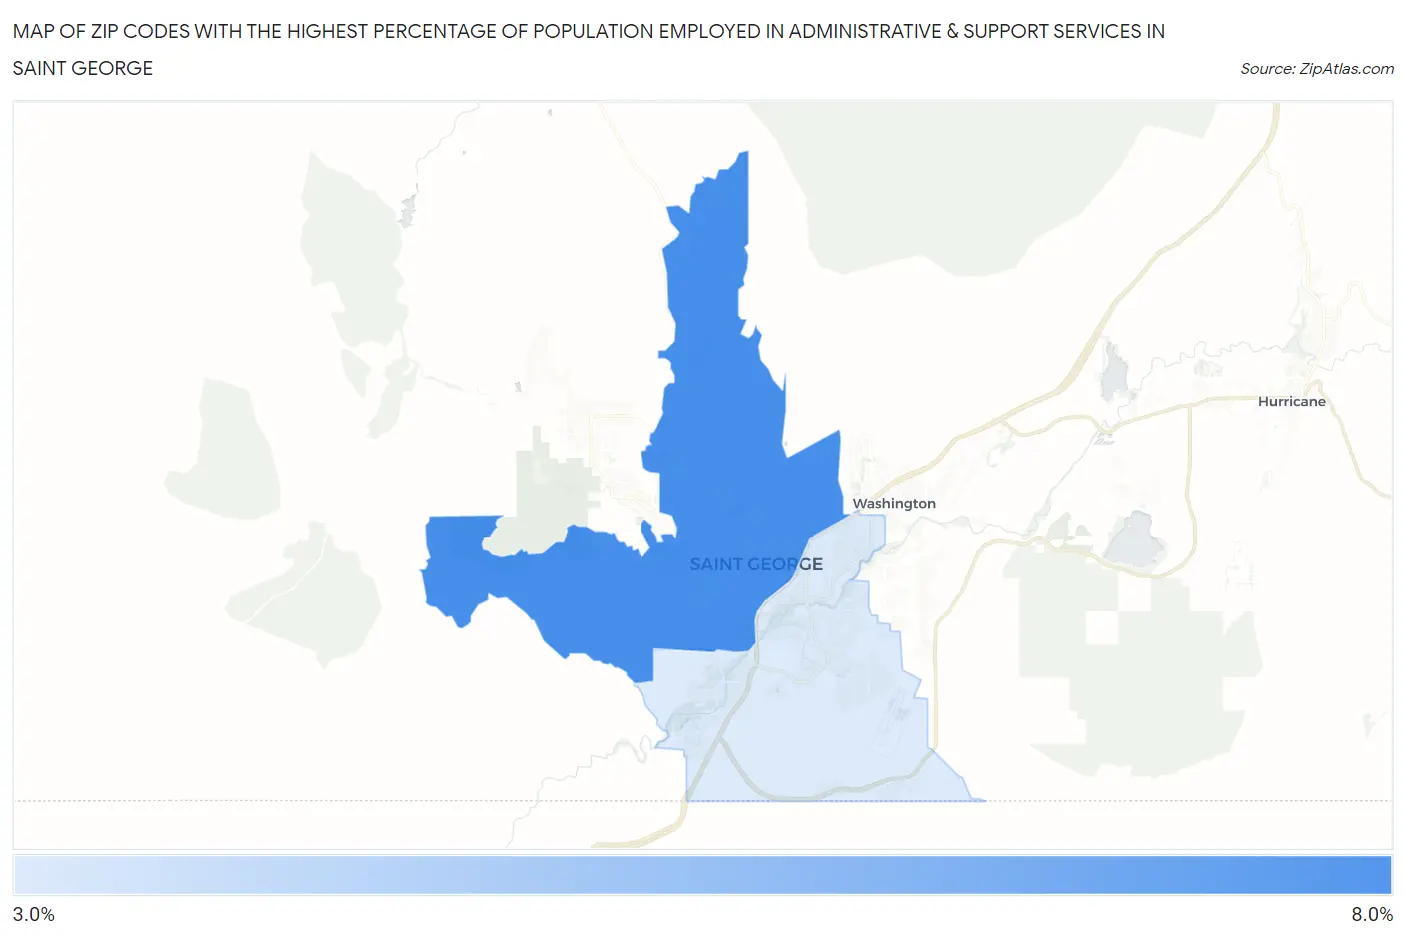
Map of Zip Codes with the Highest Percentage of Population Employed in Administrative & Support Services in Saint George
0.0%
8.0%
Zip Codes with the Highest Percentage of Population Employed in Administrative & Support Services in Saint George, UT
| Zip Code | % Employed | vs State | vs National | |
| 1. | 84770 | 6.4% | 4.3%(+2.10)#34 | 4.1%(+2.25)#4,082 |
| 2. | 84790 | 3.3% | 4.3%(-0.990)#127 | 4.1%(-0.848)#13,929 |
1
Common Questions
What are the Top Zip Codes with the Highest Percentage of Population Employed in Administrative & Support Services in Saint George, UT?
Top Zip Codes with the Highest Percentage of Population Employed in Administrative & Support Services in Saint George, UT are:
What zip code has the Highest Percentage of Population Employed in Administrative & Support Services in Saint George, UT?
84770 has the Highest Percentage of Population Employed in Administrative & Support Services in Saint George, UT with 6.4%.
What is the Percentage of Population Employed in Administrative & Support Services in Utah?
Percentage of Population Employed in Administrative & Support Services in Utah is 4.3%.
What is the Percentage of Population Employed in Administrative & Support Services in the United States?
Percentage of Population Employed in Administrative & Support Services in the United States is 4.1%.