Yup'ik vs Jordanian Unemployment Among Seniors over 75 years
COMPARE
Yup'ik
Jordanian
Unemployment Among Seniors over 75 years
Unemployment Among Seniors over 75 years Comparison
Yup'ik
Jordanians
12.8%
UNEMPLOYMENT AMONG SENIORS OVER 75 YEARS
0.0/ 100
METRIC RATING
340th/ 347
METRIC RANK
9.1%
UNEMPLOYMENT AMONG SENIORS OVER 75 YEARS
4.0/ 100
METRIC RATING
236th/ 347
METRIC RANK
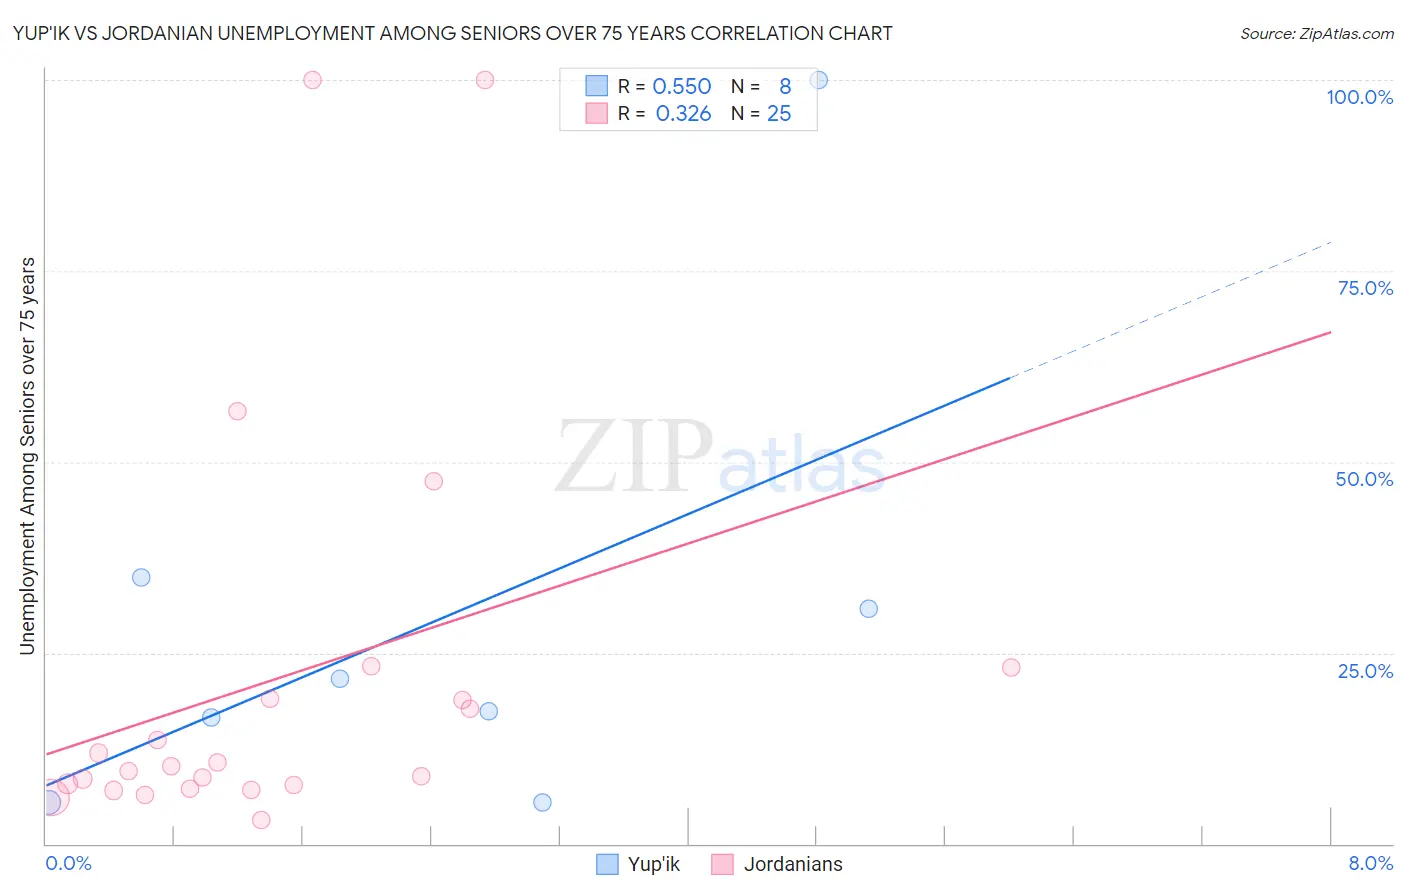
Yup'ik vs Jordanian Unemployment Among Seniors over 75 years Correlation Chart
The statistical analysis conducted on geographies consisting of 32,634,363 people shows a substantial positive correlation between the proportion of Yup'ik and unemployment rate among seniors over the age of 75 in the United States with a correlation coefficient (R) of 0.550 and weighted average of 12.8%. Similarly, the statistical analysis conducted on geographies consisting of 115,202,173 people shows a mild positive correlation between the proportion of Jordanians and unemployment rate among seniors over the age of 75 in the United States with a correlation coefficient (R) of 0.326 and weighted average of 9.1%, a difference of 39.9%.
Unemployment Among Seniors over 75 years Correlation Summary
| Measurement | Yup'ik | Jordanian |
| Minimum | 5.3% | 3.1% |
| Maximum | 100.0% | 100.0% |
| Range | 94.7% | 96.9% |
| Mean | 29.0% | 21.6% |
| Median | 19.5% | 10.1% |
| Interquartile 25% (IQ1) | 11.0% | 7.4% |
| Interquartile 75% (IQ3) | 32.9% | 21.1% |
| Interquartile Range (IQR) | 21.8% | 13.7% |
| Standard Deviation (Sample) | 30.6% | 26.7% |
| Standard Deviation (Population) | 28.6% | 26.2% |
Similar Demographics by Unemployment Among Seniors over 75 years
Demographics Similar to Yup'ik by Unemployment Among Seniors over 75 years
In terms of unemployment among seniors over 75 years, the demographic groups most similar to Yup'ik are Cajun (12.5%, a difference of 2.2%), Immigrants from Cabo Verde (12.3%, a difference of 3.5%), Lumbee (13.5%, a difference of 5.5%), Hmong (13.7%, a difference of 7.6%), and Cape Verdean (11.4%, a difference of 11.8%).
| Demographics | Rating | Rank | Unemployment Among Seniors over 75 years |
| Alaskan Athabascans | 0.0 /100 | #333 | Tragic 11.0% |
| Assyrians/Chaldeans/Syriacs | 0.0 /100 | #334 | Tragic 11.1% |
| French Canadians | 0.0 /100 | #335 | Tragic 11.2% |
| Immigrants | North Macedonia | 0.0 /100 | #336 | Tragic 11.3% |
| Cape Verdeans | 0.0 /100 | #337 | Tragic 11.4% |
| Immigrants | Cabo Verde | 0.0 /100 | #338 | Tragic 12.3% |
| Cajuns | 0.0 /100 | #339 | Tragic 12.5% |
| Yup'ik | 0.0 /100 | #340 | Tragic 12.8% |
| Lumbee | 0.0 /100 | #341 | Tragic 13.5% |
| Hmong | 0.0 /100 | #342 | Tragic 13.7% |
| Alaska Natives | 0.0 /100 | #343 | Tragic 14.7% |
| Immigrants | Yemen | 0.0 /100 | #344 | Tragic 16.5% |
| Yakama | 0.0 /100 | #345 | Tragic 18.4% |
| Tlingit-Haida | 0.0 /100 | #346 | Tragic 20.7% |
Demographics Similar to Jordanians by Unemployment Among Seniors over 75 years
In terms of unemployment among seniors over 75 years, the demographic groups most similar to Jordanians are Panamanian (9.1%, a difference of 0.010%), Houma (9.1%, a difference of 0.030%), Inupiat (9.1%, a difference of 0.13%), Mexican (9.1%, a difference of 0.19%), and Vietnamese (9.1%, a difference of 0.20%).
| Demographics | Rating | Rank | Unemployment Among Seniors over 75 years |
| Hispanics or Latinos | 5.0 /100 | #229 | Tragic 9.1% |
| Northern Europeans | 4.9 /100 | #230 | Tragic 9.1% |
| Immigrants | Central America | 4.9 /100 | #231 | Tragic 9.1% |
| Africans | 4.9 /100 | #232 | Tragic 9.1% |
| Yugoslavians | 4.8 /100 | #233 | Tragic 9.1% |
| Vietnamese | 4.6 /100 | #234 | Tragic 9.1% |
| Panamanians | 4.0 /100 | #235 | Tragic 9.1% |
| Jordanians | 4.0 /100 | #236 | Tragic 9.1% |
| Houma | 3.9 /100 | #237 | Tragic 9.1% |
| Inupiat | 3.6 /100 | #238 | Tragic 9.1% |
| Mexicans | 3.5 /100 | #239 | Tragic 9.1% |
| Spanish | 3.3 /100 | #240 | Tragic 9.1% |
| Immigrants | Southern Europe | 2.8 /100 | #241 | Tragic 9.2% |
| Sierra Leoneans | 2.8 /100 | #242 | Tragic 9.2% |
| Slavs | 2.8 /100 | #243 | Tragic 9.2% |