Yup'ik vs Armenian Female Unemployment
COMPARE
Yup'ik
Armenian
Female Unemployment
Female Unemployment Comparison
Yup'ik
Armenians
10.9%
FEMALE UNEMPLOYMENT
0.0/ 100
METRIC RATING
346th/ 347
METRIC RANK
6.0%
FEMALE UNEMPLOYMENT
0.0/ 100
METRIC RATING
279th/ 347
METRIC RANK
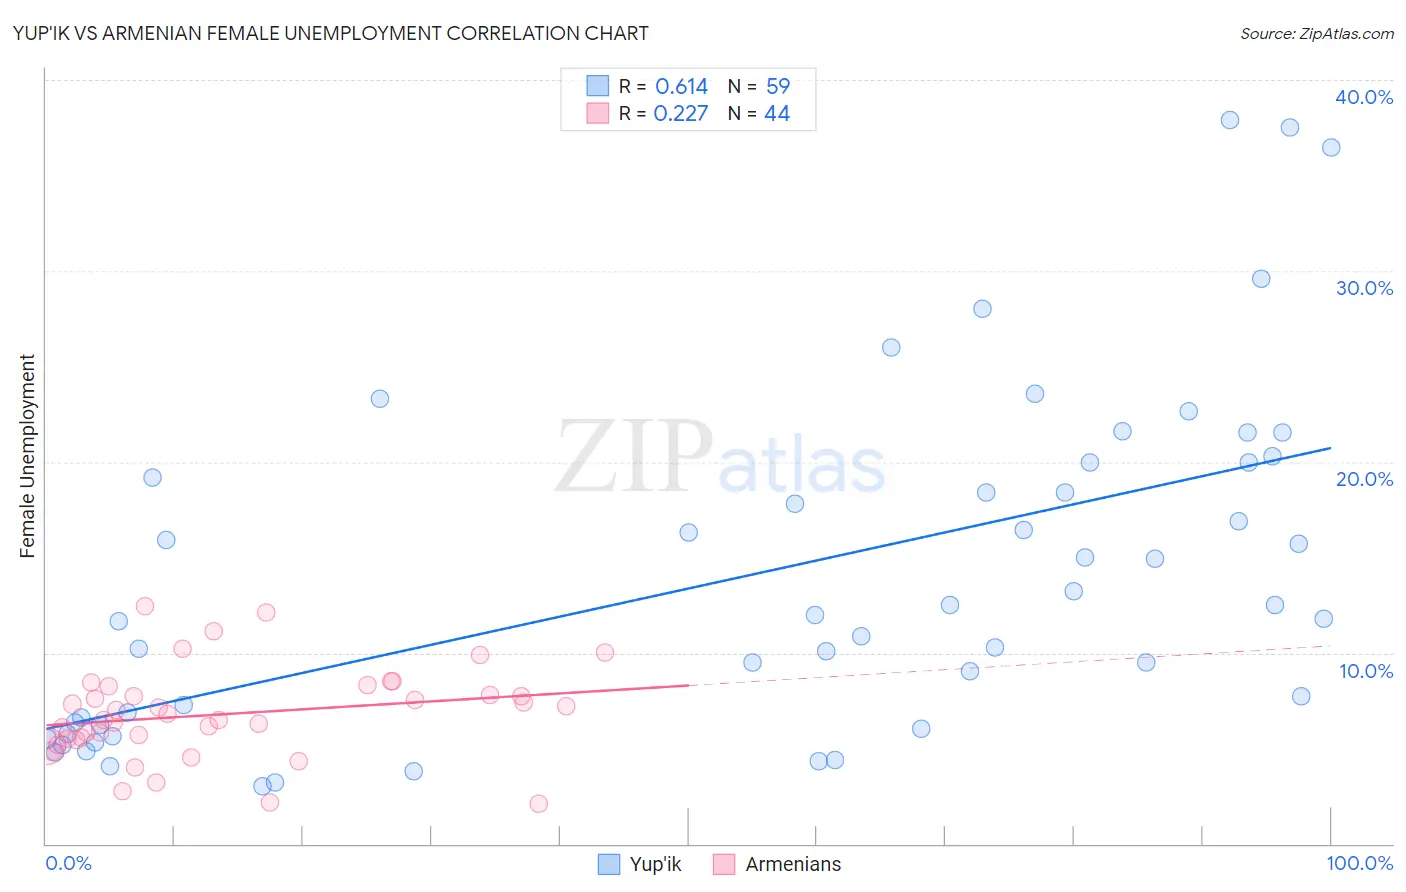
Yup'ik vs Armenian Female Unemployment Correlation Chart
The statistical analysis conducted on geographies consisting of 39,915,126 people shows a significant positive correlation between the proportion of Yup'ik and unemploymnet rate among females in the United States with a correlation coefficient (R) of 0.614 and weighted average of 10.9%. Similarly, the statistical analysis conducted on geographies consisting of 309,860,126 people shows a weak positive correlation between the proportion of Armenians and unemploymnet rate among females in the United States with a correlation coefficient (R) of 0.227 and weighted average of 6.0%, a difference of 80.9%.
Female Unemployment Correlation Summary
| Measurement | Yup'ik | Armenian |
| Minimum | 3.0% | 2.1% |
| Maximum | 37.9% | 12.4% |
| Range | 34.9% | 10.3% |
| Mean | 14.0% | 6.8% |
| Median | 12.0% | 6.7% |
| Interquartile 25% (IQ1) | 6.2% | 5.5% |
| Interquartile 75% (IQ3) | 20.0% | 8.0% |
| Interquartile Range (IQR) | 13.8% | 2.6% |
| Standard Deviation (Sample) | 8.8% | 2.4% |
| Standard Deviation (Population) | 8.8% | 2.3% |
Similar Demographics by Female Unemployment
Demographics Similar to Yup'ik by Female Unemployment
In terms of female unemployment, the demographic groups most similar to Yup'ik are Crow (12.1%, a difference of 11.5%), Yuman (9.6%, a difference of 13.4%), Pima (9.3%, a difference of 16.5%), Arapaho (8.8%, a difference of 23.7%), and Puerto Rican (8.3%, a difference of 30.4%).
| Demographics | Rating | Rank | Female Unemployment |
| Menominee | 0.0 /100 | #333 | Tragic 7.0% |
| Immigrants | Armenia | 0.0 /100 | #334 | Tragic 7.1% |
| Dominicans | 0.0 /100 | #335 | Tragic 7.2% |
| Immigrants | Dominican Republic | 0.0 /100 | #336 | Tragic 7.2% |
| Navajo | 0.0 /100 | #337 | Tragic 7.3% |
| Tohono O'odham | 0.0 /100 | #338 | Tragic 7.7% |
| Immigrants | Yemen | 0.0 /100 | #339 | Tragic 7.8% |
| Hopi | 0.0 /100 | #340 | Tragic 8.1% |
| Inupiat | 0.0 /100 | #341 | Tragic 8.2% |
| Puerto Ricans | 0.0 /100 | #342 | Tragic 8.3% |
| Arapaho | 0.0 /100 | #343 | Tragic 8.8% |
| Pima | 0.0 /100 | #344 | Tragic 9.3% |
| Yuman | 0.0 /100 | #345 | Tragic 9.6% |
| Yup'ik | 0.0 /100 | #346 | Tragic 10.9% |
| Crow | 0.0 /100 | #347 | Tragic 12.1% |
Demographics Similar to Armenians by Female Unemployment
In terms of female unemployment, the demographic groups most similar to Armenians are Mexican American Indian (6.0%, a difference of 0.060%), Guatemalan (6.0%, a difference of 0.090%), Yaqui (6.0%, a difference of 0.11%), Immigrants from Ghana (6.0%, a difference of 0.12%), and Colville (6.0%, a difference of 0.37%).
| Demographics | Rating | Rank | Female Unemployment |
| Lumbee | 0.0 /100 | #272 | Tragic 5.9% |
| Ghanaians | 0.0 /100 | #273 | Tragic 5.9% |
| Africans | 0.0 /100 | #274 | Tragic 5.9% |
| Senegalese | 0.0 /100 | #275 | Tragic 6.0% |
| Bahamians | 0.0 /100 | #276 | Tragic 6.0% |
| Immigrants | Ghana | 0.0 /100 | #277 | Tragic 6.0% |
| Yaqui | 0.0 /100 | #278 | Tragic 6.0% |
| Armenians | 0.0 /100 | #279 | Tragic 6.0% |
| Mexican American Indians | 0.0 /100 | #280 | Tragic 6.0% |
| Guatemalans | 0.0 /100 | #281 | Tragic 6.0% |
| Colville | 0.0 /100 | #282 | Tragic 6.0% |
| Salvadorans | 0.0 /100 | #283 | Tragic 6.0% |
| Immigrants | Senegal | 0.0 /100 | #284 | Tragic 6.1% |
| Immigrants | Cabo Verde | 0.0 /100 | #285 | Tragic 6.1% |
| Chippewa | 0.0 /100 | #286 | Tragic 6.1% |