Yaqui vs Immigrants from Colombia Unemployment Among Ages 25 to 29 years

COMPARE

Yaqui
Race
Ancestry
AfghanAfricanAlaska NativeAlaskan AthabascanAlbanianAleutAlsatianAmericanApacheArabArapahoArgentineanArmenianAssyrian/Chaldean/SyriacAustralianAustrianBahamianBangladeshiBarbadianBasqueBelgianBelizeanBermudanBhutaneseBlackfeetBolivianBrazilianBritishBritish West IndianBulgarianBurmeseCajunCambodianCanadianCape VerdeanCarpatho RusynCelticCentral AmericanCentral American IndianCherokeeCheyenneChickasawChileanChineseChippewaChoctawColombianColvilleComancheCosta RicanCreeCreekCroatianCrowCubanCypriotCzechCzechoslovakianDanishDelawareDominicanDutchDutch West IndianEastern EuropeanEcuadorianEgyptianEnglishEstonianEthiopianEuropeanFijianFilipinoFinnishFrenchFrench American IndianFrench CanadianGermanGerman RussianGhanaianGreekGuamanian/ChamorroGuatemalanGuyaneseHaitianHmongHonduranHopiHoumaHungarianIcelanderIndian (Asian)IndonesianInupiatIranianIraqiIrishIroquoisIsraeliItalianJamaicanJapaneseJordanianKenyanKiowaKoreanLaotianLatvianLebaneseLiberianLithuanianLumbeeLuxembourgerMacedonianMalaysianMalteseMarshalleseMenomineeMexicanMexican American IndianMongolianMoroccanNative HawaiianNavajoNepaleseNew ZealanderNicaraguanNigerianNorthern EuropeanNorwegianOkinawanOsageOttawaPaiutePakistaniPalestinianPanamanianParaguayanPennsylvania GermanPeruvianPimaPolishPortuguesePotawatomiPuebloPuerto RicanPuget Sound SalishRomanianRussianSalvadoranSamoanScandinavianScotch-IrishScottishSeminoleSenegaleseSerbianShoshoneSierra LeoneanSiouxSlavicSlovakSloveneSomaliSouth AfricanSouth AmericanSouth American IndianSoviet UnionSpaniardSpanishSpanish AmericanSpanish American IndianSri LankanSubsaharan AfricanSudaneseSwedishSwissSyrianTaiwaneseThaiTlingit-HaidaTohono O'OdhamTonganTrinidadian and TobagonianTsimshianTurkishU.S. Virgin IslanderUgandanUkrainianUruguayanUteVenezuelanVietnameseWelshWest IndianYakamaYaquiYugoslavianYumanYup'ikZimbabwean
Immigration
NonimmigrantsImmigrantsAfghanistanAfricaAlbaniaArgentinaArmeniaAsiaAustraliaAustriaBahamasBangladeshBarbadosBelarusBelgiumBelizeBoliviaBosnia and HerzegovinaBrazilBulgariaBurma/MyanmarCabo VerdeCambodiaCameroonCanadaCaribbeanCentral AmericaChileChinaCongoCosta RicaCroatiaCubaCzechoslovakiaDenmarkDominicaDominican RepublicEastern AfricaEastern AsiaEastern EuropeEcuadorEgyptEl SalvadorEnglandEritreaEthiopiaEuropeFijiFranceGermanyGhanaGreeceGrenadaGuatemalaGuyanaHaitiHondurasHong KongHungaryIndiaIndonesiaIranIraqIrelandIsraelItalyJamaicaJapanJordanKazakhstanKenyaKoreaKuwaitLaosLatin AmericaLatviaLebanonLiberiaLithuaniaMalaysiaMexicoMicronesiaMiddle AfricaMoldovaMoroccoNepalNetherlandsNicaraguaNigeriaNorth AmericaNorth MacedoniaNorthern AfricaNorthern EuropeNorwayOceaniaPakistanPanamaPeruPhilippinesPolandPortugalRomaniaRussiaSaudi ArabiaScotlandSenegalSerbiaSierra LeoneSingaporeSomaliaSouth AfricaSouth AmericaSouth Central AsiaSouth Eastern AsiaSouthern EuropeSpainSri LankaSt. Vincent and the GrenadinesSudanSwedenSwitzerlandSyriaTaiwanThailandTrinidad and TobagoTurkeyUgandaUkraineUruguayUzbekistanVenezuelaVietnamWest IndiesWestern AfricaWestern AsiaWestern EuropeYemenZaireZimbabweAzores
Immigrants from Colombia
Race
Ancestry
AfghanAfricanAlaska NativeAlaskan AthabascanAlbanianAleutAlsatianAmericanApacheArabArapahoArgentineanArmenianAssyrian/Chaldean/SyriacAustralianAustrianBahamianBangladeshiBarbadianBasqueBelgianBelizeanBermudanBhutaneseBlackfeetBolivianBrazilianBritishBritish West IndianBulgarianBurmeseCajunCambodianCanadianCape VerdeanCarpatho RusynCelticCentral AmericanCentral American IndianCherokeeCheyenneChickasawChileanChineseChippewaChoctawColombianColvilleComancheCosta RicanCreeCreekCroatianCrowCubanCypriotCzechCzechoslovakianDanishDelawareDominicanDutchDutch West IndianEastern EuropeanEcuadorianEgyptianEnglishEstonianEthiopianEuropeanFijianFilipinoFinnishFrenchFrench American IndianFrench CanadianGermanGerman RussianGhanaianGreekGuamanian/ChamorroGuatemalanGuyaneseHaitianHmongHonduranHopiHoumaHungarianIcelanderIndian (Asian)IndonesianInupiatIranianIraqiIrishIroquoisIsraeliItalianJamaicanJapaneseJordanianKenyanKiowaKoreanLaotianLatvianLebaneseLiberianLithuanianLumbeeLuxembourgerMacedonianMalaysianMalteseMarshalleseMenomineeMexicanMexican American IndianMongolianMoroccanNative HawaiianNavajoNepaleseNew ZealanderNicaraguanNigerianNorthern EuropeanNorwegianOkinawanOsageOttawaPaiutePakistaniPalestinianPanamanianParaguayanPennsylvania GermanPeruvianPimaPolishPortuguesePotawatomiPuebloPuerto RicanPuget Sound SalishRomanianRussianSalvadoranSamoanScandinavianScotch-IrishScottishSeminoleSenegaleseSerbianShoshoneSierra LeoneanSiouxSlavicSlovakSloveneSomaliSouth AfricanSouth AmericanSouth American IndianSoviet UnionSpaniardSpanishSpanish AmericanSpanish American IndianSri LankanSubsaharan AfricanSudaneseSwedishSwissSyrianTaiwaneseThaiTlingit-HaidaTohono O'OdhamTonganTrinidadian and TobagonianTsimshianTurkishU.S. Virgin IslanderUgandanUkrainianUruguayanUteVenezuelanVietnameseWelshWest IndianYakamaYugoslavianYumanYup'ikZimbabwean
Immigration
NonimmigrantsImmigrantsAfghanistanAfricaAlbaniaArgentinaArmeniaAsiaAustraliaAustriaBahamasBangladeshBarbadosBelarusBelgiumBelizeBoliviaBosnia and HerzegovinaBrazilBulgariaBurma/MyanmarCabo VerdeCambodiaCameroonCanadaCaribbeanCentral AmericaChileChinaColombiaCongoCosta RicaCroatiaCubaCzechoslovakiaDenmarkDominicaDominican RepublicEastern AfricaEastern AsiaEastern EuropeEcuadorEgyptEl SalvadorEnglandEritreaEthiopiaEuropeFijiFranceGermanyGhanaGreeceGrenadaGuatemalaGuyanaHaitiHondurasHong KongHungaryIndiaIndonesiaIranIraqIrelandIsraelItalyJamaicaJapanJordanKazakhstanKenyaKoreaKuwaitLaosLatin AmericaLatviaLebanonLiberiaLithuaniaMalaysiaMexicoMicronesiaMiddle AfricaMoldovaMoroccoNepalNetherlandsNicaraguaNigeriaNorth AmericaNorth MacedoniaNorthern AfricaNorthern EuropeNorwayOceaniaPakistanPanamaPeruPhilippinesPolandPortugalRomaniaRussiaSaudi ArabiaScotlandSenegalSerbiaSierra LeoneSingaporeSomaliaSouth AfricaSouth AmericaSouth Central AsiaSouth Eastern AsiaSouthern EuropeSpainSri LankaSt. Vincent and the GrenadinesSudanSwedenSwitzerlandSyriaTaiwanThailandTrinidad and TobagoTurkeyUgandaUkraineUruguayUzbekistanVenezuelaVietnamWest IndiesWestern AfricaWestern AsiaWestern EuropeYemenZaireZimbabweAzores
Unemployment Among Ages 25 to 29 years
Income
Poverty
Unemployment
Labor Participation
Family Structure
Vehicle Availability
Education Level
Disability

Unemployment Among Ages 25 to 29 years Comparison

Yaqui

Immigrants from Colombia

Tragic
Excellent
7.1%
UNEMPLOYMENT AMONG AGES 25 TO 29 YEARS
1.0/ 100
METRIC RATING
243rd/ 347
METRIC RANK
6.4%
UNEMPLOYMENT AMONG AGES 25 TO 29 YEARS
87.6/ 100
METRIC RATING
111th/ 347
METRIC RANK

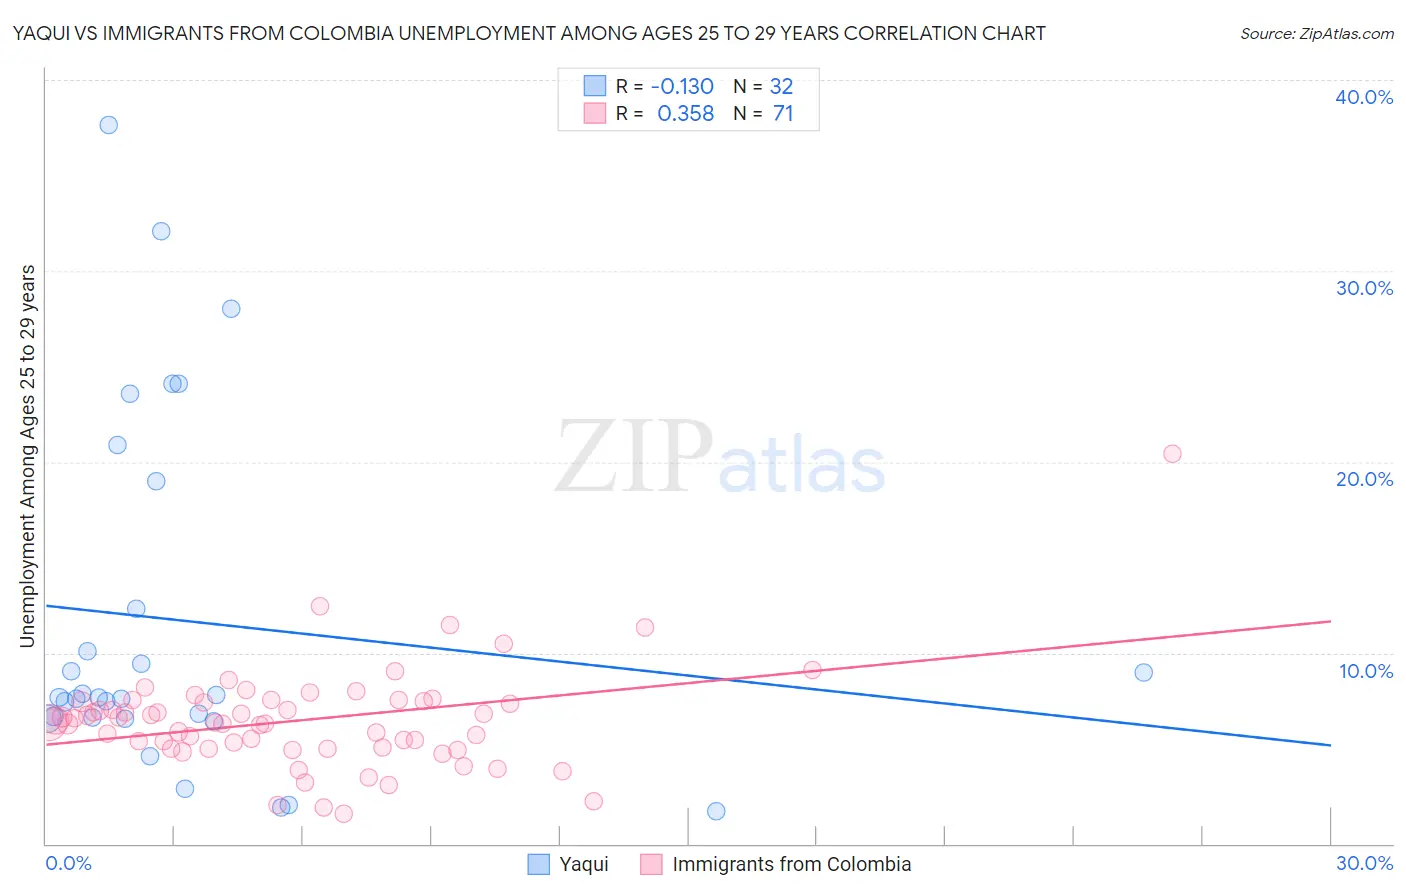
Yaqui vs Immigrants from Colombia Unemployment Among Ages 25 to 29 years Correlation Chart

The statistical analysis conducted on geographies consisting of 106,484,946 people shows a poor negative correlation between the proportion of Yaqui and unemployment rate among population between the ages 25 and 29 in the United States with a correlation coefficient (R) of -0.130 and weighted average of 7.1%. Similarly, the statistical analysis conducted on geographies consisting of 362,771,593 people shows a mild positive correlation between the proportion of Immigrants from Colombia and unemployment rate among population between the ages 25 and 29 in the United States with a correlation coefficient (R) of 0.358 and weighted average of 6.4%, a difference of 10.4%.
Yaqui vs Immigrants from Colombia Unemployment Among Ages 25 to 29 years

Unemployment Among Ages 25 to 29 years Correlation Summary

MeasurementYaquiImmigrants from Colombia
Minimum1.7%1.6%
Maximum37.6%20.4%
Range35.9%18.8%
Mean11.7%6.5%
Median7.7%6.3%
Interquartile 25% (IQ1)6.6%5.0%
Interquartile 75% (IQ3)15.7%7.4%
Interquartile Range (IQR)9.1%2.4%
Standard Deviation (Sample)9.3%2.7%
Standard Deviation (Population)9.1%2.7%

Similar Demographics by Unemployment Among Ages 25 to 29 years

Demographics Similar to Yaqui by Unemployment Among Ages 25 to 29 years

In terms of unemployment among ages 25 to 29 years, the demographic groups most similar to Yaqui are Nonimmigrants (7.1%, a difference of 0.030%), Spanish American Indian (7.1%, a difference of 0.13%), Guatemalan (7.1%, a difference of 0.13%), Immigrants from Sierra Leone (7.1%, a difference of 0.39%), and Native Hawaiian (7.1%, a difference of 0.43%).
DemographicsRating | RankUnemployment Among Ages 25 to 29 years
Cape Verdeans
1.9
/100
|
#236
Tragic
7.0%
Puget Sound Salish
1.8
/100
|
#237
Tragic
7.1%
Hondurans
1.8
/100
|
#238
Tragic
7.1%
Potawatomi
1.3
/100
|
#239
Tragic
7.1%
Native Hawaiians
1.3
/100
|
#240
Tragic
7.1%
Immigrants | Sierra Leone
1.3
/100
|
#241
Tragic
7.1%
Spanish American Indians
1.1
/100
|
#242
Tragic
7.1%
Yaqui
1.0
/100
|
#243
Tragic
7.1%
Immigrants | Nonimmigrants
0.9
/100
|
#244
Tragic
7.1%
Guatemalans
0.9
/100
|
#245
Tragic
7.1%
Immigrants | Uzbekistan
0.7
/100
|
#246
Tragic
7.2%
Immigrants | Guatemala
0.7
/100
|
#247
Tragic
7.2%
Sub-Saharan Africans
0.6
/100
|
#248
Tragic
7.2%
Seminole
0.6
/100
|
#249
Tragic
7.2%
Delaware
0.5
/100
|
#250
Tragic
7.2%

Demographics Similar to Immigrants from Colombia by Unemployment Among Ages 25 to 29 years

In terms of unemployment among ages 25 to 29 years, the demographic groups most similar to Immigrants from Colombia are Immigrants from Nicaragua (6.4%, a difference of 0.020%), European (6.4%, a difference of 0.040%), Immigrants from Albania (6.4%, a difference of 0.050%), Immigrants from Egypt (6.5%, a difference of 0.070%), and Croatian (6.4%, a difference of 0.090%).
DemographicsRating | RankUnemployment Among Ages 25 to 29 years
Cypriots
90.1
/100
|
#104
Exceptional
6.4%
Immigrants | Kazakhstan
89.8
/100
|
#105
Excellent
6.4%
Immigrants | Hungary
89.4
/100
|
#106
Excellent
6.4%
Swiss
88.6
/100
|
#107
Excellent
6.4%
Croatians
88.2
/100
|
#108
Excellent
6.4%
Immigrants | Albania
87.9
/100
|
#109
Excellent
6.4%
Europeans
87.8
/100
|
#110
Excellent
6.4%
Immigrants | Colombia
87.6
/100
|
#111
Excellent
6.4%
Immigrants | Nicaragua
87.5
/100
|
#112
Excellent
6.4%
Immigrants | Egypt
87.1
/100
|
#113
Excellent
6.5%
Germans
86.3
/100
|
#114
Excellent
6.5%
Macedonians
86.1
/100
|
#115
Excellent
6.5%
Pakistanis
85.9
/100
|
#116
Excellent
6.5%
Immigrants | Uruguay
85.7
/100
|
#117
Excellent
6.5%
Chileans
85.3
/100
|
#118
Excellent
6.5%