Yakama vs Immigrants from Micronesia Unemployment Among Ages 25 to 29 years
COMPARE
Yakama
Immigrants from Micronesia
Unemployment Among Ages 25 to 29 years
Unemployment Among Ages 25 to 29 years Comparison
Yakama
Immigrants from Micronesia
8.8%
UNEMPLOYMENT AMONG AGES 25 TO 29 YEARS
0.0/ 100
METRIC RATING
325th/ 347
METRIC RANK
6.6%
UNEMPLOYMENT AMONG AGES 25 TO 29 YEARS
71.5/ 100
METRIC RATING
144th/ 347
METRIC RANK
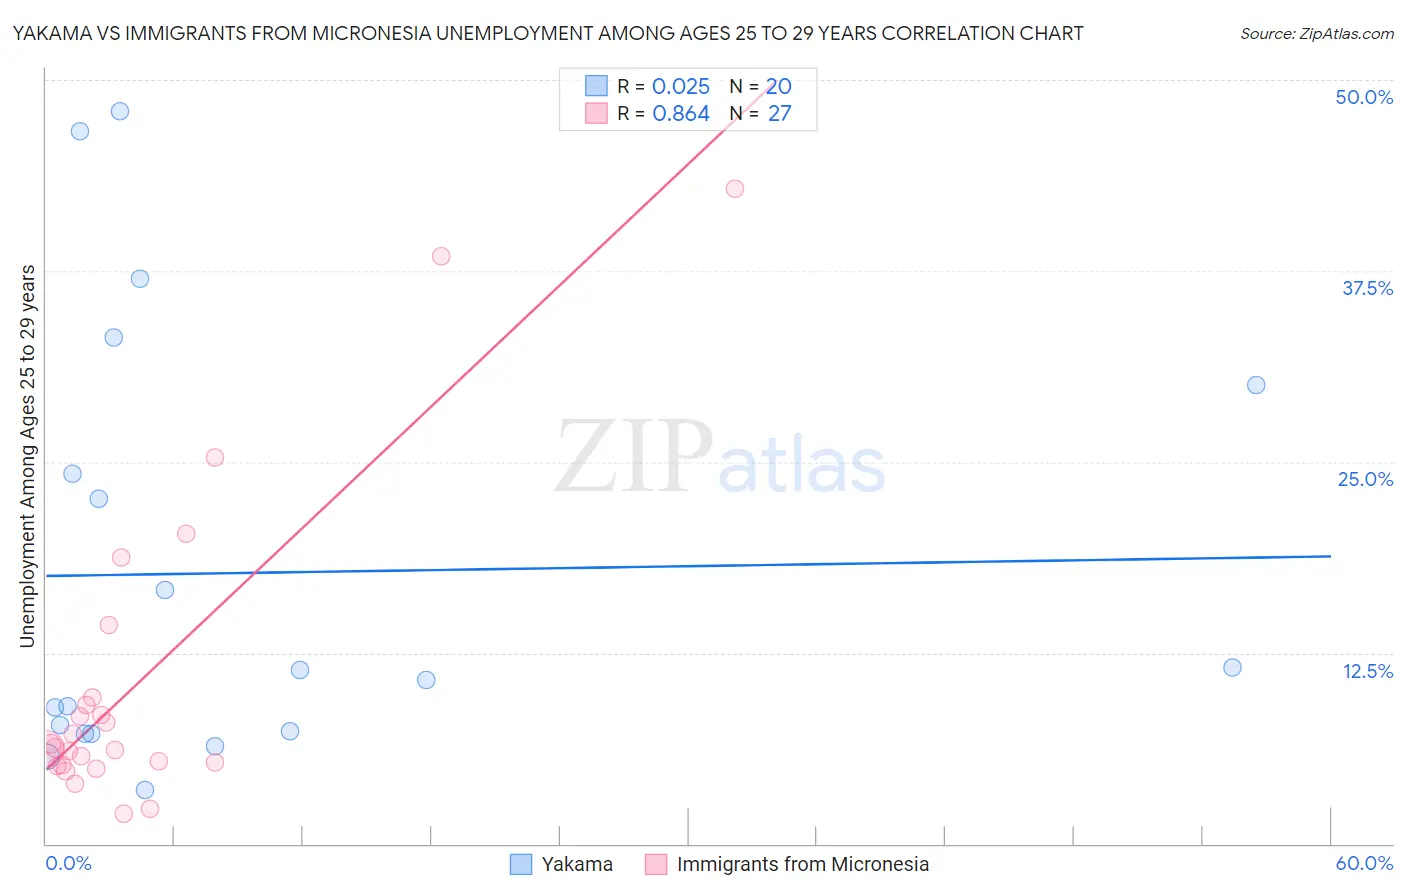
Yakama vs Immigrants from Micronesia Unemployment Among Ages 25 to 29 years Correlation Chart
The statistical analysis conducted on geographies consisting of 19,619,825 people shows no correlation between the proportion of Yakama and unemployment rate among population between the ages 25 and 29 in the United States with a correlation coefficient (R) of 0.025 and weighted average of 8.8%. Similarly, the statistical analysis conducted on geographies consisting of 61,003,486 people shows a very strong positive correlation between the proportion of Immigrants from Micronesia and unemployment rate among population between the ages 25 and 29 in the United States with a correlation coefficient (R) of 0.864 and weighted average of 6.6%, a difference of 33.7%.
Unemployment Among Ages 25 to 29 years Correlation Summary
| Measurement | Yakama | Immigrants from Micronesia |
| Minimum | 3.5% | 2.0% |
| Maximum | 47.9% | 42.9% |
| Range | 44.4% | 40.9% |
| Mean | 17.7% | 10.6% |
| Median | 11.1% | 6.3% |
| Interquartile 25% (IQ1) | 7.3% | 5.2% |
| Interquartile 75% (IQ3) | 27.1% | 9.6% |
| Interquartile Range (IQR) | 19.8% | 4.4% |
| Standard Deviation (Sample) | 14.1% | 10.2% |
| Standard Deviation (Population) | 13.7% | 10.1% |
Similar Demographics by Unemployment Among Ages 25 to 29 years
Demographics Similar to Yakama by Unemployment Among Ages 25 to 29 years
In terms of unemployment among ages 25 to 29 years, the demographic groups most similar to Yakama are Houma (8.7%, a difference of 0.51%), Dominican (8.7%, a difference of 0.87%), Tlingit-Haida (8.7%, a difference of 0.96%), Immigrants from Dominican Republic (8.6%, a difference of 1.8%), and Black/African American (8.6%, a difference of 2.4%).
| Demographics | Rating | Rank | Unemployment Among Ages 25 to 29 years |
| Guyanese | 0.0 /100 | #318 | Tragic 8.5% |
| Immigrants | Armenia | 0.0 /100 | #319 | Tragic 8.5% |
| Blacks/African Americans | 0.0 /100 | #320 | Tragic 8.6% |
| Immigrants | Dominican Republic | 0.0 /100 | #321 | Tragic 8.6% |
| Tlingit-Haida | 0.0 /100 | #322 | Tragic 8.7% |
| Dominicans | 0.0 /100 | #323 | Tragic 8.7% |
| Houma | 0.0 /100 | #324 | Tragic 8.7% |
| Yakama | 0.0 /100 | #325 | Tragic 8.8% |
| Shoshone | 0.0 /100 | #326 | Tragic 9.2% |
| Colville | 0.0 /100 | #327 | Tragic 9.2% |
| Apache | 0.0 /100 | #328 | Tragic 9.5% |
| Aleuts | 0.0 /100 | #329 | Tragic 9.7% |
| Natives/Alaskans | 0.0 /100 | #330 | Tragic 9.8% |
| Alaska Natives | 0.0 /100 | #331 | Tragic 10.2% |
| Pueblo | 0.0 /100 | #332 | Tragic 10.4% |
Demographics Similar to Immigrants from Micronesia by Unemployment Among Ages 25 to 29 years
In terms of unemployment among ages 25 to 29 years, the demographic groups most similar to Immigrants from Micronesia are Lithuanian (6.5%, a difference of 0.050%), Slavic (6.5%, a difference of 0.080%), Nicaraguan (6.6%, a difference of 0.10%), Maltese (6.5%, a difference of 0.11%), and Romanian (6.6%, a difference of 0.16%).
| Demographics | Rating | Rank | Unemployment Among Ages 25 to 29 years |
| Eastern Europeans | 74.1 /100 | #137 | Good 6.5% |
| Immigrants | Belgium | 73.8 /100 | #138 | Good 6.5% |
| Austrians | 73.8 /100 | #139 | Good 6.5% |
| Immigrants | Pakistan | 73.8 /100 | #140 | Good 6.5% |
| Maltese | 72.9 /100 | #141 | Good 6.5% |
| Slavs | 72.5 /100 | #142 | Good 6.5% |
| Lithuanians | 72.2 /100 | #143 | Good 6.5% |
| Immigrants | Micronesia | 71.5 /100 | #144 | Good 6.6% |
| Nicaraguans | 70.2 /100 | #145 | Good 6.6% |
| Romanians | 69.5 /100 | #146 | Good 6.6% |
| Immigrants | Thailand | 68.4 /100 | #147 | Good 6.6% |
| Peruvians | 68.1 /100 | #148 | Good 6.6% |
| Malaysians | 67.1 /100 | #149 | Good 6.6% |
| Finns | 66.9 /100 | #150 | Good 6.6% |
| Ukrainians | 65.5 /100 | #151 | Good 6.6% |