Yakama vs Guyanese Unemployment Among Ages 30 to 34 years
COMPARE
Yakama
Guyanese
Unemployment Among Ages 30 to 34 years
Unemployment Among Ages 30 to 34 years Comparison
Yakama
Guyanese
9.8%
UNEMPLOYMENT AMONG AGES 30 TO 34 YEARS
0.0/ 100
METRIC RATING
338th/ 347
METRIC RANK
7.2%
UNEMPLOYMENT AMONG AGES 30 TO 34 YEARS
0.0/ 100
METRIC RATING
319th/ 347
METRIC RANK
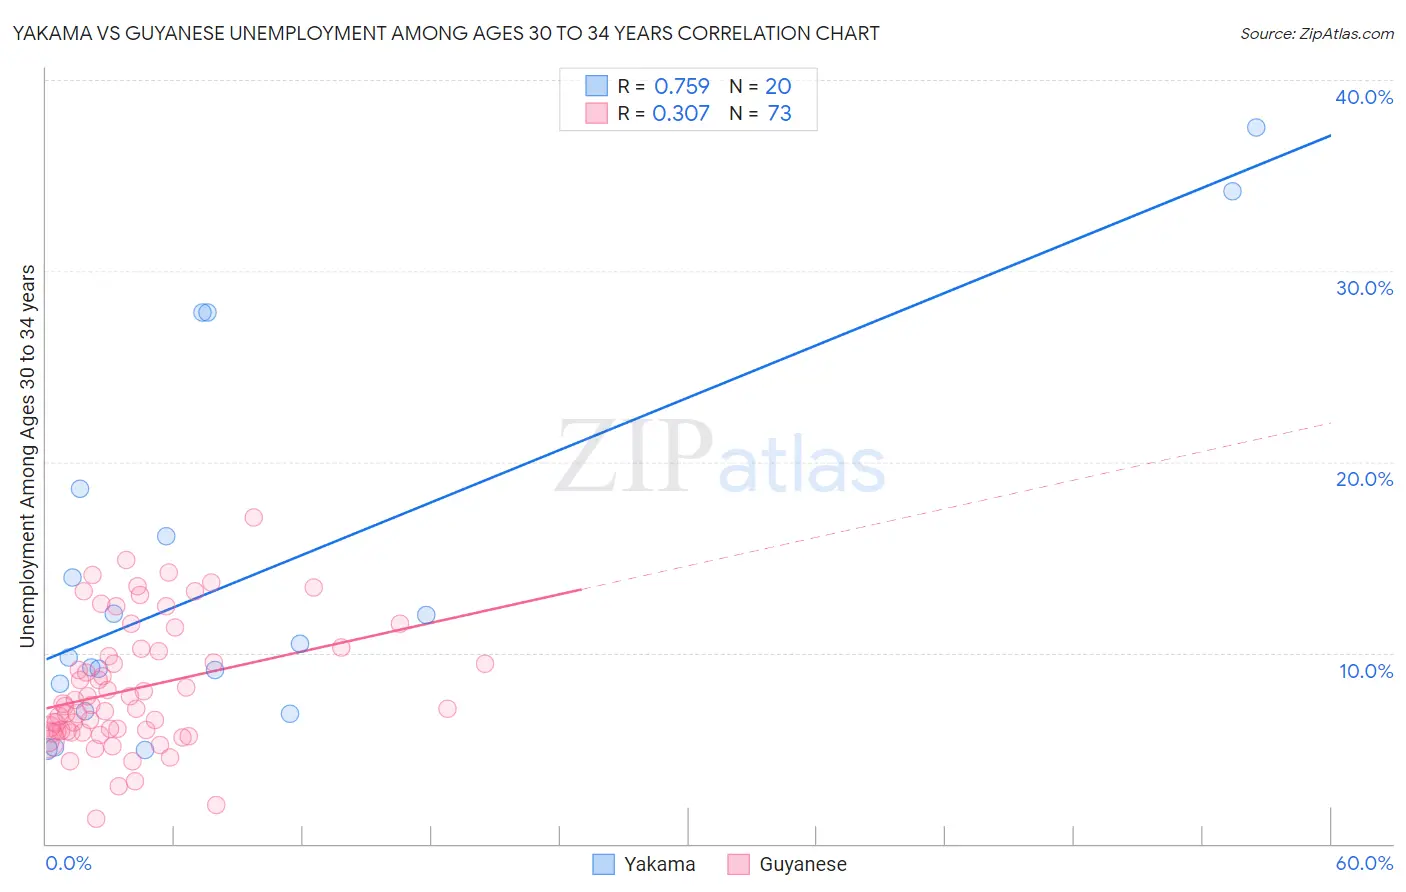
Yakama vs Guyanese Unemployment Among Ages 30 to 34 years Correlation Chart
The statistical analysis conducted on geographies consisting of 19,667,212 people shows a strong positive correlation between the proportion of Yakama and unemployment rate among population between the ages 30 and 34 in the United States with a correlation coefficient (R) of 0.759 and weighted average of 9.8%. Similarly, the statistical analysis conducted on geographies consisting of 172,436,836 people shows a mild positive correlation between the proportion of Guyanese and unemployment rate among population between the ages 30 and 34 in the United States with a correlation coefficient (R) of 0.307 and weighted average of 7.2%, a difference of 35.8%.
Unemployment Among Ages 30 to 34 years Correlation Summary
| Measurement | Yakama | Guyanese |
| Minimum | 4.9% | 1.3% |
| Maximum | 37.5% | 17.1% |
| Range | 32.6% | 15.8% |
| Mean | 14.2% | 8.1% |
| Median | 10.1% | 7.2% |
| Interquartile 25% (IQ1) | 7.7% | 5.9% |
| Interquartile 75% (IQ3) | 17.4% | 10.2% |
| Interquartile Range (IQR) | 9.7% | 4.3% |
| Standard Deviation (Sample) | 9.9% | 3.3% |
| Standard Deviation (Population) | 9.6% | 3.3% |
Demographics Similar to Yakama and Guyanese by Unemployment Among Ages 30 to 34 years
In terms of unemployment among ages 30 to 34 years, the demographic groups most similar to Yakama are Pima (9.6%, a difference of 1.1%), Colville (9.0%, a difference of 7.9%), Puerto Rican (8.9%, a difference of 10.0%), Alaska Native (8.5%, a difference of 15.0%), and Pueblo (8.3%, a difference of 18.0%). Similarly, the demographic groups most similar to Guyanese are Cape Verdean (7.2%, a difference of 0.020%), Black/African American (7.2%, a difference of 0.060%), Immigrants from Guyana (7.2%, a difference of 0.31%), Marshallese (7.2%, a difference of 0.81%), and Immigrants from Yemen (7.3%, a difference of 1.3%).
| Demographics | Rating | Rank | Unemployment Among Ages 30 to 34 years |
| Blacks/African Americans | 0.0 /100 | #318 | Tragic 7.2% |
| Guyanese | 0.0 /100 | #319 | Tragic 7.2% |
| Cape Verdeans | 0.0 /100 | #320 | Tragic 7.2% |
| Immigrants | Guyana | 0.0 /100 | #321 | Tragic 7.2% |
| Marshallese | 0.0 /100 | #322 | Tragic 7.2% |
| Immigrants | Yemen | 0.0 /100 | #323 | Tragic 7.3% |
| Immigrants | Dominica | 0.0 /100 | #324 | Tragic 7.3% |
| Apache | 0.0 /100 | #325 | Tragic 7.3% |
| Dominicans | 0.0 /100 | #326 | Tragic 7.7% |
| Immigrants | Dominican Republic | 0.0 /100 | #327 | Tragic 7.7% |
| Chippewa | 0.0 /100 | #328 | Tragic 7.8% |
| Cheyenne | 0.0 /100 | #329 | Tragic 7.8% |
| Shoshone | 0.0 /100 | #330 | Tragic 7.9% |
| Sioux | 0.0 /100 | #331 | Tragic 8.0% |
| Natives/Alaskans | 0.0 /100 | #332 | Tragic 8.2% |
| Pueblo | 0.0 /100 | #333 | Tragic 8.3% |
| Alaska Natives | 0.0 /100 | #334 | Tragic 8.5% |
| Puerto Ricans | 0.0 /100 | #335 | Tragic 8.9% |
| Colville | 0.0 /100 | #336 | Tragic 9.0% |
| Pima | 0.0 /100 | #337 | Tragic 9.6% |
| Yakama | 0.0 /100 | #338 | Tragic 9.8% |