Yakama vs Bermudan Unemployment Among Youth under 25 years
COMPARE
Yakama
Bermudan
Unemployment Among Youth under 25 years
Unemployment Among Youth under 25 years Comparison
Yakama
Bermudans
15.6%
UNEMPLOYMENT AMONG YOUTH UNDER 25 YEARS
0.0/ 100
METRIC RATING
330th/ 347
METRIC RANK
13.0%
UNEMPLOYMENT AMONG YOUTH UNDER 25 YEARS
0.0/ 100
METRIC RATING
275th/ 347
METRIC RANK
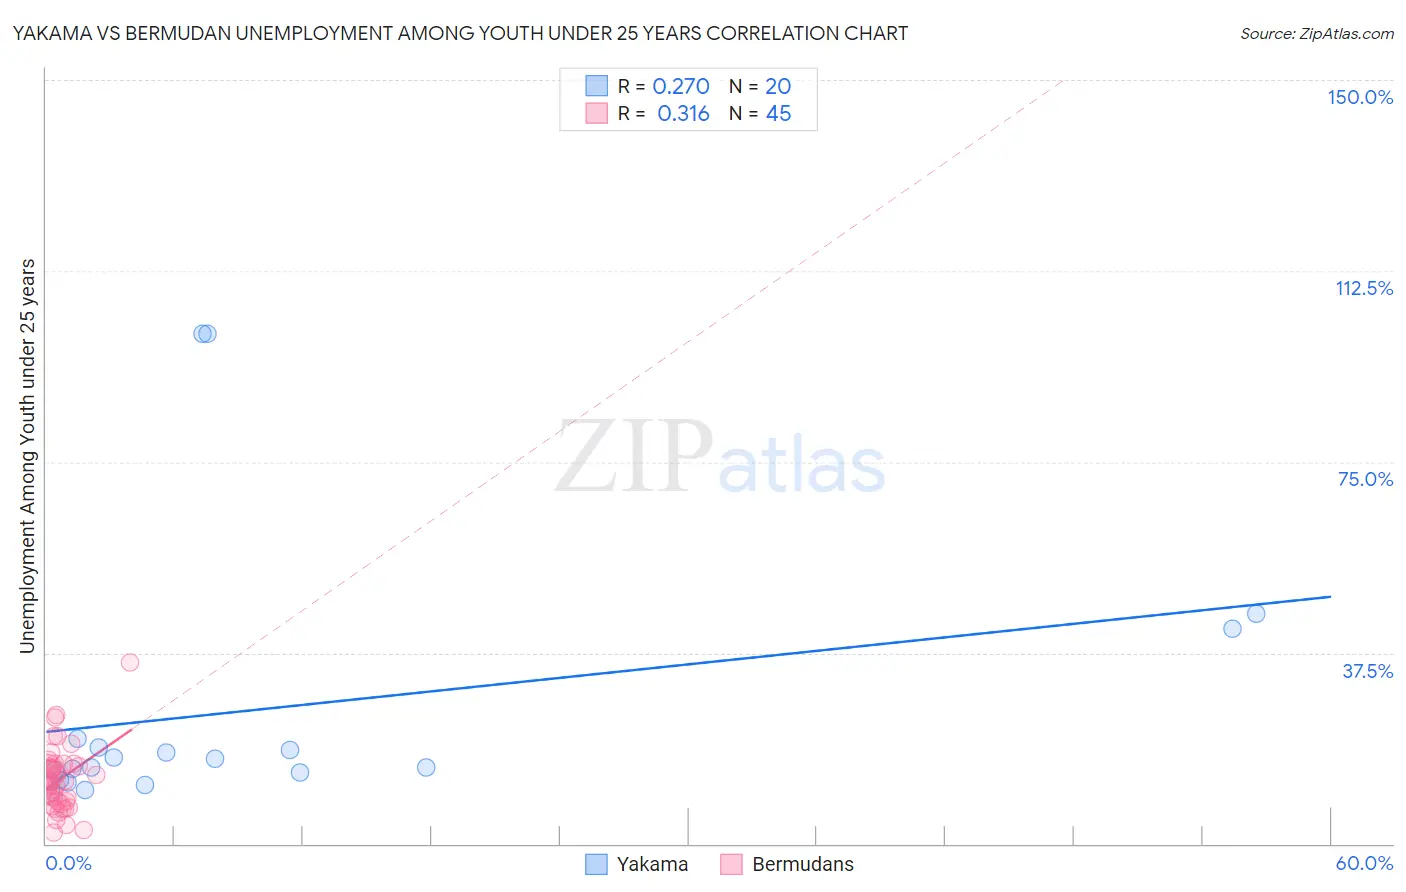
Yakama vs Bermudan Unemployment Among Youth under 25 years Correlation Chart
The statistical analysis conducted on geographies consisting of 19,840,397 people shows a weak positive correlation between the proportion of Yakama and unemployment rate among youth under the age of 25 in the United States with a correlation coefficient (R) of 0.270 and weighted average of 15.6%. Similarly, the statistical analysis conducted on geographies consisting of 55,599,770 people shows a mild positive correlation between the proportion of Bermudans and unemployment rate among youth under the age of 25 in the United States with a correlation coefficient (R) of 0.316 and weighted average of 13.0%, a difference of 19.5%.
Unemployment Among Youth under 25 years Correlation Summary
| Measurement | Yakama | Bermudan |
| Minimum | 10.6% | 2.1% |
| Maximum | 100.1% | 35.6% |
| Range | 89.5% | 33.5% |
| Mean | 26.4% | 12.6% |
| Median | 15.9% | 12.2% |
| Interquartile 25% (IQ1) | 13.3% | 8.1% |
| Interquartile 75% (IQ3) | 19.9% | 15.4% |
| Interquartile Range (IQR) | 6.6% | 7.3% |
| Standard Deviation (Sample) | 26.8% | 6.4% |
| Standard Deviation (Population) | 26.2% | 6.3% |
Similar Demographics by Unemployment Among Youth under 25 years
Demographics Similar to Yakama by Unemployment Among Youth under 25 years
In terms of unemployment among youth under 25 years, the demographic groups most similar to Yakama are Immigrants from Yemen (15.6%, a difference of 0.040%), Immigrants from Dominican Republic (15.6%, a difference of 0.17%), British West Indian (15.5%, a difference of 0.28%), Dominican (15.7%, a difference of 0.83%), and Immigrants from Grenada (15.8%, a difference of 1.5%).
| Demographics | Rating | Rank | Unemployment Among Youth under 25 years |
| Immigrants | Trinidad and Tobago | 0.0 /100 | #323 | Tragic 14.6% |
| Immigrants | Jamaica | 0.0 /100 | #324 | Tragic 14.8% |
| Alaska Natives | 0.0 /100 | #325 | Tragic 14.9% |
| Immigrants | Barbados | 0.0 /100 | #326 | Tragic 15.2% |
| British West Indians | 0.0 /100 | #327 | Tragic 15.5% |
| Immigrants | Dominican Republic | 0.0 /100 | #328 | Tragic 15.6% |
| Immigrants | Yemen | 0.0 /100 | #329 | Tragic 15.6% |
| Yakama | 0.0 /100 | #330 | Tragic 15.6% |
| Dominicans | 0.0 /100 | #331 | Tragic 15.7% |
| Immigrants | Grenada | 0.0 /100 | #332 | Tragic 15.8% |
| Guyanese | 0.0 /100 | #333 | Tragic 15.9% |
| Immigrants | Guyana | 0.0 /100 | #334 | Tragic 15.9% |
| Immigrants | St. Vincent and the Grenadines | 0.0 /100 | #335 | Tragic 16.1% |
| Pima | 0.0 /100 | #336 | Tragic 16.2% |
| Arapaho | 0.0 /100 | #337 | Tragic 16.3% |
Demographics Similar to Bermudans by Unemployment Among Youth under 25 years
In terms of unemployment among youth under 25 years, the demographic groups most similar to Bermudans are Immigrants from Nigeria (13.0%, a difference of 0.11%), Immigrants from Uzbekistan (13.1%, a difference of 0.43%), Bahamian (13.1%, a difference of 0.60%), Nigerian (13.0%, a difference of 0.69%), and African (13.2%, a difference of 0.85%).
| Demographics | Rating | Rank | Unemployment Among Youth under 25 years |
| Tlingit-Haida | 0.0 /100 | #268 | Tragic 12.7% |
| Kiowa | 0.0 /100 | #269 | Tragic 12.7% |
| Immigrants | Liberia | 0.0 /100 | #270 | Tragic 12.8% |
| Immigrants | Bahamas | 0.0 /100 | #271 | Tragic 12.9% |
| Cape Verdeans | 0.0 /100 | #272 | Tragic 12.9% |
| Nigerians | 0.0 /100 | #273 | Tragic 13.0% |
| Immigrants | Nigeria | 0.0 /100 | #274 | Tragic 13.0% |
| Bermudans | 0.0 /100 | #275 | Tragic 13.0% |
| Immigrants | Uzbekistan | 0.0 /100 | #276 | Tragic 13.1% |
| Bahamians | 0.0 /100 | #277 | Tragic 13.1% |
| Africans | 0.0 /100 | #278 | Tragic 13.2% |
| Cajuns | 0.0 /100 | #279 | Tragic 13.2% |
| Ute | 0.0 /100 | #280 | Tragic 13.3% |
| Armenians | 0.0 /100 | #281 | Tragic 13.3% |
| Sierra Leoneans | 0.0 /100 | #282 | Tragic 13.3% |