White/Caucasian vs Crow Unemployment Among Ages 35 to 44 years
COMPARE
White/Caucasian
Crow
Unemployment Among Ages 35 to 44 years
Unemployment Among Ages 35 to 44 years Comparison
Whites/Caucasians
Crow
4.6%
UNEMPLOYMENT AMONG AGES 35 TO 44 YEARS
64.9/ 100
METRIC RATING
155th/ 347
METRIC RANK
15.7%
UNEMPLOYMENT AMONG AGES 35 TO 44 YEARS
0.0/ 100
METRIC RATING
346th/ 347
METRIC RANK
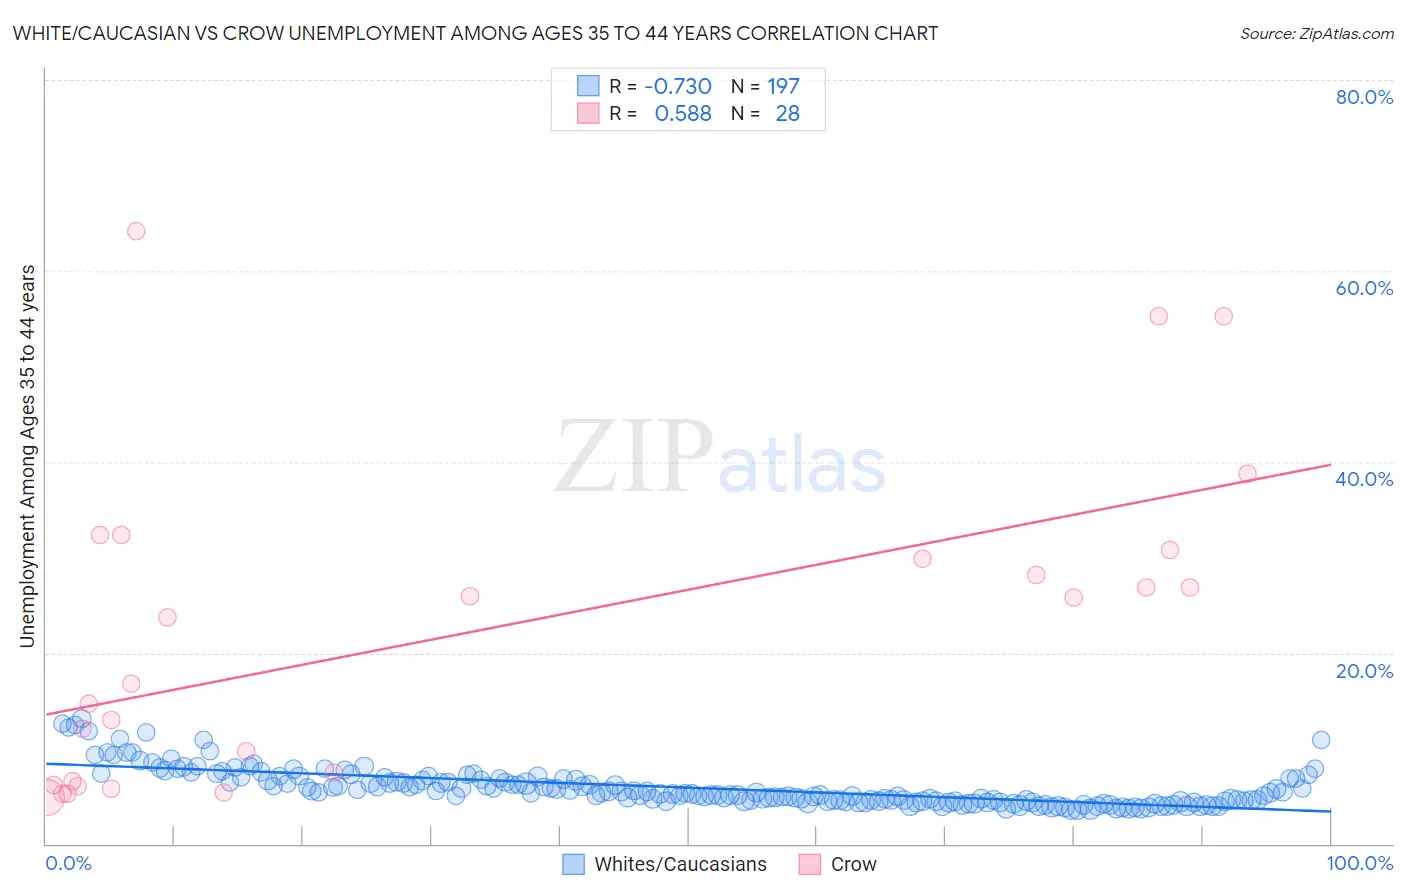
White/Caucasian vs Crow Unemployment Among Ages 35 to 44 years Correlation Chart
The statistical analysis conducted on geographies consisting of 539,752,608 people shows a strong negative correlation between the proportion of Whites/Caucasians and unemployment rate among population between the ages 35 and 44 in the United States with a correlation coefficient (R) of -0.730 and weighted average of 4.6%. Similarly, the statistical analysis conducted on geographies consisting of 58,626,239 people shows a substantial positive correlation between the proportion of Crow and unemployment rate among population between the ages 35 and 44 in the United States with a correlation coefficient (R) of 0.588 and weighted average of 15.7%, a difference of 238.6%.
Unemployment Among Ages 35 to 44 years Correlation Summary
| Measurement | White/Caucasian | Crow |
| Minimum | 3.6% | 4.9% |
| Maximum | 13.1% | 64.2% |
| Range | 9.5% | 59.3% |
| Mean | 5.9% | 22.0% |
| Median | 5.3% | 20.2% |
| Interquartile 25% (IQ1) | 4.4% | 6.4% |
| Interquartile 75% (IQ3) | 6.8% | 30.3% |
| Interquartile Range (IQR) | 2.3% | 23.9% |
| Standard Deviation (Sample) | 2.0% | 16.7% |
| Standard Deviation (Population) | 2.0% | 16.4% |
Similar Demographics by Unemployment Among Ages 35 to 44 years
Demographics Similar to Whites/Caucasians by Unemployment Among Ages 35 to 44 years
In terms of unemployment among ages 35 to 44 years, the demographic groups most similar to Whites/Caucasians are Immigrants from Western Europe (4.6%, a difference of 0.050%), South American (4.6%, a difference of 0.090%), Immigrants from Belarus (4.6%, a difference of 0.11%), Immigrants from Iran (4.6%, a difference of 0.14%), and Albanian (4.6%, a difference of 0.15%).
| Demographics | Rating | Rank | Unemployment Among Ages 35 to 44 years |
| Slavs | 72.4 /100 | #148 | Good 4.6% |
| Immigrants | Burma/Myanmar | 72.2 /100 | #149 | Good 4.6% |
| Immigrants | England | 70.5 /100 | #150 | Good 4.6% |
| Puget Sound Salish | 67.1 /100 | #151 | Good 4.6% |
| Pakistanis | 67.1 /100 | #152 | Good 4.6% |
| Immigrants | Brazil | 67.0 /100 | #153 | Good 4.6% |
| Immigrants | Western Europe | 65.5 /100 | #154 | Good 4.6% |
| Whites/Caucasians | 64.9 /100 | #155 | Good 4.6% |
| South Americans | 63.7 /100 | #156 | Good 4.6% |
| Immigrants | Belarus | 63.4 /100 | #157 | Good 4.6% |
| Immigrants | Iran | 63.1 /100 | #158 | Good 4.6% |
| Albanians | 63.0 /100 | #159 | Good 4.6% |
| Hungarians | 62.6 /100 | #160 | Good 4.6% |
| Celtics | 61.7 /100 | #161 | Good 4.7% |
| Costa Ricans | 59.6 /100 | #162 | Average 4.7% |
Demographics Similar to Crow by Unemployment Among Ages 35 to 44 years
In terms of unemployment among ages 35 to 44 years, the demographic groups most similar to Crow are Yuman (16.9%, a difference of 7.7%), Yup'ik (14.4%, a difference of 8.8%), Pima (11.8%, a difference of 33.6%), Arapaho (10.3%, a difference of 52.7%), and Navajo (9.3%, a difference of 68.2%).
| Demographics | Rating | Rank | Unemployment Among Ages 35 to 44 years |
| Puerto Ricans | 0.0 /100 | #333 | Tragic 7.6% |
| Houma | 0.0 /100 | #334 | Tragic 7.8% |
| Sioux | 0.0 /100 | #335 | Tragic 8.4% |
| Apache | 0.0 /100 | #336 | Tragic 8.4% |
| Tohono O'odham | 0.0 /100 | #337 | Tragic 8.4% |
| Cheyenne | 0.0 /100 | #338 | Tragic 8.5% |
| Inupiat | 0.0 /100 | #339 | Tragic 8.6% |
| Alaskan Athabascans | 0.0 /100 | #340 | Tragic 8.6% |
| Hopi | 0.0 /100 | #341 | Tragic 8.9% |
| Navajo | 0.0 /100 | #342 | Tragic 9.3% |
| Arapaho | 0.0 /100 | #343 | Tragic 10.3% |
| Pima | 0.0 /100 | #344 | Tragic 11.8% |
| Yup'ik | 0.0 /100 | #345 | Tragic 14.4% |
| Crow | 0.0 /100 | #346 | Tragic 15.7% |
| Yuman | 0.0 /100 | #347 | Tragic 16.9% |