White/Caucasian vs Choctaw Unemployment Among Seniors over 65 years

COMPARE

White/Caucasian
Race
Ancestry
AfghanAfricanAlaska NativeAlaskan AthabascanAlbanianAleutAlsatianAmericanApacheArabArapahoArgentineanArmenianAssyrian/Chaldean/SyriacAustralianAustrianBahamianBangladeshiBarbadianBasqueBelgianBelizeanBermudanBhutaneseBlackfeetBolivianBrazilianBritishBritish West IndianBulgarianBurmeseCajunCambodianCanadianCape VerdeanCarpatho RusynCelticCentral AmericanCentral American IndianCherokeeCheyenneChickasawChileanChineseChippewaColombianColvilleComancheCosta RicanCreeCreekCroatianCrowCubanCypriotCzechCzechoslovakianDanishDelawareDominicanDutchDutch West IndianEastern EuropeanEcuadorianEgyptianEnglishEstonianEthiopianEuropeanFijianFilipinoFinnishFrenchFrench American IndianFrench CanadianGermanGerman RussianGhanaianGreekGuamanian/ChamorroGuatemalanGuyaneseHaitianHmongHonduranHopiHoumaHungarianIcelanderIndian (Asian)IndonesianInupiatIranianIraqiIrishIroquoisIsraeliItalianJamaicanJapaneseJordanianKenyanKiowaKoreanLaotianLatvianLebaneseLiberianLithuanianLumbeeLuxembourgerMacedonianMalaysianMalteseMarshalleseMenomineeMexicanMexican American IndianMongolianMoroccanNative HawaiianNavajoNepaleseNew ZealanderNicaraguanNigerianNorthern EuropeanNorwegianOkinawanOsageOttawaPaiutePakistaniPalestinianPanamanianParaguayanPennsylvania GermanPeruvianPimaPolishPortuguesePotawatomiPuebloPuerto RicanPuget Sound SalishRomanianRussianSalvadoranSamoanScandinavianScotch-IrishScottishSeminoleSenegaleseSerbianShoshoneSierra LeoneanSiouxSlavicSlovakSloveneSomaliSouth AfricanSouth AmericanSouth American IndianSoviet UnionSpaniardSpanishSpanish AmericanSpanish American IndianSri LankanSubsaharan AfricanSudaneseSwedishSwissSyrianTaiwaneseThaiTlingit-HaidaTohono O'OdhamTonganTrinidadian and TobagonianTsimshianTurkishU.S. Virgin IslanderUgandanUkrainianUruguayanUteVenezuelanVietnameseWelshWest IndianYakamaYaquiYugoslavianYumanYup'ikZimbabwean
Immigration
NonimmigrantsImmigrantsAfghanistanAfricaAlbaniaArgentinaArmeniaAsiaAustraliaAustriaBahamasBangladeshBarbadosBelarusBelgiumBelizeBoliviaBosnia and HerzegovinaBrazilBulgariaBurma/MyanmarCabo VerdeCambodiaCameroonCanadaCaribbeanCentral AmericaChileChinaColombiaCongoCosta RicaCroatiaCubaCzechoslovakiaDenmarkDominicaDominican RepublicEastern AfricaEastern AsiaEastern EuropeEcuadorEgyptEl SalvadorEnglandEritreaEthiopiaEuropeFijiFranceGermanyGhanaGreeceGrenadaGuatemalaGuyanaHaitiHondurasHong KongHungaryIndiaIndonesiaIranIraqIrelandIsraelItalyJamaicaJapanJordanKazakhstanKenyaKoreaKuwaitLaosLatin AmericaLatviaLebanonLiberiaLithuaniaMalaysiaMexicoMicronesiaMiddle AfricaMoldovaMoroccoNepalNetherlandsNicaraguaNigeriaNorth AmericaNorth MacedoniaNorthern AfricaNorthern EuropeNorwayOceaniaPakistanPanamaPeruPhilippinesPolandPortugalRomaniaRussiaSaudi ArabiaScotlandSenegalSerbiaSierra LeoneSingaporeSomaliaSouth AfricaSouth AmericaSouth Central AsiaSouth Eastern AsiaSouthern EuropeSpainSri LankaSt. Vincent and the GrenadinesSudanSwedenSwitzerlandSyriaTaiwanThailandTrinidad and TobagoTurkeyUgandaUkraineUruguayUzbekistanVenezuelaVietnamWest IndiesWestern AfricaWestern AsiaWestern EuropeYemenZaireZimbabweAzores
Choctaw
Race
Ancestry
AfghanAfricanAlaska NativeAlaskan AthabascanAlbanianAleutAlsatianAmericanApacheArabArapahoArgentineanArmenianAssyrian/Chaldean/SyriacAustralianAustrianBahamianBangladeshiBarbadianBasqueBelgianBelizeanBermudanBhutaneseBlackfeetBolivianBrazilianBritishBritish West IndianBulgarianBurmeseCajunCambodianCanadianCape VerdeanCarpatho RusynCelticCentral AmericanCentral American IndianCherokeeCheyenneChickasawChileanChineseChippewaChoctawColombianColvilleComancheCosta RicanCreeCreekCroatianCrowCubanCypriotCzechCzechoslovakianDanishDelawareDominicanDutchDutch West IndianEastern EuropeanEcuadorianEgyptianEnglishEstonianEthiopianEuropeanFijianFilipinoFinnishFrenchFrench American IndianFrench CanadianGermanGerman RussianGhanaianGreekGuamanian/ChamorroGuatemalanGuyaneseHaitianHmongHonduranHopiHoumaHungarianIcelanderIndian (Asian)IndonesianInupiatIranianIraqiIrishIroquoisIsraeliItalianJamaicanJapaneseJordanianKenyanKiowaKoreanLaotianLatvianLebaneseLiberianLithuanianLumbeeLuxembourgerMacedonianMalaysianMalteseMarshalleseMenomineeMexicanMexican American IndianMongolianMoroccanNative HawaiianNavajoNepaleseNew ZealanderNicaraguanNigerianNorthern EuropeanNorwegianOkinawanOsageOttawaPaiutePakistaniPalestinianPanamanianParaguayanPennsylvania GermanPeruvianPimaPolishPortuguesePotawatomiPuebloPuerto RicanPuget Sound SalishRomanianRussianSalvadoranSamoanScandinavianScotch-IrishScottishSeminoleSenegaleseSerbianShoshoneSierra LeoneanSiouxSlavicSlovakSloveneSomaliSouth AfricanSouth AmericanSouth American IndianSoviet UnionSpaniardSpanishSpanish AmericanSpanish American IndianSri LankanSubsaharan AfricanSudaneseSwedishSwissSyrianTaiwaneseThaiTlingit-HaidaTohono O'OdhamTonganTrinidadian and TobagonianTsimshianTurkishU.S. Virgin IslanderUgandanUkrainianUruguayanUteVenezuelanVietnameseWelshWest IndianYakamaYaquiYugoslavianYumanYup'ikZimbabwean
Immigration
NonimmigrantsImmigrantsAfghanistanAfricaAlbaniaArgentinaArmeniaAsiaAustraliaAustriaBahamasBangladeshBarbadosBelarusBelgiumBelizeBoliviaBosnia and HerzegovinaBrazilBulgariaBurma/MyanmarCabo VerdeCambodiaCameroonCanadaCaribbeanCentral AmericaChileChinaColombiaCongoCosta RicaCroatiaCubaCzechoslovakiaDenmarkDominicaDominican RepublicEastern AfricaEastern AsiaEastern EuropeEcuadorEgyptEl SalvadorEnglandEritreaEthiopiaEuropeFijiFranceGermanyGhanaGreeceGrenadaGuatemalaGuyanaHaitiHondurasHong KongHungaryIndiaIndonesiaIranIraqIrelandIsraelItalyJamaicaJapanJordanKazakhstanKenyaKoreaKuwaitLaosLatin AmericaLatviaLebanonLiberiaLithuaniaMalaysiaMexicoMicronesiaMiddle AfricaMoldovaMoroccoNepalNetherlandsNicaraguaNigeriaNorth AmericaNorth MacedoniaNorthern AfricaNorthern EuropeNorwayOceaniaPakistanPanamaPeruPhilippinesPolandPortugalRomaniaRussiaSaudi ArabiaScotlandSenegalSerbiaSierra LeoneSingaporeSomaliaSouth AfricaSouth AmericaSouth Central AsiaSouth Eastern AsiaSouthern EuropeSpainSri LankaSt. Vincent and the GrenadinesSudanSwedenSwitzerlandSyriaTaiwanThailandTrinidad and TobagoTurkeyUgandaUkraineUruguayUzbekistanVenezuelaVietnamWest IndiesWestern AfricaWestern AsiaWestern EuropeYemenZaireZimbabweAzores
Unemployment Among Seniors over 65 years
Income
Poverty
Unemployment
Labor Participation
Family Structure
Vehicle Availability
Education Level
Disability

Unemployment Among Seniors over 65 years Comparison

Whites/Caucasians

Choctaw

Excellent
Exceptional
5.1%
UNEMPLOYMENT AMONG SENIORS OVER 65 YEARS
84.4/ 100
METRIC RATING
136th/ 347
METRIC RANK
4.9%
UNEMPLOYMENT AMONG SENIORS OVER 65 YEARS
99.9/ 100
METRIC RATING
48th/ 347
METRIC RANK

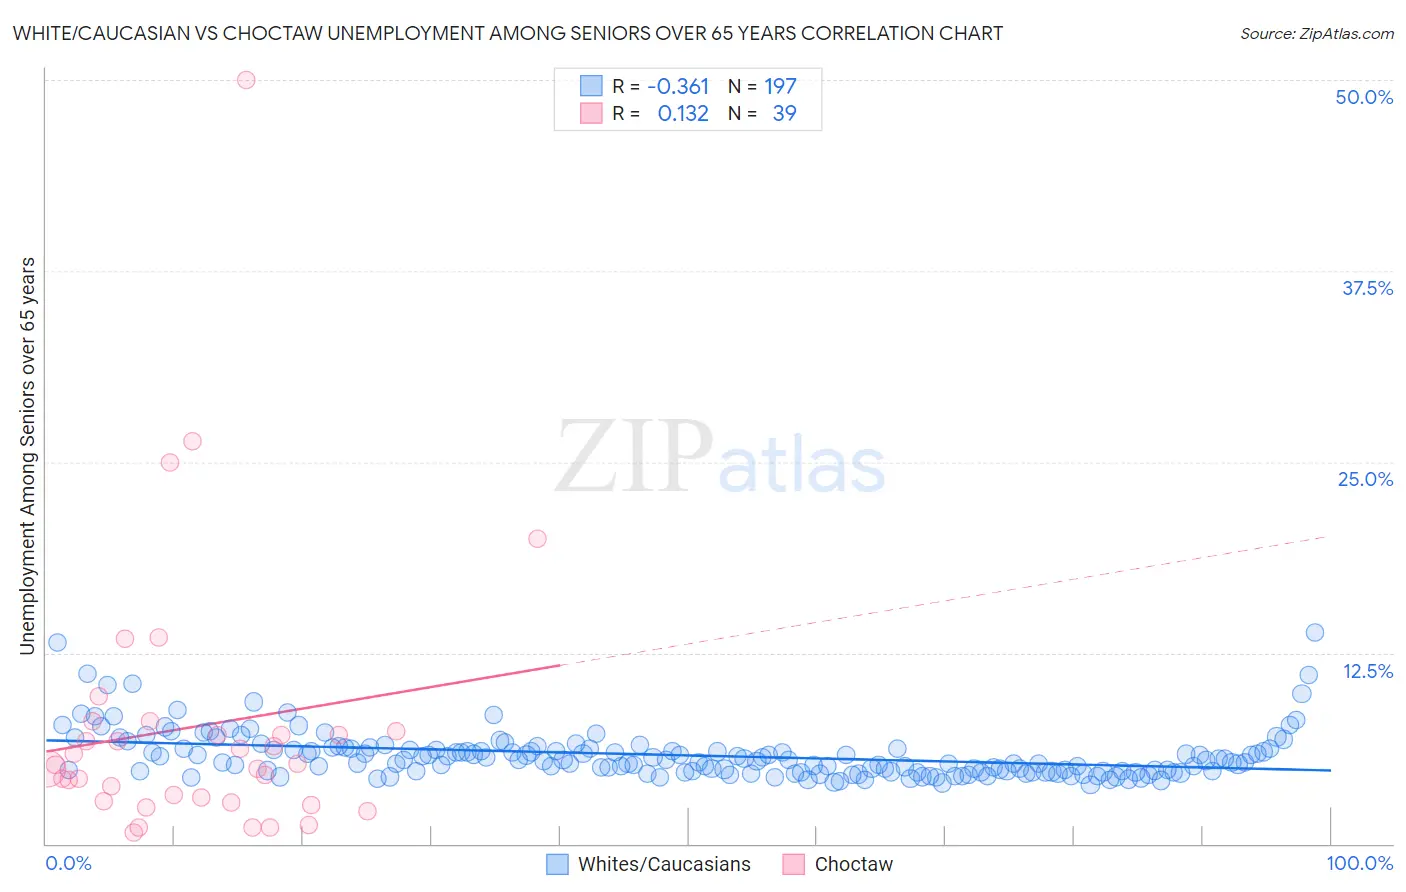
White/Caucasian vs Choctaw Unemployment Among Seniors over 65 years Correlation Chart

The statistical analysis conducted on geographies consisting of 465,209,584 people shows a mild negative correlation between the proportion of Whites/Caucasians and unemployment rate amomg seniors over the age of 65 in the United States with a correlation coefficient (R) of -0.361 and weighted average of 5.1%. Similarly, the statistical analysis conducted on geographies consisting of 244,011,478 people shows a poor positive correlation between the proportion of Choctaw and unemployment rate amomg seniors over the age of 65 in the United States with a correlation coefficient (R) of 0.132 and weighted average of 4.9%, a difference of 4.4%.
White/Caucasian vs Choctaw Unemployment Among Seniors over 65 years

Unemployment Among Seniors over 65 years Correlation Summary

MeasurementWhite/CaucasianChoctaw
Minimum3.9%0.74%
Maximum13.8%50.0%
Range9.9%49.3%
Mean5.8%7.7%
Median5.5%5.2%
Interquartile 25% (IQ1)4.7%2.8%
Interquartile 75% (IQ3)6.2%7.4%
Interquartile Range (IQR)1.5%4.6%
Standard Deviation (Sample)1.6%9.1%
Standard Deviation (Population)1.6%9.0%

Similar Demographics by Unemployment Among Seniors over 65 years

Demographics Similar to Whites/Caucasians by Unemployment Among Seniors over 65 years

In terms of unemployment among seniors over 65 years, the demographic groups most similar to Whites/Caucasians are Ukrainian (5.1%, a difference of 0.0%), Arab (5.1%, a difference of 0.0%), Turkish (5.1%, a difference of 0.030%), Syrian (5.1%, a difference of 0.060%), and New Zealander (5.1%, a difference of 0.070%).
DemographicsRating | RankUnemployment Among Seniors over 65 years
Immigrants | England
86.7
/100
|
#129
Excellent
5.1%
Iranians
86.6
/100
|
#130
Excellent
5.1%
Immigrants | Australia
85.8
/100
|
#131
Excellent
5.1%
Chileans
85.6
/100
|
#132
Excellent
5.1%
Syrians
85.3
/100
|
#133
Excellent
5.1%
Turks
84.9
/100
|
#134
Excellent
5.1%
Ukrainians
84.4
/100
|
#135
Excellent
5.1%
Whites/Caucasians
84.4
/100
|
#136
Excellent
5.1%
Arabs
84.3
/100
|
#137
Excellent
5.1%
New Zealanders
83.2
/100
|
#138
Excellent
5.1%
Immigrants | Panama
83.0
/100
|
#139
Excellent
5.1%
Immigrants | Chile
83.0
/100
|
#140
Excellent
5.1%
Cherokee
81.6
/100
|
#141
Excellent
5.1%
Immigrants | Indonesia
81.0
/100
|
#142
Excellent
5.1%
Senegalese
80.4
/100
|
#143
Excellent
5.1%

Demographics Similar to Choctaw by Unemployment Among Seniors over 65 years

In terms of unemployment among seniors over 65 years, the demographic groups most similar to Choctaw are German (4.9%, a difference of 0.010%), Immigrants from Jordan (4.9%, a difference of 0.040%), Ethiopian (4.9%, a difference of 0.18%), Immigrants from Kenya (4.9%, a difference of 0.19%), and Immigrants from Austria (4.9%, a difference of 0.20%).
DemographicsRating | RankUnemployment Among Seniors over 65 years
Kiowa
99.9
/100
|
#41
Exceptional
4.8%
Swiss
99.9
/100
|
#42
Exceptional
4.8%
Luxembourgers
99.9
/100
|
#43
Exceptional
4.8%
Jordanians
99.9
/100
|
#44
Exceptional
4.9%
Ethiopians
99.9
/100
|
#45
Exceptional
4.9%
Immigrants | Jordan
99.9
/100
|
#46
Exceptional
4.9%
Germans
99.9
/100
|
#47
Exceptional
4.9%
Choctaw
99.9
/100
|
#48
Exceptional
4.9%
Immigrants | Kenya
99.9
/100
|
#49
Exceptional
4.9%
Immigrants | Austria
99.9
/100
|
#50
Exceptional
4.9%
Scotch-Irish
99.9
/100
|
#51
Exceptional
4.9%
Swedes
99.9
/100
|
#52
Exceptional
4.9%
Immigrants | Sudan
99.8
/100
|
#53
Exceptional
4.9%
Immigrants | Iraq
99.8
/100
|
#54
Exceptional
4.9%
Europeans
99.8
/100
|
#55
Exceptional
4.9%