Vietnamese vs Yakama Unemployment Among Ages 55 to 59 years
COMPARE
Vietnamese
Yakama
Unemployment Among Ages 55 to 59 years
Unemployment Among Ages 55 to 59 years Comparison
Vietnamese
Yakama
5.9%
UNEMPLOYMENT AMONG AGES 55 TO 59 YEARS
0.0/ 100
METRIC RATING
324th/ 347
METRIC RANK
8.9%
UNEMPLOYMENT AMONG AGES 55 TO 59 YEARS
0.0/ 100
METRIC RATING
343rd/ 347
METRIC RANK
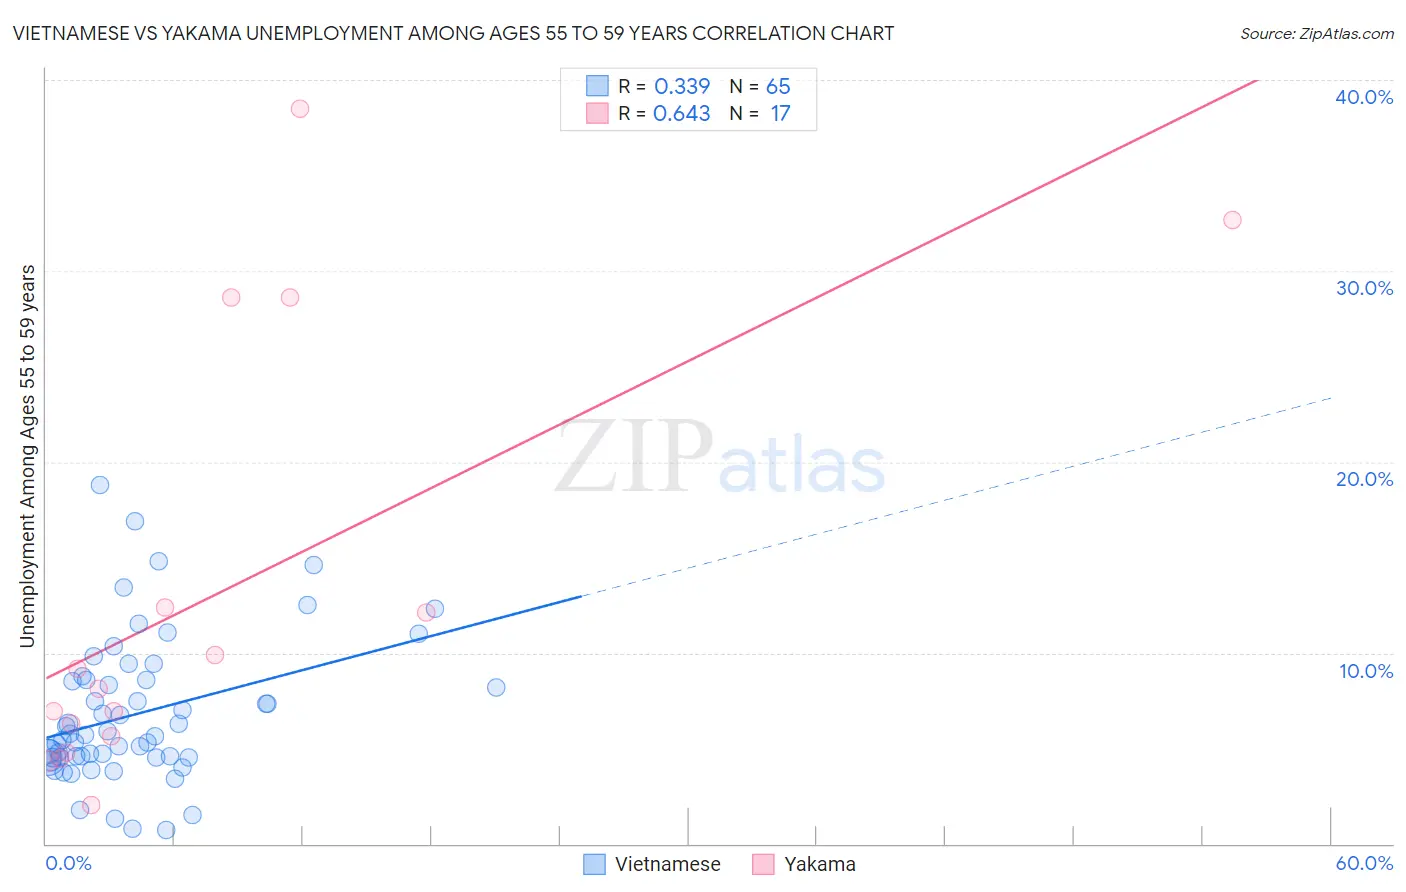
Vietnamese vs Yakama Unemployment Among Ages 55 to 59 years Correlation Chart
The statistical analysis conducted on geographies consisting of 165,879,881 people shows a mild positive correlation between the proportion of Vietnamese and unemployment rate among population between the ages 55 and 59 in the United States with a correlation coefficient (R) of 0.339 and weighted average of 5.9%. Similarly, the statistical analysis conducted on geographies consisting of 19,170,351 people shows a significant positive correlation between the proportion of Yakama and unemployment rate among population between the ages 55 and 59 in the United States with a correlation coefficient (R) of 0.643 and weighted average of 8.9%, a difference of 51.9%.
Unemployment Among Ages 55 to 59 years Correlation Summary
| Measurement | Vietnamese | Yakama |
| Minimum | 0.70% | 2.0% |
| Maximum | 18.8% | 38.5% |
| Range | 18.1% | 36.5% |
| Mean | 6.8% | 13.0% |
| Median | 5.7% | 8.1% |
| Interquartile 25% (IQ1) | 4.5% | 5.2% |
| Interquartile 75% (IQ3) | 8.6% | 20.5% |
| Interquartile Range (IQR) | 4.0% | 15.3% |
| Standard Deviation (Sample) | 3.7% | 11.4% |
| Standard Deviation (Population) | 3.7% | 11.1% |
Demographics Similar to Vietnamese and Yakama by Unemployment Among Ages 55 to 59 years
In terms of unemployment among ages 55 to 59 years, the demographic groups most similar to Vietnamese are Immigrants from Bangladesh (5.9%, a difference of 0.070%), Immigrants from Armenia (6.0%, a difference of 1.8%), Native/Alaskan (6.0%, a difference of 2.1%), Arapaho (6.1%, a difference of 3.0%), and Yuman (6.1%, a difference of 4.3%). Similarly, the demographic groups most similar to Yakama are Hopi (8.1%, a difference of 10.0%), Shoshone (7.4%, a difference of 21.1%), Alaskan Athabascan (7.1%, a difference of 25.2%), Puerto Rican (7.0%, a difference of 28.3%), and Immigrants from Yemen (6.9%, a difference of 29.7%).
| Demographics | Rating | Rank | Unemployment Among Ages 55 to 59 years |
| Immigrants | Bangladesh | 0.0 /100 | #323 | Tragic 5.9% |
| Vietnamese | 0.0 /100 | #324 | Tragic 5.9% |
| Immigrants | Armenia | 0.0 /100 | #325 | Tragic 6.0% |
| Natives/Alaskans | 0.0 /100 | #326 | Tragic 6.0% |
| Arapaho | 0.0 /100 | #327 | Tragic 6.1% |
| Yuman | 0.0 /100 | #328 | Tragic 6.1% |
| Dominicans | 0.0 /100 | #329 | Tragic 6.2% |
| Alaska Natives | 0.0 /100 | #330 | Tragic 6.2% |
| Immigrants | Dominican Republic | 0.0 /100 | #331 | Tragic 6.3% |
| Aleuts | 0.0 /100 | #332 | Tragic 6.4% |
| Pima | 0.0 /100 | #333 | Tragic 6.6% |
| Pueblo | 0.0 /100 | #334 | Tragic 6.7% |
| Colville | 0.0 /100 | #335 | Tragic 6.7% |
| Navajo | 0.0 /100 | #336 | Tragic 6.7% |
| Paiute | 0.0 /100 | #337 | Tragic 6.8% |
| Immigrants | Yemen | 0.0 /100 | #338 | Tragic 6.9% |
| Puerto Ricans | 0.0 /100 | #339 | Tragic 7.0% |
| Alaskan Athabascans | 0.0 /100 | #340 | Tragic 7.1% |
| Shoshone | 0.0 /100 | #341 | Tragic 7.4% |
| Hopi | 0.0 /100 | #342 | Tragic 8.1% |
| Yakama | 0.0 /100 | #343 | Tragic 8.9% |