Vietnamese vs Immigrants from Sudan Unemployment Among Youth under 25 years

COMPARE

Vietnamese
Race
Ancestry
AfghanAfricanAlaska NativeAlaskan AthabascanAlbanianAleutAlsatianAmericanApacheArabArapahoArgentineanArmenianAssyrian/Chaldean/SyriacAustralianAustrianBahamianBangladeshiBarbadianBasqueBelgianBelizeanBermudanBhutaneseBlackfeetBolivianBrazilianBritishBritish West IndianBulgarianBurmeseCajunCambodianCanadianCape VerdeanCarpatho RusynCelticCentral AmericanCentral American IndianCherokeeCheyenneChickasawChileanChineseChippewaChoctawColombianColvilleComancheCosta RicanCreeCreekCroatianCrowCubanCypriotCzechCzechoslovakianDanishDelawareDominicanDutchDutch West IndianEastern EuropeanEcuadorianEgyptianEnglishEstonianEthiopianEuropeanFijianFilipinoFinnishFrenchFrench American IndianFrench CanadianGermanGerman RussianGhanaianGreekGuamanian/ChamorroGuatemalanGuyaneseHaitianHmongHonduranHopiHoumaHungarianIcelanderIndian (Asian)IndonesianInupiatIranianIraqiIrishIroquoisIsraeliItalianJamaicanJapaneseJordanianKenyanKiowaKoreanLaotianLatvianLebaneseLiberianLithuanianLumbeeLuxembourgerMacedonianMalaysianMalteseMarshalleseMenomineeMexicanMexican American IndianMongolianMoroccanNative HawaiianNavajoNepaleseNew ZealanderNicaraguanNigerianNorthern EuropeanNorwegianOkinawanOsageOttawaPaiutePakistaniPalestinianPanamanianParaguayanPennsylvania GermanPeruvianPimaPolishPortuguesePotawatomiPuebloPuerto RicanPuget Sound SalishRomanianRussianSalvadoranSamoanScandinavianScotch-IrishScottishSeminoleSenegaleseSerbianShoshoneSierra LeoneanSiouxSlavicSlovakSloveneSomaliSouth AfricanSouth AmericanSouth American IndianSoviet UnionSpaniardSpanishSpanish AmericanSpanish American IndianSri LankanSubsaharan AfricanSudaneseSwedishSwissSyrianTaiwaneseThaiTlingit-HaidaTohono O'OdhamTonganTrinidadian and TobagonianTsimshianTurkishU.S. Virgin IslanderUgandanUkrainianUruguayanUteVenezuelanVietnameseWelshWest IndianYakamaYaquiYugoslavianYumanYup'ikZimbabwean
Immigration
NonimmigrantsImmigrantsAfghanistanAfricaAlbaniaArgentinaArmeniaAsiaAustraliaAustriaBahamasBangladeshBarbadosBelarusBelgiumBelizeBoliviaBosnia and HerzegovinaBrazilBulgariaBurma/MyanmarCabo VerdeCambodiaCameroonCanadaCaribbeanCentral AmericaChileChinaColombiaCongoCosta RicaCroatiaCubaCzechoslovakiaDenmarkDominicaDominican RepublicEastern AfricaEastern AsiaEastern EuropeEcuadorEgyptEl SalvadorEnglandEritreaEthiopiaEuropeFijiFranceGermanyGhanaGreeceGrenadaGuatemalaGuyanaHaitiHondurasHong KongHungaryIndiaIndonesiaIranIraqIrelandIsraelItalyJamaicaJapanJordanKazakhstanKenyaKoreaKuwaitLaosLatin AmericaLatviaLebanonLiberiaLithuaniaMalaysiaMexicoMicronesiaMiddle AfricaMoldovaMoroccoNepalNetherlandsNicaraguaNigeriaNorth AmericaNorth MacedoniaNorthern AfricaNorthern EuropeNorwayOceaniaPakistanPanamaPeruPhilippinesPolandPortugalRomaniaRussiaSaudi ArabiaScotlandSenegalSerbiaSierra LeoneSingaporeSomaliaSouth AfricaSouth AmericaSouth Central AsiaSouth Eastern AsiaSouthern EuropeSpainSri LankaSt. Vincent and the GrenadinesSwedenSwitzerlandSyriaTaiwanThailandTrinidad and TobagoTurkeyUgandaUkraineUruguayUzbekistanVenezuelaVietnamWest IndiesWestern AfricaWestern AsiaWestern EuropeYemenZaireZimbabweAzores
Immigrants from Sudan
Race
Ancestry
AfghanAfricanAlaska NativeAlaskan AthabascanAlbanianAleutAlsatianAmericanApacheArabArapahoArgentineanArmenianAssyrian/Chaldean/SyriacAustralianAustrianBahamianBangladeshiBarbadianBasqueBelgianBelizeanBermudanBhutaneseBlackfeetBolivianBrazilianBritishBritish West IndianBulgarianBurmeseCajunCambodianCanadianCape VerdeanCarpatho RusynCelticCentral AmericanCentral American IndianCherokeeCheyenneChickasawChileanChineseChippewaChoctawColombianColvilleComancheCosta RicanCreeCreekCroatianCrowCubanCypriotCzechCzechoslovakianDanishDelawareDominicanDutchDutch West IndianEastern EuropeanEcuadorianEgyptianEnglishEstonianEthiopianEuropeanFijianFilipinoFinnishFrenchFrench American IndianFrench CanadianGermanGerman RussianGhanaianGreekGuamanian/ChamorroGuatemalanGuyaneseHaitianHmongHonduranHopiHoumaHungarianIcelanderIndian (Asian)IndonesianInupiatIranianIraqiIrishIroquoisIsraeliItalianJamaicanJapaneseJordanianKenyanKiowaKoreanLaotianLatvianLebaneseLiberianLithuanianLumbeeLuxembourgerMacedonianMalaysianMalteseMarshalleseMenomineeMexicanMexican American IndianMongolianMoroccanNative HawaiianNavajoNepaleseNew ZealanderNicaraguanNigerianNorthern EuropeanNorwegianOkinawanOsageOttawaPaiutePakistaniPalestinianPanamanianParaguayanPennsylvania GermanPeruvianPimaPolishPortuguesePotawatomiPuebloPuerto RicanPuget Sound SalishRomanianRussianSalvadoranSamoanScandinavianScotch-IrishScottishSeminoleSenegaleseSerbianShoshoneSierra LeoneanSiouxSlavicSlovakSloveneSomaliSouth AfricanSouth AmericanSouth American IndianSoviet UnionSpaniardSpanishSpanish AmericanSpanish American IndianSri LankanSubsaharan AfricanSudaneseSwedishSwissSyrianTaiwaneseThaiTlingit-HaidaTohono O'OdhamTonganTrinidadian and TobagonianTsimshianTurkishU.S. Virgin IslanderUgandanUkrainianUruguayanUteVenezuelanWelshWest IndianYakamaYaquiYugoslavianYumanYup'ikZimbabwean
Immigration
NonimmigrantsImmigrantsAfghanistanAfricaAlbaniaArgentinaArmeniaAsiaAustraliaAustriaBahamasBangladeshBarbadosBelarusBelgiumBelizeBoliviaBosnia and HerzegovinaBrazilBulgariaBurma/MyanmarCabo VerdeCambodiaCameroonCanadaCaribbeanCentral AmericaChileChinaColombiaCongoCosta RicaCroatiaCubaCzechoslovakiaDenmarkDominicaDominican RepublicEastern AfricaEastern AsiaEastern EuropeEcuadorEgyptEl SalvadorEnglandEritreaEthiopiaEuropeFijiFranceGermanyGhanaGreeceGrenadaGuatemalaGuyanaHaitiHondurasHong KongHungaryIndiaIndonesiaIranIraqIrelandIsraelItalyJamaicaJapanJordanKazakhstanKenyaKoreaKuwaitLaosLatin AmericaLatviaLebanonLiberiaLithuaniaMalaysiaMexicoMicronesiaMiddle AfricaMoldovaMoroccoNepalNetherlandsNicaraguaNigeriaNorth AmericaNorth MacedoniaNorthern AfricaNorthern EuropeNorwayOceaniaPakistanPanamaPeruPhilippinesPolandPortugalRomaniaRussiaSaudi ArabiaScotlandSenegalSerbiaSierra LeoneSingaporeSomaliaSouth AfricaSouth AmericaSouth Central AsiaSouth Eastern AsiaSouthern EuropeSpainSri LankaSt. Vincent and the GrenadinesSudanSwedenSwitzerlandSyriaTaiwanThailandTrinidad and TobagoTurkeyUgandaUkraineUruguayUzbekistanVenezuelaVietnamWest IndiesWestern AfricaWestern AsiaWestern EuropeYemenZaireZimbabweAzores
Unemployment Among Youth under 25 years
Income
Poverty
Unemployment
Labor Participation
Family Structure
Vehicle Availability
Education Level
Disability

Unemployment Among Youth under 25 years Comparison

Vietnamese

Immigrants from Sudan

Tragic
Exceptional
14.3%
UNEMPLOYMENT AMONG YOUTH UNDER 25 YEARS
0.0/ 100
METRIC RATING
312th/ 347
METRIC RANK
10.5%
UNEMPLOYMENT AMONG YOUTH UNDER 25 YEARS
100.0/ 100
METRIC RATING
12th/ 347
METRIC RANK

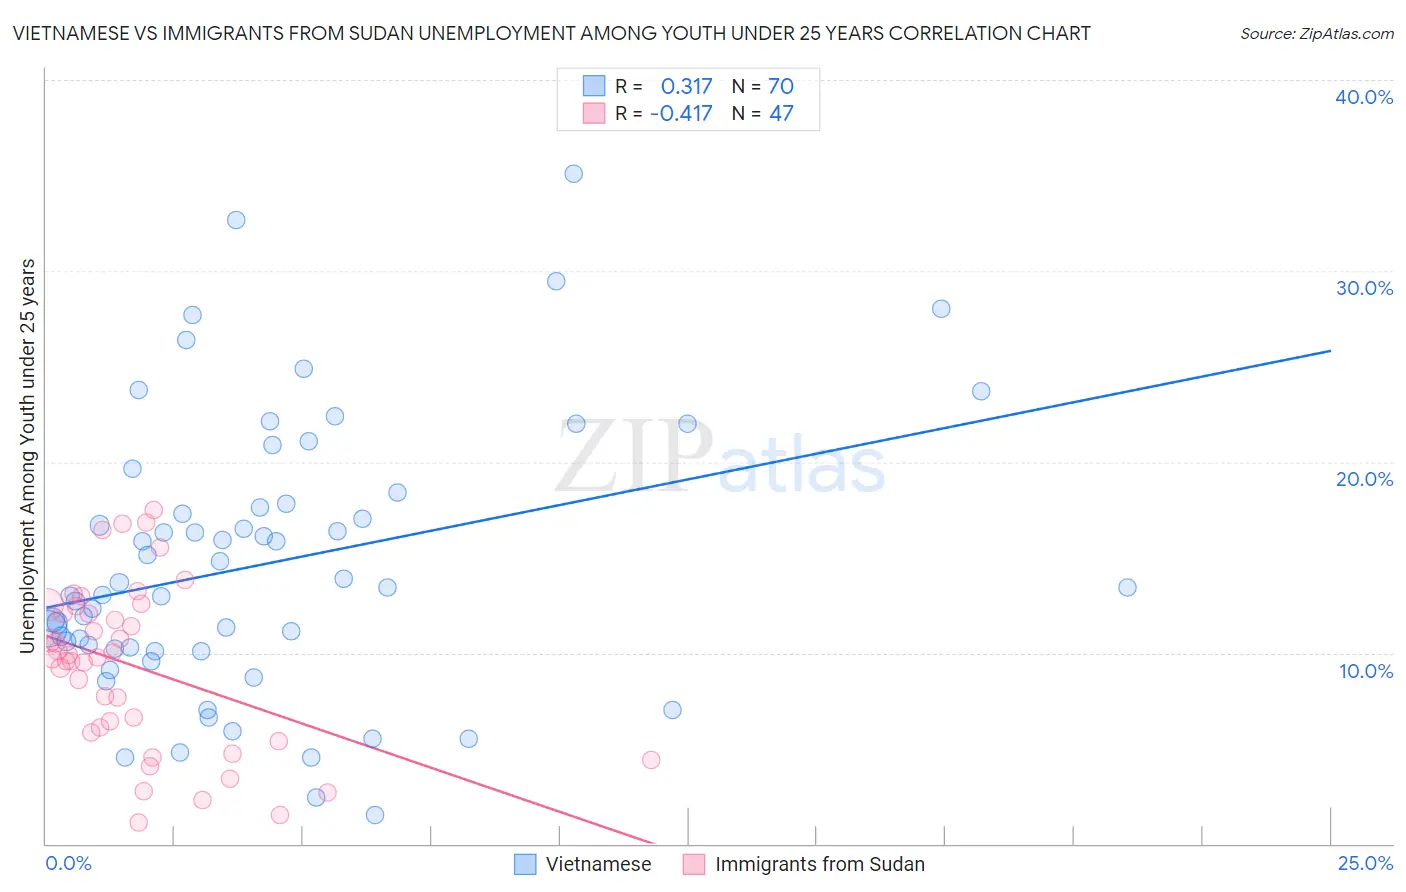
Vietnamese vs Immigrants from Sudan Unemployment Among Youth under 25 years Correlation Chart

The statistical analysis conducted on geographies consisting of 170,235,906 people shows a mild positive correlation between the proportion of Vietnamese and unemployment rate among youth under the age of 25 in the United States with a correlation coefficient (R) of 0.317 and weighted average of 14.3%. Similarly, the statistical analysis conducted on geographies consisting of 118,803,399 people shows a moderate negative correlation between the proportion of Immigrants from Sudan and unemployment rate among youth under the age of 25 in the United States with a correlation coefficient (R) of -0.417 and weighted average of 10.5%, a difference of 35.1%.
Vietnamese vs Immigrants from Sudan Unemployment Among Youth under 25 years

Unemployment Among Youth under 25 years Correlation Summary

MeasurementVietnameseImmigrants from Sudan
Minimum1.5%1.1%
Maximum35.1%17.5%
Range33.6%16.4%
Mean14.7%9.3%
Median13.4%9.8%
Interquartile 25% (IQ1)10.2%5.8%
Interquartile 75% (IQ3)17.8%12.4%
Interquartile Range (IQR)7.6%6.6%
Standard Deviation (Sample)7.1%4.3%
Standard Deviation (Population)7.1%4.3%

Similar Demographics by Unemployment Among Youth under 25 years

Demographics Similar to Vietnamese by Unemployment Among Youth under 25 years

In terms of unemployment among youth under 25 years, the demographic groups most similar to Vietnamese are Immigrants from Bangladesh (14.2%, a difference of 0.31%), Immigrants from West Indies (14.2%, a difference of 0.34%), Immigrants from Armenia (14.4%, a difference of 0.83%), Aleut (14.1%, a difference of 0.89%), and Jamaican (14.4%, a difference of 0.92%).
DemographicsRating | RankUnemployment Among Youth under 25 years
Haitians
0.0
/100
|
#305
Tragic
13.9%
Pueblo
0.0
/100
|
#306
Tragic
13.9%
Immigrants | Haiti
0.0
/100
|
#307
Tragic
14.0%
Immigrants | Belize
0.0
/100
|
#308
Tragic
14.0%
Aleuts
0.0
/100
|
#309
Tragic
14.1%
Immigrants | West Indies
0.0
/100
|
#310
Tragic
14.2%
Immigrants | Bangladesh
0.0
/100
|
#311
Tragic
14.2%
Vietnamese
0.0
/100
|
#312
Tragic
14.3%
Immigrants | Armenia
0.0
/100
|
#313
Tragic
14.4%
Jamaicans
0.0
/100
|
#314
Tragic
14.4%
Sioux
0.0
/100
|
#315
Tragic
14.4%
Natives/Alaskans
0.0
/100
|
#316
Tragic
14.5%
Blacks/African Americans
0.0
/100
|
#317
Tragic
14.5%
Immigrants | Dominica
0.0
/100
|
#318
Tragic
14.6%
West Indians
0.0
/100
|
#319
Tragic
14.6%

Demographics Similar to Immigrants from Sudan by Unemployment Among Youth under 25 years

In terms of unemployment among youth under 25 years, the demographic groups most similar to Immigrants from Sudan are Indonesian (10.6%, a difference of 0.12%), Cuban (10.6%, a difference of 0.14%), Scandinavian (10.5%, a difference of 0.18%), Sudanese (10.6%, a difference of 0.25%), and Venezuelan (10.6%, a difference of 0.26%).
DemographicsRating | RankUnemployment Among Youth under 25 years
Czechs
100.0
/100
|
#5
Exceptional
10.3%
Danes
100.0
/100
|
#6
Exceptional
10.3%
Swedes
100.0
/100
|
#7
Exceptional
10.4%
Immigrants | Venezuela
100.0
/100
|
#8
Exceptional
10.5%
Germans
100.0
/100
|
#9
Exceptional
10.5%
Immigrants | Somalia
100.0
/100
|
#10
Exceptional
10.5%
Scandinavians
100.0
/100
|
#11
Exceptional
10.5%
Immigrants | Sudan
100.0
/100
|
#12
Exceptional
10.5%
Indonesians
100.0
/100
|
#13
Exceptional
10.6%
Cubans
100.0
/100
|
#14
Exceptional
10.6%
Sudanese
100.0
/100
|
#15
Exceptional
10.6%
Venezuelans
100.0
/100
|
#16
Exceptional
10.6%
Menominee
100.0
/100
|
#17
Exceptional
10.6%
Swiss
100.0
/100
|
#18
Exceptional
10.6%
Immigrants | Burma/Myanmar
100.0
/100
|
#19
Exceptional
10.6%