Venezuelan vs Carpatho Rusyn Unemployment Among Women with Children Under 18 years
COMPARE
Venezuelan
Carpatho Rusyn
Unemployment Among Women with Children Under 18 years
Unemployment Among Women with Children Under 18 years Comparison
Venezuelans
Carpatho Rusyns
5.3%
UNEMPLOYMENT AMONG WOMEN WITH CHILDREN UNDER 18 YEARS
76.0/ 100
METRIC RATING
141st/ 347
METRIC RANK
5.4%
UNEMPLOYMENT AMONG WOMEN WITH CHILDREN UNDER 18 YEARS
70.8/ 100
METRIC RATING
153rd/ 347
METRIC RANK
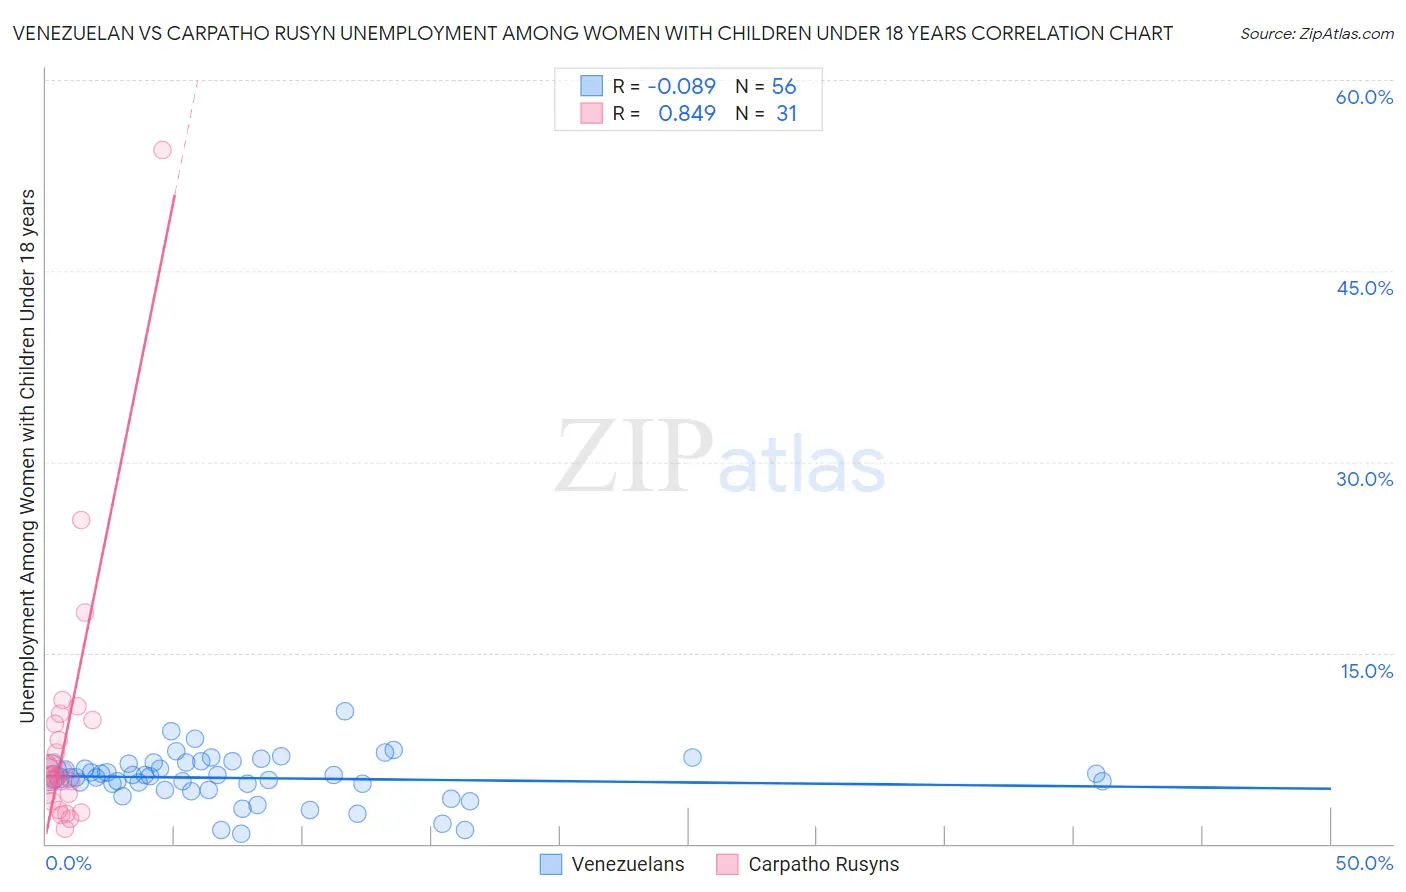
Venezuelan vs Carpatho Rusyn Unemployment Among Women with Children Under 18 years Correlation Chart
The statistical analysis conducted on geographies consisting of 298,794,110 people shows a slight negative correlation between the proportion of Venezuelans and unemployment rate among women with children under the age of 18 in the United States with a correlation coefficient (R) of -0.089 and weighted average of 5.3%. Similarly, the statistical analysis conducted on geographies consisting of 58,081,192 people shows a very strong positive correlation between the proportion of Carpatho Rusyns and unemployment rate among women with children under the age of 18 in the United States with a correlation coefficient (R) of 0.849 and weighted average of 5.4%, a difference of 0.48%.
Unemployment Among Women with Children Under 18 years Correlation Summary
| Measurement | Venezuelan | Carpatho Rusyn |
| Minimum | 0.80% | 1.2% |
| Maximum | 10.4% | 54.5% |
| Range | 9.6% | 53.3% |
| Mean | 5.2% | 8.2% |
| Median | 5.3% | 5.4% |
| Interquartile 25% (IQ1) | 4.5% | 3.9% |
| Interquartile 75% (IQ3) | 6.3% | 9.5% |
| Interquartile Range (IQR) | 1.8% | 5.6% |
| Standard Deviation (Sample) | 1.8% | 9.9% |
| Standard Deviation (Population) | 1.8% | 9.7% |
Demographics Similar to Venezuelans and Carpatho Rusyns by Unemployment Among Women with Children Under 18 years
In terms of unemployment among women with children under 18 years, the demographic groups most similar to Venezuelans are Immigrants from Norway (5.3%, a difference of 0.020%), Immigrants from Venezuela (5.3%, a difference of 0.060%), Chilean (5.3%, a difference of 0.10%), Immigrants from England (5.3%, a difference of 0.11%), and Immigrants from Egypt (5.3%, a difference of 0.20%). Similarly, the demographic groups most similar to Carpatho Rusyns are Immigrants from Latvia (5.4%, a difference of 0.0%), Immigrants from South Eastern Asia (5.4%, a difference of 0.020%), Immigrants from Iran (5.4%, a difference of 0.030%), Korean (5.4%, a difference of 0.030%), and South African (5.4%, a difference of 0.050%).
| Demographics | Rating | Rank | Unemployment Among Women with Children Under 18 years |
| Jordanians | 78.8 /100 | #137 | Good 5.3% |
| Argentineans | 78.8 /100 | #138 | Good 5.3% |
| Immigrants | Ukraine | 78.5 /100 | #139 | Good 5.3% |
| Immigrants | Norway | 76.2 /100 | #140 | Good 5.3% |
| Venezuelans | 76.0 /100 | #141 | Good 5.3% |
| Immigrants | Venezuela | 75.4 /100 | #142 | Good 5.3% |
| Chileans | 75.0 /100 | #143 | Good 5.3% |
| Immigrants | England | 74.9 /100 | #144 | Good 5.3% |
| Immigrants | Egypt | 74.0 /100 | #145 | Good 5.3% |
| Immigrants | Belarus | 73.4 /100 | #146 | Good 5.3% |
| Bangladeshis | 73.2 /100 | #147 | Good 5.3% |
| Immigrants | Western Europe | 72.8 /100 | #148 | Good 5.4% |
| Immigrants | Kenya | 72.2 /100 | #149 | Good 5.4% |
| Immigrants | Argentina | 71.7 /100 | #150 | Good 5.4% |
| Immigrants | Iran | 71.1 /100 | #151 | Good 5.4% |
| Immigrants | South Eastern Asia | 71.1 /100 | #152 | Good 5.4% |
| Carpatho Rusyns | 70.8 /100 | #153 | Good 5.4% |
| Immigrants | Latvia | 70.8 /100 | #154 | Good 5.4% |
| Koreans | 70.5 /100 | #155 | Good 5.4% |
| South Africans | 70.3 /100 | #156 | Good 5.4% |
| German Russians | 70.2 /100 | #157 | Good 5.4% |