U.S. Virgin Islander vs Portuguese Unemployment Among Ages 16 to 19 years

COMPARE

U.S. Virgin Islander
Race
Ancestry
AfghanAfricanAlaska NativeAlaskan AthabascanAlbanianAleutAlsatianAmericanApacheArabArapahoArgentineanArmenianAssyrian/Chaldean/SyriacAustralianAustrianBahamianBangladeshiBarbadianBasqueBelgianBelizeanBermudanBhutaneseBlackfeetBolivianBrazilianBritishBritish West IndianBulgarianBurmeseCajunCambodianCanadianCape VerdeanCarpatho RusynCelticCentral AmericanCentral American IndianCherokeeCheyenneChickasawChileanChineseChippewaChoctawColombianColvilleComancheCosta RicanCreeCreekCroatianCrowCubanCypriotCzechCzechoslovakianDanishDelawareDominicanDutchDutch West IndianEastern EuropeanEcuadorianEgyptianEnglishEstonianEthiopianEuropeanFijianFilipinoFinnishFrenchFrench American IndianFrench CanadianGermanGerman RussianGhanaianGreekGuamanian/ChamorroGuatemalanGuyaneseHaitianHmongHonduranHopiHoumaHungarianIcelanderIndian (Asian)IndonesianInupiatIranianIraqiIrishIroquoisIsraeliItalianJamaicanJapaneseJordanianKenyanKiowaKoreanLaotianLatvianLebaneseLiberianLithuanianLumbeeLuxembourgerMacedonianMalaysianMalteseMarshalleseMenomineeMexicanMexican American IndianMongolianMoroccanNative HawaiianNavajoNepaleseNew ZealanderNicaraguanNigerianNorthern EuropeanNorwegianOkinawanOsageOttawaPaiutePakistaniPalestinianPanamanianParaguayanPennsylvania GermanPeruvianPimaPolishPotawatomiPuebloPuerto RicanPuget Sound SalishRomanianRussianSalvadoranSamoanScandinavianScotch-IrishScottishSeminoleSenegaleseSerbianShoshoneSierra LeoneanSiouxSlavicSlovakSloveneSomaliSouth AfricanSouth AmericanSouth American IndianSoviet UnionSpaniardSpanishSpanish AmericanSpanish American IndianSri LankanSubsaharan AfricanSudaneseSwedishSwissSyrianTaiwaneseThaiTlingit-HaidaTohono O'OdhamTonganTrinidadian and TobagonianTsimshianTurkishU.S. Virgin IslanderUgandanUkrainianUruguayanUteVenezuelanVietnameseWelshWest IndianYakamaYaquiYugoslavianYumanYup'ikZimbabwean
Immigration
NonimmigrantsImmigrantsAfghanistanAfricaAlbaniaArgentinaArmeniaAsiaAustraliaAustriaBahamasBangladeshBarbadosBelarusBelgiumBelizeBoliviaBosnia and HerzegovinaBrazilBulgariaBurma/MyanmarCabo VerdeCambodiaCameroonCanadaCaribbeanCentral AmericaChileChinaColombiaCongoCosta RicaCroatiaCubaCzechoslovakiaDenmarkDominicaDominican RepublicEastern AfricaEastern AsiaEastern EuropeEcuadorEgyptEl SalvadorEnglandEritreaEthiopiaEuropeFijiFranceGermanyGhanaGreeceGrenadaGuatemalaGuyanaHaitiHondurasHong KongHungaryIndiaIndonesiaIranIraqIrelandIsraelItalyJamaicaJapanJordanKazakhstanKenyaKoreaKuwaitLaosLatin AmericaLatviaLebanonLiberiaLithuaniaMalaysiaMexicoMicronesiaMiddle AfricaMoldovaMoroccoNepalNetherlandsNicaraguaNigeriaNorth AmericaNorth MacedoniaNorthern AfricaNorthern EuropeNorwayOceaniaPakistanPanamaPeruPhilippinesPolandPortugalRomaniaRussiaSaudi ArabiaScotlandSenegalSerbiaSierra LeoneSingaporeSomaliaSouth AfricaSouth AmericaSouth Central AsiaSouth Eastern AsiaSouthern EuropeSpainSri LankaSt. Vincent and the GrenadinesSudanSwedenSwitzerlandSyriaTaiwanThailandTrinidad and TobagoTurkeyUgandaUkraineUruguayUzbekistanVenezuelaVietnamWest IndiesWestern AfricaWestern AsiaWestern EuropeYemenZaireZimbabweAzores
Portuguese
Race
Ancestry
AfghanAfricanAlaska NativeAlaskan AthabascanAlbanianAleutAlsatianAmericanApacheArabArapahoArgentineanArmenianAssyrian/Chaldean/SyriacAustralianAustrianBahamianBangladeshiBarbadianBasqueBelgianBelizeanBermudanBhutaneseBlackfeetBolivianBrazilianBritishBritish West IndianBulgarianBurmeseCajunCambodianCanadianCape VerdeanCarpatho RusynCelticCentral AmericanCentral American IndianCherokeeCheyenneChickasawChileanChineseChippewaChoctawColombianColvilleComancheCosta RicanCreeCreekCroatianCrowCubanCypriotCzechCzechoslovakianDanishDelawareDominicanDutchDutch West IndianEastern EuropeanEcuadorianEgyptianEnglishEstonianEthiopianEuropeanFijianFilipinoFinnishFrenchFrench American IndianFrench CanadianGermanGerman RussianGhanaianGreekGuamanian/ChamorroGuatemalanGuyaneseHaitianHmongHonduranHopiHoumaHungarianIcelanderIndian (Asian)IndonesianInupiatIranianIraqiIrishIroquoisIsraeliItalianJamaicanJapaneseJordanianKenyanKiowaKoreanLaotianLatvianLebaneseLiberianLithuanianLumbeeLuxembourgerMacedonianMalaysianMalteseMarshalleseMenomineeMexicanMexican American IndianMongolianMoroccanNative HawaiianNavajoNepaleseNew ZealanderNicaraguanNigerianNorthern EuropeanNorwegianOkinawanOsageOttawaPaiutePakistaniPalestinianPanamanianParaguayanPennsylvania GermanPeruvianPimaPolishPortuguesePotawatomiPuebloPuerto RicanPuget Sound SalishRomanianRussianSalvadoranSamoanScandinavianScotch-IrishScottishSeminoleSenegaleseSerbianShoshoneSierra LeoneanSiouxSlavicSlovakSloveneSomaliSouth AfricanSouth AmericanSouth American IndianSoviet UnionSpaniardSpanishSpanish AmericanSpanish American IndianSri LankanSubsaharan AfricanSudaneseSwedishSwissSyrianTaiwaneseThaiTlingit-HaidaTohono O'OdhamTonganTrinidadian and TobagonianTsimshianTurkishUgandanUkrainianUruguayanUteVenezuelanVietnameseWelshWest IndianYakamaYaquiYugoslavianYumanYup'ikZimbabwean
Immigration
NonimmigrantsImmigrantsAfghanistanAfricaAlbaniaArgentinaArmeniaAsiaAustraliaAustriaBahamasBangladeshBarbadosBelarusBelgiumBelizeBoliviaBosnia and HerzegovinaBrazilBulgariaBurma/MyanmarCabo VerdeCambodiaCameroonCanadaCaribbeanCentral AmericaChileChinaColombiaCongoCosta RicaCroatiaCubaCzechoslovakiaDenmarkDominicaDominican RepublicEastern AfricaEastern AsiaEastern EuropeEcuadorEgyptEl SalvadorEnglandEritreaEthiopiaEuropeFijiFranceGermanyGhanaGreeceGrenadaGuatemalaGuyanaHaitiHondurasHong KongHungaryIndiaIndonesiaIranIraqIrelandIsraelItalyJamaicaJapanJordanKazakhstanKenyaKoreaKuwaitLaosLatin AmericaLatviaLebanonLiberiaLithuaniaMalaysiaMexicoMicronesiaMiddle AfricaMoldovaMoroccoNepalNetherlandsNicaraguaNigeriaNorth AmericaNorth MacedoniaNorthern AfricaNorthern EuropeNorwayOceaniaPakistanPanamaPeruPhilippinesPolandPortugalRomaniaRussiaSaudi ArabiaScotlandSenegalSerbiaSierra LeoneSingaporeSomaliaSouth AfricaSouth AmericaSouth Central AsiaSouth Eastern AsiaSouthern EuropeSpainSri LankaSt. Vincent and the GrenadinesSudanSwedenSwitzerlandSyriaTaiwanThailandTrinidad and TobagoTurkeyUgandaUkraineUruguayUzbekistanVenezuelaVietnamWest IndiesWestern AfricaWestern AsiaWestern EuropeYemenZaireZimbabweAzores
Unemployment Among Ages 16 to 19 years
Income
Poverty
Unemployment
Labor Participation
Family Structure
Vehicle Availability
Education Level
Disability

Unemployment Among Ages 16 to 19 years Comparison

U.S. Virgin Islanders

Portuguese

Tragic
Good
21.3%
UNEMPLOYMENT AMONG AGES 16 TO 19 YEARS
0.0/ 100
METRIC RATING
306th/ 347
METRIC RANK
17.4%
UNEMPLOYMENT AMONG AGES 16 TO 19 YEARS
67.3/ 100
METRIC RATING
155th/ 347
METRIC RANK

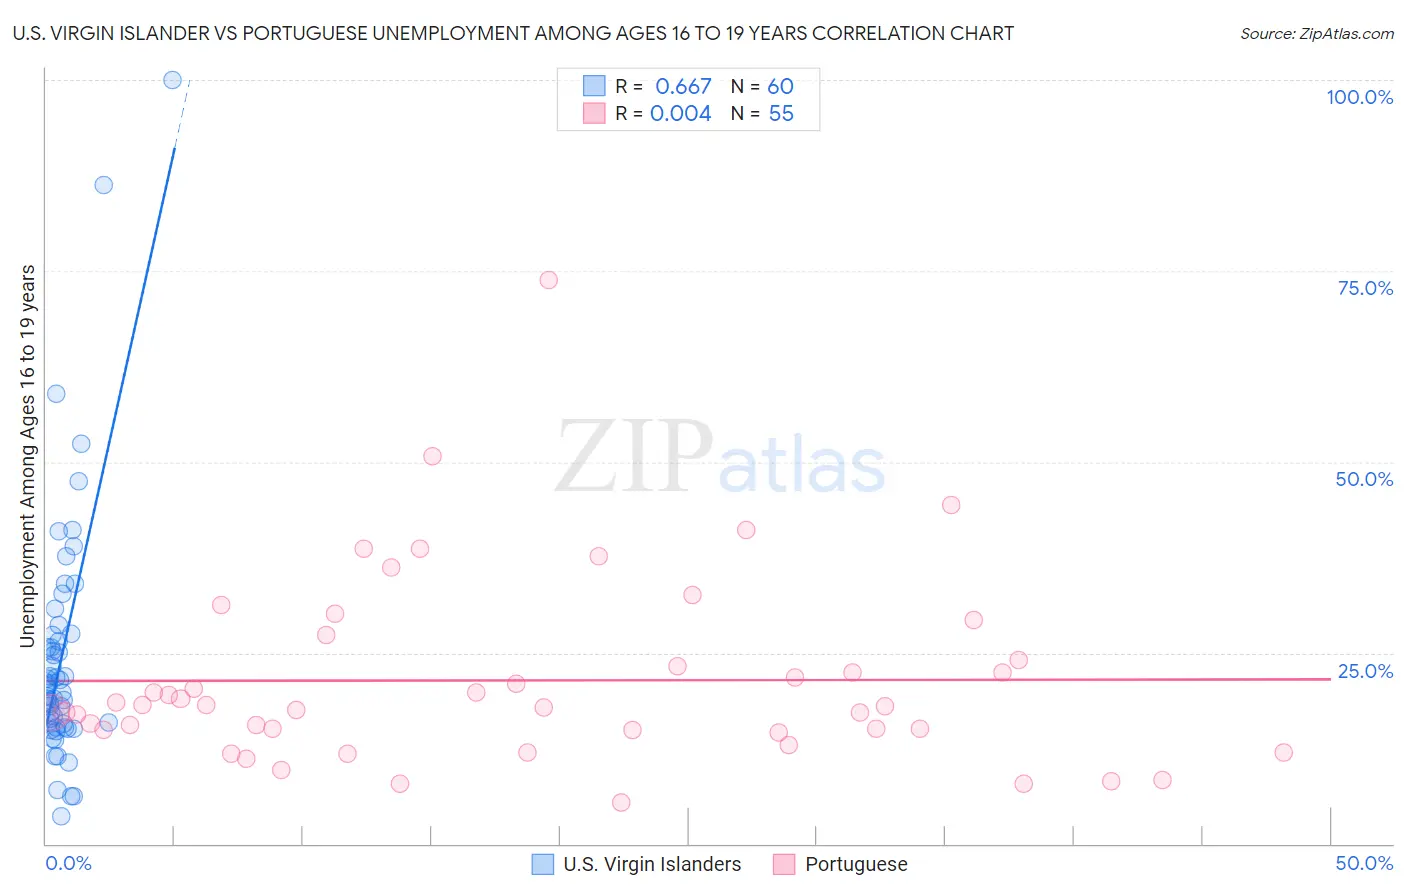
U.S. Virgin Islander vs Portuguese Unemployment Among Ages 16 to 19 years Correlation Chart

The statistical analysis conducted on geographies consisting of 86,637,334 people shows a significant positive correlation between the proportion of U.S. Virgin Islanders and unemployment rate among population between the ages 16 and 19 in the United States with a correlation coefficient (R) of 0.667 and weighted average of 21.3%. Similarly, the statistical analysis conducted on geographies consisting of 420,400,969 people shows no correlation between the proportion of Portuguese and unemployment rate among population between the ages 16 and 19 in the United States with a correlation coefficient (R) of 0.004 and weighted average of 17.4%, a difference of 22.1%.
U.S. Virgin Islander vs Portuguese Unemployment Among Ages 16 to 19 years

Unemployment Among Ages 16 to 19 years Correlation Summary

MeasurementU.S. Virgin IslanderPortuguese
Minimum3.6%5.4%
Maximum100.0%73.9%
Range96.4%68.5%
Mean24.8%21.4%
Median20.7%18.0%
Interquartile 25% (IQ1)15.5%14.8%
Interquartile 75% (IQ3)27.4%24.0%
Interquartile Range (IQR)11.9%9.2%
Standard Deviation (Sample)16.8%12.3%
Standard Deviation (Population)16.7%12.2%

Similar Demographics by Unemployment Among Ages 16 to 19 years

Demographics Similar to U.S. Virgin Islanders by Unemployment Among Ages 16 to 19 years

In terms of unemployment among ages 16 to 19 years, the demographic groups most similar to U.S. Virgin Islanders are Immigrants from Senegal (21.2%, a difference of 0.40%), Aleut (21.2%, a difference of 0.56%), Black/African American (21.4%, a difference of 0.58%), Immigrants from Bangladesh (21.5%, a difference of 0.97%), and Native/Alaskan (21.5%, a difference of 1.1%).
DemographicsRating | RankUnemployment Among Ages 16 to 19 years
Immigrants | Uzbekistan
0.0
/100
|
#299
Tragic
20.5%
Ecuadorians
0.0
/100
|
#300
Tragic
20.5%
Immigrants | Ecuador
0.0
/100
|
#301
Tragic
20.9%
Immigrants | Caribbean
0.0
/100
|
#302
Tragic
20.9%
Senegalese
0.0
/100
|
#303
Tragic
21.0%
Aleuts
0.0
/100
|
#304
Tragic
21.2%
Immigrants | Senegal
0.0
/100
|
#305
Tragic
21.2%
U.S. Virgin Islanders
0.0
/100
|
#306
Tragic
21.3%
Blacks/African Americans
0.0
/100
|
#307
Tragic
21.4%
Immigrants | Bangladesh
0.0
/100
|
#308
Tragic
21.5%
Natives/Alaskans
0.0
/100
|
#309
Tragic
21.5%
Vietnamese
0.0
/100
|
#310
Tragic
21.5%
Belizeans
0.0
/100
|
#311
Tragic
21.6%
Houma
0.0
/100
|
#312
Tragic
21.6%
Jamaicans
0.0
/100
|
#313
Tragic
21.7%

Demographics Similar to Portuguese by Unemployment Among Ages 16 to 19 years

In terms of unemployment among ages 16 to 19 years, the demographic groups most similar to Portuguese are Afghan (17.4%, a difference of 0.050%), Immigrants from Afghanistan (17.4%, a difference of 0.070%), Costa Rican (17.4%, a difference of 0.070%), Immigrants from Northern Africa (17.4%, a difference of 0.090%), and Immigrants from Hong Kong (17.4%, a difference of 0.11%).
DemographicsRating | RankUnemployment Among Ages 16 to 19 years
Romanians
74.9
/100
|
#148
Good
17.3%
Immigrants | Eastern Asia
73.8
/100
|
#149
Good
17.4%
Immigrants | Northern Europe
72.5
/100
|
#150
Good
17.4%
Immigrants | Hong Kong
69.3
/100
|
#151
Good
17.4%
Immigrants | Northern Africa
69.0
/100
|
#152
Good
17.4%
Immigrants | Afghanistan
68.6
/100
|
#153
Good
17.4%
Afghans
68.1
/100
|
#154
Good
17.4%
Portuguese
67.3
/100
|
#155
Good
17.4%
Costa Ricans
65.9
/100
|
#156
Good
17.4%
Uruguayans
64.3
/100
|
#157
Good
17.5%
Immigrants | China
64.1
/100
|
#158
Good
17.5%
Koreans
61.0
/100
|
#159
Good
17.5%
Ukrainians
60.5
/100
|
#160
Good
17.5%
Immigrants | Denmark
60.3
/100
|
#161
Good
17.5%
Immigrants | Norway
59.8
/100
|
#162
Average
17.5%