Tsimshian vs Subsaharan African Unemployment Among Seniors over 65 years

COMPARE

Tsimshian
Race
Ancestry
AfghanAfricanAlaska NativeAlaskan AthabascanAlbanianAleutAlsatianAmericanApacheArabArapahoArgentineanArmenianAssyrian/Chaldean/SyriacAustralianAustrianBahamianBangladeshiBarbadianBasqueBelgianBelizeanBermudanBhutaneseBlackfeetBolivianBrazilianBritishBritish West IndianBulgarianBurmeseCajunCambodianCanadianCape VerdeanCarpatho RusynCelticCentral AmericanCentral American IndianCherokeeCheyenneChickasawChileanChineseChippewaChoctawColombianColvilleComancheCosta RicanCreeCreekCroatianCrowCubanCypriotCzechCzechoslovakianDanishDelawareDominicanDutchDutch West IndianEastern EuropeanEcuadorianEgyptianEnglishEstonianEthiopianEuropeanFijianFilipinoFinnishFrenchFrench American IndianFrench CanadianGermanGerman RussianGhanaianGreekGuamanian/ChamorroGuatemalanGuyaneseHaitianHmongHonduranHopiHoumaHungarianIcelanderIndian (Asian)IndonesianInupiatIranianIraqiIrishIroquoisIsraeliItalianJamaicanJapaneseJordanianKenyanKiowaKoreanLaotianLatvianLebaneseLiberianLithuanianLumbeeLuxembourgerMacedonianMalaysianMalteseMarshalleseMenomineeMexicanMexican American IndianMongolianMoroccanNative HawaiianNavajoNepaleseNew ZealanderNicaraguanNigerianNorthern EuropeanNorwegianOkinawanOsageOttawaPaiutePakistaniPalestinianPanamanianParaguayanPennsylvania GermanPeruvianPimaPolishPortuguesePotawatomiPuebloPuerto RicanPuget Sound SalishRomanianRussianSalvadoranSamoanScandinavianScotch-IrishScottishSeminoleSenegaleseSerbianShoshoneSierra LeoneanSiouxSlavicSlovakSloveneSomaliSouth AfricanSouth AmericanSouth American IndianSoviet UnionSpaniardSpanishSpanish AmericanSpanish American IndianSri LankanSudaneseSwedishSwissSyrianTaiwaneseThaiTlingit-HaidaTohono O'OdhamTonganTrinidadian and TobagonianTsimshianTurkishU.S. Virgin IslanderUgandanUkrainianUruguayanUteVenezuelanVietnameseWelshWest IndianYakamaYaquiYugoslavianYumanYup'ikZimbabwean
Immigration
NonimmigrantsImmigrantsAfghanistanAfricaAlbaniaArgentinaArmeniaAsiaAustraliaAustriaBahamasBangladeshBarbadosBelarusBelgiumBelizeBoliviaBosnia and HerzegovinaBrazilBulgariaBurma/MyanmarCabo VerdeCambodiaCameroonCanadaCaribbeanCentral AmericaChileChinaColombiaCongoCosta RicaCroatiaCubaCzechoslovakiaDenmarkDominicaDominican RepublicEastern AfricaEastern AsiaEastern EuropeEcuadorEgyptEl SalvadorEnglandEritreaEthiopiaEuropeFijiFranceGermanyGhanaGreeceGrenadaGuatemalaGuyanaHaitiHondurasHong KongHungaryIndiaIndonesiaIranIraqIrelandIsraelItalyJamaicaJapanJordanKazakhstanKenyaKoreaKuwaitLaosLatin AmericaLatviaLebanonLiberiaLithuaniaMalaysiaMexicoMicronesiaMiddle AfricaMoldovaMoroccoNepalNetherlandsNicaraguaNigeriaNorth AmericaNorth MacedoniaNorthern AfricaNorthern EuropeNorwayOceaniaPakistanPanamaPeruPhilippinesPolandPortugalRomaniaRussiaSaudi ArabiaScotlandSenegalSerbiaSierra LeoneSingaporeSomaliaSouth AfricaSouth AmericaSouth Central AsiaSouth Eastern AsiaSouthern EuropeSpainSri LankaSt. Vincent and the GrenadinesSudanSwedenSwitzerlandSyriaTaiwanThailandTrinidad and TobagoTurkeyUgandaUkraineUruguayUzbekistanVenezuelaVietnamWest IndiesWestern AfricaWestern AsiaWestern EuropeYemenZaireZimbabweAzores
Subsaharan African
Race
Ancestry
AfghanAfricanAlaska NativeAlaskan AthabascanAlbanianAleutAlsatianAmericanApacheArabArapahoArgentineanArmenianAssyrian/Chaldean/SyriacAustralianAustrianBahamianBangladeshiBarbadianBasqueBelgianBelizeanBermudanBhutaneseBlackfeetBolivianBrazilianBritishBritish West IndianBulgarianBurmeseCajunCambodianCanadianCape VerdeanCarpatho RusynCelticCentral AmericanCentral American IndianCherokeeCheyenneChickasawChileanChineseChippewaChoctawColombianColvilleComancheCosta RicanCreeCreekCroatianCrowCubanCypriotCzechCzechoslovakianDanishDelawareDominicanDutchDutch West IndianEastern EuropeanEcuadorianEgyptianEnglishEstonianEthiopianEuropeanFijianFilipinoFinnishFrenchFrench American IndianFrench CanadianGermanGerman RussianGhanaianGreekGuamanian/ChamorroGuatemalanGuyaneseHaitianHmongHonduranHopiHoumaHungarianIcelanderIndian (Asian)IndonesianInupiatIranianIraqiIrishIroquoisIsraeliItalianJamaicanJapaneseJordanianKenyanKiowaKoreanLaotianLatvianLebaneseLiberianLithuanianLumbeeLuxembourgerMacedonianMalaysianMalteseMarshalleseMenomineeMexicanMexican American IndianMongolianMoroccanNative HawaiianNavajoNepaleseNew ZealanderNicaraguanNigerianNorthern EuropeanNorwegianOkinawanOsageOttawaPaiutePakistaniPalestinianPanamanianParaguayanPennsylvania GermanPeruvianPimaPolishPortuguesePotawatomiPuebloPuerto RicanPuget Sound SalishRomanianRussianSalvadoranSamoanScandinavianScotch-IrishScottishSeminoleSenegaleseSerbianShoshoneSierra LeoneanSiouxSlavicSlovakSloveneSomaliSouth AfricanSouth AmericanSouth American IndianSoviet UnionSpaniardSpanishSpanish AmericanSpanish American IndianSri LankanSubsaharan AfricanSudaneseSwedishSwissSyrianTaiwaneseThaiTlingit-HaidaTohono O'OdhamTonganTrinidadian and TobagonianTurkishU.S. Virgin IslanderUgandanUkrainianUruguayanUteVenezuelanVietnameseWelshWest IndianYakamaYaquiYugoslavianYumanYup'ikZimbabwean
Immigration
NonimmigrantsImmigrantsAfghanistanAfricaAlbaniaArgentinaArmeniaAsiaAustraliaAustriaBahamasBangladeshBarbadosBelarusBelgiumBelizeBoliviaBosnia and HerzegovinaBrazilBulgariaBurma/MyanmarCabo VerdeCambodiaCameroonCanadaCaribbeanCentral AmericaChileChinaColombiaCongoCosta RicaCroatiaCubaCzechoslovakiaDenmarkDominicaDominican RepublicEastern AfricaEastern AsiaEastern EuropeEcuadorEgyptEl SalvadorEnglandEritreaEthiopiaEuropeFijiFranceGermanyGhanaGreeceGrenadaGuatemalaGuyanaHaitiHondurasHong KongHungaryIndiaIndonesiaIranIraqIrelandIsraelItalyJamaicaJapanJordanKazakhstanKenyaKoreaKuwaitLaosLatin AmericaLatviaLebanonLiberiaLithuaniaMalaysiaMexicoMicronesiaMiddle AfricaMoldovaMoroccoNepalNetherlandsNicaraguaNigeriaNorth AmericaNorth MacedoniaNorthern AfricaNorthern EuropeNorwayOceaniaPakistanPanamaPeruPhilippinesPolandPortugalRomaniaRussiaSaudi ArabiaScotlandSenegalSerbiaSierra LeoneSingaporeSomaliaSouth AfricaSouth AmericaSouth Central AsiaSouth Eastern AsiaSouthern EuropeSpainSri LankaSt. Vincent and the GrenadinesSudanSwedenSwitzerlandSyriaTaiwanThailandTrinidad and TobagoTurkeyUgandaUkraineUruguayUzbekistanVenezuelaVietnamWest IndiesWestern AfricaWestern AsiaWestern EuropeYemenZaireZimbabweAzores
Unemployment Among Seniors over 65 years
Income
Poverty
Unemployment
Labor Participation
Family Structure
Vehicle Availability
Education Level
Disability

Unemployment Among Seniors over 65 years Comparison

Tsimshian

Sub-Saharan Africans

Exceptional
Poor
4.5%
UNEMPLOYMENT AMONG SENIORS OVER 65 YEARS
100.0/ 100
METRIC RATING
8th/ 347
METRIC RANK
5.2%
UNEMPLOYMENT AMONG SENIORS OVER 65 YEARS
17.1/ 100
METRIC RATING
203rd/ 347
METRIC RANK

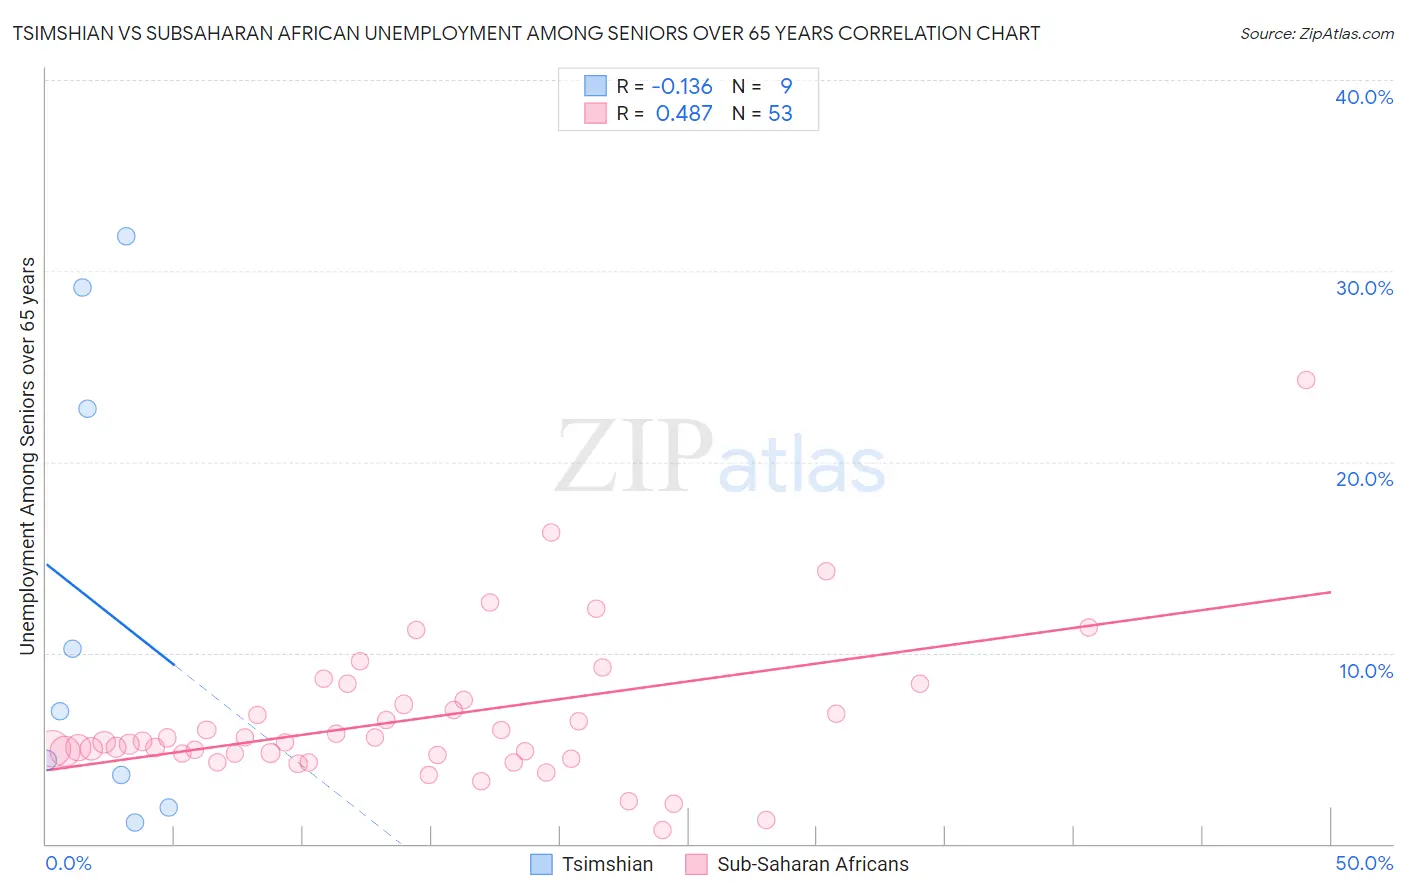
Tsimshian vs Subsaharan African Unemployment Among Seniors over 65 years Correlation Chart

The statistical analysis conducted on geographies consisting of 15,009,630 people shows a poor negative correlation between the proportion of Tsimshian and unemployment rate amomg seniors over the age of 65 in the United States with a correlation coefficient (R) of -0.136 and weighted average of 4.5%. Similarly, the statistical analysis conducted on geographies consisting of 436,089,734 people shows a moderate positive correlation between the proportion of Sub-Saharan Africans and unemployment rate amomg seniors over the age of 65 in the United States with a correlation coefficient (R) of 0.487 and weighted average of 5.2%, a difference of 15.2%.
Tsimshian vs Subsaharan African Unemployment Among Seniors over 65 years

Unemployment Among Seniors over 65 years Correlation Summary

MeasurementTsimshianSubsaharan African
Minimum1.1%0.70%
Maximum31.8%24.3%
Range30.7%23.6%
Mean12.4%6.5%
Median6.9%5.3%
Interquartile 25% (IQ1)2.8%4.7%
Interquartile 75% (IQ3)26.0%7.4%
Interquartile Range (IQR)23.2%2.7%
Standard Deviation (Sample)12.1%4.0%
Standard Deviation (Population)11.4%3.9%

Similar Demographics by Unemployment Among Seniors over 65 years

Demographics Similar to Tsimshian by Unemployment Among Seniors over 65 years

In terms of unemployment among seniors over 65 years, the demographic groups most similar to Tsimshian are Indonesian (4.5%, a difference of 0.49%), Immigrants from Zaire (4.5%, a difference of 0.50%), Immigrants from Congo (4.5%, a difference of 0.59%), Comanche (4.6%, a difference of 0.91%), and Immigrants from Cuba (4.5%, a difference of 1.4%).
DemographicsRating | RankUnemployment Among Seniors over 65 years
Chinese
100.0
/100
|
#1
Exceptional
4.2%
Hmong
100.0
/100
|
#2
Exceptional
4.2%
Fijians
100.0
/100
|
#3
Exceptional
4.2%
Sudanese
100.0
/100
|
#4
Exceptional
4.4%
Chickasaw
100.0
/100
|
#5
Exceptional
4.4%
Immigrants | Cuba
100.0
/100
|
#6
Exceptional
4.5%
Immigrants | Congo
100.0
/100
|
#7
Exceptional
4.5%
Tsimshian
100.0
/100
|
#8
Exceptional
4.5%
Indonesians
100.0
/100
|
#9
Exceptional
4.5%
Immigrants | Zaire
100.0
/100
|
#10
Exceptional
4.5%
Comanche
100.0
/100
|
#11
Exceptional
4.6%
Osage
100.0
/100
|
#12
Exceptional
4.6%
Cubans
100.0
/100
|
#13
Exceptional
4.6%
Menominee
100.0
/100
|
#14
Exceptional
4.6%
Lumbee
100.0
/100
|
#15
Exceptional
4.6%

Demographics Similar to Sub-Saharan Africans by Unemployment Among Seniors over 65 years

In terms of unemployment among seniors over 65 years, the demographic groups most similar to Sub-Saharan Africans are Immigrants from China (5.2%, a difference of 0.010%), Immigrants from Northern Africa (5.2%, a difference of 0.030%), Laotian (5.2%, a difference of 0.060%), Immigrants from Pakistan (5.2%, a difference of 0.070%), and Immigrants from Europe (5.2%, a difference of 0.10%).
DemographicsRating | RankUnemployment Among Seniors over 65 years
Immigrants | Poland
24.3
/100
|
#196
Fair
5.2%
Guamanians/Chamorros
22.5
/100
|
#197
Fair
5.2%
Maltese
19.6
/100
|
#198
Poor
5.2%
Immigrants | Europe
19.0
/100
|
#199
Poor
5.2%
Immigrants | Pakistan
18.4
/100
|
#200
Poor
5.2%
Laotians
18.1
/100
|
#201
Poor
5.2%
Immigrants | Northern Africa
17.7
/100
|
#202
Poor
5.2%
Sub-Saharan Africans
17.1
/100
|
#203
Poor
5.2%
Immigrants | China
16.9
/100
|
#204
Poor
5.2%
South American Indians
15.3
/100
|
#205
Poor
5.2%
German Russians
14.7
/100
|
#206
Poor
5.2%
Immigrants | Philippines
13.2
/100
|
#207
Poor
5.2%
Uruguayans
12.6
/100
|
#208
Poor
5.2%
Alsatians
11.4
/100
|
#209
Poor
5.2%
Immigrants | Uzbekistan
10.7
/100
|
#210
Poor
5.2%