Tsimshian vs Immigrants from Sierra Leone Unemployment Among Women with Children Under 6 years

COMPARE

Tsimshian
Race
Ancestry
AfghanAfricanAlaska NativeAlaskan AthabascanAlbanianAleutAlsatianAmericanApacheArabArapahoArgentineanArmenianAssyrian/Chaldean/SyriacAustralianAustrianBahamianBangladeshiBarbadianBasqueBelgianBelizeanBermudanBhutaneseBlackfeetBolivianBrazilianBritishBritish West IndianBulgarianBurmeseCajunCambodianCanadianCape VerdeanCarpatho RusynCelticCentral AmericanCentral American IndianCherokeeCheyenneChickasawChileanChineseChippewaChoctawColombianColvilleComancheCosta RicanCreeCreekCroatianCrowCubanCypriotCzechCzechoslovakianDanishDelawareDominicanDutchDutch West IndianEastern EuropeanEcuadorianEgyptianEnglishEstonianEthiopianEuropeanFijianFilipinoFinnishFrenchFrench American IndianFrench CanadianGermanGerman RussianGhanaianGreekGuamanian/ChamorroGuatemalanGuyaneseHaitianHmongHonduranHopiHoumaHungarianIcelanderIndian (Asian)IndonesianInupiatIranianIraqiIrishIroquoisIsraeliItalianJamaicanJapaneseJordanianKenyanKiowaKoreanLaotianLatvianLebaneseLiberianLithuanianLumbeeLuxembourgerMacedonianMalaysianMalteseMarshalleseMenomineeMexicanMexican American IndianMongolianMoroccanNative HawaiianNavajoNepaleseNew ZealanderNicaraguanNigerianNorthern EuropeanNorwegianOkinawanOsageOttawaPaiutePakistaniPalestinianPanamanianParaguayanPennsylvania GermanPeruvianPimaPolishPortuguesePotawatomiPuebloPuerto RicanPuget Sound SalishRomanianRussianSalvadoranSamoanScandinavianScotch-IrishScottishSeminoleSenegaleseSerbianShoshoneSierra LeoneanSiouxSlavicSlovakSloveneSomaliSouth AfricanSouth AmericanSouth American IndianSoviet UnionSpaniardSpanishSpanish AmericanSpanish American IndianSri LankanSubsaharan AfricanSudaneseSwedishSwissSyrianTaiwaneseThaiTlingit-HaidaTohono O'OdhamTonganTrinidadian and TobagonianTsimshianTurkishU.S. Virgin IslanderUgandanUkrainianUruguayanUteVenezuelanVietnameseWelshWest IndianYakamaYaquiYugoslavianYumanYup'ikZimbabwean
Immigration
NonimmigrantsImmigrantsAfghanistanAfricaAlbaniaArgentinaArmeniaAsiaAustraliaAustriaBahamasBangladeshBarbadosBelarusBelgiumBelizeBoliviaBosnia and HerzegovinaBrazilBulgariaBurma/MyanmarCabo VerdeCambodiaCameroonCanadaCaribbeanCentral AmericaChileChinaColombiaCongoCosta RicaCroatiaCubaCzechoslovakiaDenmarkDominicaDominican RepublicEastern AfricaEastern AsiaEastern EuropeEcuadorEgyptEl SalvadorEnglandEritreaEthiopiaEuropeFijiFranceGermanyGhanaGreeceGrenadaGuatemalaGuyanaHaitiHondurasHong KongHungaryIndiaIndonesiaIranIraqIrelandIsraelItalyJamaicaJapanJordanKazakhstanKenyaKoreaKuwaitLaosLatin AmericaLatviaLebanonLiberiaLithuaniaMalaysiaMexicoMicronesiaMiddle AfricaMoldovaMoroccoNepalNetherlandsNicaraguaNigeriaNorth AmericaNorth MacedoniaNorthern AfricaNorthern EuropeNorwayOceaniaPakistanPanamaPeruPhilippinesPolandPortugalRomaniaRussiaSaudi ArabiaScotlandSenegalSerbiaSingaporeSomaliaSouth AfricaSouth AmericaSouth Central AsiaSouth Eastern AsiaSouthern EuropeSpainSri LankaSt. Vincent and the GrenadinesSudanSwedenSwitzerlandSyriaTaiwanThailandTrinidad and TobagoTurkeyUgandaUkraineUruguayUzbekistanVenezuelaVietnamWest IndiesWestern AfricaWestern AsiaWestern EuropeYemenZaireZimbabweAzores
Immigrants from Sierra Leone
Race
Ancestry
AfghanAfricanAlaska NativeAlaskan AthabascanAlbanianAleutAlsatianAmericanApacheArabArapahoArgentineanArmenianAssyrian/Chaldean/SyriacAustralianAustrianBahamianBangladeshiBarbadianBasqueBelgianBelizeanBermudanBhutaneseBlackfeetBolivianBrazilianBritishBritish West IndianBulgarianBurmeseCajunCambodianCanadianCape VerdeanCarpatho RusynCelticCentral AmericanCentral American IndianCherokeeCheyenneChickasawChileanChineseChippewaChoctawColombianColvilleComancheCosta RicanCreeCreekCroatianCrowCubanCypriotCzechCzechoslovakianDanishDelawareDominicanDutchDutch West IndianEastern EuropeanEcuadorianEgyptianEnglishEstonianEthiopianEuropeanFijianFilipinoFinnishFrenchFrench American IndianFrench CanadianGermanGerman RussianGhanaianGreekGuamanian/ChamorroGuatemalanGuyaneseHaitianHmongHonduranHopiHoumaHungarianIcelanderIndian (Asian)IndonesianInupiatIranianIraqiIrishIroquoisIsraeliItalianJamaicanJapaneseJordanianKenyanKiowaKoreanLaotianLatvianLebaneseLiberianLithuanianLumbeeLuxembourgerMacedonianMalaysianMalteseMarshalleseMenomineeMexicanMexican American IndianMongolianMoroccanNative HawaiianNavajoNepaleseNew ZealanderNicaraguanNigerianNorthern EuropeanNorwegianOkinawanOsageOttawaPaiutePakistaniPalestinianPanamanianParaguayanPennsylvania GermanPeruvianPimaPolishPortuguesePotawatomiPuebloPuerto RicanPuget Sound SalishRomanianRussianSalvadoranSamoanScandinavianScotch-IrishScottishSeminoleSenegaleseSerbianShoshoneSierra LeoneanSiouxSlavicSlovakSloveneSomaliSouth AfricanSouth AmericanSouth American IndianSoviet UnionSpaniardSpanishSpanish AmericanSpanish American IndianSri LankanSubsaharan AfricanSudaneseSwedishSwissSyrianTaiwaneseThaiTlingit-HaidaTohono O'OdhamTonganTrinidadian and TobagonianTurkishU.S. Virgin IslanderUgandanUkrainianUruguayanUteVenezuelanVietnameseWelshWest IndianYakamaYaquiYugoslavianYumanYup'ikZimbabwean
Immigration
NonimmigrantsImmigrantsAfghanistanAfricaAlbaniaArgentinaArmeniaAsiaAustraliaAustriaBahamasBangladeshBarbadosBelarusBelgiumBelizeBoliviaBosnia and HerzegovinaBrazilBulgariaBurma/MyanmarCabo VerdeCambodiaCameroonCanadaCaribbeanCentral AmericaChileChinaColombiaCongoCosta RicaCroatiaCubaCzechoslovakiaDenmarkDominicaDominican RepublicEastern AfricaEastern AsiaEastern EuropeEcuadorEgyptEl SalvadorEnglandEritreaEthiopiaEuropeFijiFranceGermanyGhanaGreeceGrenadaGuatemalaGuyanaHaitiHondurasHong KongHungaryIndiaIndonesiaIranIraqIrelandIsraelItalyJamaicaJapanJordanKazakhstanKenyaKoreaKuwaitLaosLatin AmericaLatviaLebanonLiberiaLithuaniaMalaysiaMexicoMicronesiaMiddle AfricaMoldovaMoroccoNepalNetherlandsNicaraguaNigeriaNorth AmericaNorth MacedoniaNorthern AfricaNorthern EuropeNorwayOceaniaPakistanPanamaPeruPhilippinesPolandPortugalRomaniaRussiaSaudi ArabiaScotlandSenegalSerbiaSierra LeoneSingaporeSomaliaSouth AfricaSouth AmericaSouth Central AsiaSouth Eastern AsiaSouthern EuropeSpainSri LankaSt. Vincent and the GrenadinesSudanSwedenSwitzerlandSyriaTaiwanThailandTrinidad and TobagoTurkeyUgandaUkraineUruguayUzbekistanVenezuelaVietnamWest IndiesWestern AfricaWestern AsiaWestern EuropeYemenZaireZimbabweAzores
Unemployment Among Women with Children Under 6 years
Income
Poverty
Unemployment
Labor Participation
Family Structure
Vehicle Availability
Education Level
Disability

Unemployment Among Women with Children Under 6 years Comparison

Tsimshian

Immigrants from Sierra Leone

Exceptional
Tragic
6.6%
UNEMPLOYMENT AMONG WOMEN WITH CHILDREN UNDER 6 YEARS
100.0/ 100
METRIC RATING
32nd/ 347
METRIC RANK
8.2%
UNEMPLOYMENT AMONG WOMEN WITH CHILDREN UNDER 6 YEARS
1.1/ 100
METRIC RATING
249th/ 347
METRIC RANK

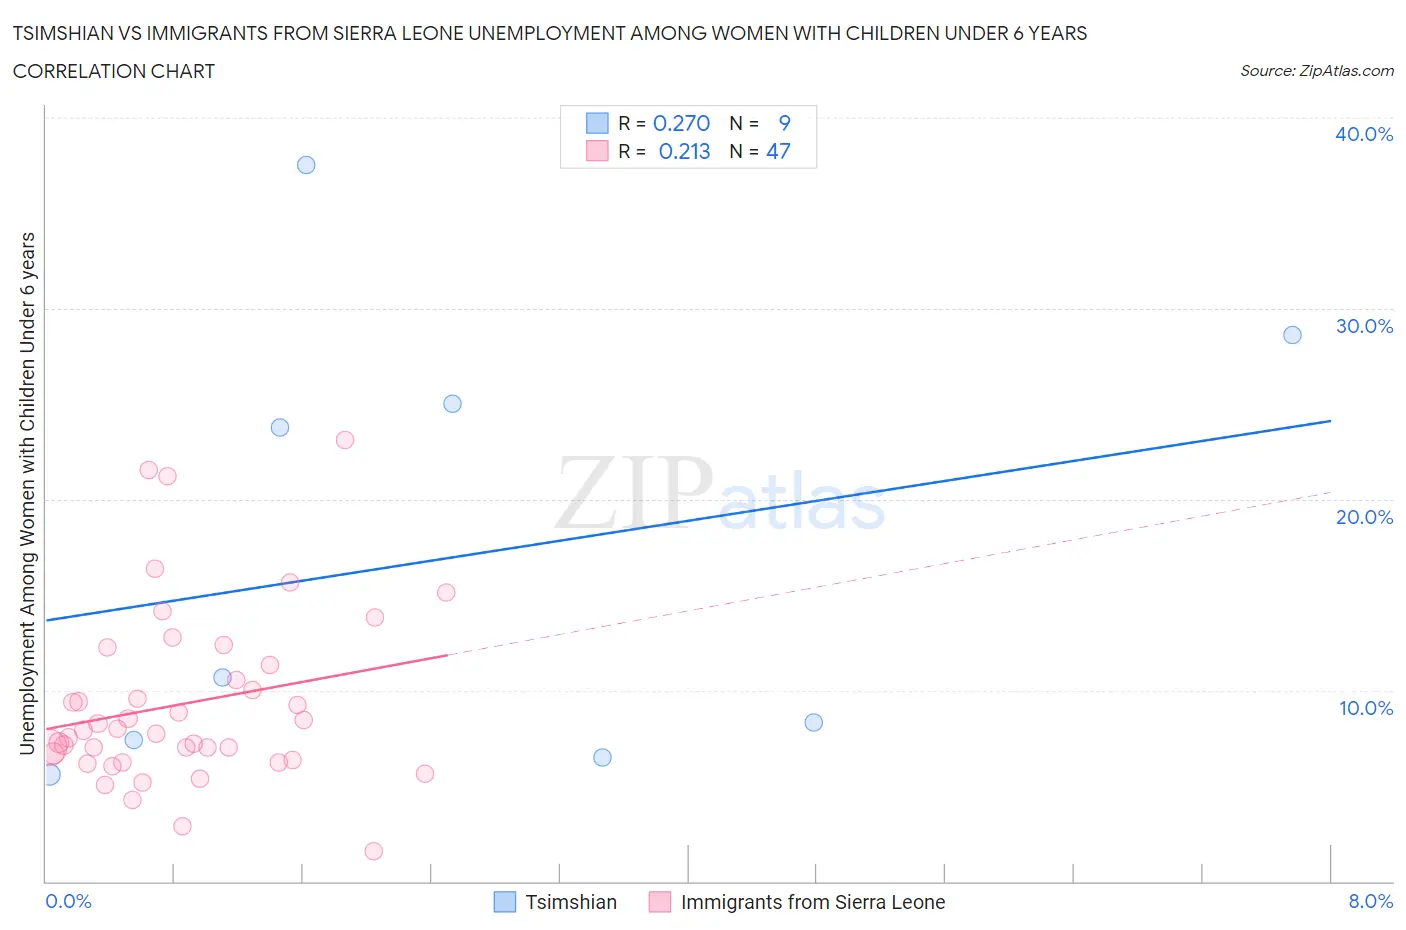
Tsimshian vs Immigrants from Sierra Leone Unemployment Among Women with Children Under 6 years Correlation Chart

The statistical analysis conducted on geographies consisting of 14,265,223 people shows a weak positive correlation between the proportion of Tsimshian and unemployment rate among women with children under the age of 6 in the United States with a correlation coefficient (R) of 0.270 and weighted average of 6.6%. Similarly, the statistical analysis conducted on geographies consisting of 92,718,305 people shows a weak positive correlation between the proportion of Immigrants from Sierra Leone and unemployment rate among women with children under the age of 6 in the United States with a correlation coefficient (R) of 0.213 and weighted average of 8.2%, a difference of 24.4%.
Tsimshian vs Immigrants from Sierra Leone Unemployment Among Women with Children Under 6 years

Unemployment Among Women with Children Under 6 years Correlation Summary

MeasurementTsimshianImmigrants from Sierra Leone
Minimum5.6%1.6%
Maximum37.5%23.1%
Range31.9%21.5%
Mean17.0%9.3%
Median10.7%7.9%
Interquartile 25% (IQ1)6.9%6.3%
Interquartile 75% (IQ3)26.8%11.3%
Interquartile Range (IQR)19.9%5.0%
Standard Deviation (Sample)11.8%4.6%
Standard Deviation (Population)11.1%4.6%

Similar Demographics by Unemployment Among Women with Children Under 6 years

Demographics Similar to Tsimshian by Unemployment Among Women with Children Under 6 years

In terms of unemployment among women with children under 6 years, the demographic groups most similar to Tsimshian are Immigrants from Vietnam (6.6%, a difference of 0.020%), Immigrants from South Central Asia (6.6%, a difference of 0.030%), Immigrants from Moldova (6.6%, a difference of 0.070%), Yakama (6.6%, a difference of 0.30%), and Immigrants from Belarus (6.6%, a difference of 0.36%).
DemographicsRating | RankUnemployment Among Women with Children Under 6 years
Soviet Union
100.0
/100
|
#25
Exceptional
6.5%
Cypriots
100.0
/100
|
#26
Exceptional
6.5%
Immigrants | Japan
100.0
/100
|
#27
Exceptional
6.5%
Immigrants | Israel
100.0
/100
|
#28
Exceptional
6.5%
Immigrants | Sweden
100.0
/100
|
#29
Exceptional
6.6%
Immigrants | Belarus
100.0
/100
|
#30
Exceptional
6.6%
Immigrants | Moldova
100.0
/100
|
#31
Exceptional
6.6%
Tsimshian
100.0
/100
|
#32
Exceptional
6.6%
Immigrants | Vietnam
100.0
/100
|
#33
Exceptional
6.6%
Immigrants | South Central Asia
100.0
/100
|
#34
Exceptional
6.6%
Yakama
100.0
/100
|
#35
Exceptional
6.6%
Luxembourgers
100.0
/100
|
#36
Exceptional
6.6%
Sri Lankans
100.0
/100
|
#37
Exceptional
6.6%
Hmong
100.0
/100
|
#38
Exceptional
6.7%
Immigrants | Russia
100.0
/100
|
#39
Exceptional
6.7%

Demographics Similar to Immigrants from Sierra Leone by Unemployment Among Women with Children Under 6 years

In terms of unemployment among women with children under 6 years, the demographic groups most similar to Immigrants from Sierra Leone are Nigerian (8.2%, a difference of 0.010%), Immigrants from Western Africa (8.2%, a difference of 0.090%), German Russian (8.2%, a difference of 0.13%), Guyanese (8.2%, a difference of 0.18%), and Ghanaian (8.2%, a difference of 0.18%).
DemographicsRating | RankUnemployment Among Women with Children Under 6 years
Dutch
2.5
/100
|
#242
Tragic
8.1%
Hawaiians
1.8
/100
|
#243
Tragic
8.2%
French
1.7
/100
|
#244
Tragic
8.2%
Native Hawaiians
1.7
/100
|
#245
Tragic
8.2%
Central Americans
1.4
/100
|
#246
Tragic
8.2%
German Russians
1.2
/100
|
#247
Tragic
8.2%
Immigrants | Western Africa
1.1
/100
|
#248
Tragic
8.2%
Immigrants | Sierra Leone
1.1
/100
|
#249
Tragic
8.2%
Nigerians
1.1
/100
|
#250
Tragic
8.2%
Guyanese
1.0
/100
|
#251
Tragic
8.2%
Ghanaians
1.0
/100
|
#252
Tragic
8.2%
Immigrants | Guyana
0.8
/100
|
#253
Tragic
8.2%
Immigrants | Caribbean
0.7
/100
|
#254
Tragic
8.3%
Immigrants | Portugal
0.6
/100
|
#255
Tragic
8.3%
Celtics
0.6
/100
|
#256
Tragic
8.3%