Tsimshian vs Immigrants from Pakistan Unemployment Among Ages 25 to 29 years

COMPARE

Tsimshian
Race
Ancestry
AfghanAfricanAlaska NativeAlaskan AthabascanAlbanianAleutAlsatianAmericanApacheArabArapahoArgentineanArmenianAssyrian/Chaldean/SyriacAustralianAustrianBahamianBangladeshiBarbadianBasqueBelgianBelizeanBermudanBhutaneseBlackfeetBolivianBrazilianBritishBritish West IndianBulgarianBurmeseCajunCambodianCanadianCape VerdeanCarpatho RusynCelticCentral AmericanCentral American IndianCherokeeCheyenneChickasawChileanChineseChippewaChoctawColombianColvilleComancheCosta RicanCreeCreekCroatianCrowCubanCypriotCzechCzechoslovakianDanishDelawareDominicanDutchDutch West IndianEastern EuropeanEcuadorianEgyptianEnglishEstonianEthiopianEuropeanFijianFilipinoFinnishFrenchFrench American IndianFrench CanadianGermanGerman RussianGhanaianGreekGuamanian/ChamorroGuatemalanGuyaneseHaitianHmongHonduranHopiHoumaHungarianIcelanderIndian (Asian)IndonesianInupiatIranianIraqiIrishIroquoisIsraeliItalianJamaicanJapaneseJordanianKenyanKiowaKoreanLaotianLatvianLebaneseLiberianLithuanianLumbeeLuxembourgerMacedonianMalaysianMalteseMarshalleseMenomineeMexicanMexican American IndianMongolianMoroccanNative HawaiianNavajoNepaleseNew ZealanderNicaraguanNigerianNorthern EuropeanNorwegianOkinawanOsageOttawaPaiutePakistaniPalestinianPanamanianParaguayanPennsylvania GermanPeruvianPimaPolishPortuguesePotawatomiPuebloPuerto RicanPuget Sound SalishRomanianRussianSalvadoranSamoanScandinavianScotch-IrishScottishSeminoleSenegaleseSerbianShoshoneSierra LeoneanSiouxSlavicSlovakSloveneSomaliSouth AfricanSouth AmericanSouth American IndianSoviet UnionSpaniardSpanishSpanish AmericanSpanish American IndianSri LankanSubsaharan AfricanSudaneseSwedishSwissSyrianTaiwaneseThaiTlingit-HaidaTohono O'OdhamTonganTrinidadian and TobagonianTsimshianTurkishU.S. Virgin IslanderUgandanUkrainianUruguayanUteVenezuelanVietnameseWelshWest IndianYakamaYaquiYugoslavianYumanYup'ikZimbabwean
Immigration
NonimmigrantsImmigrantsAfghanistanAfricaAlbaniaArgentinaArmeniaAsiaAustraliaAustriaBahamasBangladeshBarbadosBelarusBelgiumBelizeBoliviaBosnia and HerzegovinaBrazilBulgariaBurma/MyanmarCabo VerdeCambodiaCameroonCanadaCaribbeanCentral AmericaChileChinaColombiaCongoCosta RicaCroatiaCubaCzechoslovakiaDenmarkDominicaDominican RepublicEastern AfricaEastern AsiaEastern EuropeEcuadorEgyptEl SalvadorEnglandEritreaEthiopiaEuropeFijiFranceGermanyGhanaGreeceGrenadaGuatemalaGuyanaHaitiHondurasHong KongHungaryIndiaIndonesiaIranIraqIrelandIsraelItalyJamaicaJapanJordanKazakhstanKenyaKoreaKuwaitLaosLatin AmericaLatviaLebanonLiberiaLithuaniaMalaysiaMexicoMicronesiaMiddle AfricaMoldovaMoroccoNepalNetherlandsNicaraguaNigeriaNorth AmericaNorth MacedoniaNorthern AfricaNorthern EuropeNorwayOceaniaPanamaPeruPhilippinesPolandPortugalRomaniaRussiaSaudi ArabiaScotlandSenegalSerbiaSierra LeoneSingaporeSomaliaSouth AfricaSouth AmericaSouth Central AsiaSouth Eastern AsiaSouthern EuropeSpainSri LankaSt. Vincent and the GrenadinesSudanSwedenSwitzerlandSyriaTaiwanThailandTrinidad and TobagoTurkeyUgandaUkraineUruguayUzbekistanVenezuelaVietnamWest IndiesWestern AfricaWestern AsiaWestern EuropeYemenZaireZimbabweAzores
Immigrants from Pakistan
Race
Ancestry
AfghanAfricanAlaska NativeAlaskan AthabascanAlbanianAleutAlsatianAmericanApacheArabArapahoArgentineanArmenianAssyrian/Chaldean/SyriacAustralianAustrianBahamianBangladeshiBarbadianBasqueBelgianBelizeanBermudanBhutaneseBlackfeetBolivianBrazilianBritishBritish West IndianBulgarianBurmeseCajunCambodianCanadianCape VerdeanCarpatho RusynCelticCentral AmericanCentral American IndianCherokeeCheyenneChickasawChileanChineseChippewaChoctawColombianColvilleComancheCosta RicanCreeCreekCroatianCrowCubanCypriotCzechCzechoslovakianDanishDelawareDominicanDutchDutch West IndianEastern EuropeanEcuadorianEgyptianEnglishEstonianEthiopianEuropeanFijianFilipinoFinnishFrenchFrench American IndianFrench CanadianGermanGerman RussianGhanaianGreekGuamanian/ChamorroGuatemalanGuyaneseHaitianHmongHonduranHopiHoumaHungarianIcelanderIndian (Asian)IndonesianInupiatIranianIraqiIrishIroquoisIsraeliItalianJamaicanJapaneseJordanianKenyanKiowaKoreanLaotianLatvianLebaneseLiberianLithuanianLumbeeLuxembourgerMacedonianMalaysianMalteseMarshalleseMenomineeMexicanMexican American IndianMongolianMoroccanNative HawaiianNavajoNepaleseNew ZealanderNicaraguanNigerianNorthern EuropeanNorwegianOkinawanOsageOttawaPaiutePakistaniPalestinianPanamanianParaguayanPennsylvania GermanPeruvianPimaPolishPortuguesePotawatomiPuebloPuerto RicanPuget Sound SalishRomanianRussianSalvadoranSamoanScandinavianScotch-IrishScottishSeminoleSenegaleseSerbianShoshoneSierra LeoneanSiouxSlavicSlovakSloveneSomaliSouth AfricanSouth AmericanSouth American IndianSoviet UnionSpaniardSpanishSpanish AmericanSpanish American IndianSri LankanSubsaharan AfricanSudaneseSwedishSwissSyrianTaiwaneseThaiTlingit-HaidaTohono O'OdhamTonganTrinidadian and TobagonianTurkishU.S. Virgin IslanderUgandanUkrainianUruguayanUteVenezuelanVietnameseWelshWest IndianYakamaYaquiYugoslavianYumanYup'ikZimbabwean
Immigration
NonimmigrantsImmigrantsAfghanistanAfricaAlbaniaArgentinaArmeniaAsiaAustraliaAustriaBahamasBangladeshBarbadosBelarusBelgiumBelizeBoliviaBosnia and HerzegovinaBrazilBulgariaBurma/MyanmarCabo VerdeCambodiaCameroonCanadaCaribbeanCentral AmericaChileChinaColombiaCongoCosta RicaCroatiaCubaCzechoslovakiaDenmarkDominicaDominican RepublicEastern AfricaEastern AsiaEastern EuropeEcuadorEgyptEl SalvadorEnglandEritreaEthiopiaEuropeFijiFranceGermanyGhanaGreeceGrenadaGuatemalaGuyanaHaitiHondurasHong KongHungaryIndiaIndonesiaIranIraqIrelandIsraelItalyJamaicaJapanJordanKazakhstanKenyaKoreaKuwaitLaosLatin AmericaLatviaLebanonLiberiaLithuaniaMalaysiaMexicoMicronesiaMiddle AfricaMoldovaMoroccoNepalNetherlandsNicaraguaNigeriaNorth AmericaNorth MacedoniaNorthern AfricaNorthern EuropeNorwayOceaniaPakistanPanamaPeruPhilippinesPolandPortugalRomaniaRussiaSaudi ArabiaScotlandSenegalSerbiaSierra LeoneSingaporeSomaliaSouth AfricaSouth AmericaSouth Central AsiaSouth Eastern AsiaSouthern EuropeSpainSri LankaSt. Vincent and the GrenadinesSudanSwedenSwitzerlandSyriaTaiwanThailandTrinidad and TobagoTurkeyUgandaUkraineUruguayUzbekistanVenezuelaVietnamWest IndiesWestern AfricaWestern AsiaWestern EuropeYemenZaireZimbabweAzores
Unemployment Among Ages 25 to 29 years
Income
Poverty
Unemployment
Labor Participation
Family Structure
Vehicle Availability
Education Level
Disability

Unemployment Among Ages 25 to 29 years Comparison

Tsimshian

Immigrants from Pakistan

Tragic
Good
8.0%
UNEMPLOYMENT AMONG AGES 25 TO 29 YEARS
0.0/ 100
METRIC RATING
305th/ 347
METRIC RANK
6.5%
UNEMPLOYMENT AMONG AGES 25 TO 29 YEARS
73.8/ 100
METRIC RATING
140th/ 347
METRIC RANK

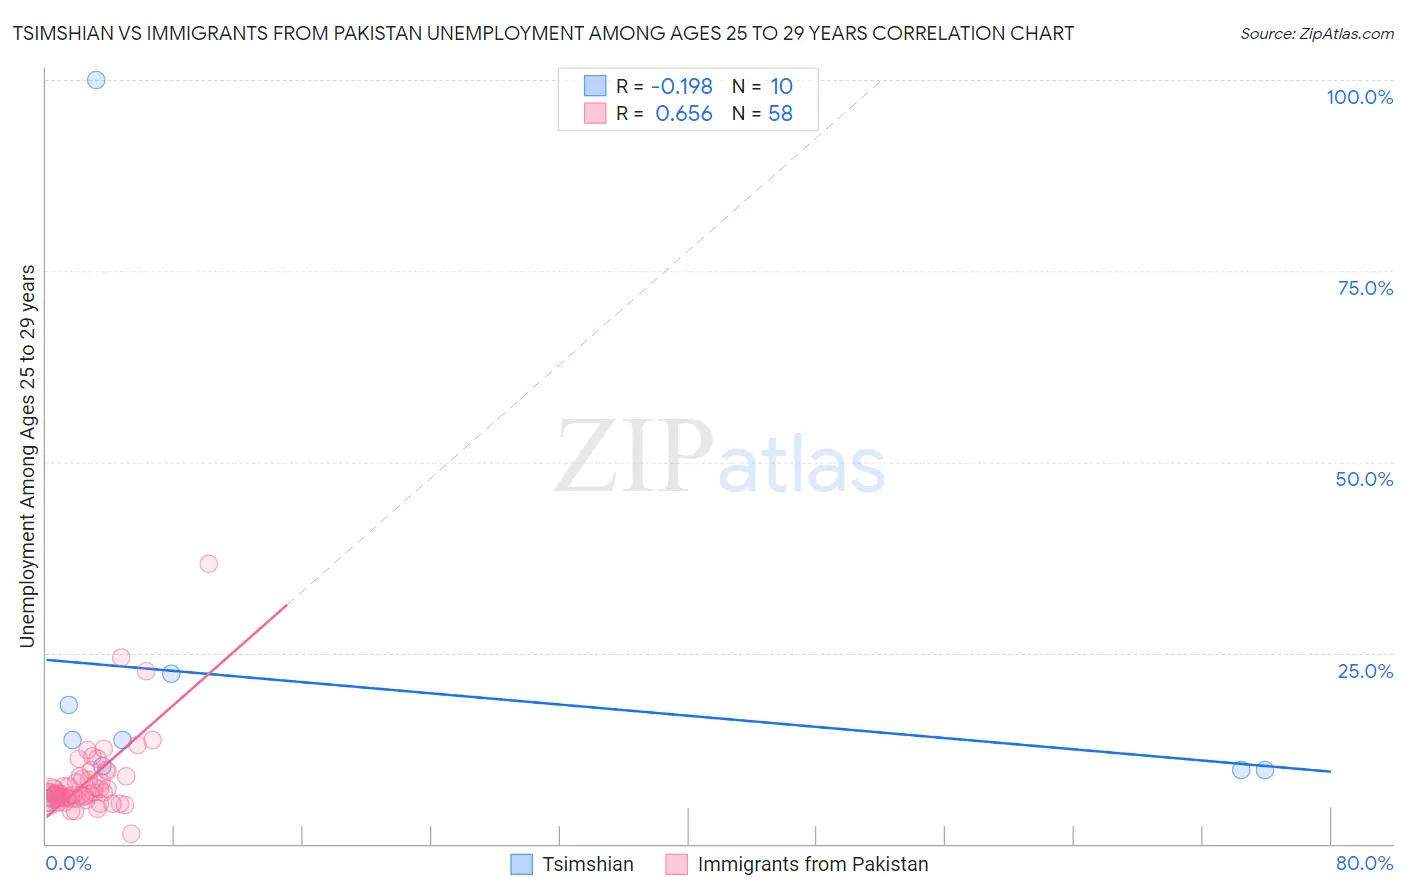
Tsimshian vs Immigrants from Pakistan Unemployment Among Ages 25 to 29 years Correlation Chart

The statistical analysis conducted on geographies consisting of 15,388,943 people shows a poor negative correlation between the proportion of Tsimshian and unemployment rate among population between the ages 25 and 29 in the United States with a correlation coefficient (R) of -0.198 and weighted average of 8.0%. Similarly, the statistical analysis conducted on geographies consisting of 276,394,547 people shows a significant positive correlation between the proportion of Immigrants from Pakistan and unemployment rate among population between the ages 25 and 29 in the United States with a correlation coefficient (R) of 0.656 and weighted average of 6.5%, a difference of 22.7%.
Tsimshian vs Immigrants from Pakistan Unemployment Among Ages 25 to 29 years

Unemployment Among Ages 25 to 29 years Correlation Summary

MeasurementTsimshianImmigrants from Pakistan
Minimum5.7%1.3%
Maximum100.0%36.7%
Range94.3%35.4%
Mean20.9%8.3%
Median11.9%6.5%
Interquartile 25% (IQ1)9.6%6.0%
Interquartile 75% (IQ3)18.2%8.8%
Interquartile Range (IQR)8.6%2.8%
Standard Deviation (Sample)28.3%5.4%
Standard Deviation (Population)26.8%5.3%

Similar Demographics by Unemployment Among Ages 25 to 29 years

Demographics Similar to Tsimshian by Unemployment Among Ages 25 to 29 years

In terms of unemployment among ages 25 to 29 years, the demographic groups most similar to Tsimshian are Haitian (8.0%, a difference of 0.080%), Immigrants from Barbados (8.0%, a difference of 0.24%), Cajun (8.0%, a difference of 0.26%), Immigrants from Yemen (8.0%, a difference of 0.48%), and Immigrants from Jamaica (8.1%, a difference of 0.66%).
DemographicsRating | RankUnemployment Among Ages 25 to 29 years
Immigrants | Trinidad and Tobago
0.0
/100
|
#298
Tragic
7.9%
Barbadians
0.0
/100
|
#299
Tragic
7.9%
Central American Indians
0.0
/100
|
#300
Tragic
7.9%
West Indians
0.0
/100
|
#301
Tragic
7.9%
Jamaicans
0.0
/100
|
#302
Tragic
7.9%
Immigrants | Yemen
0.0
/100
|
#303
Tragic
8.0%
Cajuns
0.0
/100
|
#304
Tragic
8.0%
Tsimshian
0.0
/100
|
#305
Tragic
8.0%
Haitians
0.0
/100
|
#306
Tragic
8.0%
Immigrants | Barbados
0.0
/100
|
#307
Tragic
8.0%
Immigrants | Jamaica
0.0
/100
|
#308
Tragic
8.1%
Immigrants | Haiti
0.0
/100
|
#309
Tragic
8.1%
U.S. Virgin Islanders
0.0
/100
|
#310
Tragic
8.1%
Immigrants | Azores
0.0
/100
|
#311
Tragic
8.1%
Dutch West Indians
0.0
/100
|
#312
Tragic
8.2%

Demographics Similar to Immigrants from Pakistan by Unemployment Among Ages 25 to 29 years

In terms of unemployment among ages 25 to 29 years, the demographic groups most similar to Immigrants from Pakistan are Immigrants from Belgium (6.5%, a difference of 0.0%), Austrian (6.5%, a difference of 0.0%), Eastern European (6.5%, a difference of 0.020%), Maltese (6.5%, a difference of 0.070%), and Slavic (6.5%, a difference of 0.10%).
DemographicsRating | RankUnemployment Among Ages 25 to 29 years
Immigrants | Europe
75.7
/100
|
#133
Good
6.5%
Immigrants | Vietnam
75.6
/100
|
#134
Good
6.5%
Immigrants | Croatia
75.5
/100
|
#135
Good
6.5%
Northern Europeans
75.4
/100
|
#136
Good
6.5%
Eastern Europeans
74.1
/100
|
#137
Good
6.5%
Immigrants | Belgium
73.8
/100
|
#138
Good
6.5%
Austrians
73.8
/100
|
#139
Good
6.5%
Immigrants | Pakistan
73.8
/100
|
#140
Good
6.5%
Maltese
72.9
/100
|
#141
Good
6.5%
Slavs
72.5
/100
|
#142
Good
6.5%
Lithuanians
72.2
/100
|
#143
Good
6.5%
Immigrants | Micronesia
71.5
/100
|
#144
Good
6.6%
Nicaraguans
70.2
/100
|
#145
Good
6.6%
Romanians
69.5
/100
|
#146
Good
6.6%
Immigrants | Thailand
68.4
/100
|
#147
Good
6.6%